Article

Time-Varying Pilot’s Intention Identification Based on ESAX-CSA-ELM Classification Method in Complex Environment

1
College of General Aviation and Flight, Nanjing University of Aeronautics and Astronautics, Nanjing 211106, China
2
School of Civil Aviation, Nanjing University of Aeronautics and Astronautics, Nanjing 211106, China
3
School of Automobile, Chang’an University, Xi’an 710064, China
4
Key Laboratory of Automotive Transportation Safety Technology, Xi’an 710064, China
*
Author to whom correspondence should be addressed.
Appl. Sci. 2022, 12(10), 4858; https://doi.org/10.3390/app12104858
Submission received: 6 April 2022 / Revised: 5 May 2022 / Accepted: 7 May 2022 / Published: 11 May 2022
(This article belongs to the Special Issue Analysis, Optimization, and Control of Air Traffic System)

Abstract

:
Dynamic and accurate identification of pilot intention is an important prerequisite for more accurate identification of control behavior, automatic flight early warning, and human–aircraft shared autonomy. Meanwhile, it is also the basic requirement of microscopic research on flight safety. In response to these demands, the airfield traffic pattern flight simulation experiment was carried out to obtain the pilot’s physiological data, such as electrocardiogram, respiration, and skin electricity, under different intentions. The extended symbol aggregation approximation theory (ESAX) and the intelligent icon method were utilized to analyze and extract the characteristics of the pilot’s intention. Furthermore, combined with the crow search algorithm (CSA) and extreme learning machine (ELM), a CSA-ELM pilot intention identification model was constructed and it is applied to climb, descend, level flight, and other situations in airfield traffic pattern missions to effectively identify whether the pilot has an intention. The rationality and validity of the identification model were verified through experiments with interactive computer simulations. In addition, compared with the traditional machine learning method, the accuracy of the identification method proposed in this paper is improved by about 10%. The above shows that the research results in this paper can provide support for improving the flight safety early-warning system and the pilot’s micro-behavior evaluation system.

1. Introduction

With the rapid development of global civil air-transport enterprises and the growing popularization of general aviation, the overall air-transport accident rate has shown a decreasing trend and stabilized gradually. However, aviation accidents continue to occur with the increase of flight sorties [1]. Therefore, controlling a pilot’s behavior is an important means to improve aviation safety [2,3]. The pilots’ intentions determine their behavior at the next moment [4]. The intention is the reflection of the human brain on the objective material world (it is also a kind of thinking activity produced in the human brain). It is the result of the pilot’s perception, judgment, and decision-making based on external information (containing environment, aircraft, and other state information) [5,6]. If a person’s behavior is predicted, intention is often a more accurate measure [7]. The intention is also a psychological variable closest to people’s actual behavior in the future [8]. Therefore, the pilot’s intention is accurately identified, which is of great significance for improving the early-warning system of flight safety, realizing the intelligent control of the aircraft cockpit, improving the control behavior of pilots, and maintaining flight safety.
With the rapid development of artificial intelligence and computer technology, scholars have been paying more and more attention to the study of a pilot’s intention. Some scholars have studied the psychological variables that may affect pilots’ intentions, such as workload, personality, age, emotion, etc. [9,10,11,12]. These psychological variables can directly or indirectly affect the cognitive process, which in turn affects the generation of pilot intentions. These studies are mainly based on subjective evaluation methods, such as questionnaires to study the cognitive processes of pilots. Some scholars have explored a pilot’s intention identification using different types of physiological data [13,14]. Then, they use pattern recognition algorithms to classify abstract objects, such as physiology, into categories that describe specific behaviors or intentions [13,14]. The internal micro mechanism and the generation mechanism of a pilot’s intention have been explored respectively, which is an effective means to improve the accuracy of a pilot’s intention identification and flight safety. Degani A. [15,16] and Oishi M. [17,18] established a discrete pilot decision identification model to solve the problem of mode confusion between the pilot and automation system, based on discrete flight mode information in the process of modeling and analysis. They did not consider the continuous state of a pilot’s decision process. Das S. [19] and Bass E. [20] only modeled a series of discrete and continuous aircraft automation modes; they did not model and analyze the pilot’s micro-cognitive process in the modeling process. Wanyan Xiaoru et al. [21] have studied the relationship between a pilot’s psychological load and a pilot’s cognitive ability. The achievement of this research is based on the pilot’s electrooculogram and other data obtained by the pilots operating simulator. Earlier studies were purely based on data-driven methods such as “cluster anomaly detection” and “multi-core anomaly detection” to study a pilot’s intention in pattern confusion. Moreover, these studies were modeling and analyzing pilots’ intentions without fully considering the multidimensional information of pilots, aircraft, and the operating environment. In response to the above problems, Fu Shan et al. [22] studied the microscopic behavior of pilots from the aspects of physiology, psychology, and the behavior of pilots. Cai Zhengxiang et al. [23] studied pilots’ cognitive intentions based on physiological signals. In Cai’s research, the pilot’s physiological signals, such as heart rate and respiration, are collected when the left engine fails during the aircraft’s climb. Zhang Xia et al. [24] analyzed the mapping relationship between the physiological data (including ECG, respiration, etc.) and pilot control intentions to realize the research on the cognitive state changes of pilots. Xu Shuting et al. [25,26] established an intelligent human pilot model to describe the nonlinear PIO prediction process and identify pilot behavior based on the pilot’s visual perception, intelligent decision-making, and force feedback from control receivers to address issues such as the unfavorable interaction of pilot–aircraft systems including pilot-induced oscillations (PIO). Nandiganahalli J.S. et al. [27] proposed a pattern confusion detection framework based on the pilot’s intention for UI (user interface) verification. What is more, the automatic system control strategy is abstracted into a continuous intention state. This provides a theoretical basis for the research of pilots’ decision-making and the control strategies of automation systems.
The essence of intention identification is the problem of pattern recognition. The intention is mainly to use abstract objects (e.g., physiological signals) for the description of specific microscopic behaviors. From the perspective of engineering physiology, scholars have conducted extensive and in-depth research on the pilot’s intentions. In these studies, data preprocessing, feature extraction, and pattern recognition methods are adopted to identify the pilot’s intentions. They have also generated considerable research results. The importance of intention in the study of a pilot’s micro behavior is proved by these research results from different levels. In other words, the intention has a significant impact on flight safety. Feature extraction is generally regarded as an important process in pattern recognition because a fine feature space could make the identification process concise and efficient and the accuracy of the identification results could be improved. What’s more, due to the diversity of intentions in nonstationary systems under the interaction of human–aircraft–environment. However, in previous studies, feature extraction is mainly through Shannon entropy, statistical methods such as average error, variance, time domain, and frequency domain [17,18,19,20]. These methods ignore the time-varying evolving nature of intentions. At the same time, these also limit the process of automatic training and the analysis of the identification model. In addition to feature extraction, the establishment of an identification model is also an important stage. Methods proposed by scholars for intention identification mainly include artificial neural networks, support vector machines, Gaussian distribution, and other methods [18,19,20,21,22,23]. These methods lay the foundation for intention identification and have made great achievements. However, they still have certain problems. For example, under a large number of samples, most of these methods will have problems, such as slow training speed, uncertain model parameters, and difficulty in optimization. In this paper, outcomes of the above-mentioned feature extraction and identification methods are referenced and make up for their shortcomings. In this study, the airfield traffic pattern is taken as an example. The pilot’s dynamic physiological data, such as electrocardiogram (ECG), respiration (RESP), and electrodermal activity (EDA), are collected by the wireless physiological acquisition system in simulated flight. Here, the extended symbol aggregation approximation method and the intelligent icon method are adopted to extract and analyze the complex physiological signal features. These features provide sufficient information for further identification. Then, based on the pilot intention characteristic variables, the crow search algorithm (CSA) is adopted to optimize the parameters of the extreme learning machine (ELM). The pilot’s intention identification model based on CSA-ELM is constructed. Finally, research on the accurate identification method of pilot intention generation under different flight states is realized in this paper. The results of this study provide a good foundation for further research on the evolution mechanism of a pilot’s intentions. At the same time, it provides a basis for further study for the micro-behavior assessment of pilots and the active safety warning of flights.
The rest of this paper is organized as follows. The research methods are introduced in Section 3. The results will be analyzed in Section 4. The discussion is described in Section 5. Section 6 is a conclusion.

2. Materials

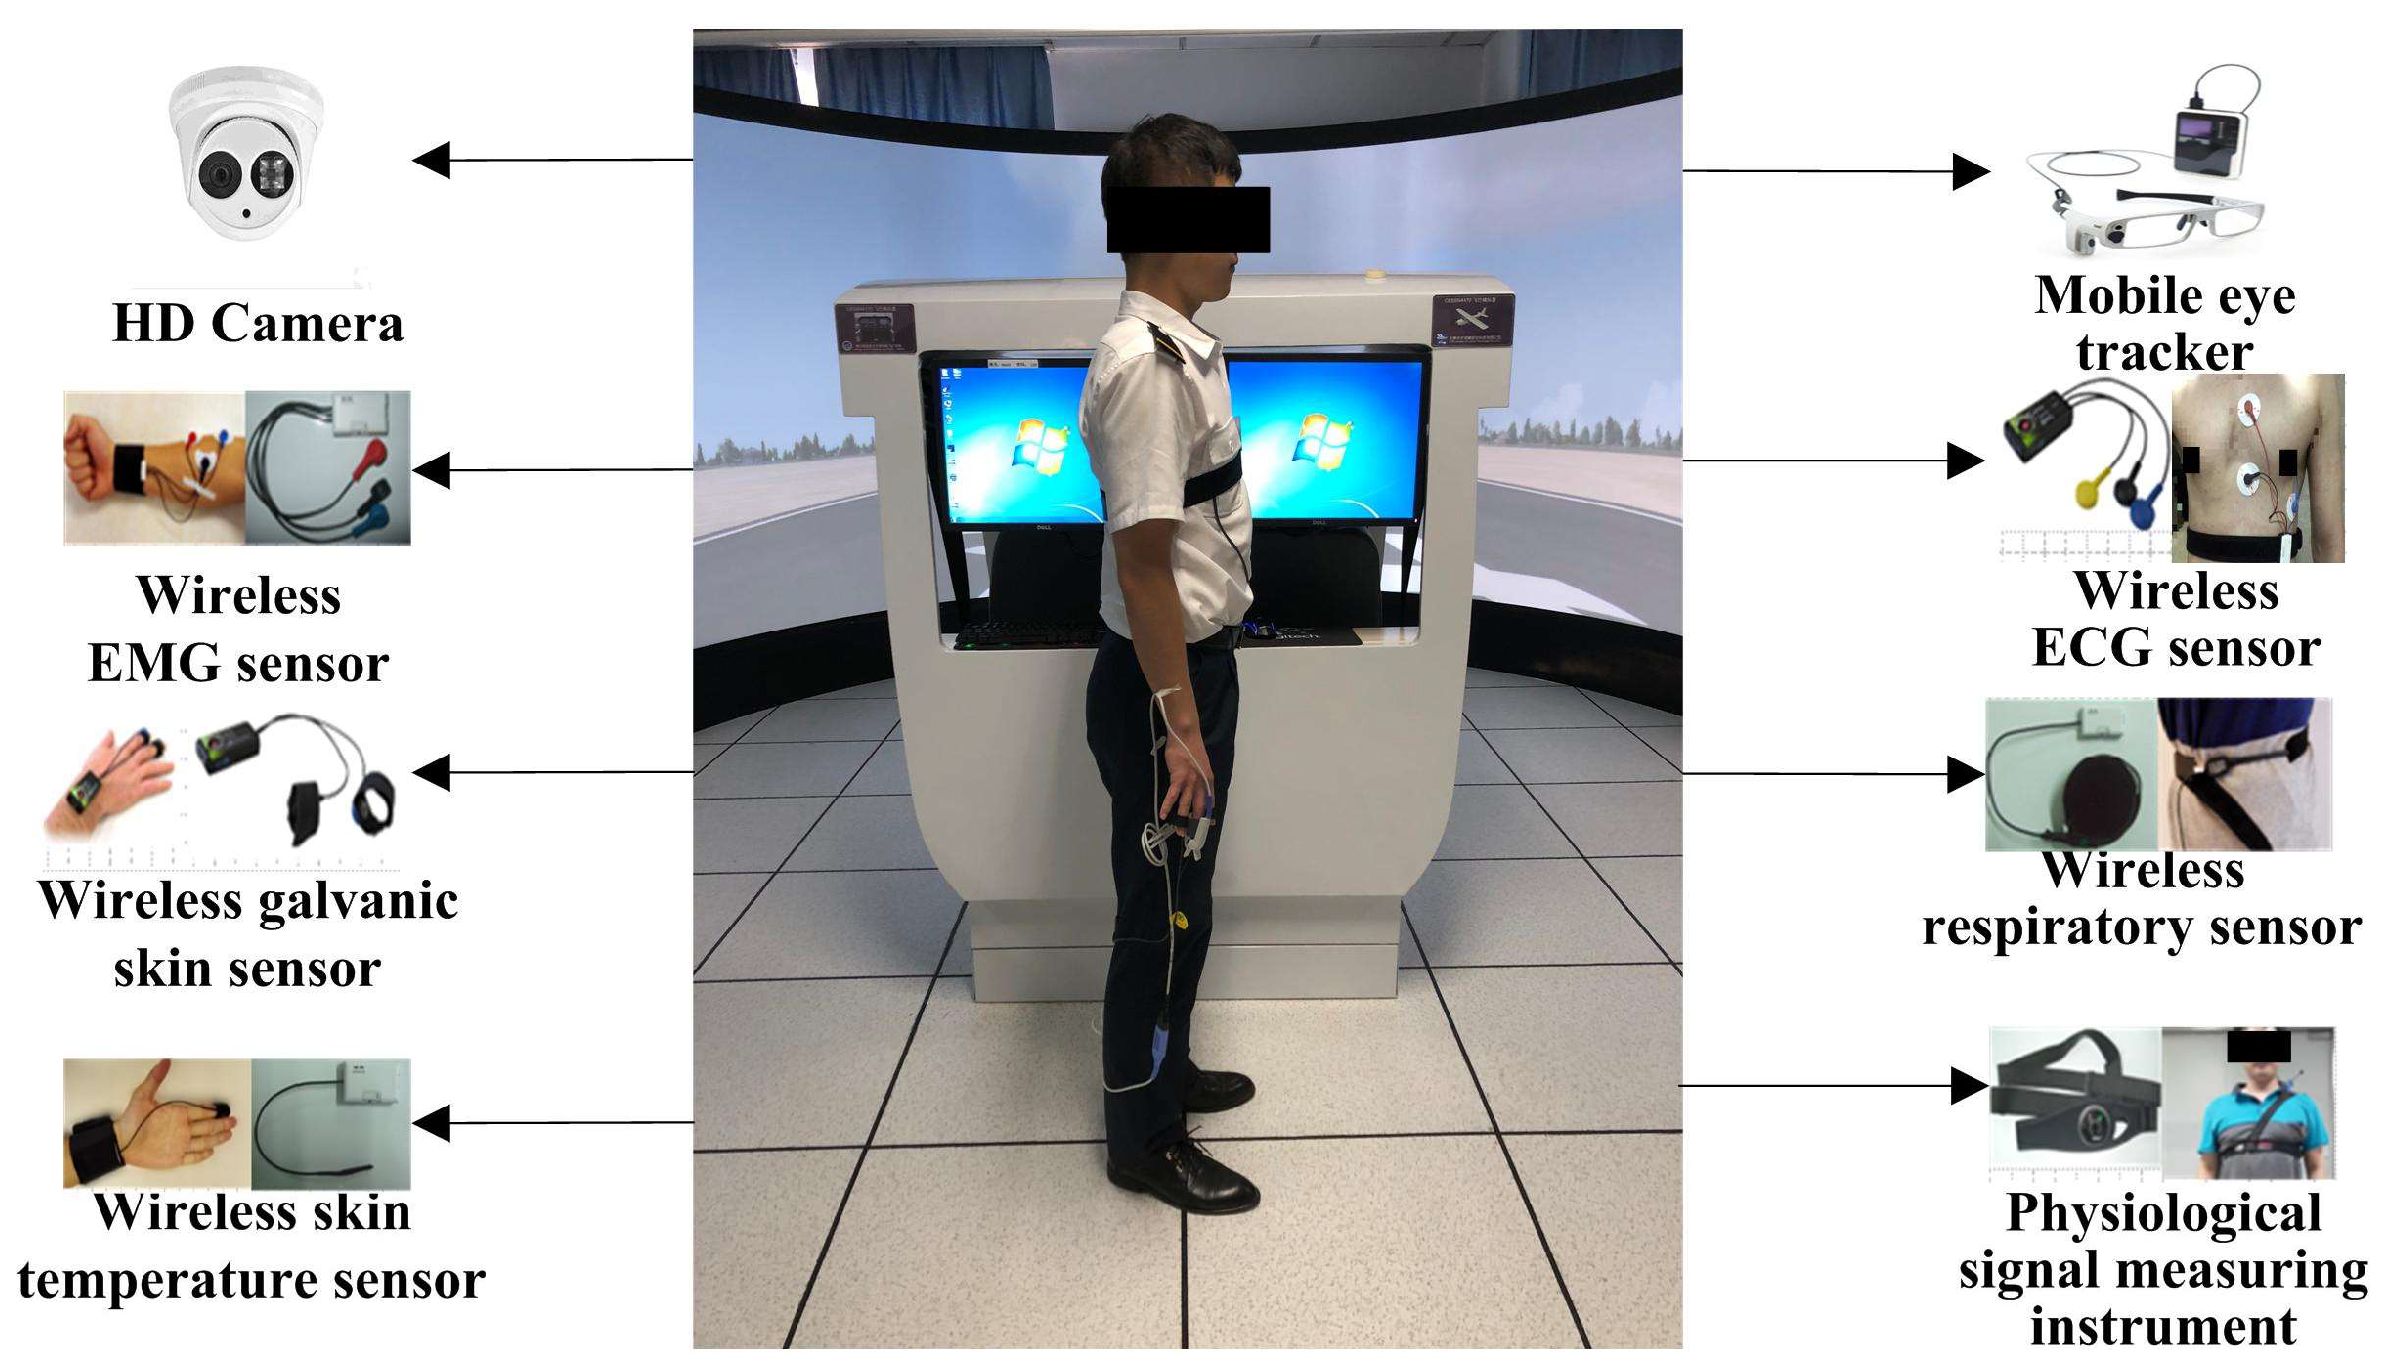
2.1. Experimental Design

In the process of pilots’ controlling an aircraft, their brains will be occupied by the generation, growth, transfer, and reduction of intention. Flight simulation scenarios need to include common scenarios such as acceleration, deceleration, climb, change of course, etc., which can be used to monitor and identify the occurrence of a pilot’s behavior (including throttle control, joystick control, rudder pedal, etc.) in these scenarios.
Classic airfield traffic pattern tasks are selected as flight simulation scenes that stimulate intention. Such scenes include the departure leg, crosswind leg, downwind leg, base leg, and final leg (as shown in Figure 1). The entire airfield traffic pattern lasts about 7 min. Each participant completed five airfield traffic patterns. Nanjing Lukou Airport, which is clear and windless, is selected during the whole simulated flight.

2.2. Experimental Design

For the reason of obtaining the pilot’s physiological characteristics during the simulated flight, experiments were carried out on the human–aircraft–environment integrated information acquisition experimental platform. The experimental platform uses a 1:1 scale Cessna 172 simulator, with a high-fidelity virtual flight environment and a good sense of immersion. The pilot completed the airfield traffic pattern mission in terms of the instruction in the simulation flight process of the experimental platform. During this period, ErgoLAB physiological signal acquisition equipment was used to collect the pilot’s physiological signals. The physiological acquisition device used in this experiment is a wearable wireless device. It has the advantages of being noninvasive and harmless. There is no danger in this experiment. It will not cause harm to the pilot. In addition, the experimental platform also includes a laptop, HD cameras, etc. This platform for comprehensive human–aircraft–environment information acquisition is depicted in Figure 2.

2.3. Experimental Participants

The sample size of the experiment was 75 male pilots who had obtained a private personal pilot license, commercial pilot license, and instrument rating license. Their ages ranged from 25 to 30 and the mean value is 27. They had 250–300 h of flight experience and the average flight time is 275 h.
The experimental process is strictly in accordance with the Helsinki Declaration. All experimental personnel received a complete explanation of the experimental procedures and equipment and signed a written informed consent form to participate in the experiment.

2.4. Experimental Data

In this paper, the Cessna 172 standard operating procedure (SOP) was referred to when organizing pilots to conduct the simulation flight for the airfield traffic patterns. The simulation experiment was developed on the basis of the airfield traffic pattern procedure. Steps not closely related to flight operations are omitted and a simplified version is formed, as depicted in Table 1.
According to the simulated flight scene, the pilots’ physiological data (including ECG, skin resistance, breathing frequency, etc.) that characterize their flight intentions during the airfield traffic pattern were measured. The sampling rates of electrocardiogram, respiration, and electrodermal activity are 512 Hz, 64 Hz, and 64 Hz, respectively. Because this experiment lasts a long time, it was divided into two periods to avoid the effect caused by the difference in experiment time, with the similar physiological cycle of the human body, namely, 9:00–12:00 and 14:00–17:00. The whole process was supposed to remain quiet.

3. Methods

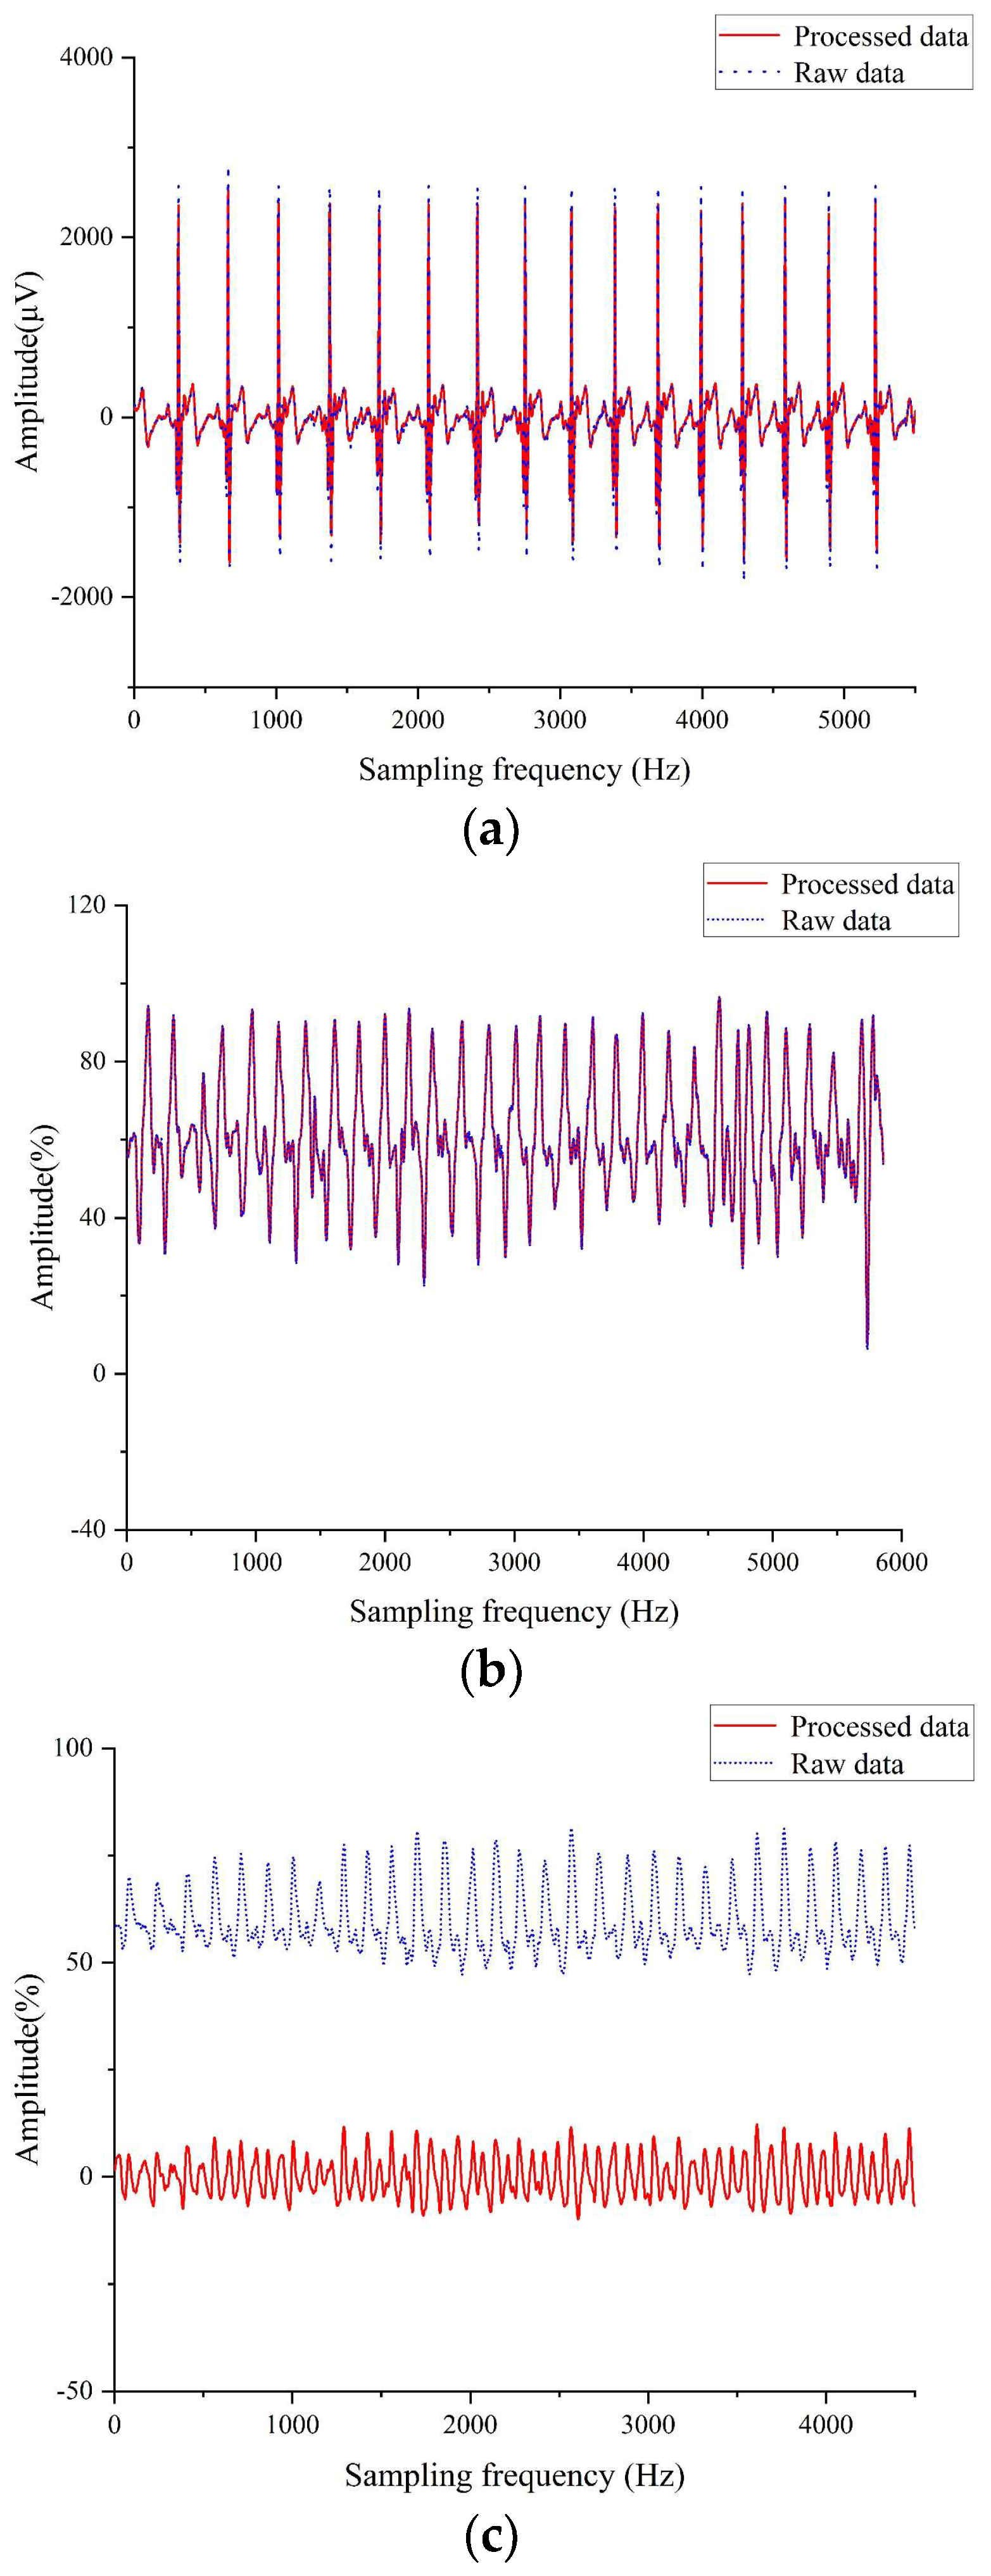
3.1. Data Processing

In this paper, high-pass and low-pass filters are adopted to filter the ECG, EDA, and RESP signals, respectively [23], as shown in Table 2. The result of each physiological signal after filtering is displayed in Figure 3.

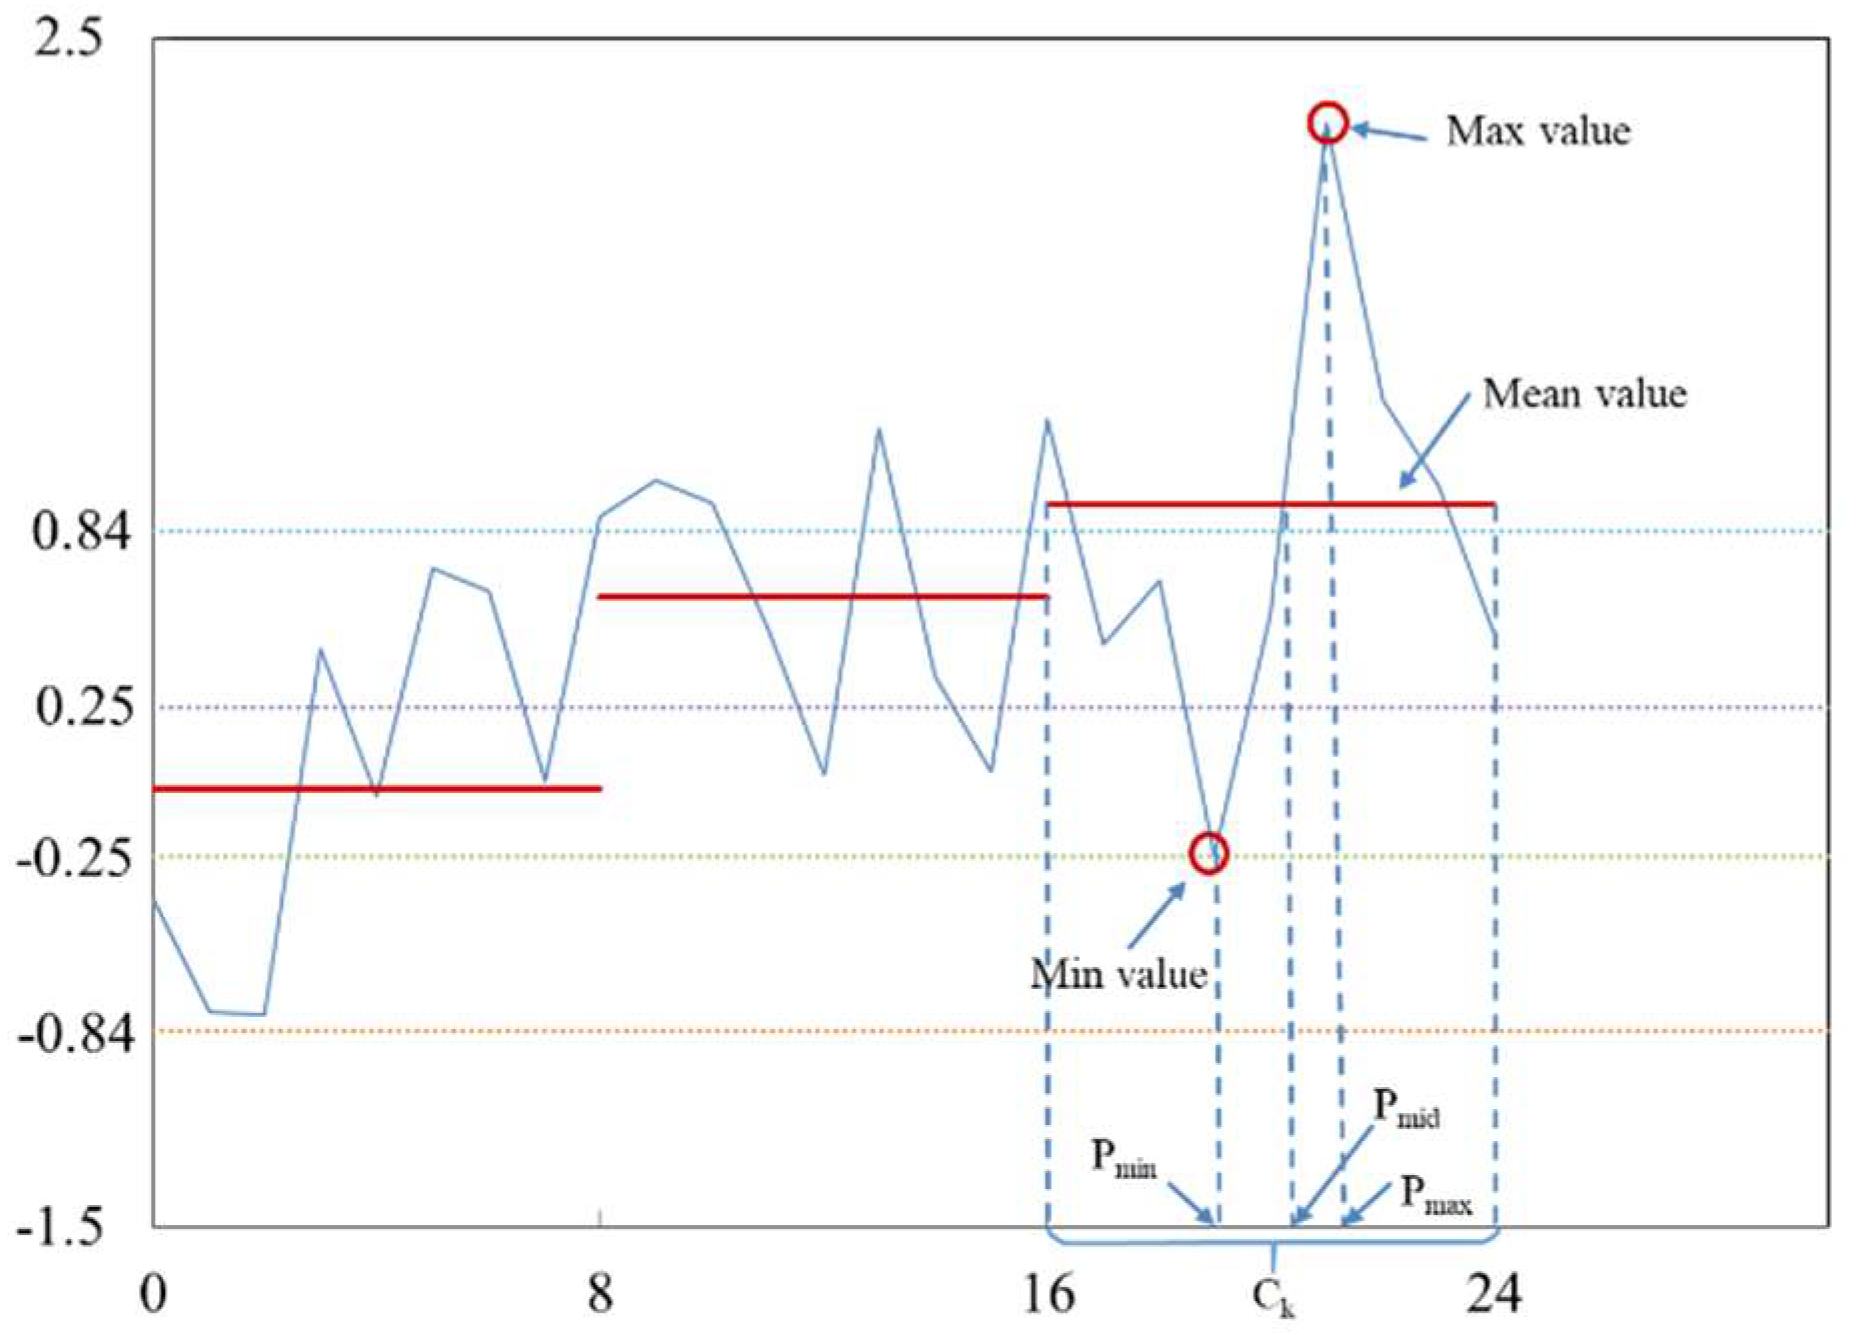
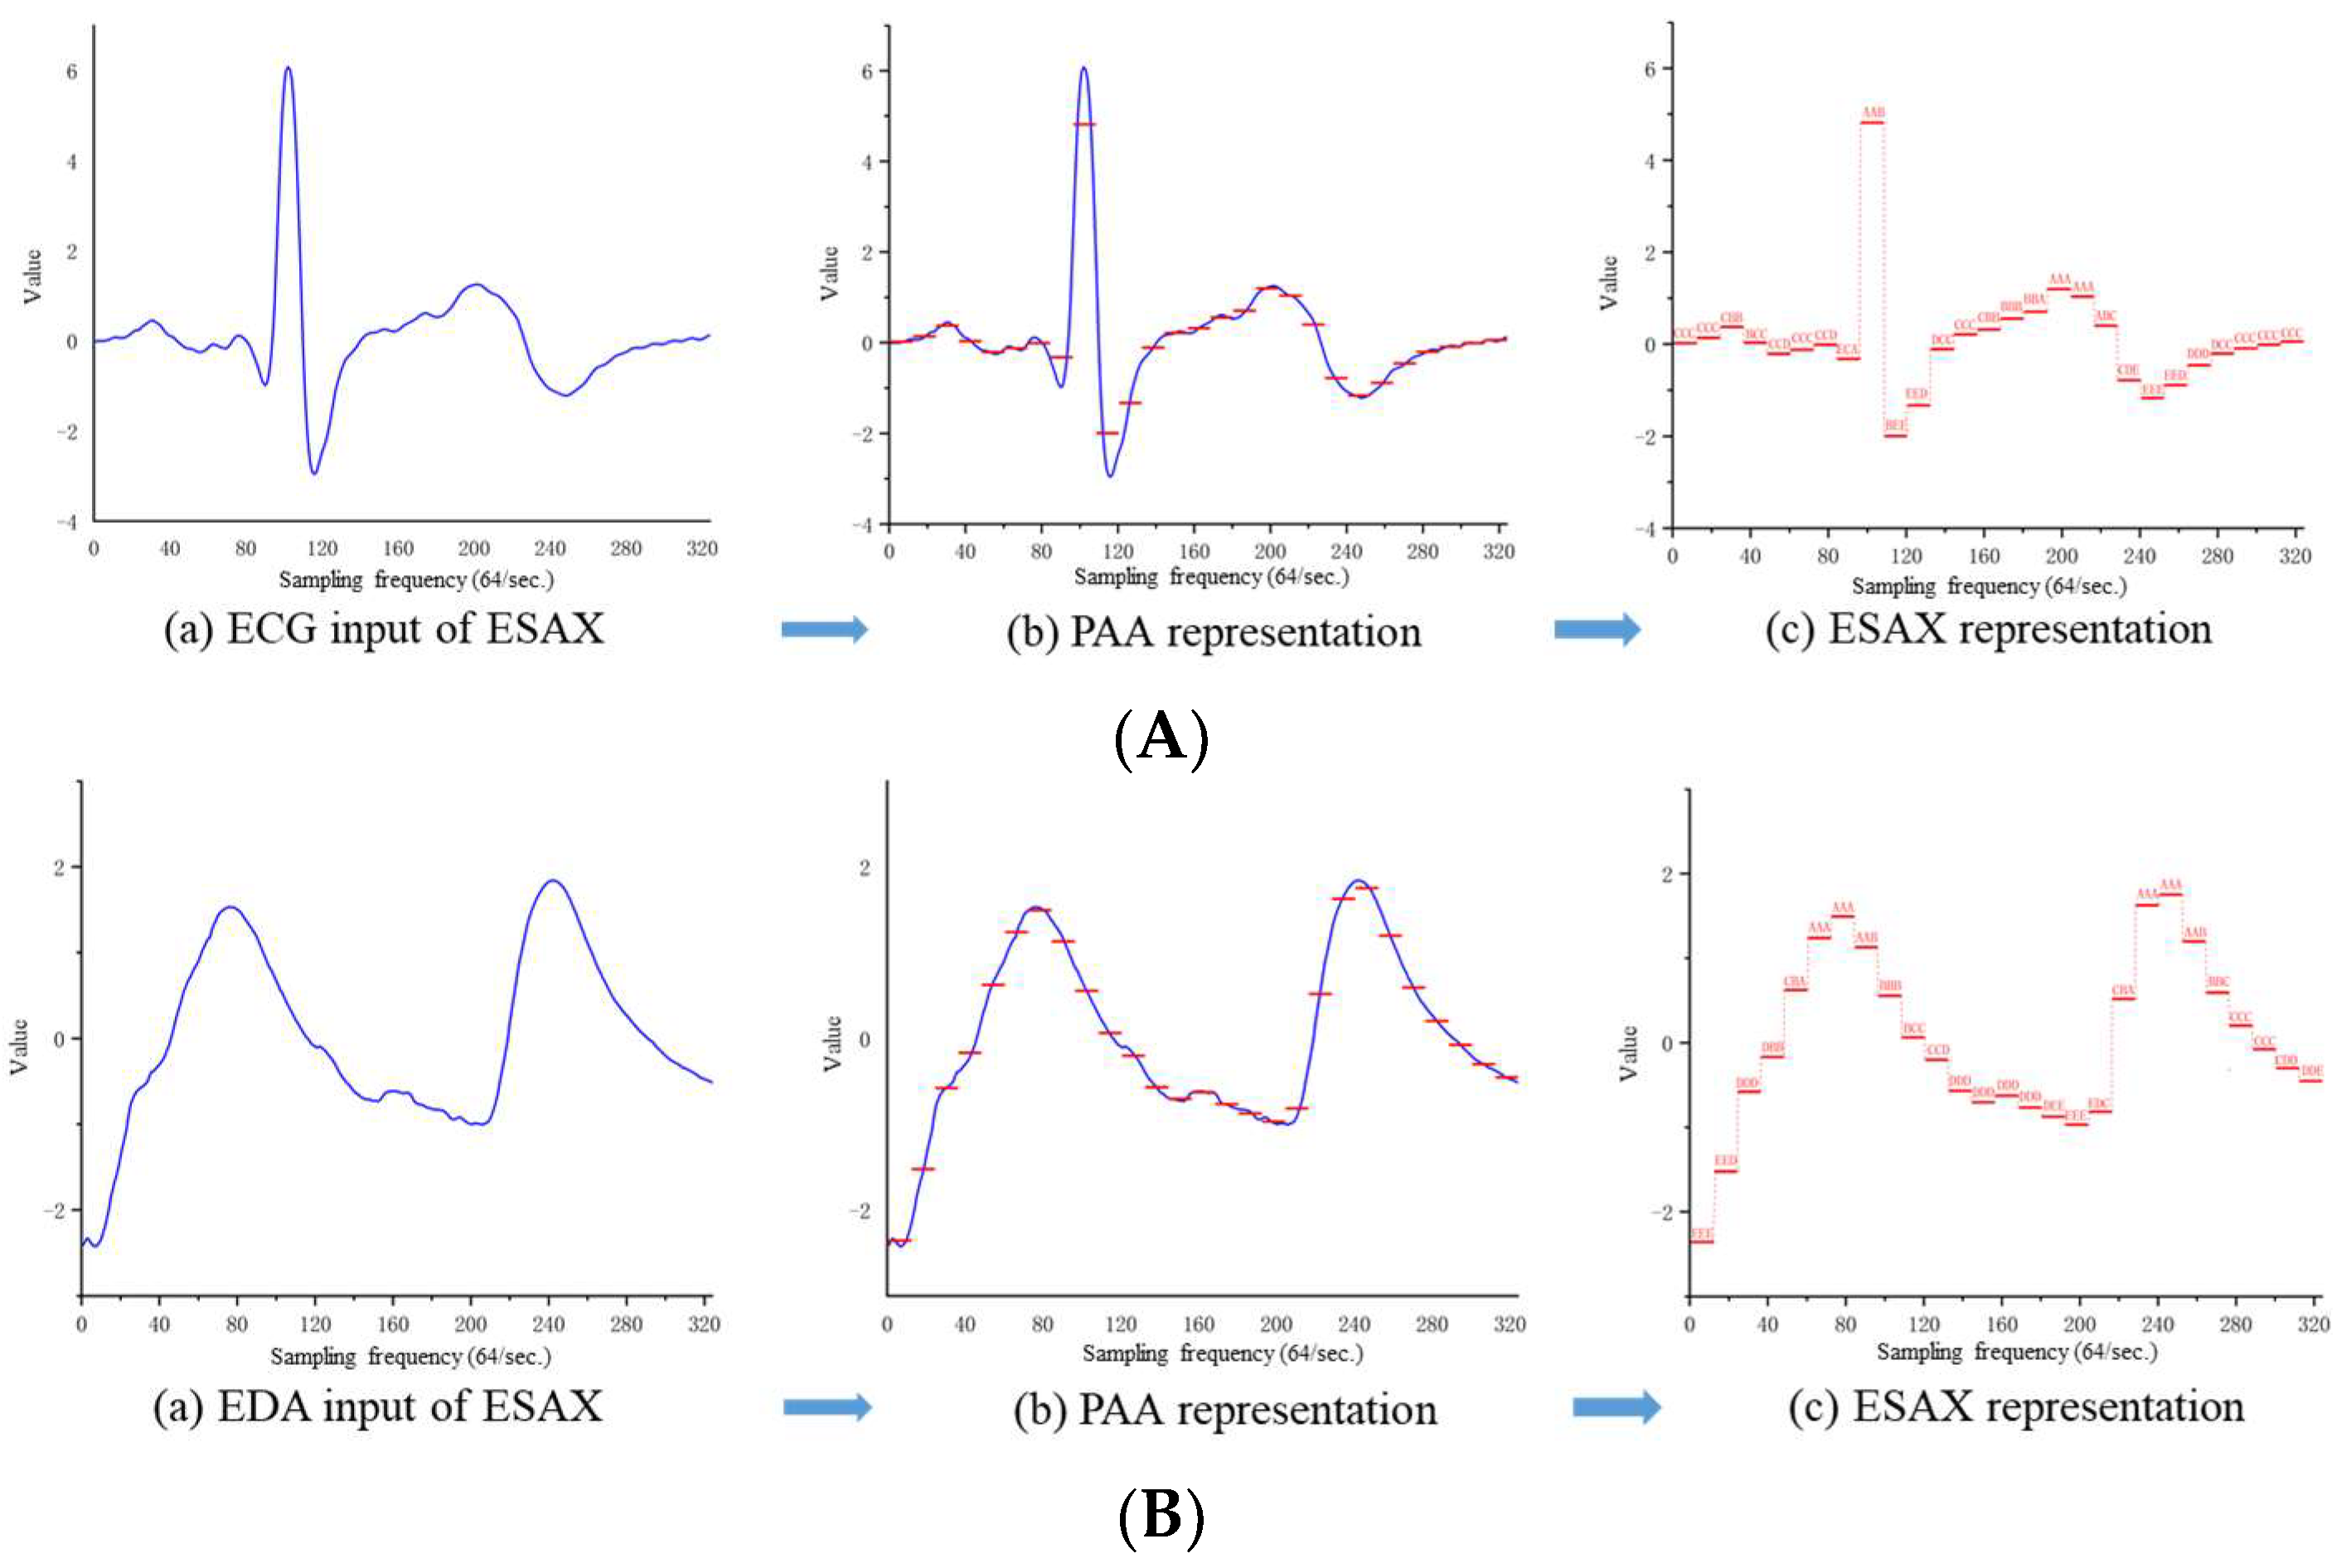
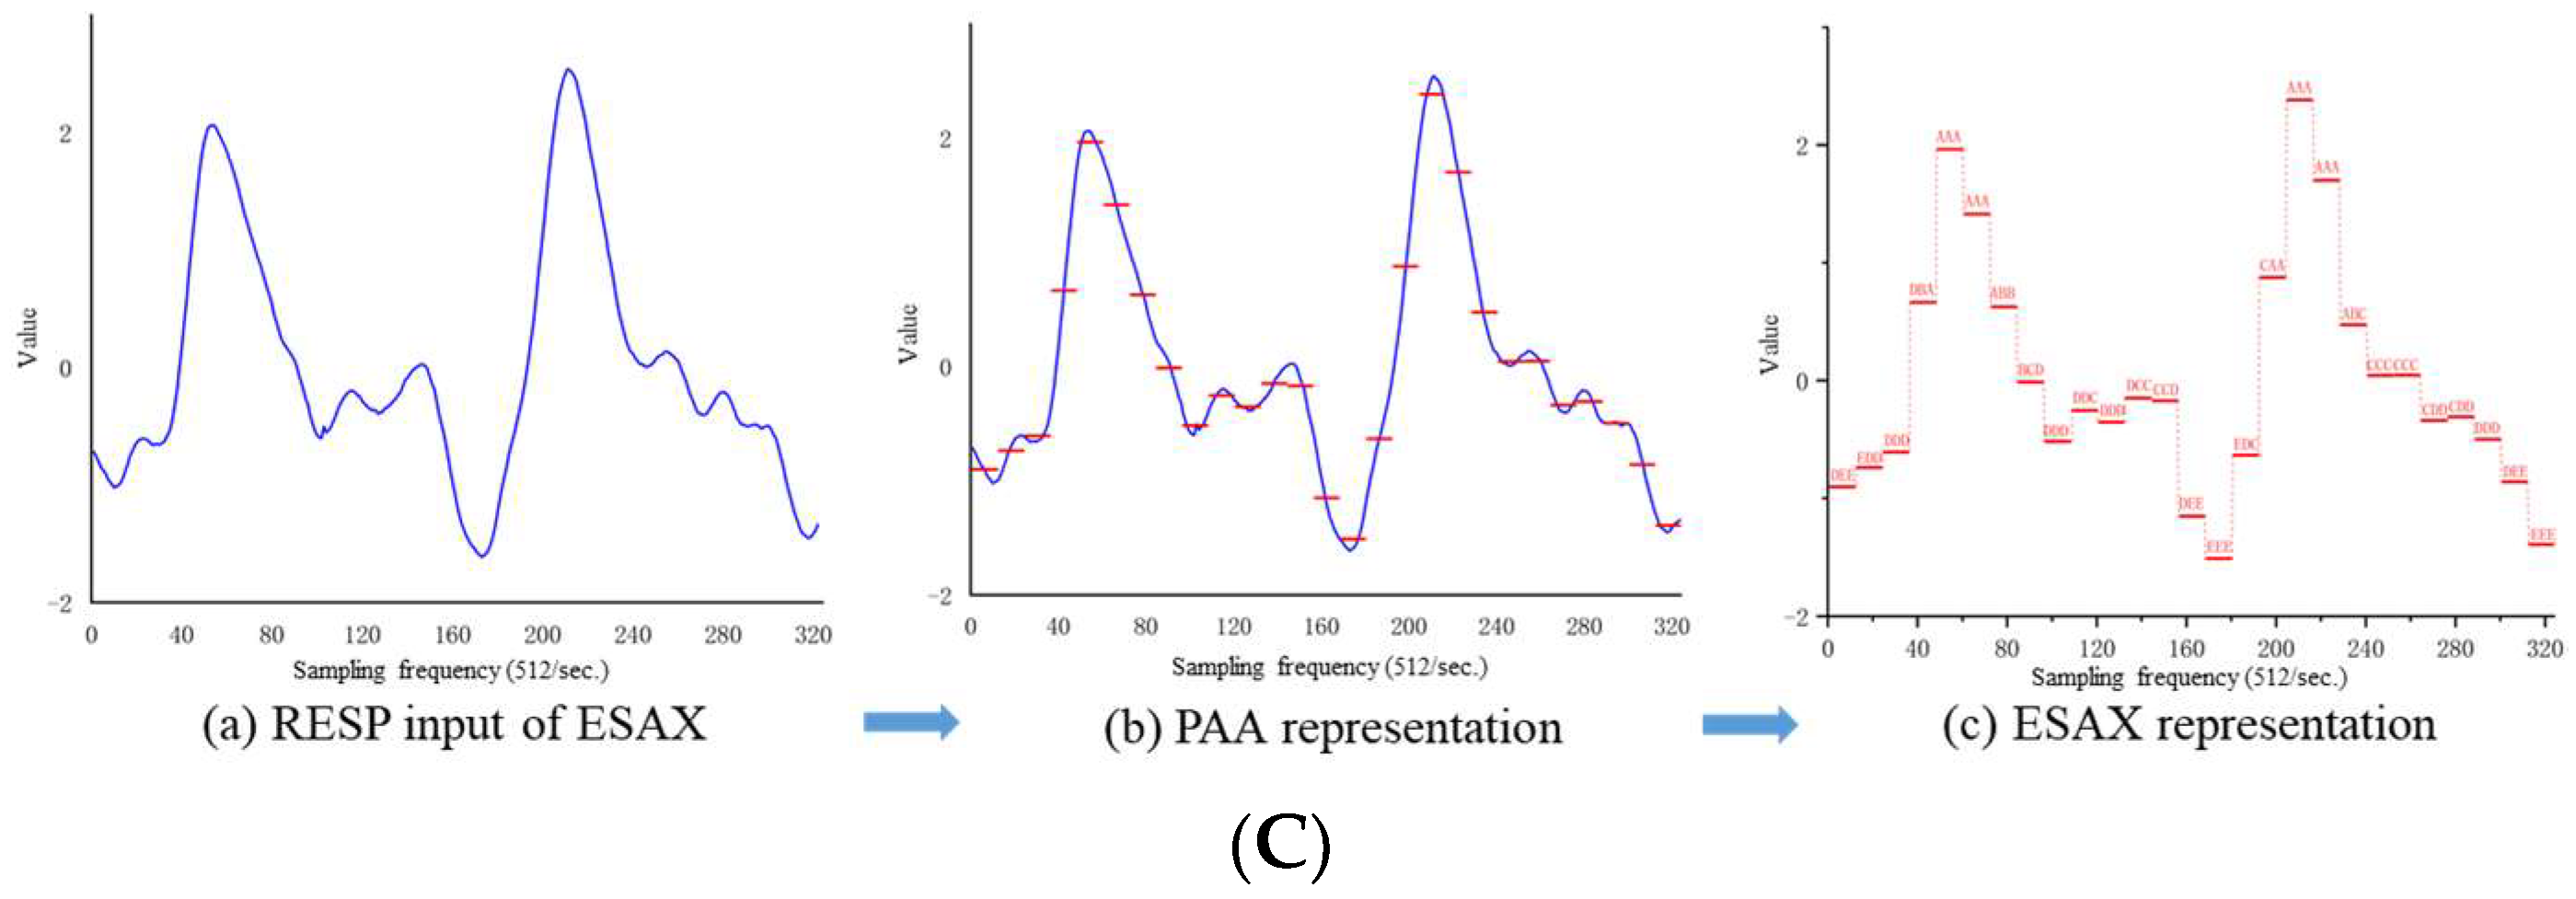
3.2. Extension of Symbolic Aggregate Approximation

In this paper, the intention of pilots in the cognitive process is analyzed and deduced based on physiological characteristics. Among them, how to accurately and efficiently obtain the characteristic variables in physiological signals is the key to realize the pilot’s intention identification. The existing physiological signal feature extraction methods mainly use statistical methods to obtain time-based and spectrum-based features [29]. However, characteristics of high dimensionality and plenty of physiological signals are ignored, which will affect the performance of the latter identification model and reduce the identification accuracy of the model [30]. Therefore, the extension of symbolic aggregate approximation (E-SAX) method is used in this paper to achieve effective dimensionality reduction of physiological signals and reasonable interpretation of data. E-SAX is an improved feature extraction method on the basis of the SAX algorithm proposed by Lin J. et al. [31]. This method could not only represent continuous time-series values with discrete and abstract symbols, while considering extreme and outlier values but, at the same time, it avoids shortcomings of the original SAX method. These shortcomings are mainly due to the mean approximation that misses some important values [32]. The realization process could be divided into the following steps:
(1) The numerical sequence is standardized as shown in Equation (1):
B = ( A μ ) / σ
where A is raw data, B is normalized values, and μ and σ are the mean and standard deviation of the original data, respectively.
(2) The normalized sequence is divided into equal-length subsequences by piecewise aggregate approximation (PAA). Then, the mean value of each subsequence is calculated. Since the normalized sequence follows Gaussian distribution, the corresponding probability distribution is divided into equal areas. For the time series B = b 1 , b 2 , b 3 , , b n , n represents its length and the number of segments is ω , then the segmented time series could be expressed as B = b 1 , b 2 , b 3 , , b ω in terms of Equation (2).
b i = ω n j = n ( i 1 ) ω + 1 n i ω b j
In view of the statistical table in reference [32,33], the region of sequence B is segmented and judged. After that, different regions are represented by symbols so that the values are serialized into symbol sequences, respectively. The breakpoints β that divide the distribution space into α equiprobable regions are determined by a lookup table that could be seen in Table 3.
As Table 3 illustrates, the values of β i ( i = 1 , 2 , 3 , 4 ) are defined by means of a statistical table that divides the Gaussian curve into equal areas. Each area is delimited by the interval [ β i 1 , β i ] .
(3) Each subsequence segment is encoded with a symbol. Finally, the region corresponding to the mean of each subsequence is found, and the character corresponding to the region is used to replace the subsequence. After PAA, the equal size segments and their average values are obtained, and then the maximum and minimum values are defined in each segment. This means the time series is represented by the mean value and two additional values (the maximum and the minimum in the subsegment). These segments are described in Figure 4.
For any given segment B i in a time series, S k and E k are the start and end position on the time segment B i , respectively. The middle position p m i d of the time segment B i could be calculated by Equation (3):
P mid = S k + E k 2
S 1 , S 2 , and S 3 are assumed to be the first, second, and third symbols in the k th ( k ω ) subsection. The p max , p min , and p mid denote the maximum, minimum, and average value in the k th subsection on the x-axis, respectively. At the same time, S max , S min , and S mid are supposed to be the maximum, minimum, and average characters in the k segment, respectively. The sequence of strings in the k th segment can be calculated by Equation (4):
( s 1 , s 2 , s 3 ) = { ( s max , s mid , s min ) i f p max < p mid < p min ( s min , s m id , s max ) i f p min < p mid < p max ( s min , s max , s mid ) i f p min < p max < p mid ( s max , s min , s mid ) i f p max < p min < p mid ( s mid , s max , s min ) i f p mid < p max < p min ( s mid , s min , s max ) o t h e r w i s e
Time series B = b 1 , b 2 , b 3 , , b n is represented by the symbol sequences B = b 1 , b 2 , b 3 , , b ω in the extended symbolic aggregation approximation method. Among them, b 1 = ( s 1 1 , s 2 1 , s 3 1 ) , B = ( s 1 1 , s 2 1 , s 3 1 , s 1 2 , s 2 2 , s 3 2 , s 1 3 , s 2 3 , s 3 3 , , s 1 j , s 2 j , s 3 j , s 1 k , s 2 k , s 3 k ) , and ( s 1 j , s 2 j , s 3 j ) are the ordered sets of the segment strings in Equation (4).

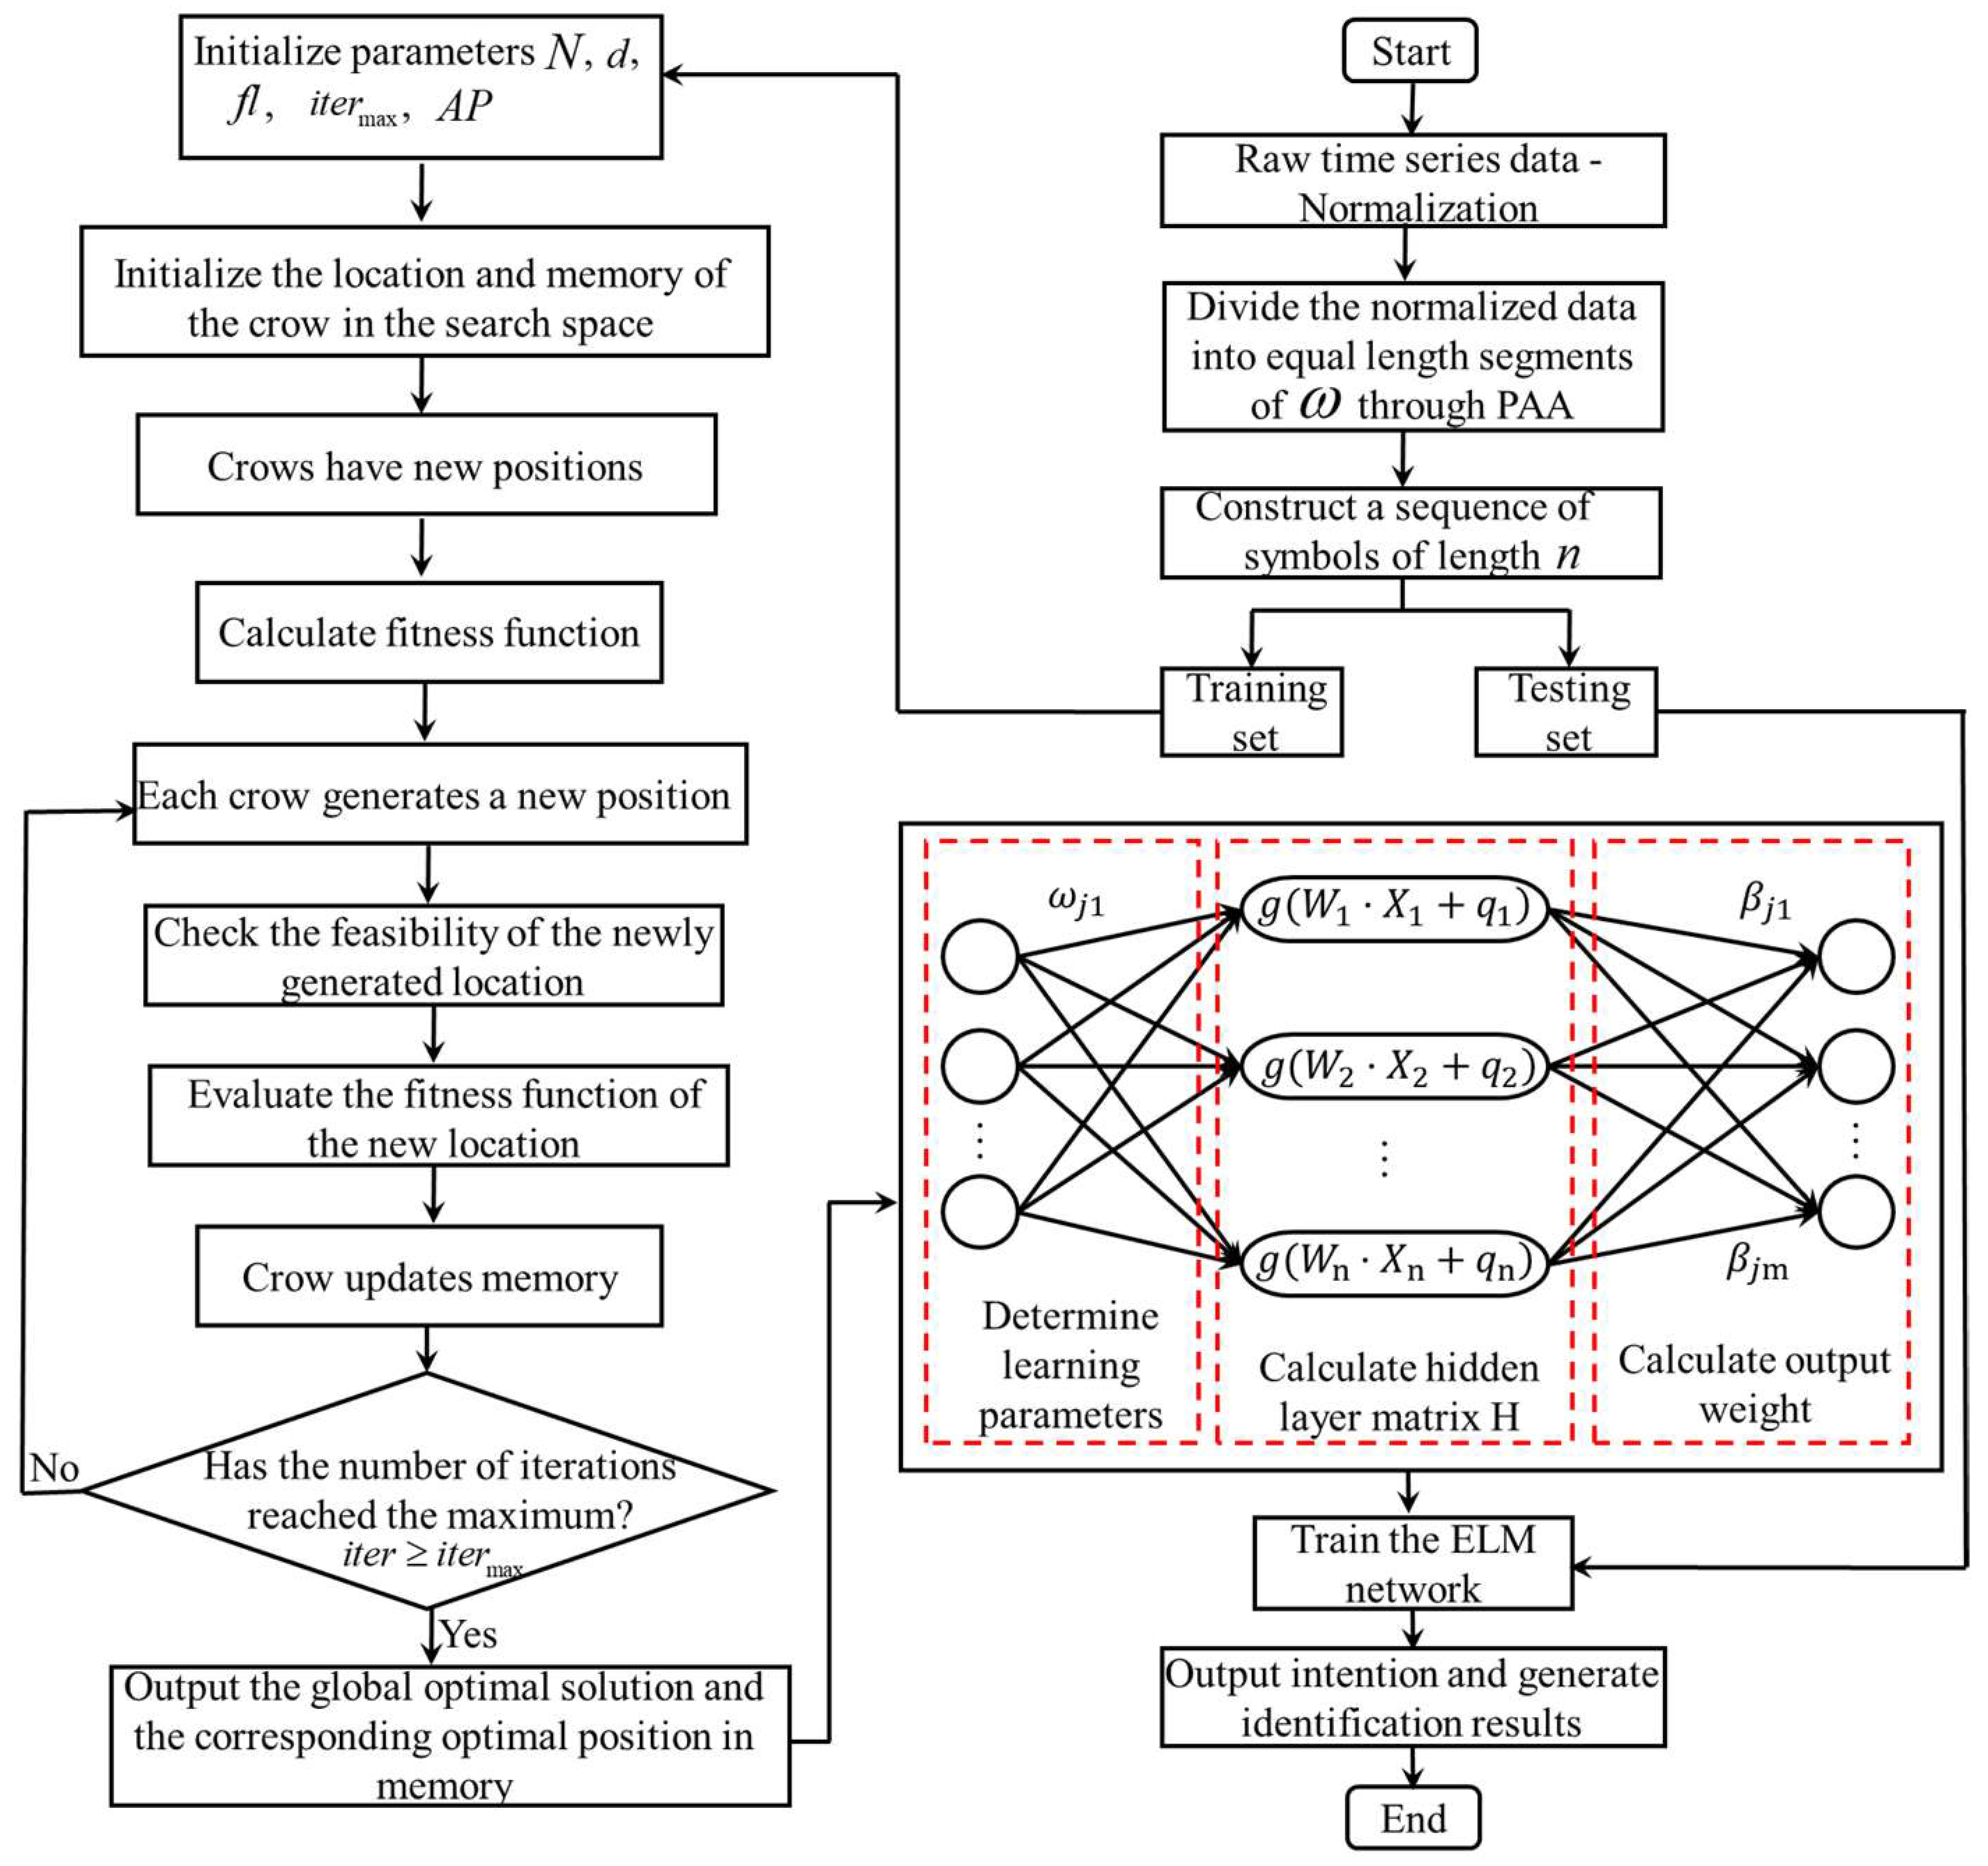
3.3. Extreme Learning Machine Optimized by the Crow Search Algorithm

(1)
Extreme learning machine
The extreme learning machine (ELM) is a single hidden-layer forward neural network (SLFM) learning method proposed by Huang et al. [34]. In ELM, the connection weights between the input and hidden layer and the threshold value of the hidden layer are generated randomly. It is not necessary to adjust during the training, which could avoid the cumbersome adjustment of neural network parameters in the iterative process. Therefore, the ELM method has a fast learning speed and good generalization performance. Compared with traditional learning algorithms based on gradient descent theory, such as the BP algorithm, its learning speed is faster and it can obtain better generalization performance. Compared with support vector machines, the model of ELM is simpler.
In this paper, it is supposed that there are N arbitrary samples ( X i , t i ) . Among them, the physiological characteristic parameter is the input variable, X i = ( x i 1 , x i 2 , x i n ) T R n . Intention is expressed as an output variable, t i = ( t i 1 , t i 2 , t i n ) T R n . n is the dimension of the input layer and m is the dimension of the output layer. For a single hidden-layer feedforward neural network with L hidden layer nodes, the output can be expressed by Equation (5):
j = 1 L β j g ( X i ) = j = 1 L β j g ( W j · X i + q j ) = o i
where i = 1 , 2 , , N , W j = ( ω j 1 , ω j 2 , , ω j n ) T represents the input weight, β = ( β j 1 , β j 2 , , β j m ) T is the output weight, q j is the bias of the j th hidden-layer elements, W j · X i expresses the inner product of W j and X i , and g ( x ) is the activation function.
The learning goal of SLFM is to approximate N samples under the minimum error, which can be defined by Equation (6):
i = 1 N β j o i t i = 0 ,   i = 1 , 2 , , N
That is, there are W j , β j , q j such that:
j = 1 L β j g ( W j · X i + q j ) = t i ,   i = 1 , 2 , , N
It can be simplified as H β = T , where H , β , and T are the hidden-layer node output matrix, the output weight, and the desired output, respectively.
H ( W 1 , W 2 , , W L , q 1 , q 2 , q L , X 1 , X 2 , , X L ) = [ g ( W 1 · X 1 + b 1 ) g ( W 2 · X 1 + b 2 ) g ( W L · X 1 + q L ) g ( W 1 · X 2 + b 1 ) g ( W 2 · X 2 + b 2 ) g ( W L · X 2 + q L ) g ( W 1 · X N + b 1 ) g ( W 2 · X N + b 2 ) g ( W L · X N + q L ) ] N × L
where β = [ β 1 T β 2 T β L T ] L × m , T = [ T 1 T T 2 T T L T ] N × m .
To train a single hidden-layer neural network, a set of parameters W ^ j , β ^ j and q ^ j are obtained such that:
H ( W ^ j , q ^ j ) β ^ j T = min W , q , β H ( W j , q j ) β j T ,   j = 1 , 2 , , L
The output matrix of hidden layer H will be obtained when the single hidden-layer feedforward neural network input weight W i and hidden-layer bias q i are determined randomly. The solution process of SLFM is transformed into a linear system H β = T . The output weight β could be determined by Equation (10):
β ^ = H + T
In the extreme learning machine, the weights from the input layer to the hidden layer and the threshold of the hidden-layer nodes are random. ELM saves the training time of the model but, on the other hand, it also generates some non-optimal and unnecessary input weights and hidden biases, which makes the adaptability and stability of the network worse, and reduces the generalization ability of the network. To solve this problem, this paper uses the crow search algorithm based on a powerful search ability to optimize the input layer weight and hidden-layer bias of ELM, so as to improve the accuracy and adaptability of its identification.
(2)
Crow search algorithm
The crow search algorithm is based on the intelligent behavior of crows, a metaheuristic algorithm [35] proposed by Alireza Askarzadeh [36]. From an optimization perspective, the crow is a searcher, whose flying environment is its search space. Each location in the environment corresponds to a feasible solution for the optimization algorithm, and the position of the food source corresponds to the size of the objective function value (fitness value) of a certain location. The best food source in the environment is the global optimal solution [37].
Suppose that in the d dimensional environment and i t e r time, N crows fly through space, trying to find the best food source location. The location of crow i in the generation could be expressed by Equation (11) as:
x i , i t e r = [ x 1 i , i t e r , x 2 i , i t e r , , x d i , i t e r ]
where i [ 1 , N ] , i t e r [ 1 , i t e r max ] , and i t e r max represent the maximum number of iterations.
Each of the crows ( N ) has a memory of the best food source location ( m ) in the search space ( d ). In the i t e r iteration, the best location that i could find so far is expressed by Equation (12) as:
M i , i t e r = [ m 1 i , i t e r , m 2 i , i t e r , , m d i , i t e r ]
Under the circumstance that the reference [29], in the i t e r iteration, j wants to visit where it stores food, i decided to follow j to the hiding place of j and steal its food. In the process of tracking, there are two situations:
Case 1: j did not find i was following it and, as a result, i arrived at the location where j was hiding the food to steal food. i arrives at j ’s home where food is stored to steal. i replaces its current position. The formula is shown in Equation (13):
X i , i t e r + 1 = X i , i t e r + r i × f l i . i t e r × ( M j , i t e r X i , i t e r )
where r i obeys the uniform distribution between 0 and 1, f l i , i t e r represents the flying distance of i in the i t e r iteration.
Case 2: j found i was tracing it, so j flew to other places to confuse i to avoid food theft.
Case 1 and case 2 could be expressed by Equation (14):
x i , i t e r + 1 = { X i , i t e r + r i × f l i , i t e r × ( M j , i t e r X i , i t e r ) , r j A P j , i t e r a r a n d o m p o s i t i o n , o t h e r w i s e
where r j obeys the uniform distribution between 0 and 1, and A P j , i t e r means the awareness probability of j at the i t e r moment.
In the CSA, when awareness probability ( A P ) is small, it is not easy for the crow to find that it is being tracked. CSA tends to search locally to find the current best solution in a local area. Correspondingly, when A P is large, CSA tends to search globally to find the current best solution in a local area.
(3)
ESAX-CAS-ELM model
The number of hidden layers of the ELM is pre-assigned, hidden-layer parameters are selected randomly, and the parameters remain unchanged during the training process. The setting of these parameters directly affects the classification results of ELM. Only when proper parameters are set can the model achieve better performance. On the basis of the symbolization and visualization of the original data by ESAX and the intelligent icon method, the global optimization capability of the crow search is used to obtain the optimal ELM input layer weight and hidden-layer threshold. The output weight could be determined by Equation (10) to make up for the defect that ELM does not have high diagnostic accuracy because of poor parameter selection. The flow diagram of the ESAX-CAS-ELM model is indicated in Figure 5.
The pilot’s intention identification model is constructed by the ESAX-CAS-ELM method through physiological signals such as ECG, EDA, and RESP. The construction process of the model is as follows:
Step 1: Data standardization. The physiological signals obtained in Section 2.4 are filtered and otherwise pre-processed and then the numerical sequence of physiological signals is standardized by Equation (1). The original time series is converted to a standardized series, B = b 1 , b 2 , b 3 , , b n .
Step 2: Data dimensionality reduction. The PAA method is used to reduce the dimension of time series B with length n , which is expressed as B = b 1 , b 2 , b 3 , , b ω , where ω is the number of segments, and the ith element in B is calculated by Equation (2).
Step 3: Data discretization. After the process of data standardization and dimensionality reduction, for any given segment B i in the time series, the intermediate value of the segment is calculated from the maximum and minimum values on the time axis through Equation (3). Thereby, the characters corresponding to the maximum, minimum, and average values of the kth segment are obtained. Furthermore, the symbol set is determined by Equation (4). The symbolic representation of the ESAX datasets such as ECG, EDA, and RESP is realized.
Step 4: The dataset is divided. After the dataset is symbolized by ESAX, the physiological signals are further represented in a more compact form through the intelligent icon method. This will make the time-series data more visible. In addition, the visualized data are divided into two parts: training and test sets. Among them, the training set is utilized to train the ELM model, and the test set is used to verify the identification performance of the optimized ELM model.
Step 5: CSA parameter initialization. The parameters of dataset initialization in light of the training set include the population size of crows ( N ), dimensions of search space ( d ), flight distance ( f l ), maximum iteration number ( i t e r max ), and awareness probability ( A P ).
Step 6: The location of the crow and its memory of hiding food are initialized. The initial positions of N crows are randomly generated in a d-dimensional space, x j i ( i = 1 , 2 , , N , j = 1 , 2 , , d ). Each crow represents a feasible solution to the problem and d is the number of decision variables. Because, in the initial iteration process, crows have no experience in hiding food, it is assumed that they hide food in their initial positions. In other words, the initial memory of each crow is the initial position, m j i ( i = 1 , 2 , , N , j = 1 , 2 , , d ).
Step 7: The ELM network parameters are optimized by the crow search algorithm. The input weight W j of ELM and the bias q j of the hidden-layer unit are taken as the crow’s location, denoted as ( W j , q j ) . Moreover, the root mean-square error of the extreme learning machine training set is taken as a fitness function to calculate the fitness value of each location.
Step 8: Generate a new position. If the fitness value does not reach the global optimal value, the CSA algorithm is used to generate new positions. The process of generating a new position is as follows: crow i will randomly select a crow in the population to track (assuming that the selected one is j ). If crow j cannot find the tracked crow, then crow i will steal the food of j . The position update of crow i is completed by Equation (14).
Step 9: The feasibility of the new location is checked. If the new position of crow i is feasible, the position is updated; otherwise, it is not updated. In other words, if the new position of crow i is in the search space, it will fly to the new position.
Step 10: The fitness of the location is calculated. The fitness of the new position with the objective function is calculated.
Step 11: The memory of the crow is updated. If the usage value of the new position is better than the fitness of the original memory, the memory will be updated according to the new position. Otherwise, the memory will not be updated. Crow memory is updated by Equation (15):
m i , i t e r + 1 = { X i , i t e r , f ( X i , i t e r ) i s b e t t e r t h a n f ( m i , i t e r ) m i , i t e r , o t h e r w i s e
where f ( · ) represents the fitness value.
Step 7 is iterated until the termination condition is reached. In the end, the optimal memory of the crow is output, so that the input weight W j of ELM and the bias q j of the hidden-layer unit are optimized.
Step 12: The accuracy of model identification is calculated. After the above steps, the optimized ELM model is obtained. The test set is adopted to test the identification performance of the optimized ELM and, finally, to output the identification accuracy of the model.

4. Results

In this section, in the light of the physiological data obtained during the flight simulation experiment of the pilot in the second section, the ESAX-CAS-ELM method described in the second section is used to establish the identification model to realize the classification of the pilot’s intention (i.e., whether the intention is generated). Moreover, the characteristic patterns in different states are further analyzed. In the flight simulation experiment, a total of 375 airfield traffic-pattern samples were collected; 80% of the total samples were randomly selected as a training set, and the remaining 20% as a test set. Each sample includes three physiological signals, namely ECG, RESP, and EDA. These physiological signals are divided into time windows according to the pilot’s simulation of airfield traffic patterns. The width of each window corresponds to the time required for each side of the airfield traffic pattern. Whether the pilot generates an intention during the control of the aircraft is numbered in this article, where “0” means no intention is generated and “1” represents intention generation. Thus, the physiological signals in the time window were labeled.

4.1. Feature Extraction of Intention

To better realize the feature extraction of intentions based on ESAX, the time-series change characteristics of the physiological signals are considered. Here, the local structure analysis method is utilized to reveal the continuous change characteristics between adjacent data points, and then used to identify whether the intention is generated. That is, the time window of length slides on the symbol sequence to obtain the symbol string, as exhibited in Figure 6.

4.2. Classification of Intention Generation
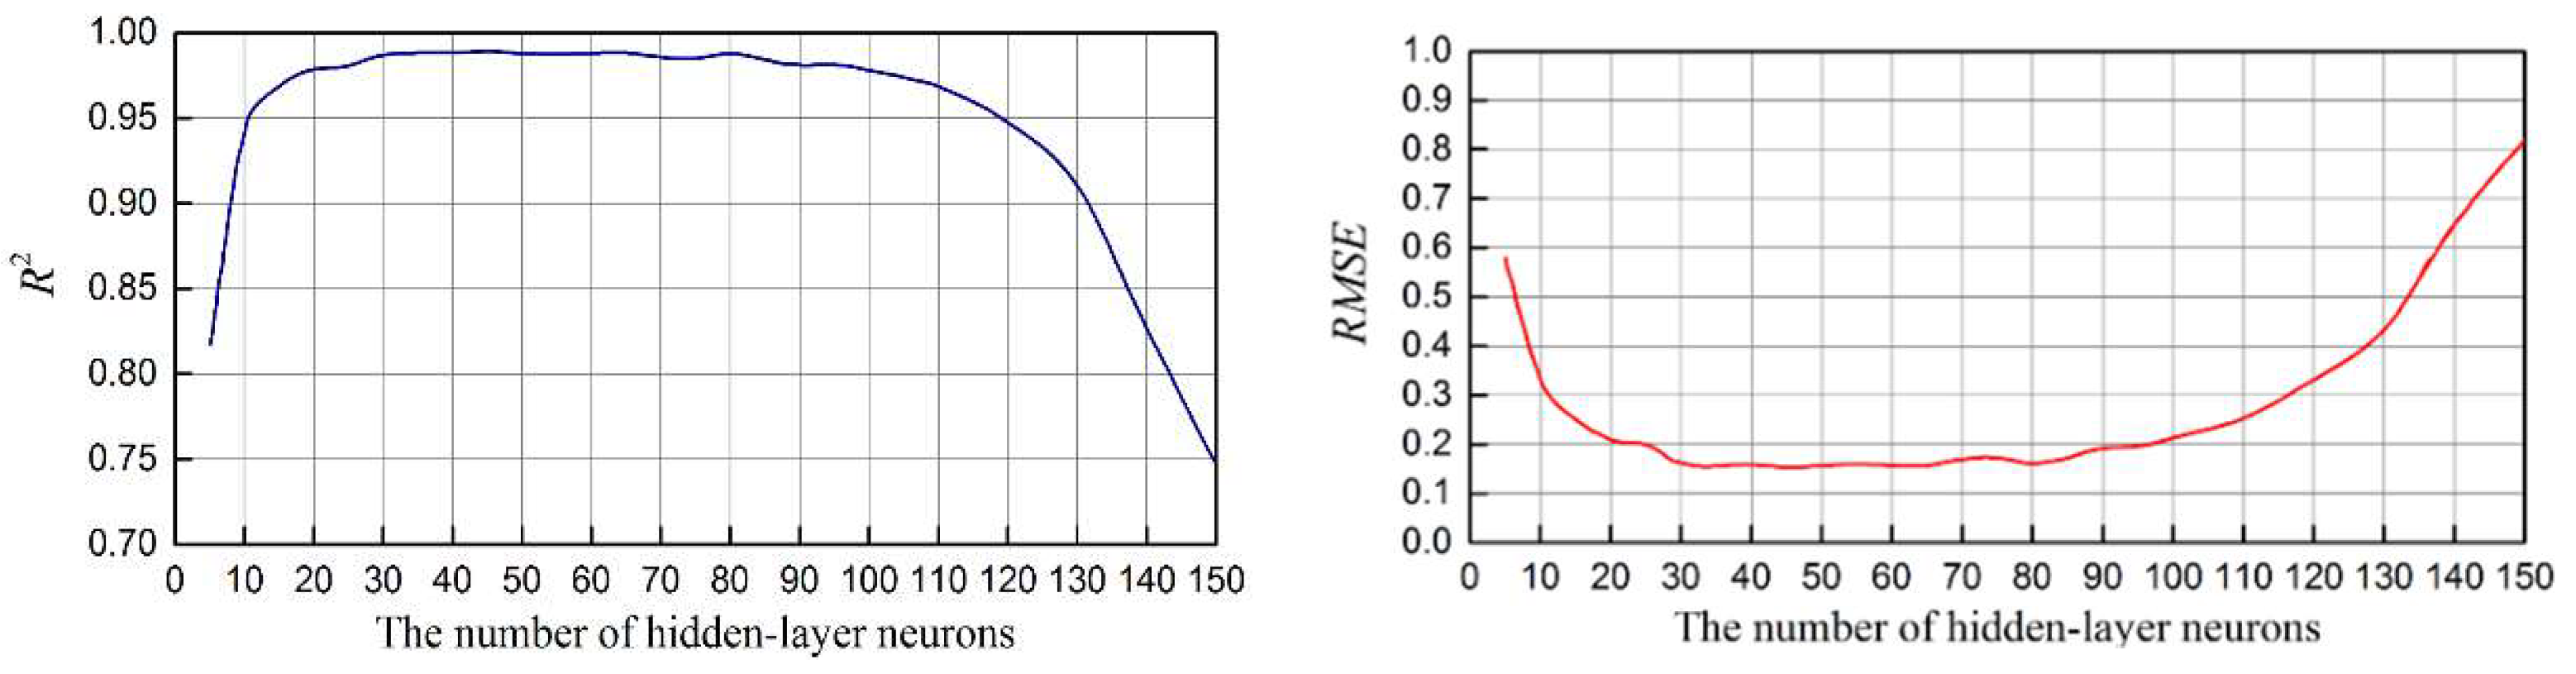
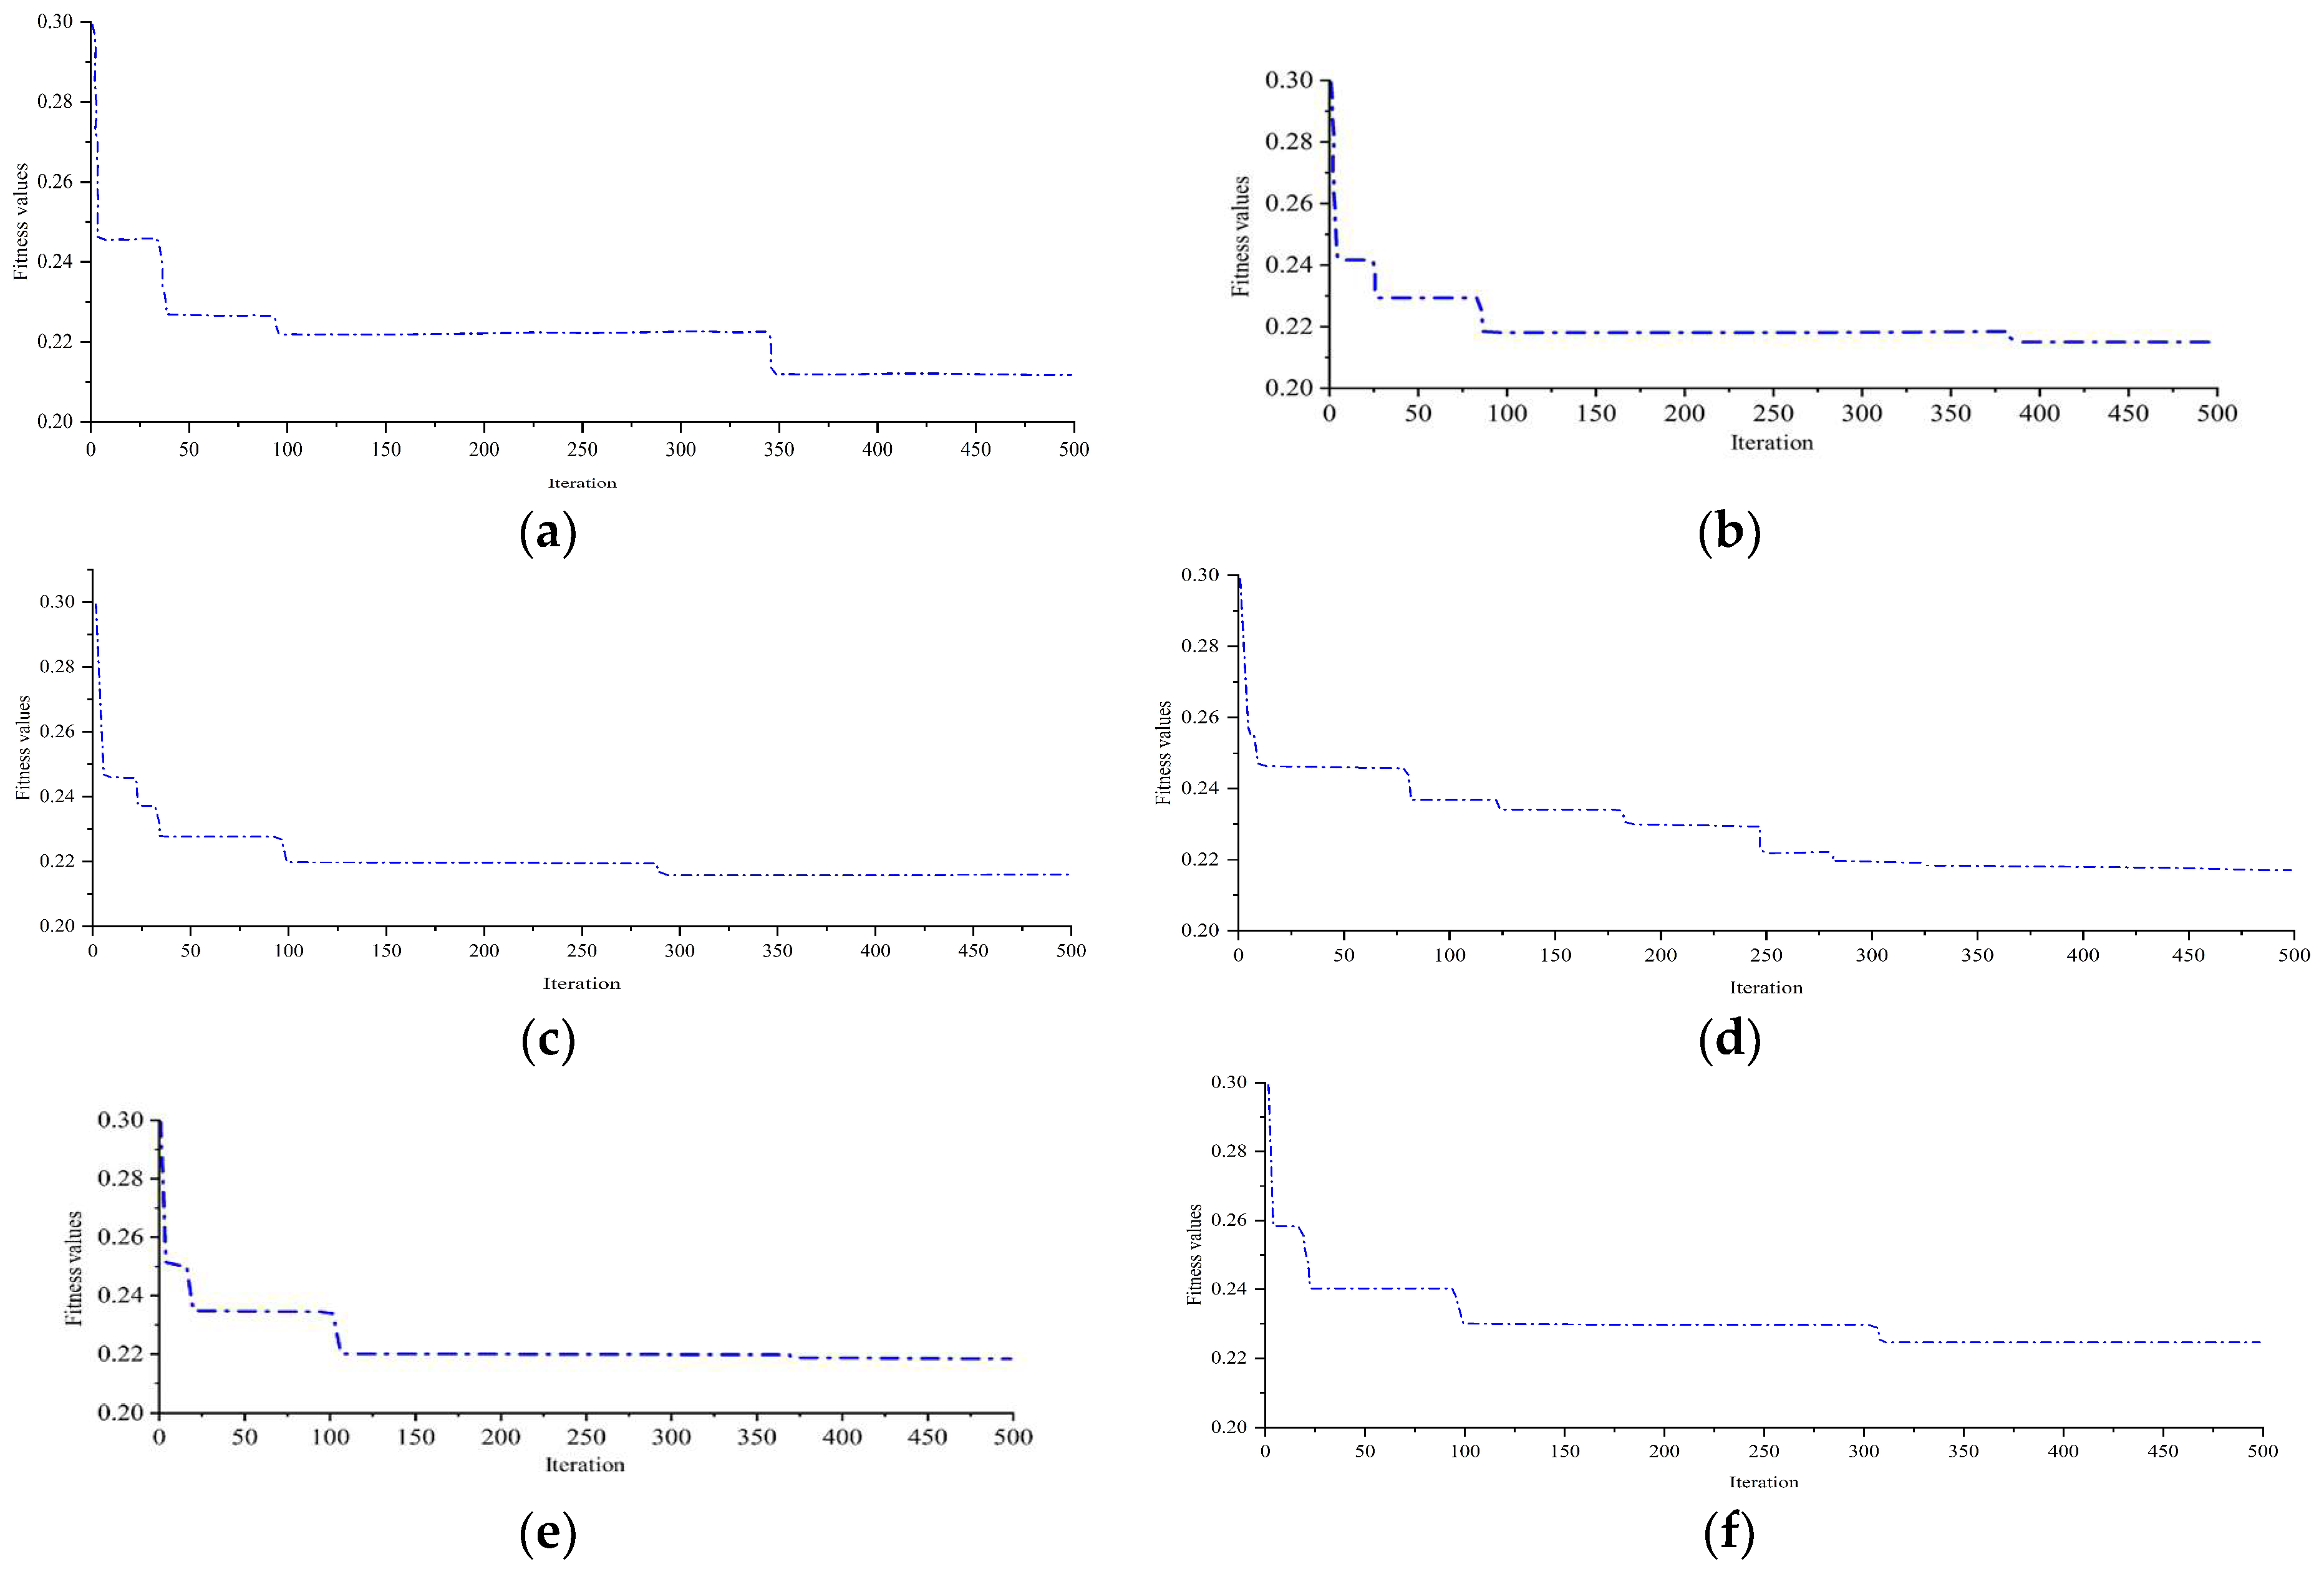
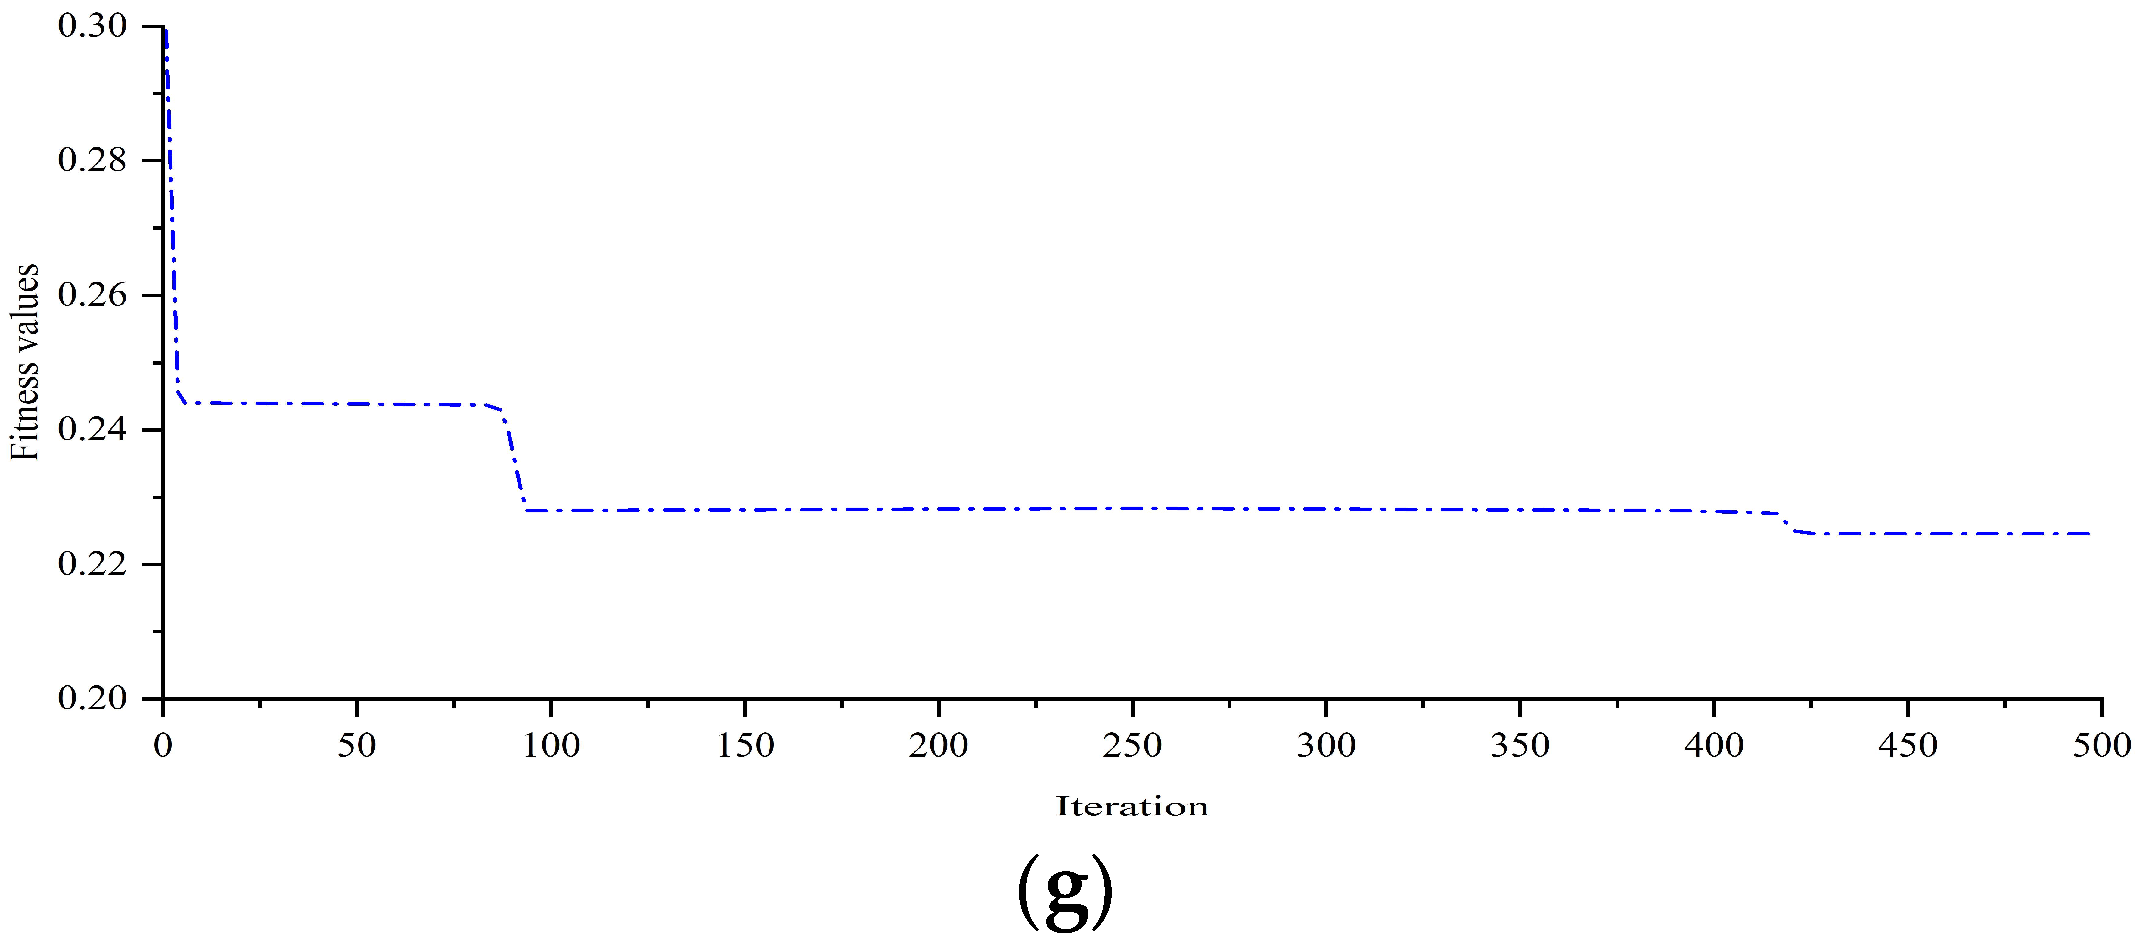
Under the circumstance that the above analysis results in physiological characteristics such as ECG, EDA, and RESP by ESAX, here the intelligent icon method is used to represent these physiological characteristics. In this section, these physiological characteristics will be used to identify whether the pilot has intentions during the flight simulation. Moreover, the typical characteristic pattern in the intention generation process is tried to identify. CSA and ELM are coupled together in paper. The input weight and bias of ELM are optimized by CSA to identify whether the pilot has an intention. The specific steps are as follows.
(1)
Determination of network structure
According to the physiological characteristics data obtained above, the number of neurons in the input layer is determined to be three. The simulation value corresponding to whether each sample generates intention is used for network output. Namely, there are two neurons in the output layer. An identification model including three inputs and two outputs is constructed.
Sigmoid is the best activation function and is a key to build the most powerful ELM. In this paper, the Sigmoid function is used as the excitation function of the ELM model, as shown in Equation (16) [38]:
g ( x ) = 1 1 e x
After the activation function is determined, the performance of ELM is only affected by the number of hidden-layer neurons. Here, K-fold cross validation (K = 10) is adopted to determine the best number of neurons in the competitive layer through a large number of experiments. The effect of the number of hidden-layer neurons on ELM performance is illustrated in Figure 7. It can be seen from the curves of R M S E and R 2 in Figure 7 that the fitting effect of ELM on the training sample set is improved with the increase of the number of hidden-layer neurons. When the number of hidden-layer neurons is more than 100, ELM could approximate all training samples with no error. However, according to the curves of R M S E and R 2 , when the number of hidden-layer neurons increases, R 2 presents the trend of first increasing and then decreasing, while RMSE first decreased and then increased. Thus, it suggests that there should not be too many or too few neurons in the hidden layer. Too many hidden-layer neurons will lead to overfitting, while too few may lead to underfitting, which will reduce the generalization ability of ELM. Therefore, the appropriate number of hidden-layer neurons should be selected to ensure that the network has a good generalization ability. In this paper, in the light of Figure 7, the number of neurons in the hidden layer is 53.
(2)
Determination of parameters
In the CSA-ELM model, the determination of the CSA parameter is similar to ELM [39]. In the ELM model, the Sigmoid function is selected as the activation function and the number of hidden-layer neurons is 53. In CSA, the spatial dimension where crows search is d = 53 × 3 + 53 (i.e., 53 is the number of neurons in the hidden layer and 3 is the number of neurons in the input layer). R M S E / R 2 is adopted as the fitness function. In this way, CSA is used to optimize the weight of the input layer and the bias of the hidden-layer unit in the constructed ELM model of 3-53-2. Following the reference [35], the parameters in the CSA algorithm are determined, including the total number of crows N = 50 , the maximum number of iterations i t e r max = 100 , flight length f l = 2 , and awareness probability A P = 0.1 . The fitness values of CSA in different A P are given in Figure 8. With the increase of the A P value, CSA could neither achieve the global optimal solution nor obtain the local optimal value. Therefore, the value of A P is 0.1.
(3)
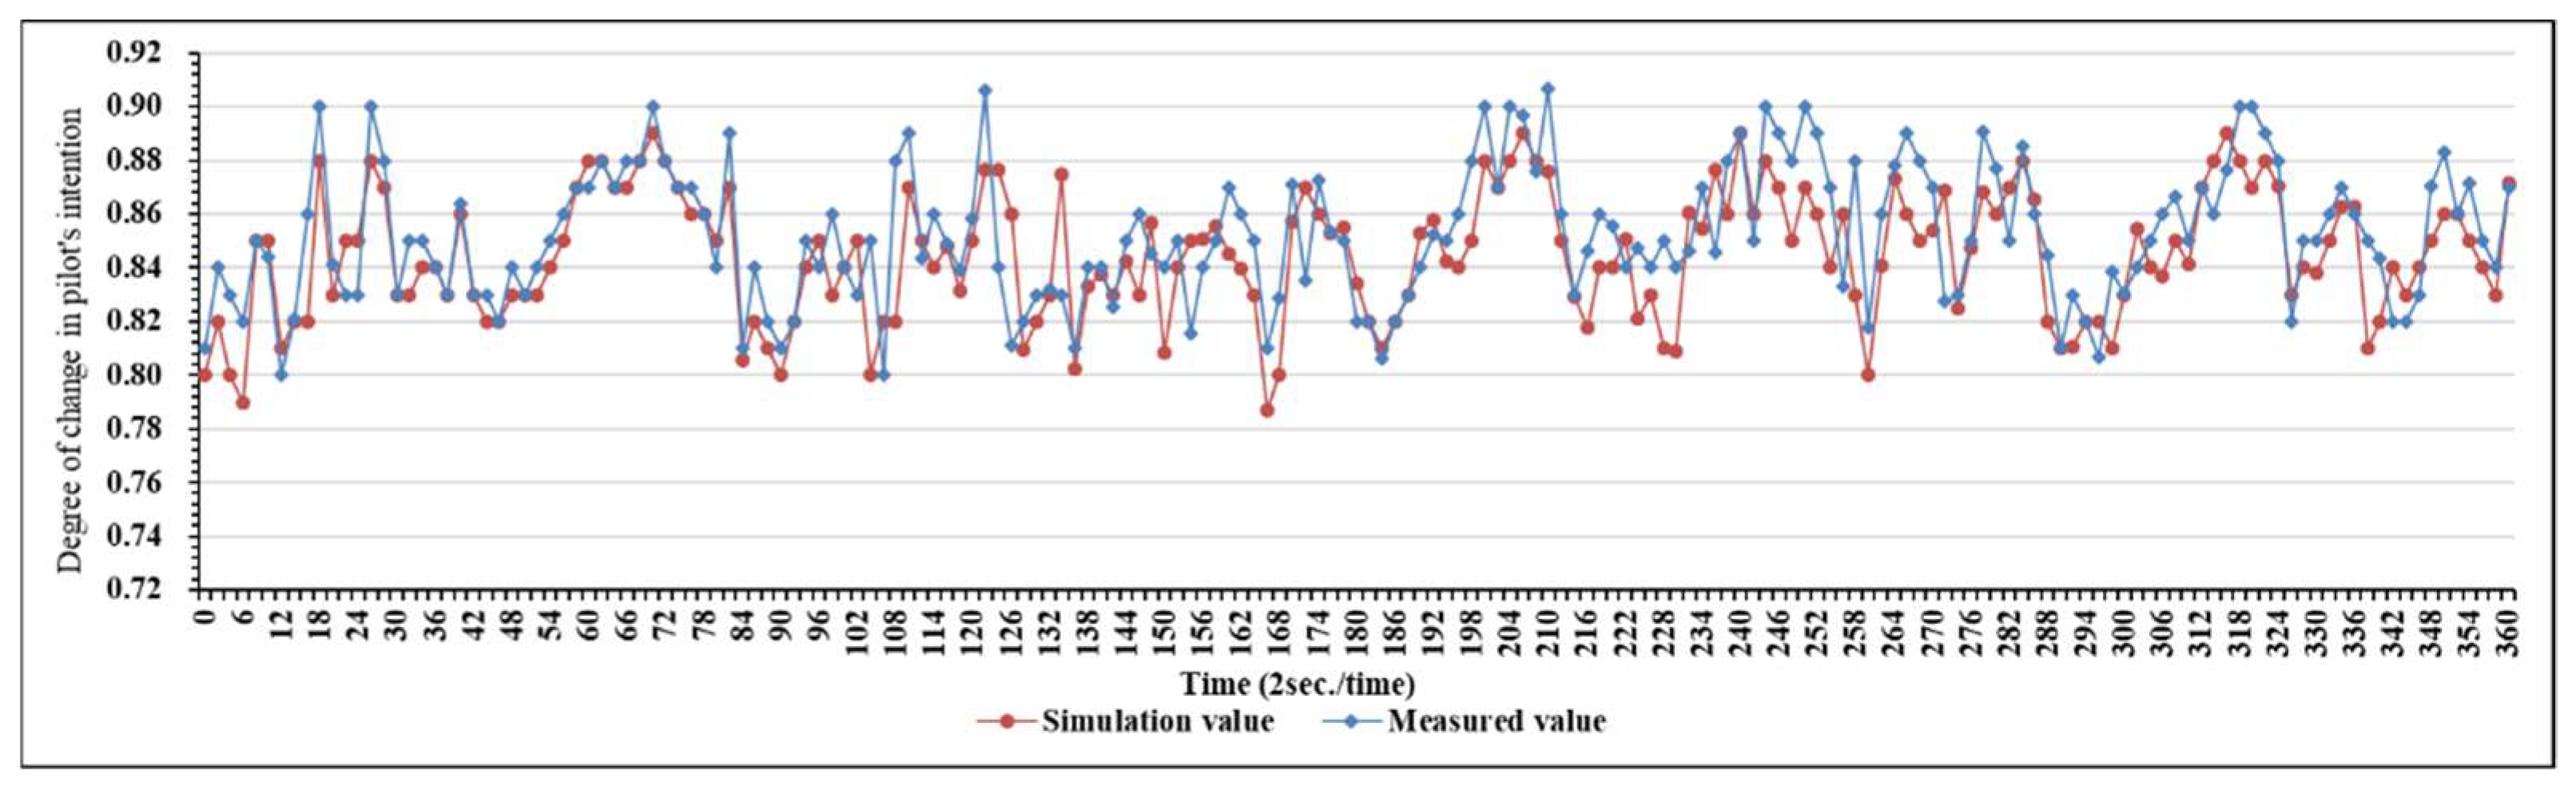
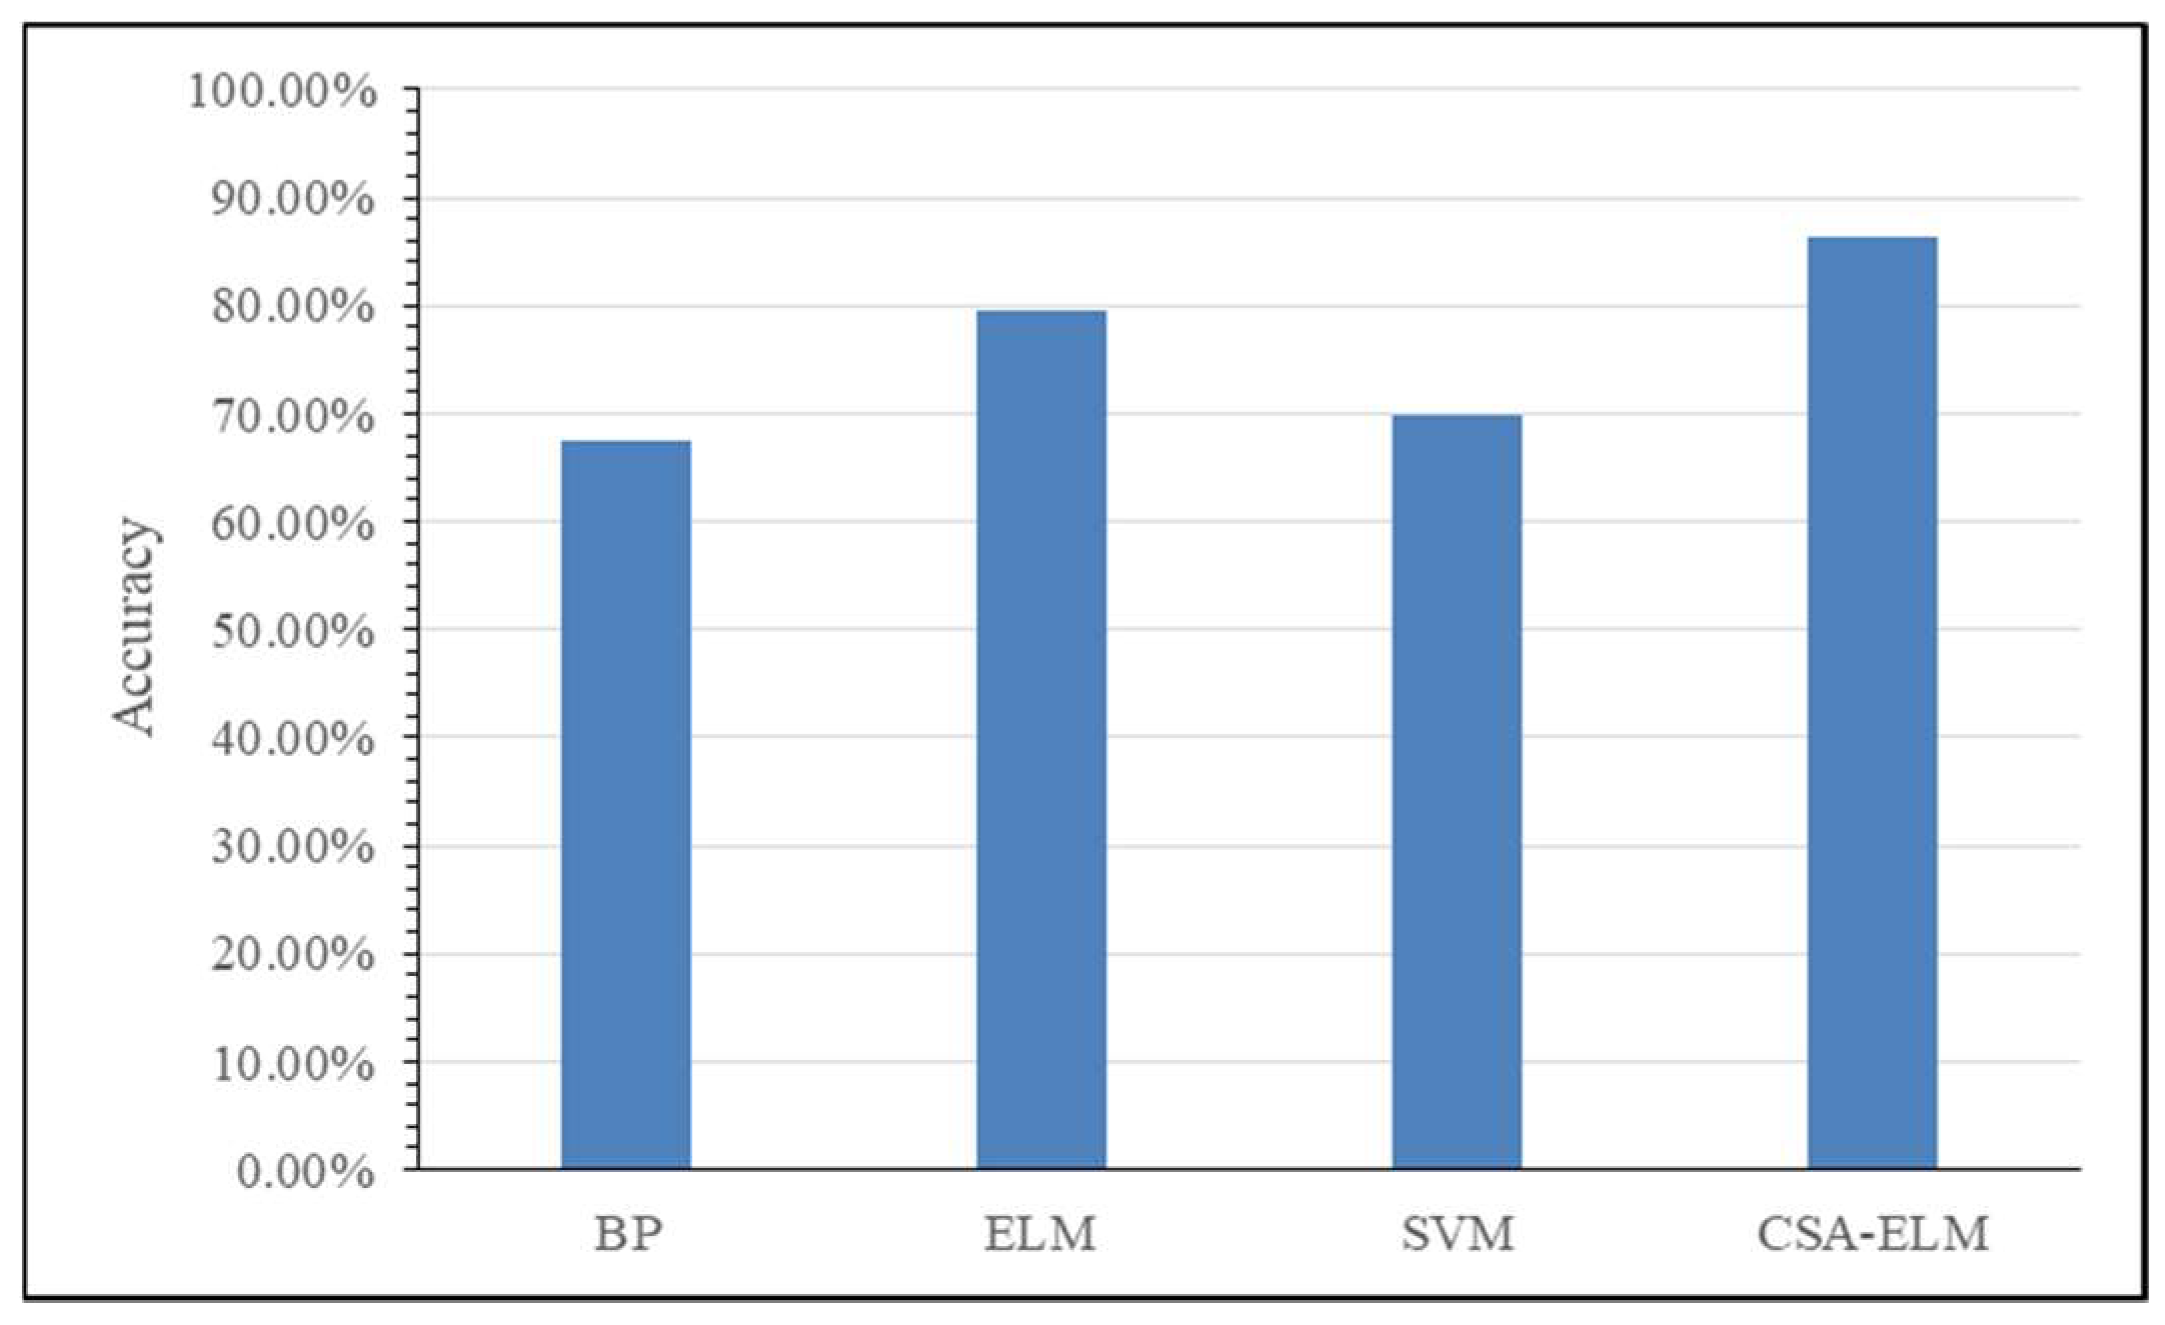
CAS-ELM performance evaluation
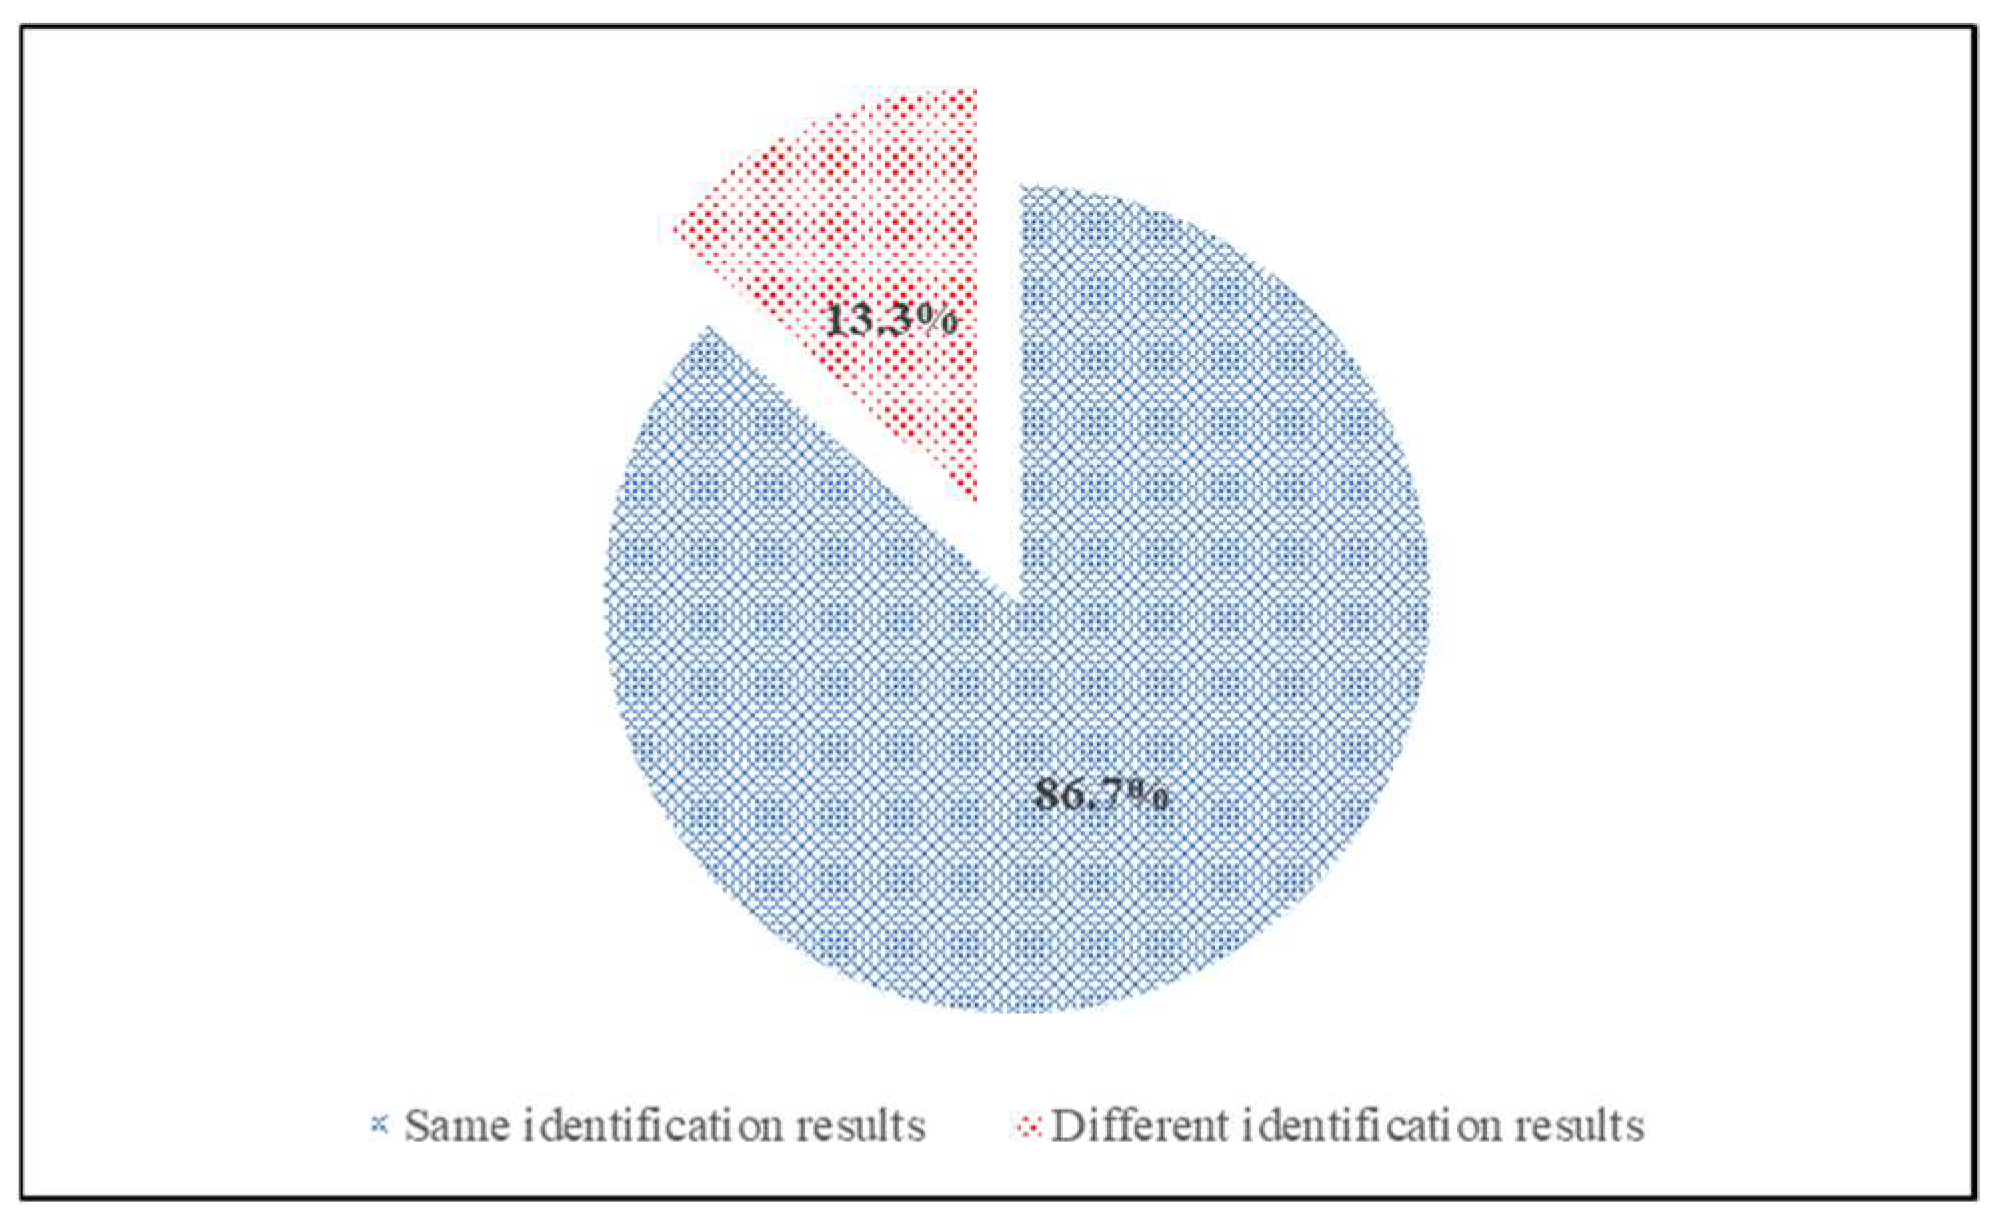
Statistical parameters (such as accuracy rate, precision rate, recall rate, etc.) were used to evaluate the performance of the CSA-ELM model. A brief explanation of these statistical parameters is as follows: the accuracy rate is the probability reflecting the classification accuracy of a model. The precision rate is used to reflect the degree of accuracy in model classification; that is, how many of the samples classified as positive are real positive samples. The recall rate is utilized to reflect the sensitivity of the model; namely, how many correct samples are classified as correct. The precision rate and recall rate are used to deal with positive and negative events, respectively. The accuracy rate is regarded as the stability index of the classifier. The performance evaluation index and calculation formulas are illustrated in Table 4.
Every time CSA choses the input weight and bias of the hidden-layer unit in the ELM model, it produces inconsistent results. It is measured based on the physiological data during the flight simulation and the results of each performance index are revealed in Table 5.
As shown in Table 5, the accuracy rate, precision rate, and recall rate of the CSA-ELM model are all over 80%. This result indicates that the evaluation accuracy and generalization ability of the CSA-ELM model are very high, and it could be used for pilot intention identification.

5. Discussion

The flight data and physiological indexes in the simulation experiment were sorted out and analyzed. Here, the time-varying characteristics of intention and human memory characteristics are comprehensively considered, and a change-of-intention curve (measured value) was drawn. The characteristic data of the experimental samples are input into the pilot intention identification model, and the intention identification simulation experiment is carried out. According to the real-time identification results of the model, the change of the pilot’s intention curve (simulated value) is drawn and the comparison between the simulated result and the measured value is obtained. The verification results of a simulation experiment are revealed in Figure 9. It can be seen from the results of the simulation experiments that the identification results of the model proposed in this paper have a high degree of fit with the pilot’s measured values, and the accuracy of identification is about 90%.
To further verify and evaluate the stability and reliability of the CSA-ELM model, the traditional BP, ELM, and support-vector machine models were used to process the physiological data during the simulated flights of 32 pilots. The identification results of these methods are compared with the target intention identified by CSA-ELM, and the intention identification accuracy rate of each method is described in Figure 10.
Figure 10 is a comparison diagram of the accuracy of the four methods for pilot intention identification. The identification accuracy of the CSA-ELM model is 87.2%, which is 18.5%, 8.1%, and 17.7% higher than BP, ELM, and SVM, respectively. The results show that CSA-ELM has higher accuracy and better stability for pilot intention identification. Moreover, it can better process multiparameter time-series data.
Figure 11 shows the percentage of the same number of identification results when four methods are used to identify the same pilot’s intentions. Figure 11 shows the percentage of the same number of identification results when four methods are used to identify the same pilot’s intention. It can be seen from Figure 11 that the same degree of the four methods is 86.7% in identifying whether the pilot’s intention is generated. It can be proved that the proposed intention identification model has high reliability.
In this study, based on the physiological indexes such as ECG, RESP, and EDA obtained by simulating airfield traffic patterns, the results show that physiological indexes such as ECG, RESP, and EDA can be used for intention identification. This is consistent with the results of other relevant pilot micro-cognition studies [22,23,24].
Compared with previous studies [15,16,17,18,19,20,21,22,23,24,25,26,27], the main advantages of this study are reflected in the following aspects. (1) In this study, a large number of airfield traffic-pattern simulation experiments were carried out, and the amount of experimental data was larger and more reliable. (2) The ESAX feature extraction method is utilized in this paper; it can obtain more comprehensive feature variables from experimental data. The extracted characteristic variables are used to identify the pilot’s intentions. The results of this research enrich the research of the characteristic indicators of micro-cognitive behaviors such as pilot intention. (3) The established CSA-ELM identification model based on characteristic ESAX variables has a higher accuracy. The accuracy of intention recognition is as high as 87.2%, which is 18.5%, 8.1%, and 17.7% higher than BP, ELM, and SVM, respectively.
Comprehensive simulation experiment verification results show that the pilot intention identification model established in this paper is reasonable, stable, and effective. However, in view of a preliminary study of pilot intention, there are still many areas that need to be strengthened in this study. The follow-up research work is as follows:
(1) The pilot’s intention follows the evolutionary laws of generation, transfer, and reduction. Therefore, as a preliminary study of pilot intention identification, this paper is only a basic identification of whether the pilot generates an intention to change the operating attitude of the aircraft. Here, the intention to affect the flight attitude needs to be further determined. Thus, in the follow-up study on pilot intentions, a detailed division of pilot intentions is needed. Based on the determined pilot intention, the law of transfer between different intentions and even the attenuation law will be studied so as to identify the pilot’s intention more comprehensively, specifically, and accurately in the follow-up study.
(2) To improve the efficiency of intention identification, this paper only considers the process of generating the intention of the pilot when performing the airfield traffic pattern. The impact of other complex flight environments on the pilot such as crosswind, engine failure, landing gear failure, and other more complex situations during flight missions should be analyzed in future research. The model used in flight simulation is an abstract expression of the actual system, which has a certain subjectivity. Therefore, in future research, we need to pay more attention to the objectivity of the problem and consider the comprehensive impact of multiple situation effects on establishing a model. In addition, we also need to further improve the consistency between the model simulation results and the actual situation.
(3) In the process of establishing the identification model, the experimental data used in this paper have a certain deviation from the actual data because of objective factors such as time, experience of experimenters, and accuracy of equipment, which leads to some errors in the pilot intention identification results. Furthermore, it is still necessary to improve the experimental methods and expand the experimental sample size to make the intention identification results more accurate in future research.

6. Conclusions

Realizing accurate identification of pilot intention based on physiological signals is an important prerequisite for achieving the harmonious interaction between pilot, aircraft, and flight environment under the intelligent autopilot conditions. At the same time, it is not only the basic requirement for the development of advanced autopilot systems and intelligent cockpits, but an important part of the microscopic research on flight safety. Pilot intention plays an important role in behavior decision-making. Therefore, it is very important to introduce the evolutionary mechanism of intention into the autopilot systems. In this paper, based on the analysis of a large amount of experimental data, the ESAX method and intelligent icon theory are used to extract the combination of physiological features. Then, the crow search algorithm and extreme learning machine are combined to establish a contactless online identification model of pilot intention. Hence, the “intention generation” in the dynamic evolution mechanism of the pilot’s intention has been accurately identified online. In the theory, the research results of this paper provide new ideas for further intention identification. This study enriches the pilot intention parameter set and lays a foundation for more scholars to carry out real-time online pilot intention identification research. In application, it provides a theoretical basis for the development of “people-oriented” safety monitoring and early-warning systems. At the same time, it lays a theoretical fundamental for the study of interaction between intention and micro-features and the intelligentization of aircraft cockpits. Moreover, it provides a basis for further research on human–aircraft–environment intelligent interaction. It is of great practical significance to research the future active safety warnings for flight, pilot micro-behavior assessment, and flight safety.

Author Contributions

Conceptualization, H.W., T.P. and H.S.; methodology, H.W., T.P. and H.Z.; software, H.W. and L.S.; validation, H.W., T.P. and H.L.; investigation, H.W., T.P. and H.Z.; data curation, T.P., L.S. and H.S.; writing—original draft preparation, H.W., T.P. and H.S.; writing—review and editing, T.P. and H.S.; funding acquisition, H.S. All authors have read and agreed to the published version of the manuscript.

Funding

This work was supported in part by the Fundamental Research Funds for the Central Universities under Grant NS2020051, in part by the first batch of industry-university-research cooperative collaborative education projects of the Ministry of Education in 2021 under Grant 202101042005, the Jinfa Technology-Ergonomics Society “Human Factors and Ergonomics” project, in part by the Civil Aircraft Simulated Flight Test Data Procurement Project under Grant NNW2020-JT01-039, in part by the Research on Safety Risk Assessment Technology and Method of Human-Computer Intelligent Interaction in Civil Aircraft Cockpit under Grant U2033202, in part by the “Experimental technology research and development project” of Nanjing University of Aeronautics and Astronautics under Grant SYJS202207Y, and in part by Nanjing University of Aeronautics and Astronautics PhD short-term visiting scholar project under Grant ZDGB2021024.

Institutional Review Board Statement

The study was conducted according to the guidelines of the Declaration of Helsinki and approved by the Institutional Review Board of College of Civil Aviation, Nanjing University of Aeronautics and Astronautics.

Informed Consent Statement

Informed consent was obtained from all subjects involved in the study.

Data Availability Statement

Due to the nature of this research, participants of this study did not agree for their data to be shared publicly, so supporting data are not available.

Conflicts of Interest

The authors declare no conflict of interest.

References

  1. Boeing Commercial Airplanes. Statistical Summary of Commercial Jet Airplane Accidents Worldwide Operations 1959–2018; Boeing Commercial Airplanes: Seattle, WA, USA, 2019. [Google Scholar]
  2. Wilson, G.F. An Analysis of Mental Workload in Pilots During Flight Using Multiple Psychophysiological Measures. Int. J. Aviat. Psychol. 2002, 12, 3–18. [Google Scholar] [CrossRef]
  3. Schlimm, K.A. A Model for Situational Awareness in Aircraft Upset Prevention and Recovery. In Proceedings of the TX 15th AIAA Aviation Technology, Integration, and Operations Conference, Dallas, TX, USA, 22–26 June 2015; Volume 6, pp. 22–26. [Google Scholar]
  4. Barkhuizen, W.; Schepers, J.; Coetzee, J. Rate of information processing and reaction time of aircraft pilots and non-pilots. SA J. Ind. Psychol. 2002, 28, 67–76. [Google Scholar] [CrossRef] [Green Version]
  5. Wang, H.B.; Pan, T.; Si, H.Q.; Li, Y.; Jiang, N.Q. Research on influencing factor selection of pilot’s intention. Int. J. Aerosp. Eng. 2020, 2020, 4294538. [Google Scholar] [CrossRef] [Green Version]
  6. Zhang, L.L. Research on Motorist’s Intention Recognition for Traffic. Ph.D. Dissertation, Wuhan University of Technology, Wuhan, China, 2011. [Google Scholar]
  7. Peter, J.P.; Olson, J.C.; Grunert, K.G. Consumer Behavior and Marketing Strategy; McGraw-Hill: London, UK, 1999. [Google Scholar]
  8. Folkes, V.S. Recent Attribution Research in Consumer Behavior: A Review and New Directions. J. Consum. Res. 1988, 14, 548–565. [Google Scholar] [CrossRef]
  9. Cak, S.; Say, B.; Misirlisoy, M. Effects of Working Memory, Attention, and Expertise on Pilots’ Situation Awareness. Cogn. Technol. Work. 2019, 22, 85–94. [Google Scholar] [CrossRef]
  10. Ji, M.; Xu, Q.; Xu, S.; Du, Q.; Li, D. Proactive personality and situational judgment among civil flying cadets: The roles of risk perception and cognitive flexibility. Transp. Res. Part F Traffic Psychol. Behav. 2018, 59, 179–187. [Google Scholar] [CrossRef]
  11. Bazargan, M.; Guzhva, V.S. Impact of gender, age and experience of pilots on general aviation accidents. Accid. Anal. Prev. 2011, 43, 962–970. [Google Scholar] [CrossRef]
  12. Causse, M.; Dehais, F.; Péran, P.; Sabatini, U.; Pastor, J. The effects of emotion on pilot decision-making: A neuroergonomic approach to aviation safety. Transp. Res. Part C Emerg. Technol. 2013, 33, 272–281. [Google Scholar] [CrossRef] [Green Version]
  13. Albus, J. The engineering of mind. Inf. Sci. 1999, 117, 1–18. [Google Scholar] [CrossRef]
  14. Duda, R.O.; Hart, P.E.; Stork, D.G. Pattern Classification; John Wiley & Sons: New York, NY, USA, 2012. [Google Scholar]
  15. Degani, A.; Heymann, M.; Meyer, G.; Shafto, M. Some Formal Aspects of Human Automation Interaction; NASA Technical Memorandum; NASA Ames Research: Moffett Field, CA, USA, 2000. [Google Scholar]
  16. Heymann, M.; Degani, A. Formal analysis and automatic generation of user interfaces: Approach, methodology, and an algorithm. Hum. Factors Ergon. Soc. 2007, 49, 311–330. [Google Scholar] [CrossRef] [Green Version]
  17. Oishi, M.; Tomlin, C.; Degani, A. Discrete abstractions of hybrid systems: Verification of safety and application to user interface design. Abstr. Reformul. Approx. Int. Symp. 2003, 2371, 340–341. [Google Scholar]
  18. Oishi, M.; Mitchell, I.; Bayen, A.M.; Tomlin, C.J. Invariance-Preserving Abstractions of Hybrid Systems: Application to User Interface Design. IEEE Trans. Control Syst. Technol. 2008, 16, 229–244. [Google Scholar] [CrossRef] [Green Version]
  19. Das, S.; Matthews, B.L.; Srivastava, A.N.; Oza, N.C. Multiple Kernel Learning for Heterogeneous Anomaly Detection: Algorithm and Aviation Safety Case Study. In Proceedings of the 16th ACM SIGKDD International Conference on Knowledge Discovery and Data Mining, Washington, DC, USA, 24–28 July 2010; Volume 7, pp. 25–28. [Google Scholar]
  20. Bass, E.J.; Feigh, K.M.; Gunter, E.L.; Rushby, J.M. Formal Modeling and Analysis for Interactive Hybrid Systems. Fourth International Workshop on Formal Methods for Interactive Systems. Electron. Commun. Easst 2011, 45, 1–27. [Google Scholar]
  21. Wanyan, X.; Zhuang, D.; Lin, Y.; Xiao, X.; Song, J.-W. Influence of mental workload on detecting information varieties revealed by mismatch negativity during flight simulation. Int. J. Ind. Ergon. 2018, 64, 1–7. [Google Scholar] [CrossRef]
  22. Yang, C.; Yin, T.; Zhao, W.; Huang, D.; Fu, S. Human factors quantification via boundary identification of flight performance margin. Chin. J. Aeronaut. 2014, 27, 977–985. [Google Scholar] [CrossRef] [Green Version]
  23. Cai, Z.; Wu, Q.; Huang, D.; Ding, L.; Yu, B.; Law, R.; Huang, J.; Fu, S. Cognitive state recognition using wavelet singular entropy and ARMA entropy with AFPA optimized GP classification. Neurocomputing 2016, 197, 29–44. [Google Scholar] [CrossRef]
  24. Zhang, X.; Sun, Y.; Qiu, Z.; Bao, J.; Zhang, Y. Adaptive Neuro-Fuzzy Fusion of Multi-Sensor Data for Monitoring a Pilot’s Workload Condition. Sensors 2019, 19, 3629. [Google Scholar] [CrossRef] [Green Version]
  25. Xu, S.; Tan, W.; Qu, X. Modeling Human Pilot Behavior for Aircraft With a Smart Inceptor. IEEE Trans. Hum.-Mach. Syst. 2019, 49, 661–671. [Google Scholar] [CrossRef]
  26. Xu, S.; Tan, W.; Qu, X.; Zhang, C. Prediction of nonlinear pilot-induced oscillation using an intelligent human pilot model. Chin. J. Aeronaut. 2019, 32, 2592–2611. [Google Scholar] [CrossRef]
  27. Nandiganahalli, J.S.; Lee, S.; Hwang, I. Formal Verification for Mode Confusion in the Flight Deck Using Intent-Based Abstraction. J. Aerosp. Inf. Syst. 2016, 13, 343–356. [Google Scholar] [CrossRef]
  28. Wang, X.; Guo, Y.; Chen, C.; Xia, Y.; Liu, Y. Analysis of female drivers’ ECG characteristics within the context of connected vehicles. J. Intell. Connect. Veh. 2019, 2, 55–66. [Google Scholar] [CrossRef]
  29. Passos, H.D.S.; Teodoro, F.G.S.; Duru, B.M.; De Oliveira, E.L.; Peres, S.M.; Lima, C.A.M. Symbolic Representations of Time Series Applied to Biometric Recognition Based on ECG Signals. In Proceedings of the International Joint Conference on Neural Networks (IJCNN), Anchorage, AK, USA, 14–19 May 2017; pp. 3199–3207. [Google Scholar]
  30. Du, J.; Xu, R.; Wen, Z. A Symbolic Representation Approach of EEG Signals for Emotion Recognition. In Proceedings of the International Conference on Security, Pattern Analysis, and Cybernetics (SPAC), Shenzhen, China, 15–17 December 2017; pp. 666–671. [Google Scholar]
  31. Lin, J.; Keogh, E.; Lonardi, S. A Symbolic Representation of Time Series, with Implications for Streaming Algorithms. In Proceedings of the 8th ACM SIGMOD Workshop on Research Issues in Data Mining and Knowledge Discovery, San Diego, CA, USA, 13 June 2003. [Google Scholar]
  32. Lkhagva, B.; Suzuki, Y.; Kawagoe, K. Extended SAX: Extension of Symbolic Aggregate Approximation for Financial Time Series Data Representation. DEWS2006 4A-i8. 2006, Volume 7. Available online: https://www.researchgate.net/profile/Yu-Suzuki2/publication/229046404_Extended_SAX_extension_of_symbolic_aggregate_approximation_for_financial_time_series_data_representation/links/570b819d08ae8883a1ffa123/Extended-SAX-extension-of-symbolic-aggregate-approximation-forfinancial-time-series-data-representation.pdf (accessed on 8 May 2022).
  33. Lima, W.S.; Hendrio, L.; Bragança, D.S. Human activity recognition based on symbolic representation algorithms for inertial sensors. Sensors 2018, 18, 4015. [Google Scholar]
  34. Huang, G.-B.; Zhu, Q.-Y.; Siew, C.-K. Extreme learning machine: Theory and applications. Neurocomputing 2006, 70, 489–501. [Google Scholar] [CrossRef]
  35. Wang, Q.T. The Applications of Metaheuristic Algorithms in Discrete Location. Master’s Thesis, Nanjing University of Aeronautics and Astronautics, Nanjing, China, 2010. [Google Scholar]
  36. Askarzadeh, A. A novel metaheuristic method for solving constrained engineering optimization problems: Crow search algorithm. Comput. Struct. 2016, 169, 1–12. [Google Scholar] [CrossRef]
  37. Yang, X.S. Introduction to Mathematical Optimization: From Linear Programming to Metaheuristics; Cambridge International Science Publishing Ltd.: Cambridge, UK, 2008; Volume 6. [Google Scholar]
  38. Utomo, C.P.; Pratiwi, P.S.; Kardiana, A.; Budi, I.; Suhartanto, H. Best-Para-Meterized Sigmoid ELM for Benign and Malignant Breast Cancer Detection. In Proceedings of the International Conference on Artificial Intelligence and Pattern Recognition, Kuala Lumpur, Malaysia, 17–19 November 2014; Volume 5, pp. 50–55. [Google Scholar]
  39. Abdelaziz, A.Y.; Fathy, A. A novel approach based on crow search algorithm for optimal selection of con-ductor size in radial distribution networks. Eng. Sci. Technol. Int. J. 2017, 20, 391–402. [Google Scholar]
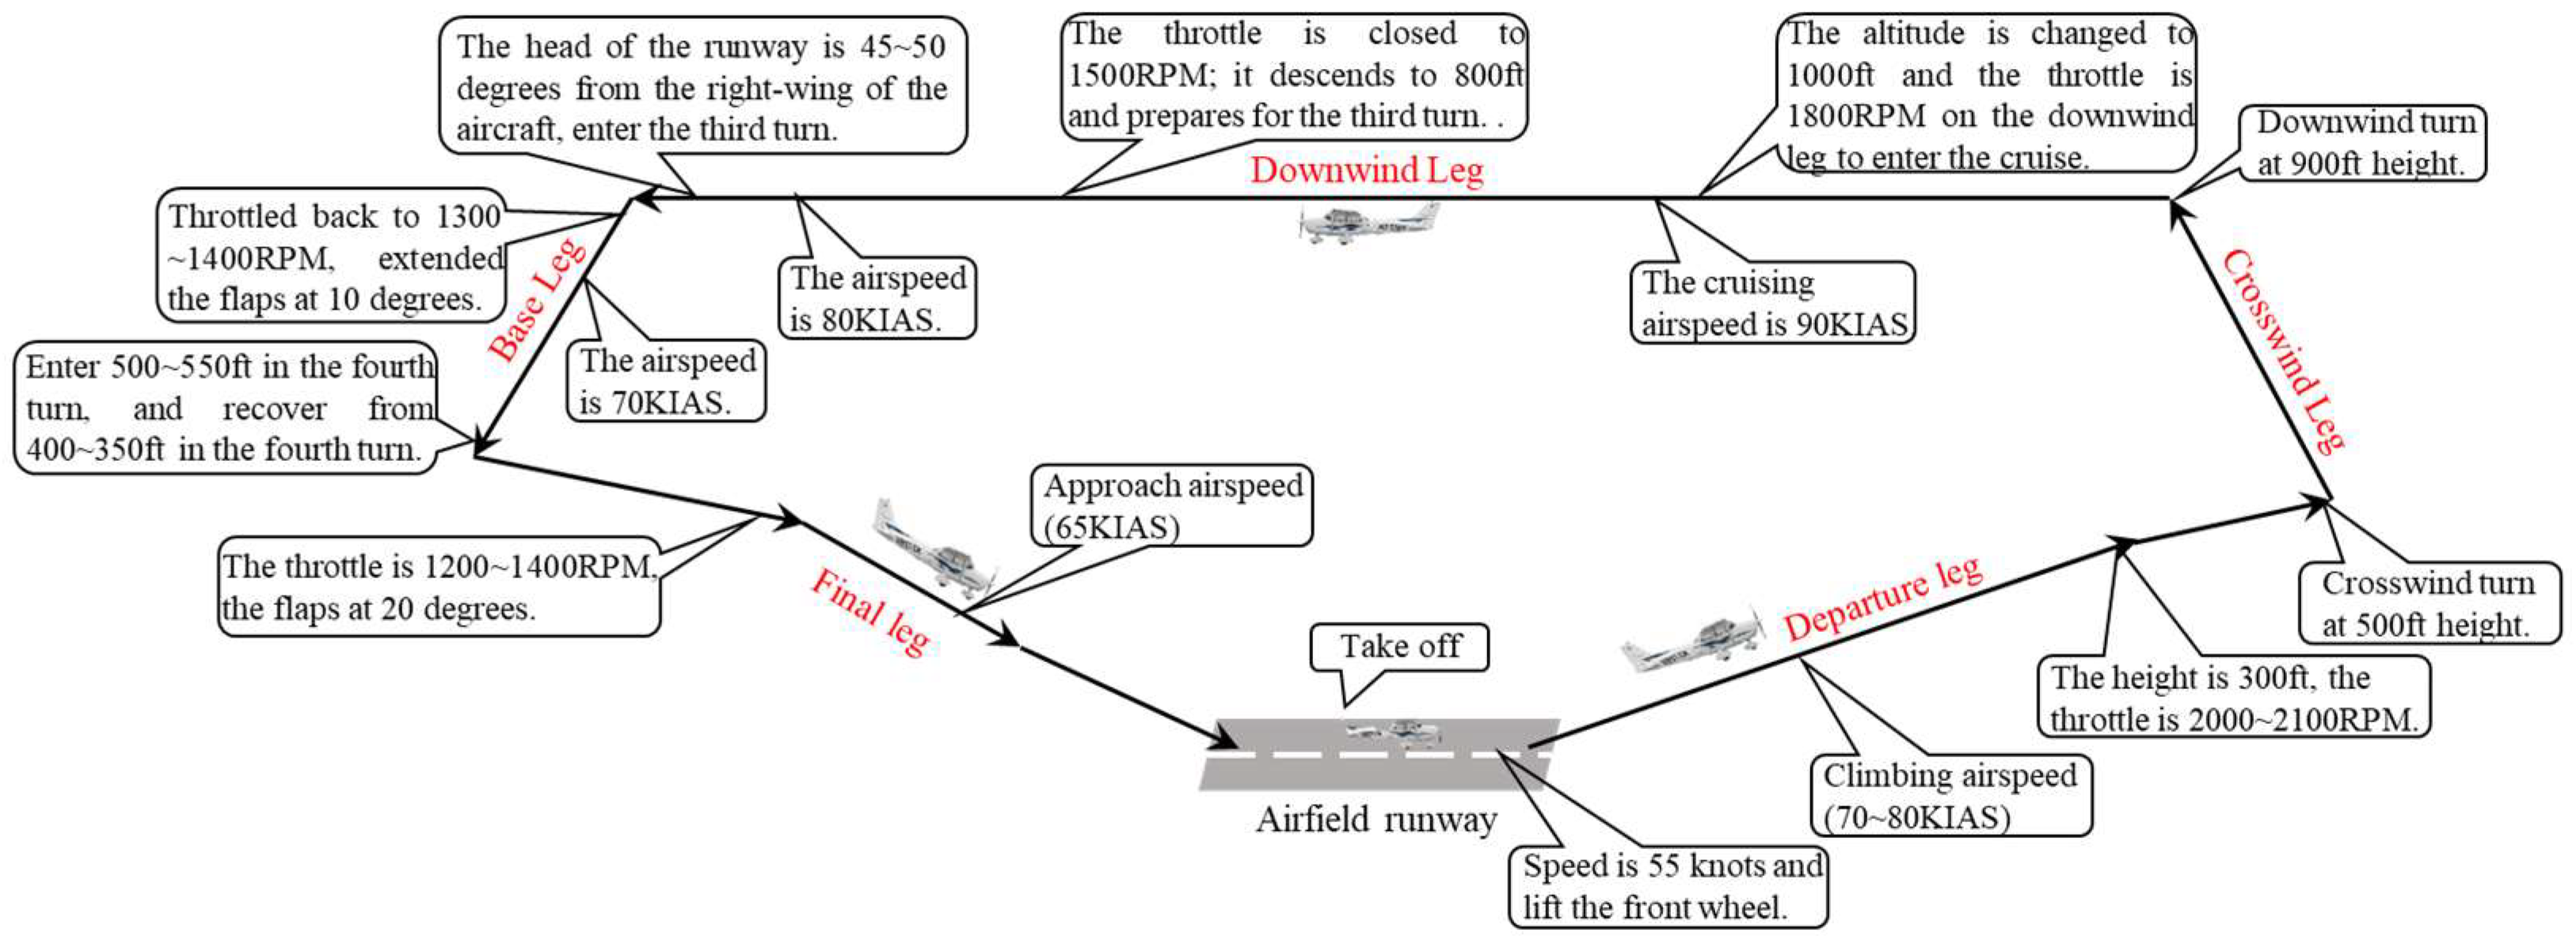
Figure 1. Flight diagram of the airfield traffic pattern.
Applsci 12 04858 g001
Figure 2. Comprehensive information acquisition experimental platform for human–aircraft–environment.
Applsci 12 04858 g002
Figure 3. Diagram of the preprocessing of characteristic signals like ECG, EDA, and RESP. (a) Diagram of ECG filtering results, (b) Diagram of EDA filtering results, (c) Diagram of RESP filtering results.
Applsci 12 04858 g003
Figure 4. Diagram of the positioning process.
Applsci 12 04858 g004
Figure 5. The flow diagram of ESAX-CAS-ELM.
Applsci 12 04858 g005
Figure 6. Discretization of physiological signal time series. (A) Electrocardiogram, (B) Electrodermal activity, (C) Respiration.
Applsci 12 04858 g006aApplsci 12 04858 g006b
Figure 7. The effect of the number of hidden-layer neurons on ELM performance.
Applsci 12 04858 g007
Figure 8. The effect of changing the AP values on CSA response. (a) AP = 0.1, (b) AP = 0.2, (c) AP = 0.3, (d) AP = 0.4, (e) AP = 0.5, (f) AP = 0.6, (g) AP = 0.7.
Applsci 12 04858 g008aApplsci 12 04858 g008b
Figure 9. Comparison chart of a pilot’s intention simulation value and measured value.
Applsci 12 04858 g009
Figure 10. Intention identification accuracy of BP, ELM, SVM, and CSA-ELM methods.
Applsci 12 04858 g010
Figure 11. The same degree of intention identification results of BP, ELM, SVM, and CSA-ELM.
Applsci 12 04858 g011
Table 1. Airfield traffic pattern control program.
Step NO.Pilot’s Control Process
1Take-off run.
2The speed is 55 knots and the front wheels are lifted.
3Climbing airspeed (70~80 KIAS).
4The height is 300 ft, the throttle is 2000~2100 RPM.
5Crosswind turn at 500 ft height.
6Downwind turn at 900 ft height.
7The altitude is changed to 1000 ft and the throttle is 1800 RPM on the downwind leg to enter the cruise. The cruising airspeed is 90 KIAS.
8When the aircraft is tangent to the head of the runway, the throttle is closed to 1500 RPM; it descends to 800 ft and prepares for the third turn with an airspeed of 80 KIAS.
9The head of the runway is 45~50 degrees from the right-wing of the aircraft, enter the third turn.
10The aircraft recovered from the third turn, throttled back to 1300~1400 RPM, extended the flaps at 10 degrees, and the airspeed is 70 KIAS.
11Enter 500~550 ft in the fourth turn and recover from 400~350 ft in the fourth turn.
12The throttle is 1200~1400 RPM, the flaps at 20 degrees.
13Approach airspeed (65 KIAS).
14After closing the throttle, the aircraft maintains a certain attitude, angle of pitch, and speed to taxi a certain distance, and then flattens (push the nose down and the aircraft flattens).
Table 2. The definitions of parameters for data preprocessing.
Type of SignalMethodNotes
EEG0.5 Hz high-pass filterFrequencies less than 0.5 Hz are filtered.
100 Hz low-pass filter
magnetic induction
Frequencies greater than 100 Hz are filtered.
EDA0.3 Hz high-pass filterFrequencies less than 0.3 Hz are filtered.
RESP100 Hz low-pass filterFrequencies greater than 100 Hz are filtered
Notes: Low-frequency signal is retained and high-frequency signal is cut off in low-pass filter [28]. High-frequency signal is retained and low-frequency signal is cut off in high-pass filter.
Table 3. The value table of break point.
β 345
α
β 1 −0.43−0.67−0.84
β 2 0.430−0.25
β 3 0.670.25
β 4 0.84
Note: The breakpoint from 3 to 5 is given in Table 3 [31].
Table 4. Performance evaluation index and calculation formulas.
Performance MetricsFormula
Precision rate TP TP + FP
Recall rate TP TP + FN
Accuracy rate TP + TN TP + FP + FN + TN
Note: TP, FN, FP, and TN are the values in the confusion matrix that reflect the model judgment in the classification problem. Among them, TP: true positive, means that the real label is “+”, and the value of the classification label is 1. FN: false negative, means that the real label is “+”, and the value of the classification label is 0. FP: false positive, means that the real label is “-”, and the value of the classification label is 1. TN: true negative, means that the real label is “-”, and the value of the classification label is 1.
Table 5. Performance metrics of the CSA-ELM model.
Performance MetricsTraining SetTesting Set
Precision rate0.82560.8226
Recall rate0.83410.8422
Accuracy rate 0.86730.8452
Publisher’s Note: MDPI stays neutral with regard to jurisdictional claims in published maps and institutional affiliations.

