1. Introduction
Maintenance of complex systems aims to keep a component/system in its nominal condition and restore that condition after a failure occurs. Until 10 or 20 years ago, the idea of maintenance as a “necessary evil” and the belief that “nothing can be done to improve maintenance costs” were common among industries [
1]. These ideas represent the pillar of the run-to-failure strategy, which imposes maintenance interventions only after a component fails. With time, it became clear that planned maintenance could have led to a notable reduction of unforeseen shutdowns, improving the productivity, the quality of both products and processes, and the safety of industrial environments while reducing the costs related to maintenance interventions and spare parts supply and management [
2]. Due to those advantages, industries moved towards preventive strategies, whose aim is to find the optimal time interval between two consecutive interventions. However, this policy may not allow the exploitation of the whole life of components, which are replaced regardless of their actual health condition [
3]. Thanks to technological advances, Condition-Based Maintenance (CBM) developed, which is considered a preventive strategy. It relies on signals collected from machines, such as vibrations, acoustic emissions, current signals, and others, to monitor the health condition of machinery at any point in time and usually arrest it when a given signal reaches a pre-defined failure threshold [
4], over which the monitored component is not able to perform its function.
Predictive maintenance (PM) can be considered a natural evolution of CBM. PM not only detects the health condition of a system but also predicts its health status in the future and estimates its Remaining Useful Life (RUL). Thus, while CBM uses only the current condition of the component, predictive maintenance also uses Condition Monitoring (CM) data trends to make predictions regarding future states and to ensure enough time to schedule maintenance interventions when most appropriate. The difference between the two maintenance strategies is shown in
Figure 1.
Predictive maintenance is often referred to as Prognostic and Health Management (PHM). According to this process, raw signals are first transformed into synthetic and meaningful information (signal processing or feature extraction); then, the relationships between the collected data and the actual condition are identified (diagnostics); finally, the end of life of the component/machinery is predicted (prognostics) [
5].
In the literature, the problem of the implementation of PHM is addressed at two levels [
6]. The first level deals with the methodology design for defining the characteristic elements of a PHM system for a specific sector, e.g., aviation, industrial, wind energy, and others. The second level concerns the architecture design for designing the best data analytics techniques for specific components and systems, e.g., rolling bearings, gearboxes, industrial robots, or Hard Disk Drive (HDD). In other words, the first level addresses the problem of how a complete PHM system can be designed for a specific context, while the second level addresses the issue of how to transform raw signals into information and knowledge for supporting the maintenance decision process.?
At the methodology level, a relevant contribution is provided by Li, Verhagen, and Curran [
7,
8,
9], who introduced an architecture definition process for PHM applications based on an ‘RFLP’ method, which consists of the definition of Requirements, Functional, Logical, and Physical architectures, together with the framework, i.e., a layered structure of a system for a set of functions in a conceptual view [
8]. Although these papers are mainly focused on the aviation sector, the ‘RFLP’ method for PHM applications can also be applied to the industrial sector. However, to the best of our knowledge, that method has never been investigated for the industrial sector. Many existing studies focus on PHM approach design for specific complex systems, such as industrial robots operating in several industrial sectors [
10] or machine-tools [
11], from the user point of view. Thus, existing studies aim to find the most suitable feature extraction, diagnostic, and prognostic models for a specific use case. However, very little attention is given to the general methodology design for machine monitoring and health assessment from the double perspective, including that of the machine producer.
At the architecture level, a relevant number of papers on the application of Machine Learning (ML) techniques for PHM have been published [
12]. In particular, critical components, such as bearings, gearboxes, wind turbines, lithium-ion batteries [
13,
14], and HDD [
15], are tested under different health conditions in order to build accurate models for fault classification and prognostic. The existing approaches assume to have a high amount of labeled data for the training phase [
16] and knowledge of all the operating conditions since they strongly affect the degradation trends or the machine’s general behavior [
17].
Thanks to the collaboration with leading producers of automatic and grinding machines located in the well-known district of the Emilia Romagna region, it was possible to understand the benefits of a PHM methodology and the issues in the implementation of the existing PHM architectures.
Regarding the first point, machine producers could benefit from a PHM methodology because the post-selling service represents the differentiation key from their competitors for many machine producers. Indeed, machine producers usually adopt traditional preventive maintenance models to schedule maintenance interventions for their clients. This strategy often implies inspections that result in either an intervention or its rescheduling, depending on the actual detected condition. In both cases, maintenance inspections represent a waste of resources for machine producers and production losses for clients. In addition, the spare parts management results are compromised. Second, thanks to the advances in technologies, corrective interventions are often conducted through remote maintenance, including the time needed for recognizing the problem before guiding the operator to the machine maintenance. Machine producers are interested in the fault behaviors of machines operating in different environments. Indeed, they can use collected information to improve the machine design phase (i.e., proactive maintenance). Thus, a properly designed PHM methodology could (1) avoid inspections and support the optimal spare parts management, thanks to the continuous monitoring and prognostics; (2) speed up the process of remote maintenance, thanks to the streaming anomaly/fault detection; and (3) allow structured data collection for the continuous improvement of existing diagnostic and prognostic models. On the other hand, clients could (1) always know the health condition of their machines; (2) recognize anomalous behaviors as they occur and, if possible, intervene without the involvement of the machine producer to reduce the time to repair; (3) benefit from a most robust analysis conducted by the machine producer.
Regarding the second point, there are two main issues. First, machine producers constantly design new types of machinery, for which historical data for model training are not available; moreover, clients are not always willing to share their data, as they feel their market share is threatened by those producers who could decide to enter the same market as their own business. In particular, they tend to hide confidential data, such as the number of pieces produced every day, machinery settings, and the production process or materials, which often represent the labels (target value) needed for training the diagnostic and prognostic models. As a result, the data collected from clients are in most cases are unlabeled, meaning that they do not record information about environmental conditions, operating conditions, fault modes (if any), maintenance interventions, or regulations carried out on the machinery. Second, the amount of data generated by machinery is difficult to manage. The weight of high-frequency data is in the order of gigabytes per hour. It is impossible to acquire and store raw signals from all machinery in a continuous way. Therefore, data are usually collected intermittently, often during short tests conducted by machine producers in very controlled environments. Thus, data under fault conditions are trickier to obtain than data under healthy conditions, resulting in very unbalanced datasets; also, the dataset may not include data for different operating conditions, resulting in the impossibility to train accurate diagnostic and prognostic models. Given these issues, the main objective for machine producers is to find a PHM architecture that (1) can start from scratch, with very little prior knowledge about machinery behavior; (2) supports the exchange of data between producers and clients, paying attention to privacy issues; (3) helps to collect the data in a structured way, with labels associated with each observation, i.e., low-frequency data associated with high-frequency data; (4) provides an early indication of anomalous and novel behaviors; (5) can learn from experience in different contexts; (6) performs different functions depending on the specific component and the whole machinery.
In this paper, a PHM methodology for the industrial field is presented. The methodology design consists of the definition of a framework and functional and logical architectures. First, the stakeholders and their requirements are identified in the machine producers; then, an edge-cloud-based framework and a novel architecture are introduced to adapt the existing architectures to the stakeholders’ expectations and the framework. Since the methodology aims to be a reference for machine producers that want to offer a complete post-selling service to their clients, after customization, it can be applied to every component and every machine, regardless of the specific sensor data and the specific industrial sector.
At the methodology level, the main contributions of this paper are the following:
The identification of the stakeholders and the definition of their requirements and expectations. To the best of our knowledge, no existing PHM methodology addresses machine producers.
The definition of an edge-cloud-based PHM framework. This allows the real-time health assessment of industrial machines and the simultaneous collection of high-frequency data, low-frequency data, and event-data, from machinery installed in several clients’ plants.
At the architecture level, the main contributions of this paper are the following:
The integration of novelty detection into traditional PHM architectures. This allows the discovery of unknown or different behaviors of the machines.
The distinction between system-level features and component-level features. The first set of features reveal the machinery operating condition (i.e., the machine setting parameters implemented by the client during production) and thus are of great interest for the machine producer to know the possible working conditions and collect labeled data. The second set of features reveals the health status and the degradation trend. Thus, it serves for anomaly detection, fault detection, and RUL prediction.
The remainder of the paper is organized as follows. In
Section 2, existing PHM methodologies, frameworks, and architectures are described. Here, techniques used to perform feature extraction, diagnostics, and prognostics are described, including anomaly and novelty detection algorithms. In
Section 3, a novel framework and architecture for semi-supervised and partially online PHM applications are introduced. Based on the design methodology described by Li, Verhagen, and Curran [
7,
8,
9], stakeholders’ expectations and requirements are first defined; then, the proposed framework and functional and logical architectures are presented.
Section 4 includes the description of a case study. The data were collected from an experimental platform built by the Department of Industrial Engineering of the University of Bologna. The study aims to demonstrate the benefits of the proposed framework and architectures, which include storage-saving and novel condition detection ability. Finally, conclusions, open issues, and the future direction of our research are presented.
2. PHM: Reference Methodologies, Frameworks, and Architectures
In this section, existing methodologies, frameworks, and architectures for PHM systems design are briefly reviewed.
From the methodology point of view, in [
8] a complete process for the PHM architecture definition is proposed. According to the authors, the first step is the definition of the stakeholders’ expectations and requirements, which represents the input of the process, together with constraints. The second step is the framework definition, which is a layered structure of the system built according to the requirements. It includes the functions, performance, operational conditions, and project constraints that will influence the architecture. Finally, three architectures need to be built: the functional architecture, which is defined as the set of functions and sub-functions that have to be performed to achieve the desired system objective; the logical architecture, which is defined as the set of related technical concepts and principles that represent the logical operation of the system; the physical architecture, which is defined as the set of physical elements, such as equipment made of hardware, software, and/or human roles, that can perform the system functions.
Regarding the framework definition, technologies such as Cyber-Physical Systems (CPS), IIoT, edge computing, and cloud computing are receiving more and more attention for PHM systems in industries [
18]. Indeed, machine producers could take advantage of these technologies for collecting the data they need, when they need them, from the machines they want [
19]. In literature, there are several examples of PHM frameworks based on these technologies. The basic idea is to exploit edge computing to perform the PHM tasks that have to provide real-time feedback while leaving in the cloud the data storage and batch analysis for more complex and accurate results. In [
20,
21], a cloud architecture for PHM is described. It consists of at least two clouds: the first one is the service provider and includes several PHM units; the second cloud offers expert service. In this way, the provider offers shared software for PHM, and the client can create its maintenance applications and methods with the tools provided by the provider; finally, storage and networking resources are available for implementing the maintenance solutions. In [
22], a framework for Edge Computing-based fault diagnosis of rotating machinery is proposed, where edge computing is preferred to global or offline approaches performed in a centralized cloud server because of the following reasons: first, it reduces the storage and computing resources in the cloud, since it realizes the data computing on the edge node; second, it avoids unnecessary data transmission, resulting in low latency fault diagnosis; third, it also allows the simultaneous dynamic control of the machinery. In [
23], a framework including both edge and cloud computing for equipment failure prediction is proposed. According to this framework, a machine learning prediction model is built based on historical data in the cloud, which has theoretically unlimited resources; then, the model is applied to new incoming data streams at the edge, which has fewer computation resources, to identify possible failures with increased responsiveness. A similar approach was adopted in [
24], where a multi-sensor edge computing architecture was proposed for wind turbine generators. To the best of our knowledge, no edge-cloud PHM framework has been designed for facilitating the data exchange and analysis between a machine producer and a machine user. In this context, the edge-cloud-based framework should allow reducing the amount of data to transmit and store; also, it should allow hiding sensitive information to the producer (which corresponds to the maintenance provider). Indeed, machinery working conditions can be strategic for the production process, and thus, clients are not willing to share this kind of information with other companies.
Regarding the architecture’s design, in [
7], a functional architecture is defined as an iterative process that consists of four steps: (1) identification and decomposition of system functions and a definition of their hierarchy; (2) identification of functional elements and interfaces; (3) the description of the functional architecture through graphic tools; (4) verification of the quality and completeness of system functions and validation of the compliance with stakeholder’s requirements. The system functions defined in that study are Data Acquisition (DA), Data Processing (DP), Fault Diagnosis Assessment (FDA), Prognostic Assessment (PA), and Health Management (HM). The DA module has the capabilities of acquiring data and temporarily storing them for further analysis. The DP model includes the data manipulation and the data transmission to the next module. In the FDA module, fault detection, isolation, and identification are performed; further, a state assessment sub-function is also included, whose results are transmitted to the HM module for decision making. The PA module consists of the sub-functions of health state estimation, RUL prediction, and health assessment, whose results will also be sent to the HM module. Finally, the HM module collects and integrates the information from the outcomes of FDA and PA modules to provide recommended maintenance advisories to an external maintenance management system.
From the architecture point of view, there are two common approaches for the PHM of components and systems, as illustrated in
Figure 2. Both start with the data collection. Then, the first approach suggests performing the DP function, which corresponds with the extraction of relevant features, revealing different health conditions of the machinery. These features represent the input for diagnostics that correspond to the FDA function. The goal is to find the relationship between the extracted features and the health condition of the equipment. Finally, the PA function corresponds to prognostics, which deal with the degradation trend modeling for future behavior estimation and Remaining Useful Life (RUL) prediction of the machinery [
4].
The second approach is similar to the first one. It includes Health Indicator (HI) construction, the Health Stage (HS) division, and the RUL prediction [
25]. The HI is a monotone function that is extracted from raw signals and reveals the component degradation. Then, the approach suggests dividing the component’s life into more HS divisions corresponding to different severity levels of the failure. Finally, the HI future values are predicted according to a pre-built degradation model; the RUL is computed as the difference between the time in which the HI is expected to overcome a pre-fixed Failure Threshold (FT) and the current time. Thus, as the authors state, the main difference between the two approaches lies in the variable time. Indeed, in the first approach, the diagnostic deals with the identification of the fault pattern and severity of machinery at a single time point, in the second approach, the HS division aims to divide the continuous degradation processes of machinery into different HSs according to the varying trends of HI in each HS.
In the following sections, techniques and models for performing the DP, FDA, and PA functions are briefly reviewed. Note that these sections do not aim for a complete review of the existing literature. Rather, the aim is to describe how the PHM system functions can be performed, with a particular focus on the needed input of each technique, their strengths, weaknesses, and use cases.
2.1. Data Processing Function
The DP function aims to process the raw data collected from machinery. This function is necessary for two reasons. First, raw signals are not able to directly reveal the health status of machinery. Rather, they present hidden patterns to discover. Second, raw signals are usually collected at very high frequencies to capture as much information as possible. However, the high number of observations and collected signals or the high number of features that result from signal processing strongly affect pattern recognition. Thus, the DP aim is to map the acquired data from a higher dimension to a lower dimension space, to provide a synthetic and meaningful representation of raw signals, preserving their structure and retaining as much information as possible [
4].
For this aim, two main activities are usually carried out, namely, signal analysis, or feature extraction, and dimensionality reduction.
When raw signals are collected at high frequencies, they are first divided into small segments of a certain length. Then, for each segment, synthetic parameters with a direct physical meaning, such as the mean, the energy, the maximum peak, and others, are computed. Signal analysis techniques are performed in the time domain, the frequency domain, and/or time-frequency domain [
26]. Signal processing in the time domain is easy to implement and requires low computational complexity. However, many critical components show characteristic frequencies for some fault modes. When the fault is known, the frequency-domain analysis is preferred, as it easily allows us to identify and isolate frequency components of interest. For non-stationary signals, whose components contain rich fault-related information, the time-frequency-domain analysis is not only mandatory but also provides a more interpretable representation of the signal. In general, these techniques can be applied separately [
25,
26,
27].
If raw signals are collected from many sensors, or a high number of features is extracted from signal processing, dimensionality reduction should be performed to reduce the number of variables of the dataset. Dimensionality reduction techniques are classified into feature selection methods and feature learning methods, depending on whether they change the original feature space [
28]. Among feature selection methods, feature ranking methods, such as the Chisquare and ReliefF [
29], and classifiers, such as the Decision Tree [
30], are used for selecting the optimal features from a set of features extracted through signal analysis techniques. These methods are usually applied to critical components, for which labeled data under operating and more faulty conditions are available.
Feature learning is projecting the original feature space into a new feature space with lower dimensionality. Among these methods, a distinction can be made between those that are applied to a set of features extracted during the signal processing phase, such as Principal Component Analysis (PCA) [
31] and Locality Sensitive Discriminant Analysis (LSDA) [
32], and those that are directly applied to the raw signal, such as methods based on sparse coding [
33], dictionary learning [
34], and Deep Learning [
35].
Feature extraction and selection algorithms suffer from three mean issues [
36]. First, they depend on prior knowledge about signal processing techniques and diagnostic expertise; second, they depend on the specific diagnostic task and may be unsuitable for other tasks; third, the extracted features may not carry the optimal information to classify the mechanical faults. Thus, the choice of one method over another depends on the component under analysis and requires deep knowledge of its behavior. Besides, signal analysis and feature selection techniques are used when it is possible to collect the data corresponding to a normal condition of the component and the data corresponding to one or more fault conditions under several operating conditions. In other words, they require the data to be associated with a label that corresponds to the health status of the machinery and which guides the search for relevant features. On the contrary, sparse representation of the signals, together with dictionary learning, can be directly applied to raw signals; also, they are adaptive methods, as they do not require any expertise from the mechanical point of view and do not require any target variables [
36]. However, both sparse coding and dictionary learning are computationally expensive and not suitable for online monitoring of machinery conditions [
33].
The DP function also includes the HI extraction. It is a feature that reveals the degradation process of a certain component or system. While features for the fault diagnosis correspond to normal and fault conditions, the HI is extracted during the whole life of the component/system, from a normal condition to the failure occurrence. To be considered a good HI, it has to respect precise evaluation criteria, such as monotonicity, failure consistency, trendability, correlation with the RUL, Mean Absolute Error (MAE), and accuracy [
37].
The HI can be extracted directly from raw signals or constructed from features extracted through the techniques described above. In the first case, the HI can be computed as the difference between signals under degraded and normal conditions [
38]. In the second case, the HI can be computed simply from previously extracted features through a proper formula [
39], through Genetic Programming (GP) algorithms [
37,
38,
39,
40,
41], or Deep Learning models [
42,
43].
In general, the HI construction strongly depends on the component under analysis [
44]. In addition, the health condition’s labels and the value of the Failure Threshold are required. On the contrary, both Deep Learning models and GP represent a great opportunity for building HIs that are less dependent on expert knowledge and the availability of labels. The issues of these models are related to the computational time for training and the input parameter setting.
2.2. Fault Diagnosis Assessment Function
Diagnosis deals with the detection, isolation, and identification of a fault; in other words, it aims to detect the occurrence of a failure, to find its component and position, and to determine its pattern and severity. In a PHM system, these goals can be achieved by identifying the relationship between the information obtained in the measurement and/or features space and the machine fault pattern in the fault space [
5]. As a pattern recognition problem, diagnostics can be faced by resorting to several Machine Learning algorithms [
45]. A broad distinction can be made between supervised methods and unsupervised methods depending on whether the value (label or class) to predict is considered at the prediction time. In the context of PHM, the class corresponds to the health condition of the component. Supervised methods require signals, or features, to be associated with a known health condition to learn the relationships that best describe observations belonging to the same class and to classify future unknown observations. Instead, unsupervised methods can distinguish observations in the data set with no prior knowledge about their belonging classes, but only based on the structure of the data itself.
In the context of PHM, ML algorithms can perform two main tasks: classification, for which supervised learning is adopted, and clustering, which is based on unsupervised learning.
Classification models learn the relationships between the extracted features and the health status of the component. They provide a model that predicts the component health status when the health condition is unknown. The development of a classification model is performed in two steps [
46]. In the first step, named training, a considerable amount of random samples is extracted from the original dataset to build the training set, which is used for deriving classification rules that match the target class to each observation included in this set. In the second step, named testing, the remaining instances, which constitute the testing set, are classified through classification rules generated in the training phase; finally, the actual target class, that is known, and the class predicted by the model are compared to assess the accuracy of the prediction. Among the most adopted classifiers for diagnostics, there are k-Nearest Neighbour (k-NN), Naïve Bayes Classifiers, Artificial Neural Networks (ANNs) [
47], Support Vector Machines (SVMs) [
48,
49], and Deep Learning models, such as Deep Belief Networks (DBNs) [
35], Deep Boltzmann Machine (DBM) [
50], Convolutional Neural Networks (CNNs), and Recurrent Neural Networks (RNNs) [
51].
There is no definite guide to a priori choose one method over another. However, in many cases, the SVM outperforms the ANN regarding the accuracy and the generalization capability [
48] and requires fewer training observations.
Clustering is an unsupervised learning approach. It can reveal hidden structures in the data without relying on a target class that guides the algorithm training. In a clustering task, a set of unlabeled data is grouped into clusters so that observations belonging to the same cluster are similar between each other and dissimilar to observations belonging to the remaining clusters. The first distinction separates hard clustering techniques from fuzzy techniques. In hard clustering, the membership of elements in a cluster is assessed in binary terms, meaning that an element either belongs to a cluster or not. On the contrary, the membership of elements in fuzzy clustering is described by a membership function valued in [0, 1], meaning that elements can belong to more clusters with a certain degree [
52]. The most common unsupervised clustering algorithms adopted for fault diagnosis are Adaptive Resonance Theory (ART) [
53], Self-Organizing Maps (SOM) [
54], and Affinity Propagation [
55].
Classification is for labeled data, i.e., when each observation is associated with a categorical target value. On the contrary, clustering is for unlabeled data, i.e., when observations are not associated with a target value. In both cases, every time a new class, i.e., a new health or fault condition is discovered, created models need to be trained again. Even if no labels are needed for unsupervised learning, most clustering algorithms still require the number of clusters as an input parameter. Thus, both approaches require the availability of the data related to all fault conditions that can occur.
Recently, to overcome these issues, anomaly detection algorithms and novelty detection algorithms have been investigated in the context of fault diagnosis, especially for streaming applications.
2.2.1. Anomaly Detection
According to [
56], anomaly detection algorithms for streaming applications should have the following characteristics: (1) they have to identify the state of the current data point before the next data point is available; (2) they have to learn continuously without storing the entire data stream; (3) they have to adopt an unsupervised approach; (4) they have to deal with the concept drift problem, which means having the ability to adapt model structures if a data point cannot be considered a true anomaly; (5) they have to identify an anomaly as early as possible; (6) they should minimize false positives and false negatives. In [
57], online data-driven anomaly detection is introduced, named ODDAD (Online Data-Driven Anomaly Detection). This algorithm adopts a sliding window method based on the Mahalanobis Distance and on a pre-determined threshold to decide whether the current data point is anomalous. In [
58], a one-class classification model named TEDA (Typicality and Eccentricity Data Analytics) is introduced, which assumes to have the label of data related to the normal condition. The algorithm uses the concepts of typicality and eccentricity. Typicality is related to the similarity of a particular data sample to an entire data set in the sense of spatial proximity, while eccentricity reflects how different a data sample is from the data group. The TEDA algorithm is fully unsupervised and does not rely on any assumption on data distribution; in addition, it is recursive, fast, and has low computational complexity. Typicality and eccentricity are calculated and updated as a new data point arrives by resorting to a distance measure. However, this requires the definition of a certain threshold to assign the label ‘normal’ or ‘faulty’ to a data point.
2.2.2. Novelty Detection
Novelty detection aims to discover new patterns in the data. Two approaches can be used to perform the novelty detection task.
The first group includes Evolving Intelligent Systems (EIS), which can handle streaming data and adapt both their structure and parameters depending on the input data. EISs can be seen as an evolution of the Fuzzy Rule-Based models (FRB), i.e., sets of linguistic statements in the form IF-THEN, where conditions and consequences are associated with fuzzy concepts, i.e., linguist terms [
59]. Evolving FRB classifiers can classify the data from scratch. Thus, they can start building the model sample by sample from the first input data. For the fuzzy partitioning of the input feature space, i.e., the identification of the antecedent part of the evolving FRB classifier, evolving clustering algorithms can be used [
60]. Evolving clustering algorithms rely on the idea that multiple clusters correspond to different system modes. As new input data arrive, the system integrates these data into existing clusters if the data are compatible with the existing model structure and adapts the local parameters of the corresponding cluster (parameter adaptation); otherwise, the algorithm creates a new cluster (structure evolving) [
61]. In [
62], a recursive clustering algorithm incorporating a drift detection method is proposed, in which the clustering updating process depends not only on the similarity measure but also on the monitoring changes in the input data flow, which gives the algorithm greater robustness with respect to the presence of outliers and noise. However, these methods require the membership function to be determined a priori. In [
63], a new way of determining the antecedent part for FRB has been introduced. The antecedent part is called the AnYa system and is non-parametric. The membership function is directly extracted from the data and represents their density and distribution. Hence, the concept of the cluster is replaced by the concept of cloud, which has no boundaries, could assume any shape, and is not represented by any centers or prototypes. Therefore, in contrast to traditional clustering methods, in AnYa there is no need to use a particular kind of distance; local and global density, which can be calculated recursively as new input arrives, are the only variables affecting the cloud shape and the point assignment process. Based on AnYa fuzzy systems, an evolving system is proposed in [
64], which can protect from the addition of new clouds based on outliers and allows removing less active and informative clouds.
The second group of approaches relies on novelty detection and diagnosis models to discover new scenarios, starting from data related to a healthy condition and some known fault conditions. In [
65], an ensemble-based classifier for novelty detection and an evolving classifier for diagnosis are separately performed for a different set of features and then integrated into a unique methodology to discover new patterns in case only data related to a healthy condition are available. In that work, a measurement labeled as ‘unknown’ can represent an outlier, a new fault, or a new operating condition. Thus, machine user intervention is required to verify which of the above cases the detected novelty refers to. In [
66], a hybrid approach for multi-modal signal analysis, novelty detection, and diagnosis, is presented. It aims at detecting and incrementally including newly discovered scenarios based on time-frequency features. In [
67], a new scenario named Initially Labeled Streaming Environment (ISLE) is defined. It is characterized by an infinite verification latency, meaning that no labeled data are received after initialization. In this context, the authors developed a new algorithm, named COMPOSE, which learns drifting concepts from a streaming and non-stationary environment that provides only unlabeled data after initialization. An application to fault diagnosis of COMPOSE is introduced in [
68]. Based on the resulting framework, gradual and abrupt changes are detected; then, a classifier is updated to include a new class, and a feature set is selected for representing the new class. However, this framework still requires the classifier to be trained on labeled data.
2.3. Prognostic Assessment Function
Prognostics concerns the future behavior of a system and aims to anticipate the occurrence of a failure and predict its Remaining Useful Life (RUL). The RUL is a measure of the time left before machinery loses its operational ability and serves to avoid undesired or even catastrophic consequences. Prognostics can be conducted at three levels [
69]: existing failure mode prognostics, future failure mode prognostics, and post-action prognostics. At the first level, the RUL and its confidence limits are computed for each failure mode identified in the previous diagnostics step. At the second level, interactions between different failure modes are considered and models describing such secondary failures are developed to build the worst-case scenario for the component under analysis. At the third level, relationships between the developed models and the maintenance actions that have been/could be undertaken to prevent failures are evaluated.
The degradation process identification and the RUL estimation are carried out by resorting to three approaches: physics-based, data-driven, and hybrid.
Physics-based approaches build mathematical models that quantitatively describe the degradation process based on failure mechanisms or first principles of damage. They use the CM data to identify model parameters and predict future behavior. The fundamental hypothesis of this approach is the existence of a physical model describing the degradation evolution. If so, then the future behavior is determined by progressing the degradation model in the future.
Data-driven approaches only rely on historical data collected by sensors to identify the degradation evolution and predict the future trend. These approaches build mathematical models, whose coefficients are estimated and updated based on the training data (previous usage conditions), that represent the relationships between input variables (the HI) and the output (the degradation state). The prediction is based on the estimated coefficients and the mathematical model. Data-driven models for prognostics can be classified into statistical and stochastic models [
70,
71], such as the Wiener Process [
72] and Markov models [
73], Machine Learning models, such as ANNs [
74] and SVM [
75], and Deep Learning models [
76].
The main advantage of physic-based approaches lies in the direct physical meaning of the model output. They outperform data-driven models, since they achieve highly accurate RUL estimation, especially for long-term predictions [
77]. Although data-driven models are easy and fast to implement, they heavily depend on the availability of a large amount of robust data. In addition, a huge storage capacity is required, and the correlation between the extrapolated trend and a specific failure is not guaranteed [
78]. The obtained results from data-driven models are not easy to interpret since they are not related to any physical phenomena and are usually less precise and more computationally expensive than physics-based models. On the other hand, physics-based models are hard to build, especially for complex systems.
Hybrid approaches combine physics-based models and data-driven models, improving prediction accuracy. Furthermore, hybrid approaches guarantee a reliable prognostic at both component and system levels. A review on typical hybrid approaches for prognostics and RUL prediction can be found in [
79].
3. The Proposed PHM System
In this section, the stakeholders’ requirements are introduced. Then, the proposed framework and functional and logical architectures of the PHM system that meet the stakeholders’ requirements are described.
3.1. Stakeholders’ Expectations and Requirements Definition
According to [
10], the first step for the stakeholders’ expectations and requirements definition is to identify the stakeholders. In the present study, the stakeholders are the industrial machine producers. They are interested in the implementation of a PHM methodology for machines installed at their clients’ plants since it is an opportunity for offering a full maintenance service to their clients, for optimizing the spare part-supplying process, and improving the machine design phase. Besides, machinery users could benefit from a PHM system since they can reduce maintenance investments and improve productivity and availability.
Stakeholders requirements, collected through interviews conducted with several machinery producers operating in the North of Italy, can be summarized as follows:
A PHM system should allow the simultaneous monitoring of machines distributed worldwide. Producers want to gather relevant data from installed equipment to expand their knowledge about the machinery’s behavior during the actual functioning. In addition, the remote monitoring of the health conditions of machinery would avoid inspections; hence, the scheduling of maintenance interventions and the spare parts management are improved. This requirement implies building a proper infrastructure for real-time data collection, transfer, and analysis.
A PHM system should be able to detect novel behaviors and learn from new incoming data. Machine producers do not have sufficient data for training ML models because of the scarce possibility to conduct tests in their plants. The main issue is the lack of knowledge of all possible working conditions. Besides, many components fail after years of functioning, making it difficult for the real-time application of pre-built prognostic models.
A PHM system should allow the collection of the data in a more structured way. Even if machine producers can obtain historical data from their clients, these data are not easy to process since the label (e.g., health status, implemented setting, and so on) is hardly available and signals often present uncomprehensive trends. Low-frequency data, e.g., the setting of the machinery, and event-data, e.g., the tuning made by operators or the anomalies that occurred during the machine functioning, should be collected together with high-frequency data. Hence, data are automatically labeled, and every event affecting the trend of collected data is recorded, speeding up the data pre-processing step.
A PHM system should accomplish various functions based on a specific component, which means that functions should be performed separately depending on the analysis goal. A complex machine consists of many elements, e.g., suckers, or sub-systems, e.g., an extruder, for which various analyses may be helpful. For example, an extruder’s screw degrades over time, and the goal is to predict its RUL. Instead, the detachment of a sucker happens suddenly. Thus, the goal is to detect the anomaly. Hence, the real-time analysis should consider these two components separately to understand the problem’s cause and, if possible, let the machine operator intervene as soon as possible. However, as long as these two components work simultaneously under the same operating conditions, machine producers are also interested in how the anomalies or failures affect each other, considering a given working condition.
A PHM system should allow the CM data integration with historical data usually recorded in an external database (e.g., Computerized Maintenance Management System—CMMS), collecting work orders, spare parts management, and other information to develop a whole maintenance program. For machine producers that want to provide their clients with full-service maintenance, this is extremely important for internal optimization.
Table 1 shows the elements of the framework and architectures that can address each requirement. In the following sub-sections, each element will be investigated in detail.
3.2. The Framework
In this section, a framework to address the stakeholders’ requirements is proposed. The framework consists of three layers: the edge storage and analytics layer, the cloud storage and analytics layer, and the knowledge integration layer, as shown in
Figure 3.
The edge storage and analytics layer is a network of unlinked edge nodes installed close to the machines. Here, data processing (i.e., feature extraction and selection, HI extraction) and real-time analytics are performed (i.e., operating condition recognition, anomaly detection, RUL prediction), allowing the continuous monitoring of machines. In particular, the edge layer provides machine users with information regarding the health status of the equipment at any point in time. From the machine producers’ point of view, this level also allows the collection of low-frequency data and event data, addressing the first and third requirements. Indeed, the reduced amount of data obtained from streaming data processing allow producers to monitor several machines. When they need to know the health condition of a given component, they can access the information extracted at the edge node during the machine’s functioning (i.e., features and HI values). Here, the current health condition and the implemented setting, the information related to the occurrence of anomalous behaviors, setting changes, and activities carried out by the operator on the machine are temporarily stored. Finally, sensitive information (such as the parameters that determine the machinery setting) is hidden from the producer since only processed data are accessible. At this level, there is no information aggregation. Results of data processing and real-time analytics are shown for each component of the machine so that the machine user can easily recognize where the anomaly is and intervene when necessary to restore the correct functioning. On the other side, the machine producer can select the component of interest. In addition, as the setting is also recorded, the data related to each component under different operating conditions are separated, i.e., there is a label representing the implemented setting. This way, the fourth requirement is fulfilled.
The cloud storage and analytics layer represents the link between users and producers. In this layer, relevant information extracted at each edge node through streaming analysis is stored permanently. This information includes labels on the operating condition, component-level features, system-level features, Health Indicators, and the RUL of each component. These data are integrated with historical data to train diagnostic and prognostic models, which will be applied at the edge during machinery functioning for real-time inference. At this level, which is only accessible by the machine producer, it is possible to aggregate the information depending on the analysis objective (component-level, system-level, client-level). In the last case, the producer can use this information for building an optimal maintenance plan in terms of time and human resources. In other words, this layer allows addressing the second producer requirement.
Finally, in the knowledge integration and decision-making layer, the PHM system is integrated with existing offline databases, e.g., CMMS. At this level, information related to the available resources, their cost, and scheduled maintenance interventions on less critical components (e.g., preventive maintenance) is integrated with data collected through the PHM system to have a global vision of maintenance activities and their costs. This results in optimized scheduling of the maintenance interventions and production, as long as the spare parts production can be triggered when necessary. Finally, the most critical components, or activities, can be identified, giving the possibility to better design both the machine and the maintenance service.
The definition of the physical architecture, i.e., the set technologies for the communication between layers, is not the main topic of the present paper. However, one can consider the architecture model presented in [
80] and [
81] as a possible guideline for the physical implementation of the proposed framework.
3.3. The Functional Architecture
The functional architecture includes all the activities within the framework that fulfill the defined requirements of machine producers.
The proposed functional architecture is shown in
Figure 4. The functions have the same objectives as those introduced in [
8], i.e., DA, DP, FDA, PA, HM. However, some modifications based on the previous observations and producers’ requirements are here proposed.
First, the DP function is split into two sub-functions: the system-level feature extraction and the component-level feature extraction. The former deals with the extraction of system-level features, which can reveal the machine operating condition. The latter deals with the extraction of component-level features that can reveal the health condition of the components. In particular, component-level features can be used for two aims: diagnostics and prognostics. In the first case, the features allow establishing if a fault condition has occurred. In the second case, the features are HIs and allow us to predict the RUL of the component. These sets of features change from one component to another. Thus, they need to be selected and computed for each critical component of the machine.
Second, the Operating Condition Recognition (OCR) function is introduced between the DP function and the FDA. In general, the producer wants to know the machine’s working condition at any point in time. The operating condition can be known or unknown. If data collected during the machine functioning under one setting are available, then it means that the setting is known and the data can be used for diagnostic and prognostic model training. Thus, the so-built predictive models can be applied to make inferences on streaming data. Otherwise, if the operating condition is unknown, the collected data cannot be associated with a specific setting. Hence, existing models cannot predict the operating condition with high accuracy. However, these data can be assigned to the same unknown group that corresponds to the same novel situation. Then, the new group can be used to train the existing models and include the new class. Hence, the OCR function aims to recognize the setting under which the machinery works at any point in time. It can be seen as a novelty detection problem. Its output is system-level information that determines the choice of existing predictive models. Thus, it can also be considered a function that automatically labels the collected observations as belonging to an existing class or novel behavior.
Finally, the proposed functional architecture also includes anomaly detection in the FDA and PA functions. In the first case, an anomalous behavior could correspond to a sudden or unknown fault, while in the second case, the irregular behavior could mean that the component started a new HS. Thus, it can be considered as the point for starting the RUL prediction [
82].
3.4. The Logical Architecture
The definition of logical architecture aims to explain the relationships between functions and the data flows within the framework layers.
The proposed logical architecture is shown in
Figure 5. The DA function is performed continuously at the edge to read, collect, and temporarily store streaming data as the machine works. Then, when a signal segment of a pre-defined length is stored, the DP function is activated to extract the system-level features and the component-level features. The length of the signal segment depends on the task that will be performed, the maximum accepted latency of the inference, and the data transmission. Therefore, the time instant in which each sub-function of the DP is activated may be different. The activation of the DP function implies the extraction of relevant features from raw signal segments; then, the OCR function is triggered to assign the label “known” or “novel” to the system-level features.
If the operating condition is known, then the FDA and the PA function are activated. The FDA aims to recognize abrupt faults (for instance, the detachment of a sucker). Thus, a model trained in the cloud assigns to the current observation a label among the known fault classes. At the same time, the signal batch is eliminated from the storage memory of the edge device; in addition, in the FDA function, anomaly detection is also performed. It requires the same input as the classification models (i.e., component-level features). However, it aims to detect unknown faults, i.e., faults not considered during the training of the models for diagnostics. The PA function aims to recognize degradations occurring during the machine functioning (for instance, the wear of a screw). Thus, a pre-built degradation model (which may depend on the implemented setting) is used to predict the future values of the HIs in order to compute the RUL of the corresponding component, based on pre-defined Failure Thresholds (FT). However, the degradation begins after several hours of machine functioning for many components; moreover, the computation of the future values of the HI and the RUL prediction would be expensive from the computational point of view. For these reasons, anomaly detection is also applied to the HIs to detect the degradation starting time. Thus, the RUL is computed only when an anomaly is detected.
If the OCR function identifies a novel operating condition for the current observation, a new cluster is created. In this case, since the setting is novel, neither classification nor degradation models are available. However, anomaly detection can be applied to component-level features to detect anomalous behaviors that may represent a symptom of problems in the corresponding component.
All the above-described activities are conducted at the edge. Now, the extracted feature vectors and the associated labels assigned by the streaming application of prediction models are transmitted to the cloud. Here, data related to known conditions (anomalies, fault classes, and RULs) are stored in a permanent database to help producers to make decisions about maintenance interventions and the supply of spare parts. Instead, the data associated with novel conditions are used to re-train diagnostic and prognostic models. For this reason, the DA, FDA, and PA functions are also included in the cloud. Here, the DA function aims to acquire the data in different moments, depending on the data type. When the condition is known, the detection of a fault or anomaly triggers the transmission of the predicted fault class and the predicted RUL value to the cloud, so that the producer can react as soon as possible. When the condition is unknown, or no anomalies or faults are detected under known conditions, the data transmission occurs at fixed moments, such as at the end of a shift or during the machine’s set-up. The data transmitted in these cases are the extracted feature vectors and the associated label (belonging class and RUL).
4. Case Study
The case study is conducted on data collected from an experimental platform built in the Department of Industrial Engineering of the University of Bologna, shown in
Figure 6. The case study wants to show the potential of the proposed PHM architecture for industrial equipment, in terms of (1) the ability to recognize setting changes with no training for all possible settings; (2) the ability to detect abrupt faults; (3) the ability to save memory storage space. In other words, the main goal of the case study is to address the requirements from industries listed in
Section 3.1, in particular those listed in points 2, 3, and 4, by using the additional functions of the proposed framework listed in
Section 3.3.
The platform is composed of an asynchronous motor, a gearbox made of two pulleys that exchange the rotation through a belt, two shafts that share the motion thanks to a couple of gears, an electromagnetic brake. The three-phase electric motor has eight poles with power equal to 0.13 kW and rotation speed equal to 660 rpm. The motion is transmitted to the first shaft through the belt running on the pulleys and placed under tension thanks to a screw-system positioned on the motor’s support. A steel disk is attached to the second shaft to simulate a load on the centerline using a key and an o-ring. The braking system consists of an electromagnetic dust brake with adjustable braking torque in the range of 0–7.5 Nm and a 90 VDC command control fed by a transformer. The platform contains three accelerometers and a pyrometer. Three Dytran 3093D3 triaxial accelerometers with IEPE technology are placed on the bearing’s support, next to the second pulley and the two gearboxes. They have a sampling frequency of 12.8 kHz per axis and an acceleration range of 500 Gpeak. An OPTRIS CSmicro infrared sensor placed near the second pulley measures the pulley or the belt’s temperature at a sampling frequency of 1 kHz. Regarding the data collection system, the acceleration sensors are connected to a computer through three-channel NI9230 I/O modules with a maximum sampling rate of 12.8 kS/s for each channel mounted on a four-slot NI 9274 chassis that collects all the data from the accelerometers before sending them to the computer through a USB connection. A data acquisition interface is placed in the pyrometer’s cable, and temperature measurements are collected using the plug-n-play software CompactConnect supplied by the Optris company.
The case study consists of two steps. First, few training data are employed to extract and select relevant features for condition recognition and abrupt fault detection (training). Then, novelty detection and anomaly detection algorithms are tested on streaming data, which were collected under two known operating conditions and two unknown operating conditions, until a sudden fault occurred in the electric motor at the end of the last experiment. Training data consisted of two different operating conditions with different braking torque values (
Table 2).
The training phase consists of the extraction and selection of the most relevant features for the specific goal, i.e., condition recognition and fault detection. Thus, each vibration signal is divided into segments of 1 s, and, the most typical features in the time domain, i.e., peak, peak-to-peak, mean, RMS, Crest Factor, Skewness, Kurtosis, Shape Factor, and Impulse Factor, are extracted for each segment,. In total, 81 features are extracted, nine for each acquired signal. As an example, the nine features extracted from the first signal (axes x of the first accelerometer) are shown in
Figure 7.
Then, the most relevant features were selected according to the aim:
For the operating condition recognition (OCR) goal, the mean values of the signals 4, 6, and 8, which correspond to the x and z axes of the second accelerometer and the y axes of the third accelerometer, respectively, were selected, as they best distinguish the two settings (
Figure 8a).
For the fault detection goal, the impulse factor of signal 2 (y axis of the first accelerometer) was selected, as it was independent of the implemented setting (
Figure 8b).
Then, the novelty detection algorithm was trained on extracted features to initialize the parameters of known conditions. The novelty detection consists of two parts:
The anomaly detection algorithm, which determines if a point is normal or anomalous according to the algorithm developed in [
83]
The clustering algorithm, which is inspired by the clustering algorithm developed in [
84]. It automatically assigns the current point [
58]:
- a.
To the current cluster if the feature vector does not determine a change in the system’s state (from normal to anomalous and vice versa).
- b.
To an existing cluster if the feature vector determines a change in the system’s state and is considered similar to a known operating condition.
- c.
To a novel cluster if the feature vector determines a change in the system‘s state and is far from all existing clusters.
The results of the novelty detection algorithm trained on the first set of features (for the OCR task) and the second feature (for the abrupt fault detection) are shown in
Figure 9 and
Figure 10, respectively.
As expected, for the OCR task, the algorithm creates two clusters. In
Figure 9, the blue dots correspond to the first setting, while the orange dots to the second one. Note that anomalies, represented by red crosses, that do not determine a system’s state change and are assigned to the current cluster can be considered measurement errors or anomalous peaks in the signal. For the fault detection task, only one cluster was created (it is represented by black dots in
Figure 10). Hence, the extracted component-level features are not sensitive to the setting change and are thus appropriate for the FDA task.
At this point, the extracted feature matrix containing labeled observations belonging to two different classes is stored. These data can be used to train classification models. Local parameters of the created clusters are also stored. They are used when the algorithm is executed in streaming to initialize the clusters that correspond to the known machinery settings.
Finally, the algorithm is executed in streaming. During the experiment, four settings were implemented. Setting values are summarized in
Table 3. In particular, the first two settings are the same as those in the previous training phase. At the end of the fourth experiment, a motor fault occurred.
Table 4 shows results for the OCR task. Points belonging to settings 1 and 2 are correctly assigned to the initialized clusters. The algorithm detects the second setting change after 15 s and the third setting change after 10 s. However, the fourth setting is not detected (
Figure 11).
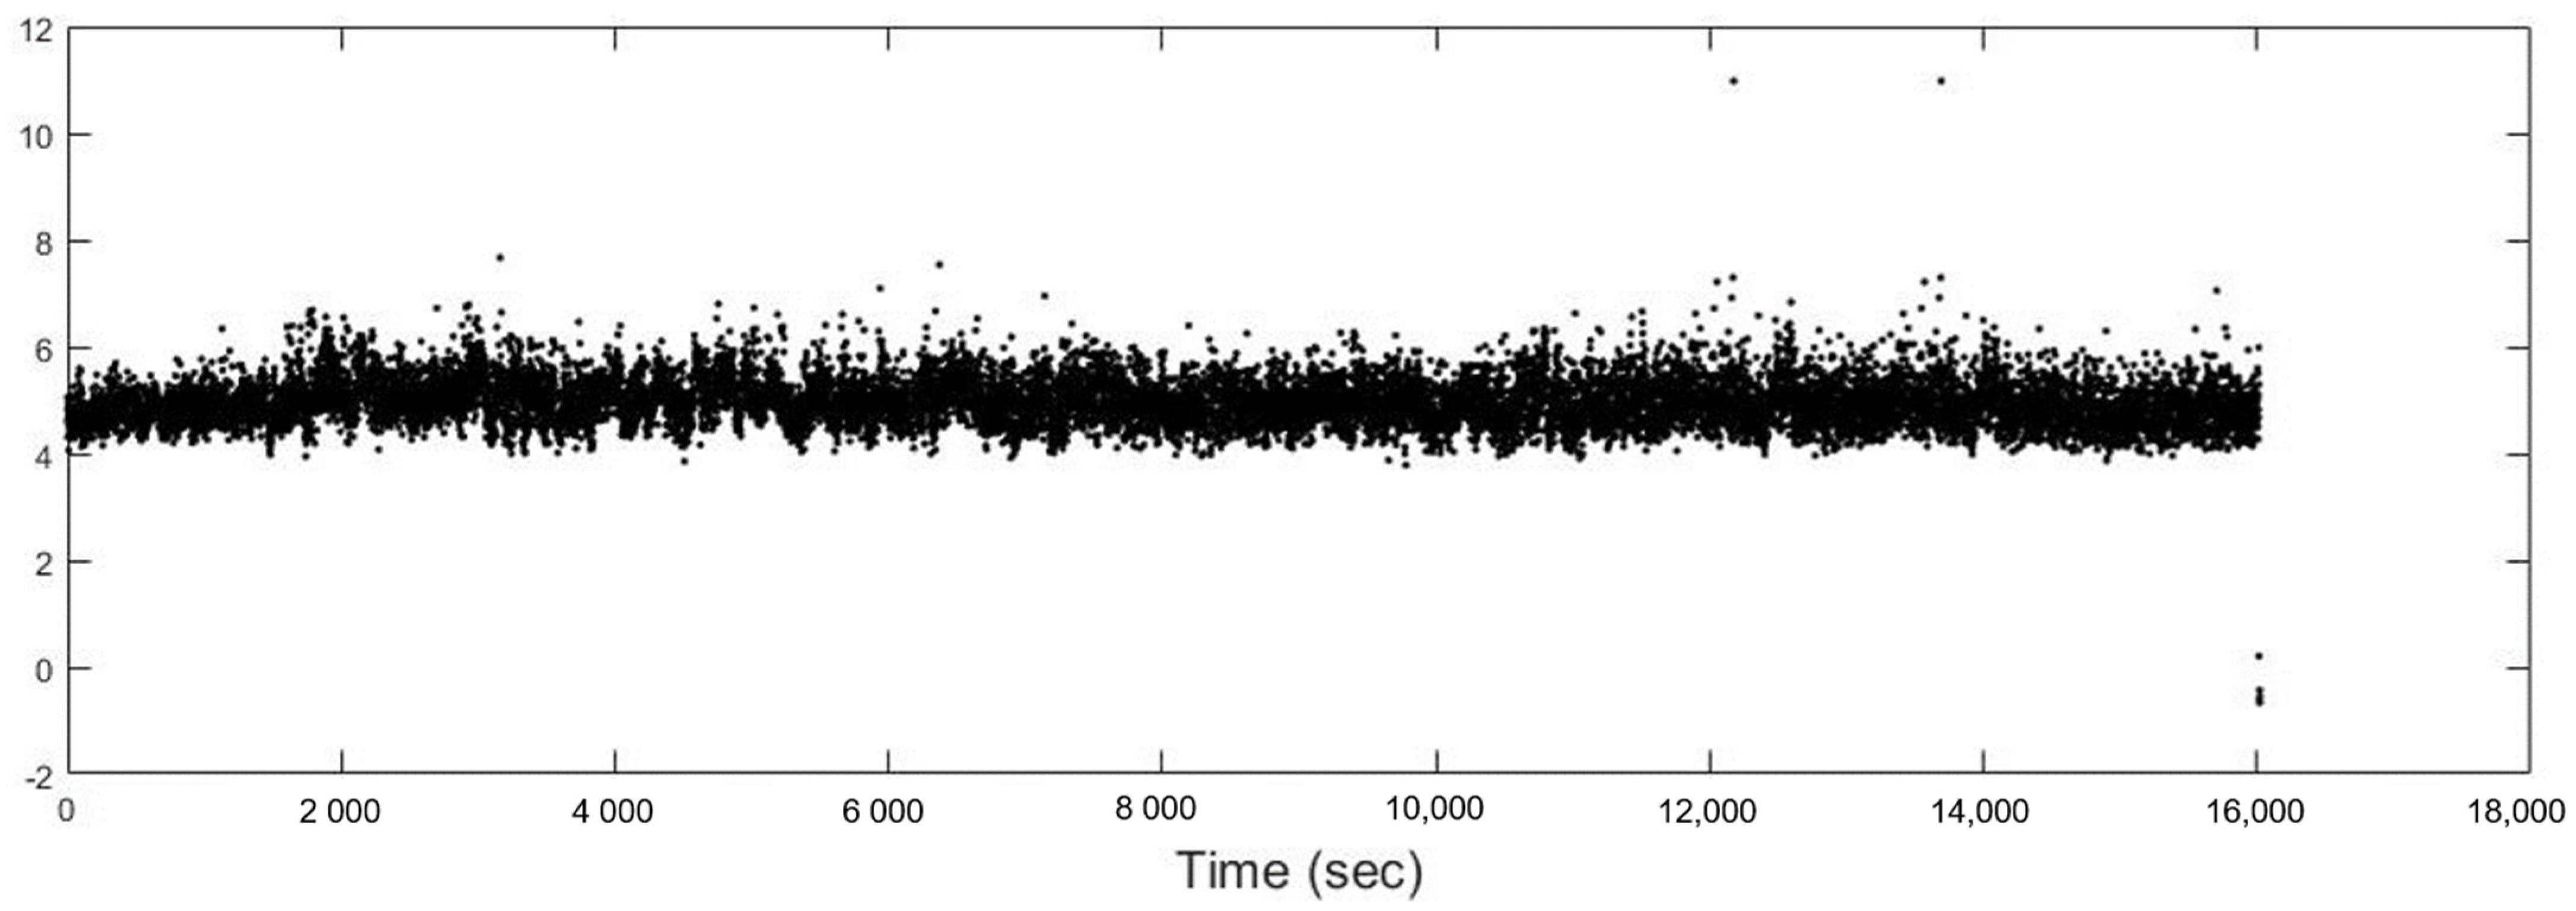
Table 5 shows results for the fault detection task. The system breakdown occurred after 1548 s (25.8 min) from the fourth operating condition starting. The novelty detection algorithm implemented for the impulse factor (extracted from the
y-axis of the first accelerometer) creates two clusters. The first one is created after 168 s (2.8 min) after the fourth setting change (yellow dots in
Figure 12), while the second cluster is created after 1455 s (24.25 min), which correspond to 90 s (1.5 min) before the system breakdown. If an alarm was triggered at the second cluster creation time (named Fault (1) in
Table 5), the system breakdown could have been avoided; cluster 2 could have been labeled as faulty, and classification or regression models could have been trained for future applications.
Besides the performance of the condition recognition and abrupt fault detection, there is an advantage from the data quantity point of view. Indeed, according to the proposed architecture, raw signals are stored and transmitted to the cloud only when a new condition (both operating and fault) is detected. Otherwise, only the extracted feature matrix, together with the label, is stored.
Table 6 shows results in terms of gigabytes saved. The weight of raw signals is 18.19 Gb. When the operating condition is known, only the features matrix is stored. Thus, only 5.73 Gb are required. In total, a saving of 68.5% of the storage space is obtained. Note that the weight is referred to as the MATLAB variables (extension .mat). In addition, as the algorithm works on streaming data at the edge, the latency of data transmission is not to be taken into account.
Discussion
In the previous section, we proposed a case study to validate two main parts of the proposed framework. In particular, we used streaming novelty detection and anomaly detection algorithms to perform the OCR and FDA functions. This section summarizes the major outcomes, which are evaluated concerning the stakeholders’ requirements (
Section 3.1).
First, the recognition of the implemented setting would not ideally require data for training. By using an incremental and unsupervised novelty detection algorithm, it is possible to start from scratch. Indeed, the first cluster is initialized when the first observation is available. Thus, the algorithm recursively evaluates if the current point is “similar” to the previous point or points belonging to other clusters and assigns it accordingly. Otherwise, a new cluster is created, which will include all the similar observations. Note that the algorithm can initialize more novel clusters. Assuming that each cluster corresponds to a setting, the algorithm corresponds to automatic observation labeling. In the described case study, we initialized two clusters (Cluster 1 and cluster 2), as we were supposed to know the trend of the features in two operating conditions. By extending the streaming analysis to the other two unknown operating conditions, we demonstrate that each observation belonging to a known setting is correctly assigned to the corresponding cluster, a new cluster is created when the third operating condition occurs, and all observations are then correctly assigned to this new cluster. The setting change is detected in 10–15 s. Hence, only 10 or 15 observations will have the wrong label.
The second outcome of the presented case study consists of abrupt and unknown fault detection through an anomaly detection algorithm. As no other fault classes were available, no diagnostic model was trained for the real-time inference. However, the anomaly detection algorithm recognizes an anomalous behavior 95 s before the actual fault. Although 95 s are not enough in real industrial applications, an alarm would allow the operator to double-check the machine and eventually stop it. Besides, if the fault would not cause the machine arrest, but just quality issues, then the anomaly would be an alarm for the machine operator, who can intervene for proper tunings. From the producer’s point of view, the observations labeled as anomalous make it possible to build a diagnostic model that can recognize the start of a warning Health Stage (Cluster 2) before motor failure [
17].
Finally, novelty detection and anomaly detection are not sensitive to point anomalies. An important aspect in PHM industrial applications is represented by false alarms [
85]. The integration of anomaly detection and clustering makes it possible to generate an alarm only when the current observation is assigned to a distinct cluster of the previous point instead of when an anomaly is detected. In the OCR function, anomalies are detected more than 12 times (
Figure 11). However, only two anomalies correspond to an actual setting change. Indeed, the number of times in which a cluster is created is exactly two.
In addition to the performance of the implemented algorithms, there are other aspects to highlight.
First, the extraction of two different feature sets (system-level features and component-level features) allows performing two distinct functions of the framework: the OCR and the FDA. The ability to recognize which setting is implemented (known or unknown) is a considerable advantage for the machine producer. Indeed, he or she can collect the data under several operating conditions (that he or she cannot know a priori). Hence, he or she can train supervised models for diagnostics and prognostics and evaluate how the specific setting affects the components’ health conditions. In addition, since the machine setting can be known in real-time, more diagnostic and prognostic models for each setting can be trained and selected for the real-time inference. In other words, the OCR function performed at the edge using a novelty detection algorithm allows fulfilling the requirements 2, 3, and 4. In the described case study, manual feature extraction and selection was conducted, as the investigation of the best kind of feature extraction and selection algorithm was not the scope of the paper. However, different approaches can be used to improve the relevance of the features depending on the goal (i.e., Genetic Programming).
Second, the feature extraction and labeling performed at the edge allows the collection of a larger amount of data. As demonstrated by the case study, 68.5% of the memory storage is saved by sending to the cloud only “processed” data. Besides, not all data have to be transferred to the cloud in real-time. Thus, the issues related to the bandwidth and latency are reduced.
5. Conclusions
In this paper, a novel framework based on an edge-cloud infrastructure and novel functional and logical architectures for a semi-supervised and partially online PHM applications to industrial equipment is introduced. It aims to address the requirements collected from machine producers through several interviews. The motivations behind the paper are the great interest in PHM systems shown by companies that produce machines for several industrial sectors, such as packaging and pharmaceutical industries. Major industrial requirements are related to the difficulties in data collection.
To address these issues, an edge-cloud-based framework is introduced. The idea is to compute streaming analysis at the edge node installed on users’ machines. Then, data extracted from edge nodes are sent to the cloud through proper policies, and the cloud is accessible only by the machine producer. Here, he or she can gather data of better quality, increasing data availability and reducing their quantity. Indeed, raw signals are processed at the edge, and only relevant information (features) are transmitted to the cloud. In addition, the two layers of the infrastructure allow differentiating the information shown to the client and the producer so that confidential data can be protected.
Given the framework, novel functional and logical architectures are also introduced. Contrary to existing PHM frameworks in other sectors, the proposed functional architecture includes the Operating Condition Recognition (OCR) function, which uses a novelty detection algorithm to discover new settings as new data are available. In addition, the proposed architecture also includes the feature extraction at two levels: system-level features, which feed the OCR function, and component-level features, which feed the Fault Diagnosis Assessment (FDA) function and the Prognostic Assessment (PA) function, where models trained on the available data in the cloud are used to make inference on streaming data. Finally, anomaly detection algorithms are also applied to component-level features to detect abrupt faults and determine the RUL prediction trigger point.
A case study shows the potential of the proposed functional framework. The study focuses on the OCR function and abrupt fault detection. Vibration signals are collected from an experimental platform under two operating conditions. During the training phase, system-level features and component-level features are extracted and selected. Then, the system-level features are used as input of the novelty detection algorithm (OCR function) to obtain local parameters of the clusters corresponding to the known operating conditions while component-level features are used for the fault diagnosis and detection (FDA function). Finally, the methodology is implemented for streaming data, collected under four different operating conditions, two known and two unknown. At the end of the experiment, an abrupt fault also occurred. Results show the proposed architecture recognized the setting change in three out of four cases with a maximum latency of 15 s. In addition, it detected two anomalous behaviors 1380 s and 90 s before the occurrence of the failure. Finally, as only features are sent to the cloud when the machinery behavior is known, the space needed for keeping these data in memory was reduced by 68.5%.
Despite the advantages of OCR and abrupt fault detection, there are some limitations of the proposed methodology.
The first limitation is related to the system-level feature extraction. For the case study, the data were collected under stable conditions. This means that components such as gearboxes were not subject to any degradation during data collection. However, when a gearbox degrades, the vibration level increases. Hence, the values of the extracted features in a specific operating condition may be different depending on whether degradation occurs. In other words, with the selected features, the streaming algorithm may detect a changing behavior of the system and create a new cluster or wrongly assign the current point to another existing cluster. Hence, future research should be dedicated to the investigation of the system behavior under different operating conditions while one or more components are subject to degradation. In particular, future works should aim to construct system-level features whose values remain in a given range when the system works under the same operating condition even if its components are degrading. A promising tool to construct the features that respect this property is represented by Genetic Programming, which can also be used to find optimal component-level features and HIs from the same set of features extracted from raw signals [
86].
The second limitation is related to real-time edge computing. In the described case study, 81 features are extracted from the signal in the time domain every second. This activity requires a computation time of less than 1 sec. Therefore, the latency of the algorithm is irrelevant. However, when signals need to be transformed in the frequency or time-frequency domain to reduce the noise or extract more meaningful features for diagnostics and prognostics (i.e., data pre-processing), the computation time could notably increase. Further research should address the construction of reliable, light-weight, and fast algorithms for data denoising and pre-processing.
Finally, the described case study does not consider the application of trained diagnostic and prognostic models for real-time inference under different operating conditions. Hence, further research should address the integration of existing models with streaming analysis for anomaly and novelty detection. Moreover, how a diagnostic or prognostic model, which was trained on data under a given operating condition, can be modified to make accurate predictions under other operating conditions should also be investigated to improve the proposed methodology and address the stakeholders’ requirements.


 ,
, 


