Article

Primary and Secondary Environmental Effects Triggered by the 30 October 2020, Mw = 7.0, Samos (Eastern Aegean Sea, Greece) Earthquake Based on Post-Event Field Surveys and InSAR Analysis

by
Spyridon Mavroulis
1,*,
Ioanna Triantafyllou
1,
Andreas Karavias
2,
Marilia Gogou
1,
Katerina-Navsika Katsetsiadou
1,
Efthymios Lekkas
1,
Gerassimos A. Papadopoulos
3 and
Issaak Parcharidis
2
1
Department of Dynamic Tectonic Applied Geology, Faculty of Geology and Geoenvironment, National and Kapodistrian University of Athens, 15784 Athens, Greece
2
Department of Geography, Harokopio University, 17671 Athens, Greece
3
International Society for the Prevention & Mitigation of Natural Hazards, 10681 Athens, Greece
*
Author to whom correspondence should be addressed.
Appl. Sci. 2021, 11(7), 3281; https://doi.org/10.3390/app11073281
Submission received: 7 March 2021 / Revised: 29 March 2021 / Accepted: 31 March 2021 / Published: 6 April 2021

Abstract

:
On 30 October 2020, an Mw = 7.0 earthquake struck the eastern Aegean Sea. It triggered earthquake environmental effects (EEEs) on Samos Island detected by field surveys, relevant questionnaires, and Interferometric Synthetic Aperture Radar (InSAR) analysis. The primary EEEs detected in the field comprise coseismic uplift imprinted on rocky coasts and port facilities around Samos and coseismic surface ruptures in northern Samos. The secondary EEEs were mainly observed in northern Samos and include slope failures, liquefaction, hydrological anomalies, and ground cracks. With the contribution of the InSAR, subsidence was detected and slope movements were also identified in inaccessible areas. Moreover, the type of the surface deformation detected by InSAR is qualitatively identical to field observations. As regards the EEE distribution, effects were generated in all fault blocks. By applying the Environmental Seismic Intensity (ESI-07) scale, the maximum intensities were observed in northern Samos. Based on the results from the applied methods, it is suggested that the northern and northwestern parts of Samos constitute an almost 30-km-long coseismic deformation zone characterized by extensive primary and secondary EEEs. The surface projection of the causative offshore northern Samos fault points to this zone, indicating a depth–surface connection and revealing a significant role in the rupture propagation.

1. Introduction

On 30 October 2020 (11:51:26 UTC), a very strong earthquake measuring moment magnitude Mw = 7.0 ruptured offshore to the north of Samos Island in the eastern Aegean Sea (Greece) (Figure 1) [1]. Fault plane solutions showed the activation of an E–W striking normal fault, which is likely dipping to the north [2,3] (Figure 1). Such a focal mechanism is consistent with the tectonic setting of the area [4,5,6,7,8,9,10]. The largest aftershock occurred a few hours after the main event (30 October 2020, 15:14:57 UTC) and its magnitude was calculated as Mw = 5.0 [1]. From the records of an SMG1 accelerometer installed in Vathy town, northeastern Samos, it was concluded that the peak ground acceleration (PGA) in the two horizontal components was 0.16 g and 0.23 g, respectively, while in the vertical component a PGA of 0.13 g was measured [11].
On Samos Island, the earthquake caused extensive building damage, mainly to old structures, but 2 fatalities and 19 injuries [12,13]. Unfortunately, the earthquake’s impact was more severe in the area of Izmir, western Turkey, to the north of the seismic source. According to the final report of [14], in that area 114 fatalities and 1035 injuries were counted, 13 buildings were completely destroyed, and 3000 buildings were heavily damaged. According to preliminary reports, the earthquake also caused important effects on the natural environment of Samos, such as surface deformation and various types of ground failures [12]. Relative sea level changes [15] and a tsunami of moderate size [16] have also been reported. On 20 January 2021, a strong aftershock measuring magnitude Mw = 4.5 occurred closer to Samos Island with respect to the mainshock (Figure 1). Further uplift was reported by local people after that aftershock and, therefore, our analysis included this uplift episode as well.
In this paper, we focus on the environmental effects of the earthquake and present a detailed collection, documentation, and mapping of relevant field observations acquired during post-event field surveys conducted on Samos Island immediately after the earthquake event. Additional observations were collected after our communication with local people. The studied earthquake environmental effects (EEEs) are classified into two groups. The first group concerns primary EEEs, i.e., coastal uplift and subsidence, as well as surface ruptures, which constitute the surface expression of tectonic movement in the seismogenic source. The second group of studied EEEs includes a variety of effects related to and induced by the ground shaking, such as slope failures, liquefaction in soil, ground cracks, rockfalls, and hydrological changes, all observed at several sites of the island. However, tsunami observations are not included in this study since they have already been presented elsewhere [16].
The possible correlation of the various earthquake effects with faults and fault zones identified on Samos has also been investigated. Therefore, a brief review of the geological and seismotectonic setting of Samos is needed for a better understanding of the various factors that may have controlled the generation and the spatial distribution of the EEEs. To further support this investigation, interferometric synthetic aperture radar (InSAR) analysis was conducted with the aim of visualizing the deformation field on Samos through the compilation of displacement maps and subset images.

2. Materials and Methods

2.1. Documentation and Classification of Earthquake Effects Collected in the Field

Various environmental effects of the 30 October 2020 earthquake have been reported in several places of Samos. A first round of field inspection and collection of observations was performed during our initial post-event field survey conducted on the island from 31 October 2020 to 2 November 2020. During these field surveys, we detected and mapped a variety of earthquake environmental effects and investigated their qualitative features and quantitative parameters.
However, soon after the earthquake, information about environmental effects was either published in the local press or reported directly to us by local people. Since such reports looked reliable, we decided to take them into account. For this reason, more field surveys were organized for the additional collection of observations with the guidance of local people until the end of November 2020.
Since the number of public reports was high, we organized a relevant questionnaire and disseminated it to the local population through social media and with the support of the local authorities. Apart from the section related to the personal data of the responders, the questionnaire included three main sections. The first was devoted to the collection of possible earthquake precursory phenomena, and the second was about the population’s response to the tsunami alert issued by the national civil protection authority soon after the earthquake. The third section was the one related to the present study. The general question in that section was stated as “Did you observe any change in nature a few hours or days after the earthquake?”. If the reply was “yes”, then additional questions followed: “Please provide a short description of the phenomenon, the exact place of observation, the date of the first time you observed the phenomenon, and the time of initiation and of termination of the phenomenon”.
The questionnaire remained uploaded from 30 November 2020 to 8 February 2021. However, responses regarding the section related to the present study were received until 8 January 2021. In total, we received 69 responses to that section, 65 from Samos and only 4 from nearby Greek islands. However, the latter did not prove useful to us. The distributions of age and of educational level of the respondents are illustrated in Figure 2.
An online interactive procedure was followed for the utilization of the replies received through the questionnaire. As soon as an environmental observation attributable to the earthquake was reported, we evaluated it on the basis of the following principles. If we were unaware of the observation reported, we requested further details, e.g., the exact observation place and documentation, such as pictures, if any. On the other hand, several replies either reported on phenomena already known to our team or considered too vague to be considered further. Eventually, the observations reported by the amateurs were evaluated as useful or not useful. For the former, we managed to organize field inspections at the relevant observation sites. The last visit was performed on 23 and 24 January 2021.

2.2. InSAR Analysis

2.2.1. Data

Regarding InSAR processing, free SAR scenes from the Sentinel-1 satellite constellation were used (Table 1). Sentinel-1 is designed to operate in four modes: strip map (SM), interferometric wide (IW) swath, extra wide (EW), and wave (WV) with IW the standard image mode product following the novel Terrain Observation with Progressive Scans (TOPS) acquisition mode. Each original TOPSAR image is composed of three sub swaths (IW1, IW2, and IW3). Every sub swath consists of a series of bursts, which in total can provide a large coverage of 250 km with pixel resolutions of 5 m and 20 m along the range and azimuth directions, respectively [18]. For interferometric processing, in this study the next tracks of Sentinel-1A IW swath mode Single Look Complex (SLC) images covering the pre- and post-seismic periods were downloaded from European Space Agency’s (ESA) Sentinel Hub site (https://scihub.copernicus.eu/ accessed on 21 January 2021): (i) ascending track 131 (slice number: 7) dated 6 October 2020/30 October 2020; and (ii) descending track 36 (slice number: 13) dated 24 October 2020/5 November 2020. In this way, an interferometric pair was created for each ascending and descending orbit.

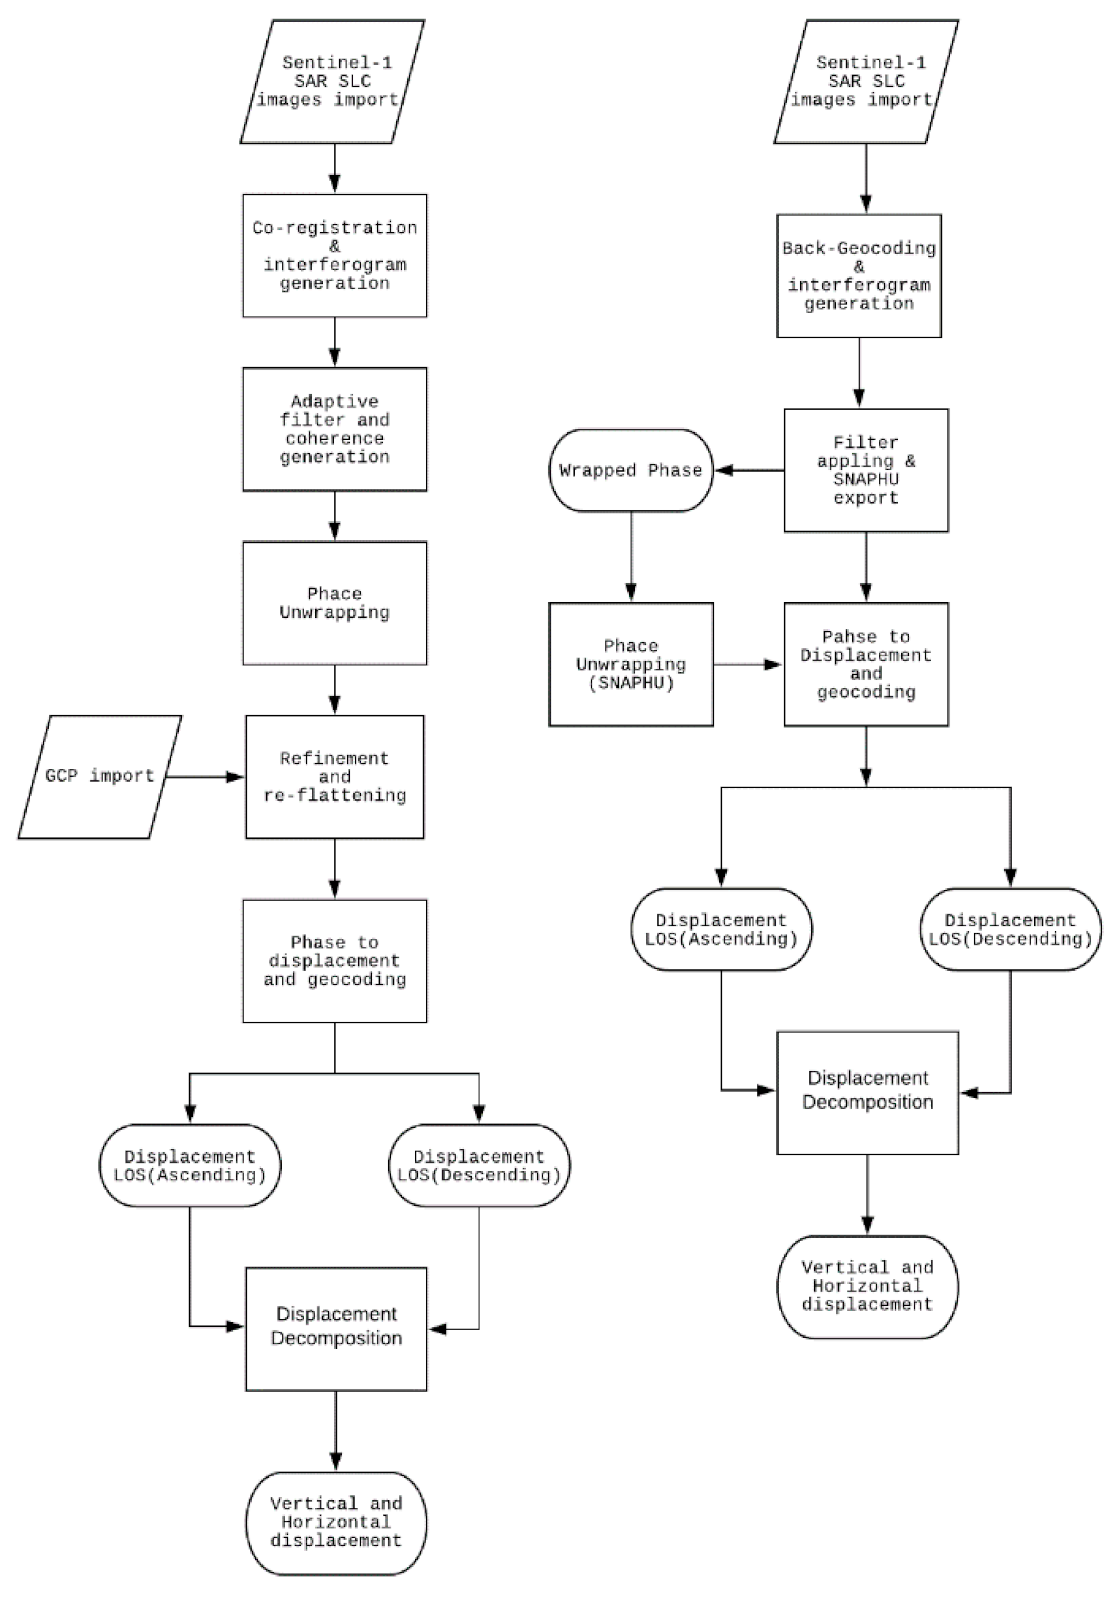
2.2.2. Method and Techniques

With the aim of confirming the results obtained, two different types of software were used for the interferometric processing (Figure 3): the ESA SeNtinel’s Application Platform (SNAP), which is a freely distributed under GNU General Public License, and the ENVI SARscape (L3Harris Geospatial, Boulder, CO, USA), which is commercial software. SNAP was developed and is supported by ESA, offering an efficient, public tool for raster satellite data processing in optical and radar modes.
In both formed interferometric pairs, the pre-seismic image was selected as the master image and the post-seismic as the slave. The preprocessing phase included splitting each sub swath with the selected bursts to cover the area under study and orbit refinement using the precise orbit files. In the second phase, we focused on the estimation of a constant azimuth offset for the whole sub swath using an enhanced spectral diversity method. Then, a constant range offset of the image using incoherent cross-correlation was estimated. The latter method exploits the overlapped areas of the adjacent bursts. The offset estimation in the azimuth and range directions was saved in a metadata file. This step practically is the co-registration of the master and slave images using the orbits and the 3 second Shuttle Radar Topographic Mission (SRTM) Digital Elevation Model (DEM). In the next step, the interferogram and the coherence between the master and slave images for each interferometric pair were computed. The last step of the main phase concerns debursting, because there is overlapping information in every burst with its neighboring ones, both in the range and azimuth directions. This is achieved by merging the bursts in the azimuth direction and preserving the phase information as well, while for the overlapping in the range direction, merging is done between the sub swaths. The next phase of the main processing starts with the topographic phase estimation and removal from the interferogram using the SRTM 3s DEM; then, in order to increase the noise-to-signal ratio, a power spectrum Goldstein filter [19] and a multi-looking operation were applied to reduce the speckle and obtain square pixels.
The two wrapped interferograms, in ascending and descending geometry (Figure 4), are of good quality and contain the phase difference between the master and slave images due to the main seismic event. Limited areas of low coherence (temporal and spatial decorrelation) are locally presented in the interferograms (the decorrelation is more visible in the ascending interferogram) (Figure 4), because Sentinel-1 exhibits a high temporal resolution and a small orbital “tube” [20]. Moreover, in the ascending interferogram there is a topographically induced phase, especially in the central part of the island (Figure 4). Relatively small aftershocks occurred, after the main event, in the period covered by the two interferometric pairs; for this reason, they do not affect the deformation signal of the main event.
In order to obtain the absolute value of displacement, the following processing procedure was followed. Wrapped interferograms (deformation in radians) have to be unwrapped and transformed from phase radians into motion (meters). In these products (unwrapped interferograms), phase fringes have disappeared and absolute motion in the line of sight (LOS) in meters is recovered. To do this, the wrapped interferograms are imported to the unwrapping processing step. Finally, the result of the interferometric unwrapped phase is converted to a displacement map in meters and geocoded. In the case of SNAP, the wrapped interferogram is exported in the form of SNAPHU software for the unwrapping process in the Linux environment. Finally, the result of the interferometric unwrapped phase is re-entered into SNAP to create the LOS displacement map in meters.
The displacement decomposition tool calculates the vertical, east-west, and, optionally, north–south components of the displacement. In this case, the vertical and east–west (2D) displacement was calculated. The minimum input data requirement in order to calculate the 2D measurements is to obtain from different acquisition geometries DInSAR measurements in ascending and descending orbit over the same study area.
As SNAP software cannot generate the displacement decomposition, further calculations were performed through mathematical operations between the two layers in the LOS. The generation of the Z vertical (up–down) and E horizontal (east–west) displacement can be calculated using the LOS displacement products from the ascending and descending image pairs together with the incidence angle through equations [21]:
de = [Dd cos θα − Dα cos θd]/sin (θα + θd)
dz = [Dd sin θα + Dα sin θd]/sin (θα + θd),
where Dd and Da are the LOS displacement and θa and θd are the incidence angles of each geometry.

2.3. Application of the Environmental Seismic Intensity (ESI-07) Scale

The Environmental Seismic Intensity (ESI-07) scale allows for an assessment of seismic intensity based solely on primary and secondary EEEs [22]. Primary EEEs are directly linked to the earthquake’s energy and particularly to the surface expression of the causative fault and comprise surface faulting, surface ruptures, and permanent surface deformation of tectonic origin. Secondary EEEs are caused by the ground shaking and include hydrological anomalies, anomalous waves/tsunamis, ground cracks, slope movements, trees shaking, liquefaction phenomena, dust clouds, and jumping stones [22]. Qualitative and quantitative information on primary and secondary effects generated at the studied sites was used to assign ESI-07 intensities.
The ESI-07 scale has been applied to sites affected by primary and secondary environmental effects induced by the 30 October 2020, Mw = 7.0, Samos earthquake and for its aftershock generated on 20 January 2021. The application of the scale and the assigned intensities followed the guidelines provided by [22].

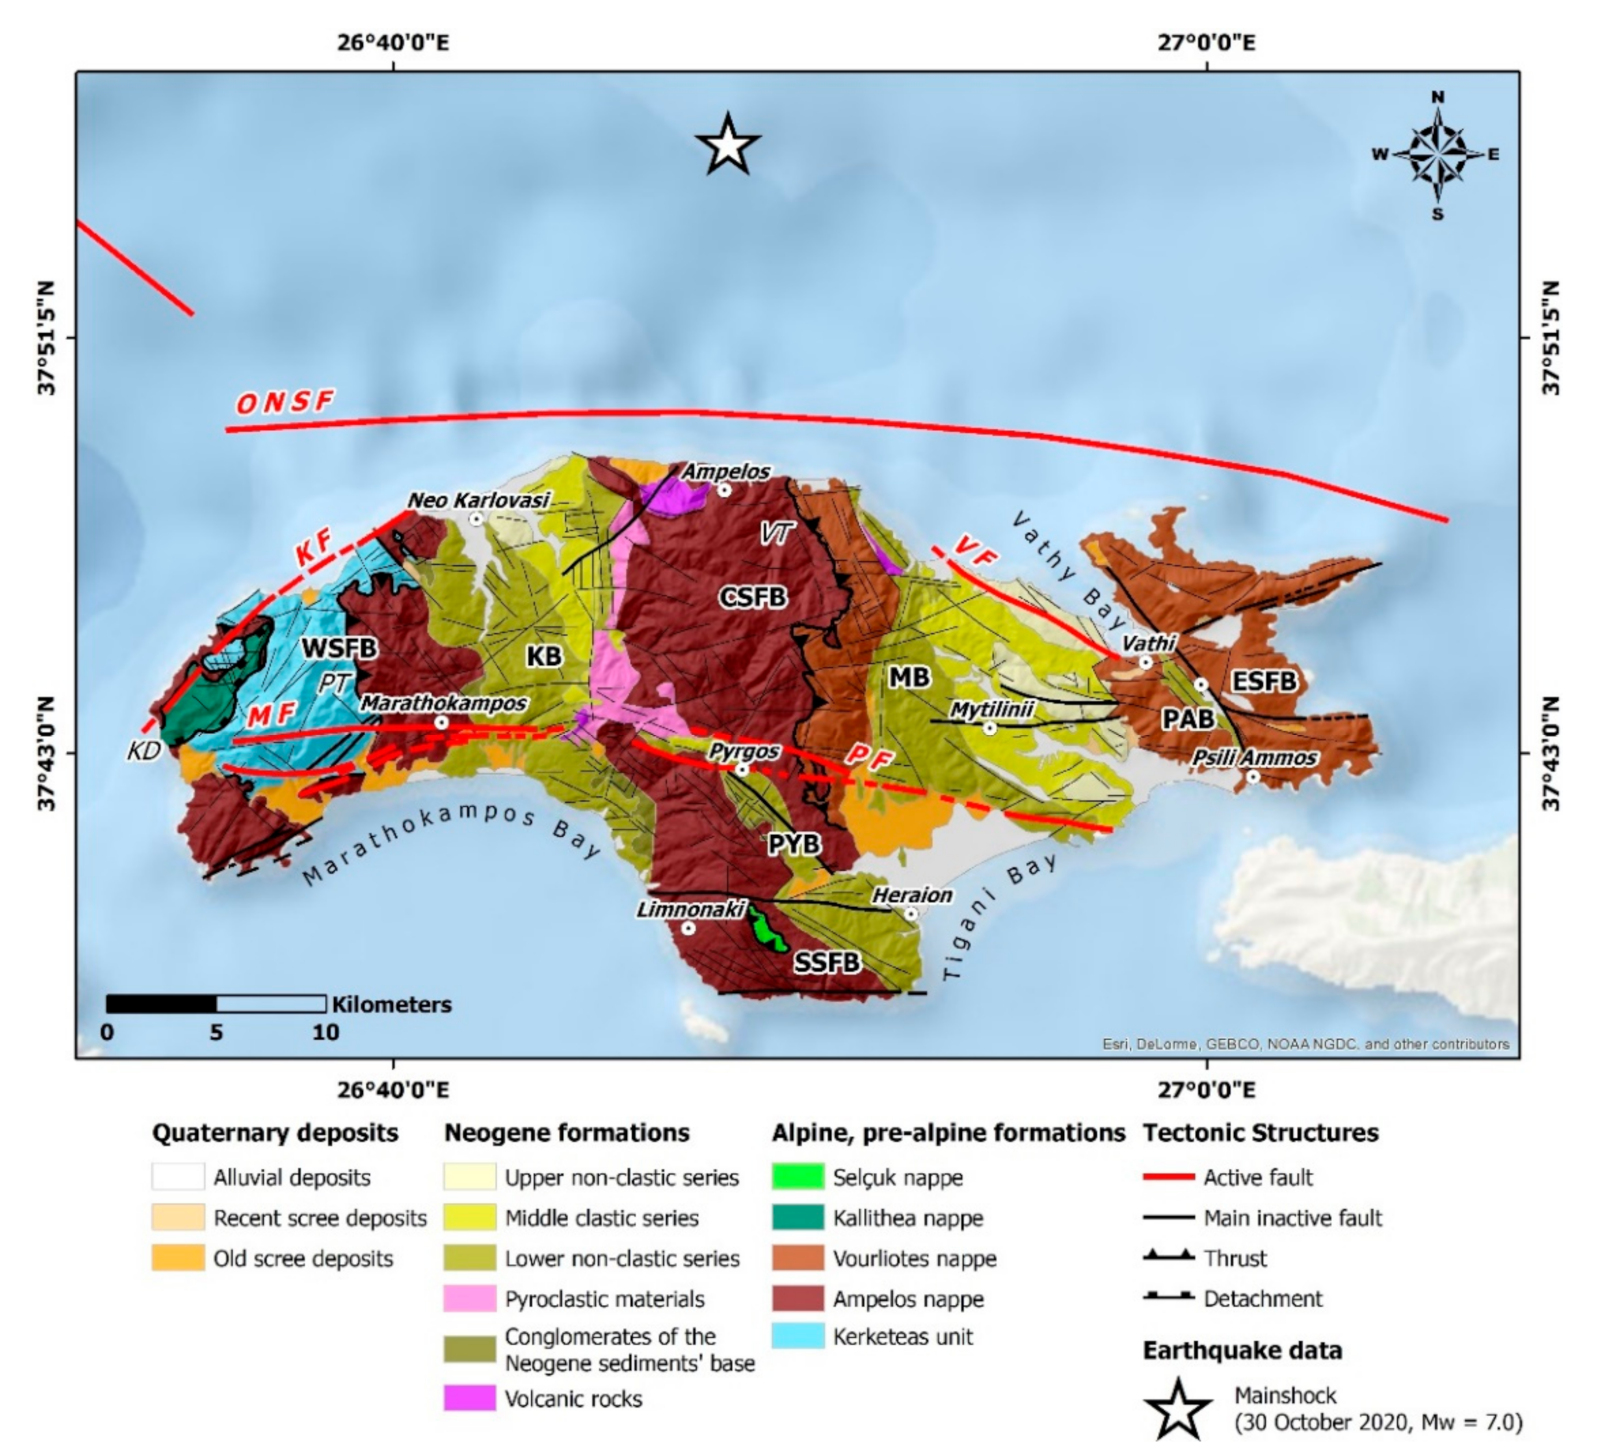
3. Geological Structure and Fault Blocks Onshore and Offshore Samos

3.1. Geological Units

The island of Samos is composed of four tectonometamorphic units, which are the following from the base to top [5,6,23,24] (Figure 5):
(a)
The Kerketeas unit in western Samos is considered to be a relatively autochthonous unit of the island. It contains dolomitic marbles and local schists on top, which crop out in a tectonic window below the Ampelos nappe.
(b)
The Ampelos nappe comprises mainly schists and marbles as well as metabasites in small occurrences. The lower part contains slices of Carboniferous and Triassic gneiss.
(c)
The Selçuk nappe includes metabasites, which outcrop discontinuously in central Samos.
(d)
The Vourliotes nappe is composed of schists and marbles in eastern Samos. The upper formation of the Vourliotes nappe is of Upper Cretaceous age.
(e)
The Kallithea nappe comprises sandstones, serpentinized peridotite, spilite, and diabase with red radiolarites and fossiliferous limestones of ammonitico rosso type. Upper Triassic to Jurassic carbonates are observed in the top.
(f)
The Katavasis complex comprises marbles, amphibolites, and quartzites.
As regards the contact between these units, the Pythagoras thrust separates the Kerketeas unit from the Ampelos nappe in the western part of Samos, the Vourliotes thrust puts the Vourliotes nappe on the Ampelos nappe in central Samos, and the Kallithea detachment is a low-angle extensional fault at the western end of the island [24,25,26] (Figure 5).
The geological structure of Samos also comprises Neogene (Miocene–Pliocene) formations and Quaternary deposits, which filled in the Karlovasi, Pyrgos, Mytilinii, and Paleokastro basins [4,5,7] (Figure 5). The Karlovasi and Mytilinii sedimentary basins, in the western and eastern part of Samos, respectively, are connected by a narrow passage, which corresponds to the Pyrgos Basin, while the Paleokastro basin is a second-order basin structure formed in the eastern part of Samos [4,5] (Figure 5). The sedimentary basin fill comprises non-clastic and clastic series of Neogene age [4,5,7]. The Quaternary is represented mainly by torrential deposits within the aforementioned basins and in karst depressions, alluvial deposits along the coastal plains, as well as recent scree and talus cones [4,5] (Figure 5).

3.2. Onshore and Offshore Faults

Major faults have formed the current morphology of Samos. Recent studies comprising onshore geological and neotectonic mapping [7,9] and offshore studies based on continuous seismic reflection profiles, partly calibrated with drilling results [6], described 15 major faults dissecting onshore and offshore Samos. Only five of them were characterized as active structures [6,7,8,9,17] based on their geometric properties, their kinematic characteristics, and their geomorphological and morphotectonic features. These onshore faults are (Figure 5):
(a)
The Karlovasi fault is a NE–SW striking and northwestward dipping strike-slip fault in the northwestern part of Samos, which defines its linear coastal morphology. Based on its length reaching 13 km, the maximum expected magnitude is estimated at 6.5 [8] or 6.4 [9].
(b)
The Vathy fault is an 8-km-long, WNW–ESE striking and northward dipping normal fault defining the linear coastline and the steep seabed morphology of the western coastal part of the Vathy bay. The maximum expected magnitude from the rupture of the Vathy fault is estimated at 6.3 [8,9].
(c)
The Marathokambos fault is an 11-km-long, E–W striking and southward dipping normal fault with a dextral component at the southeastern part of Samos. It constitutes the southern boundary of Kerketeas Mt and defines the current linear morphology of the southwestern coast of Marathokambos bay. The maximum earthquake magnitude expected from this fault has been estimated at 6.4 [9].
(d)
The Pythagoreio fault is a WNW–ESE striking and southward dipping normal fault at the central-south and southeastern part of Samos, separating the northern hilly area from the southern flat lowlands. The maximum earthquake magnitude of this fault from the rupture of the fault in its entirety is estimated at 6.7 [17].
(e)
As regards offshore structures, a major offshore fault has been detected north of the island based on the linear coastline and the extremely steep seabed morphology north and northwest of Samos [3,6,10]. It is a 25-km-long WNW–ENE striking and NNW-ward dipping normal fault, separating Samos to the south (footwall) and the offshore northern Samos basin (hanging-wall) with a depth of more than 1000 m. The maximum earthquake magnitude expected from this fault has been estimated at 6.8 [8,9] or 6.9 [17].

3.3. Fault Blocks

The Samos Island comprises the following fault blocks (Figure 5):
(a)
The western fault block of Samos is bounded to the north and south by fault zones that bound Kerketeas Mt to the north and south, respectively, while to the east it is bounded by the marginal fault zone of the Karlovasi basin. It has been rotated around an E–W trending horizontal axis resulting in the uplift of its northern part in three tectonic episodes characterized by variations in frequency and magnitude and the subsidence of the southern part in one episode [27]. During the last tectonic episode, the northern part presented an uplift of 0.70 cm and its southern part a subsidence of 0.60 cm [27].
The uplift of the northwestern part of Samos Island has been verified by the interdisciplinary study on Holocene shorelines conducted by [28]. They found that three raised shorelines approximately 0.6, 1.1, and 2.3 m above sea level (a.s.l), which were assigned to historical and paleo- earthquakes generated 500, 3600 ± 3900, and possibly 1500 years ago.
(b)
The Mytilinii basin constitutes an N–S-striking graben initially formed in the Lower-Upper Miocene, filled with sediments in the Miocene-Pliocene and faulted in the Pleistocene [7]. It has been developed between the marbles and schists of the mountainous Ampelos area and the zone of marbles and schists of Vathy-Agia Zoni [4,7].
(c)
The Karlovasi basin was formed in the western part of Samos between the Ampelos and Marathokampos units with a general N–S strike and has been filled with Neogene formations.
(d)
The Pyrgos basin constitutes a NW–SE-striking narrow elongated graben separating the mountainous area of Ampelos from Bournias. Taking into account the deposition and evolution processes, the Pyrgos basin seems to be a part of the Mytilinii basin. Neogene beds strike from NW–SE to N–S and dip 20–50° generally to NE and E.
(e)
The fault block of eastern Samos has suffered a total subsidence of 0.50 m taking into account [27]. The western boundary of this fault block coincides with the Vathy–Psili Ammos fault zone. The aforementioned subsidence of the southeastern part of Samos has been also verified by [29]. They showed that the southeastern part of Samos underwent subsidence at least during the late Holocene, with relative sea level rise rates of 0.8 mm/yr.
(f)
The fault block of central-southern Samos is a second fault block that acted independently, undergoing successive phases of initial uplift and a subsequent subsidence of 0.20 m around an E–W-trending axis [27]. The northern boundary of this fault block coincides with the E–W-trending fault zone passing through the Limnonaki area, while the eastern and western boundaries coincide with the eastern and western fault zones of the Karlovasi and Mytilinii basin, respectively.
As regards the northern part of Samos, local uplift has been detected based on uplifted beach rocks [27].
(g)
A 15-km-wide asymmetric graben-like structure prevails in the area offshore northern Samos [3,6,10]. It is bounded by a major E–W-striking and northward-dipping fault zone comprising faults in an en echelon arrangement, which played a significant role during the formation of the structure and shaped the coastal morphology of northern Samos [3,6,10].

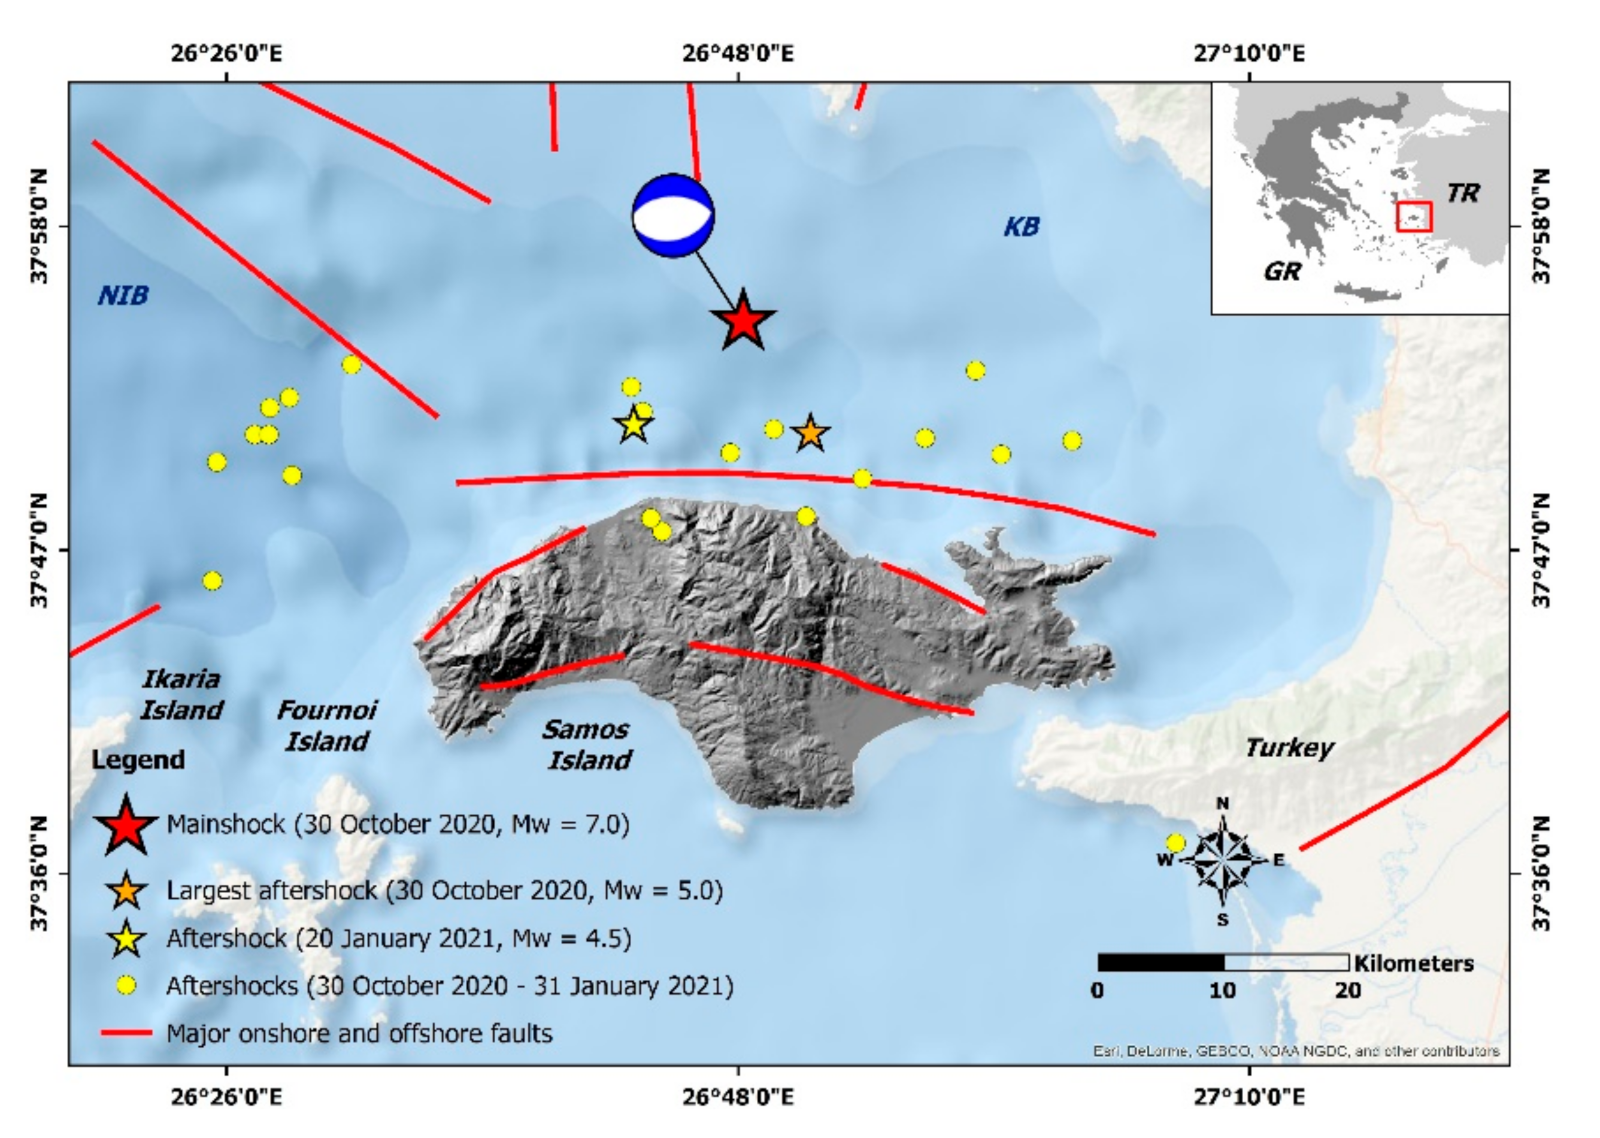
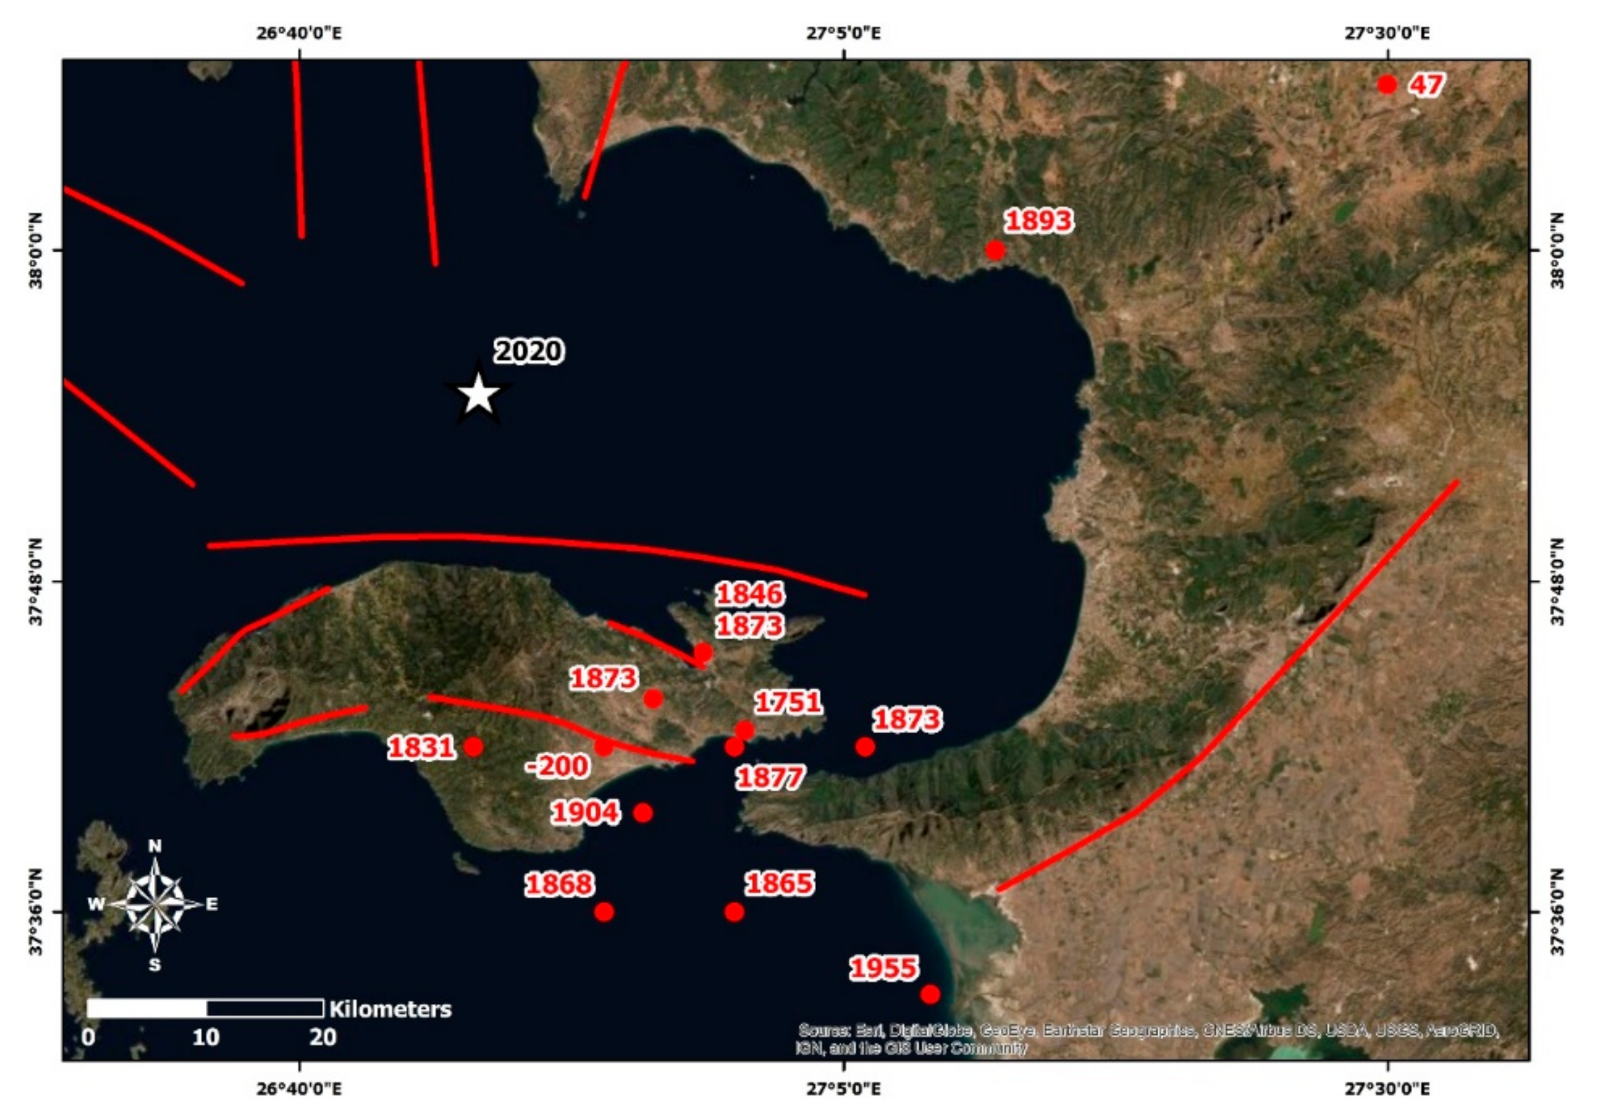
4. Seismicity of the Samos Island Area

From several descriptive and parametric earthquake catalogues covering both the instrumental and the historical periods, it was concluded that the area of Samos is characterized by high seismicity [30,31,32,33,34]. According to these catalogues, several strong earthquakes (Mw ≥ 6.0) occurred in the area of Samos Island from antiquity to present (Table 2 and Figure 6).
The most recent instrumentally recorded earthquakes with a considerable impact on Samos Island are the 11 August 1904 earthquake and the 16 July 1955 one (Figure 6). Due to the 1904 earthquake, considerable damage was caused to several villages of Samos. A total of 540 houses were completely destroyed, while 4 fatalities and 7 injuries were reported. The M = 6.9 earthquake of 16 July 1955 caused damage to the Agathonisi and Samos Islands and to Balat in Turkey [30]. In Samos, 60 houses were destroyed, 200 were severely damaged, and 600 were slightly damaged. As regards the impact on the local population, only four injured were reported. The maximum intensity was VIIII and assigned to Agathonisi Island, while in Samos the maximum intensity was VI+ and assigned to several villages, including Neo Karlovasi, Kontaeika, Kokkari, Pyrgos, Goumaeika, Leka, and Pagoda [30]. A tsunami was generated and affected Heraion and Tigani bay, located in the Pythagoreio area. In Heraio, the tsunami height was 2 m and the inundation depth 20 m [30]. The largest aftershock occurred on 28 August 1955 with magnitude M = 5.1. Very recently, [35] used amplitudes of seismic waves recorded at Agamennone-type seismographs and recalculated magnitudes of earthquakes occurring in Greece in the time period 1901–1910. The recalculated magnitudes are calibrated over surface-wave magnitudes determined for Greek earthquakes for the post-1910 time interval [36,37]. For the 1904 mainshock, a magnitude Mw = 6.3 was calculated, which is consistent with magnitudes determined in many earthquake catalogues, e.g., Ms = 6.2 [38], Mw = 6.1 [39], and Mw = 6.0 [32].
More recently, moderate earthquake activity associated with normal faulting of an E–W trend and magnitudes ranging from Mw = 5.5 to Mw = 5.9 was recorded in the area north of Samos Island during October 2005 [40]. Microseismicity concentrated in distinctive clusters was recorded near Samos and Kusadasi Bay from July 2007 to September 2012, showing predominance of normal faulting with a significant contribution of strike-slip motion [41].
The 30 October 2020, Mw = 7.0, Samos earthquake is one more in a series of destructive earthquakes that have affected the eastern Aegean Sea. The most recent events of this series are the 12 June 2017, Mw = 6.3, Lesvos earthquake [42,43] and the 21 July 2017, Mw = 6.6, Kos earthquake [44,45].

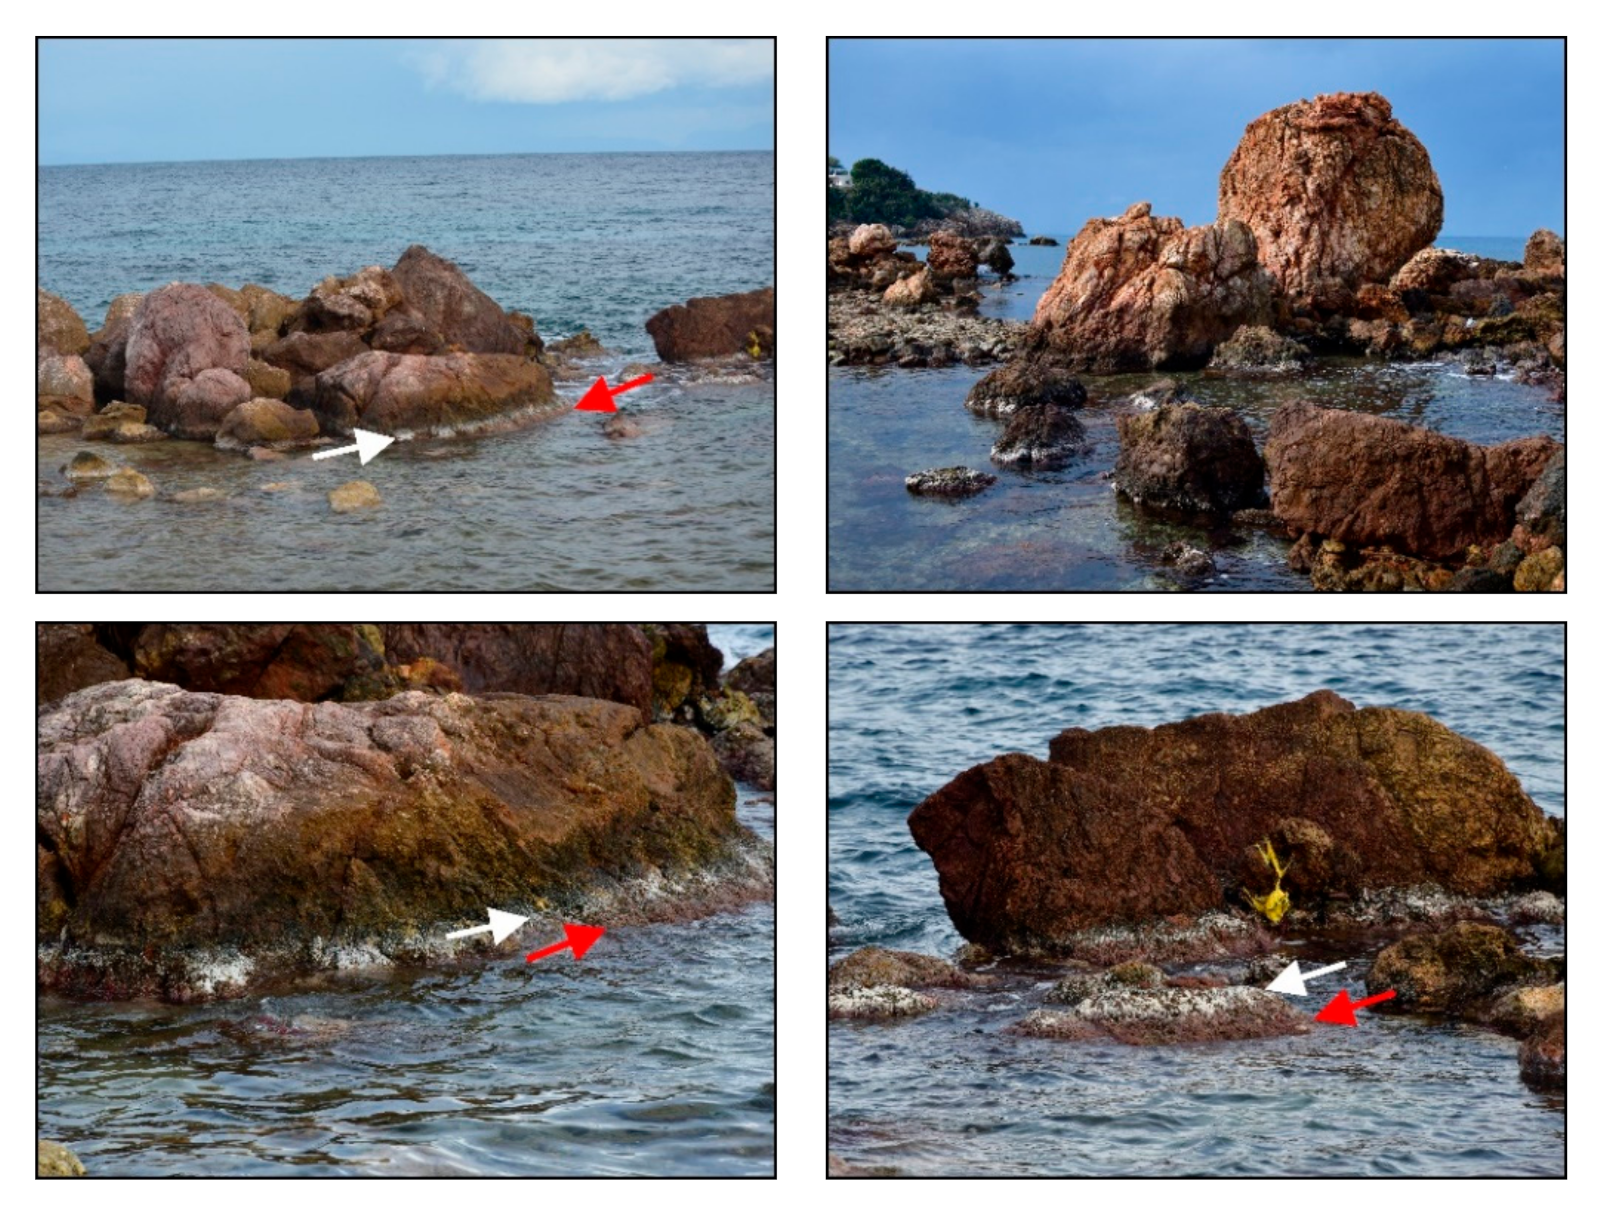
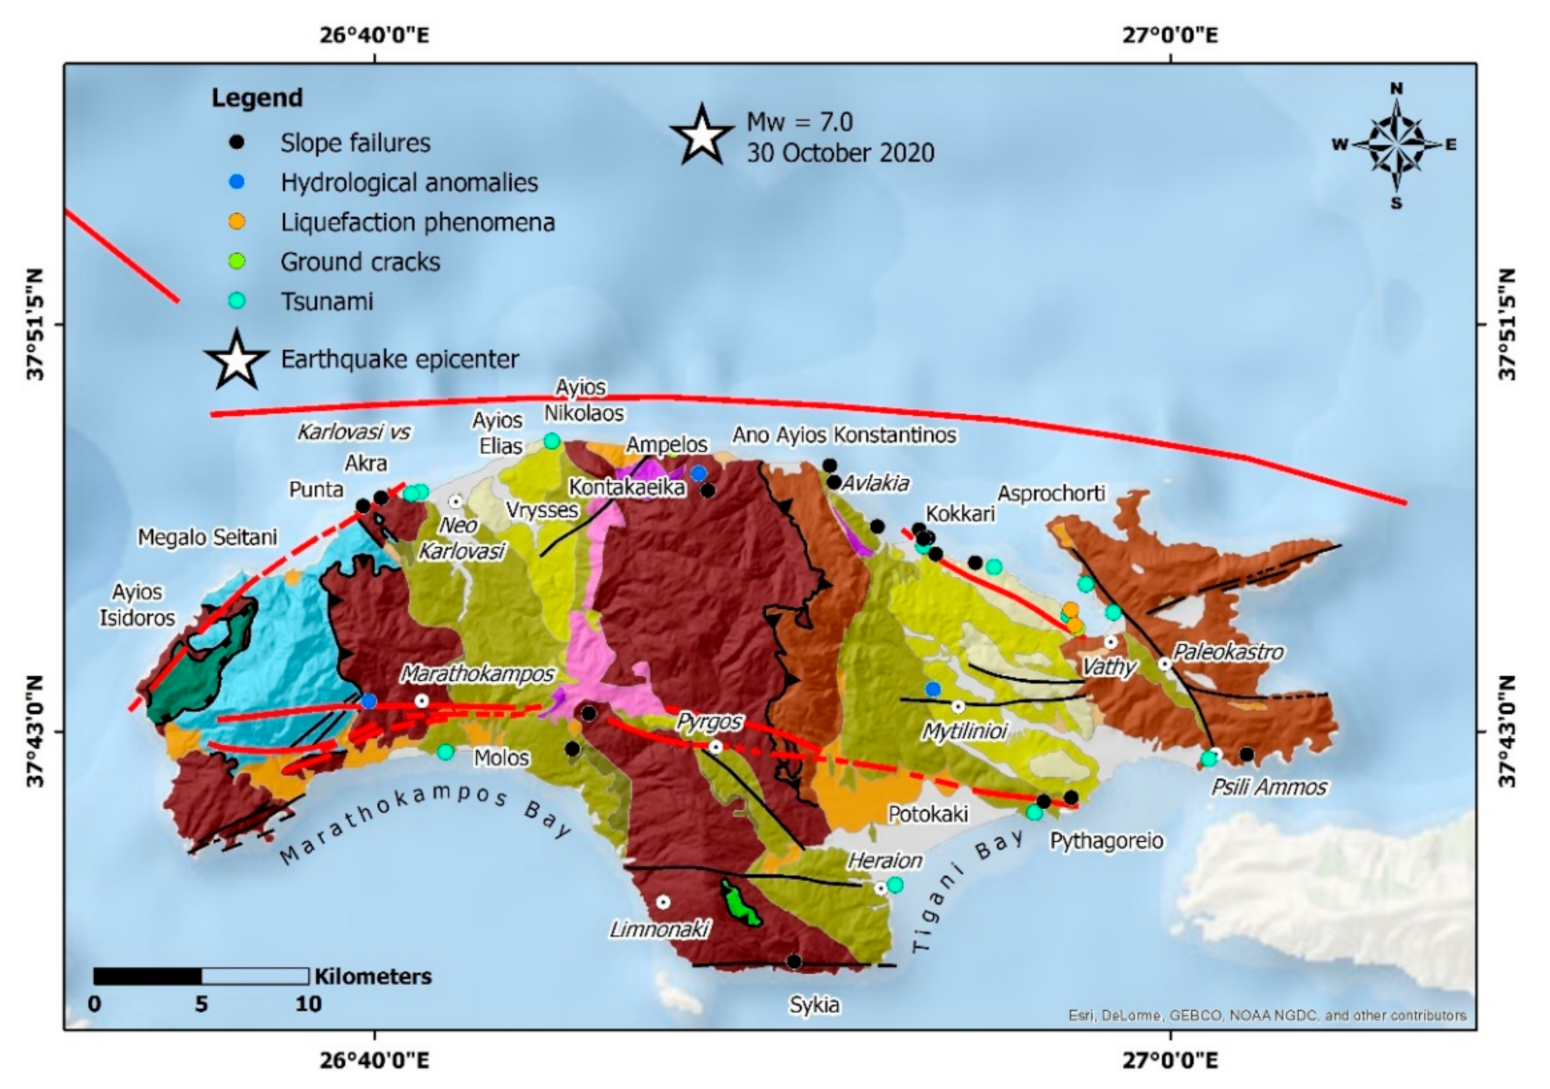
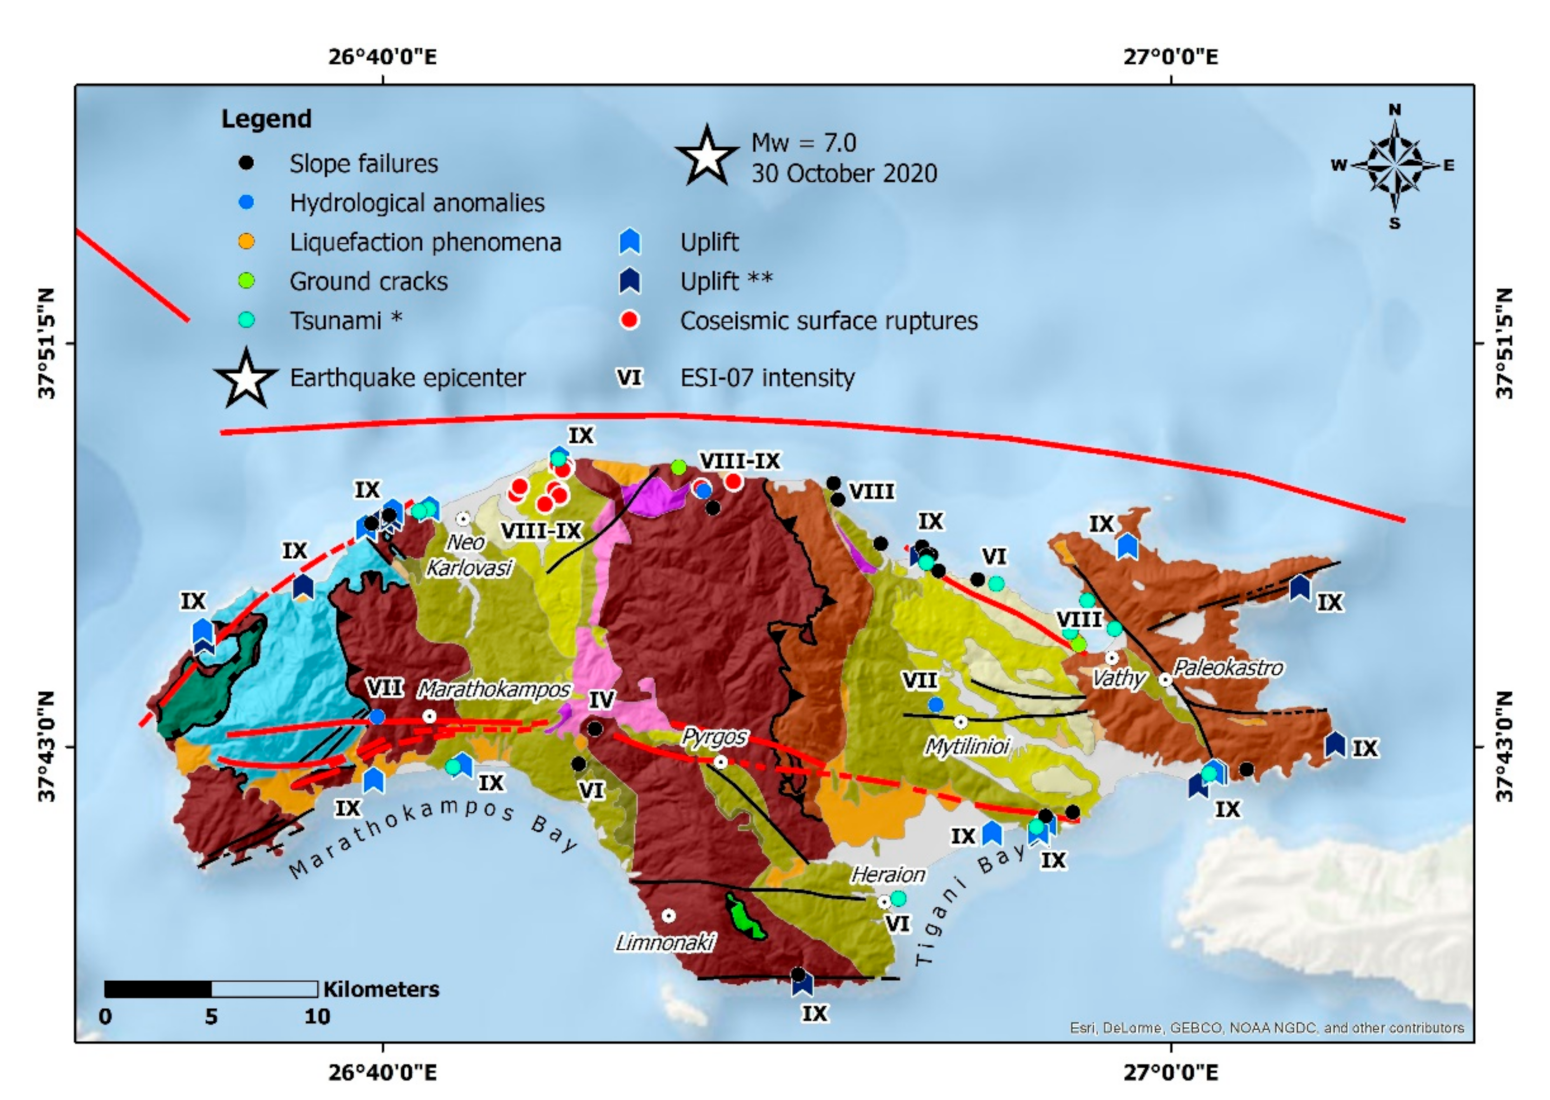
5. Primary Environmental Effects Induced by the 30 October 2020, Mw = 7.0, Samos Earthquake

The 30 October 2020, Mw = 7.0, Samos earthquake induced several primary environmental effects. Permanent coseismic surface deformation, more specifically uplift, was observed in coastal spots of northwestern, northeastern, southeastern, south, and southwestern Samos (Figure 7). Moreover, coseismic surface ruptures were observed in the northern part of Samos (Figure 7).

5.1. Permanent Surface Deformation

Coastal uplift in Samos was imprinted on port facilities, rocky coasts, and sandy beaches of the affected sites. The observation sites include Karlovasi, Akra, Pounta, and Ayios Isidoros in northwestern Samos, Marathokampos and Kampos in southwestern Samos, Asprochorti in northeastern Samos, and Pythagoreio, Potokaki, and Psili Ammos in southeastern Samos (Figure 7).

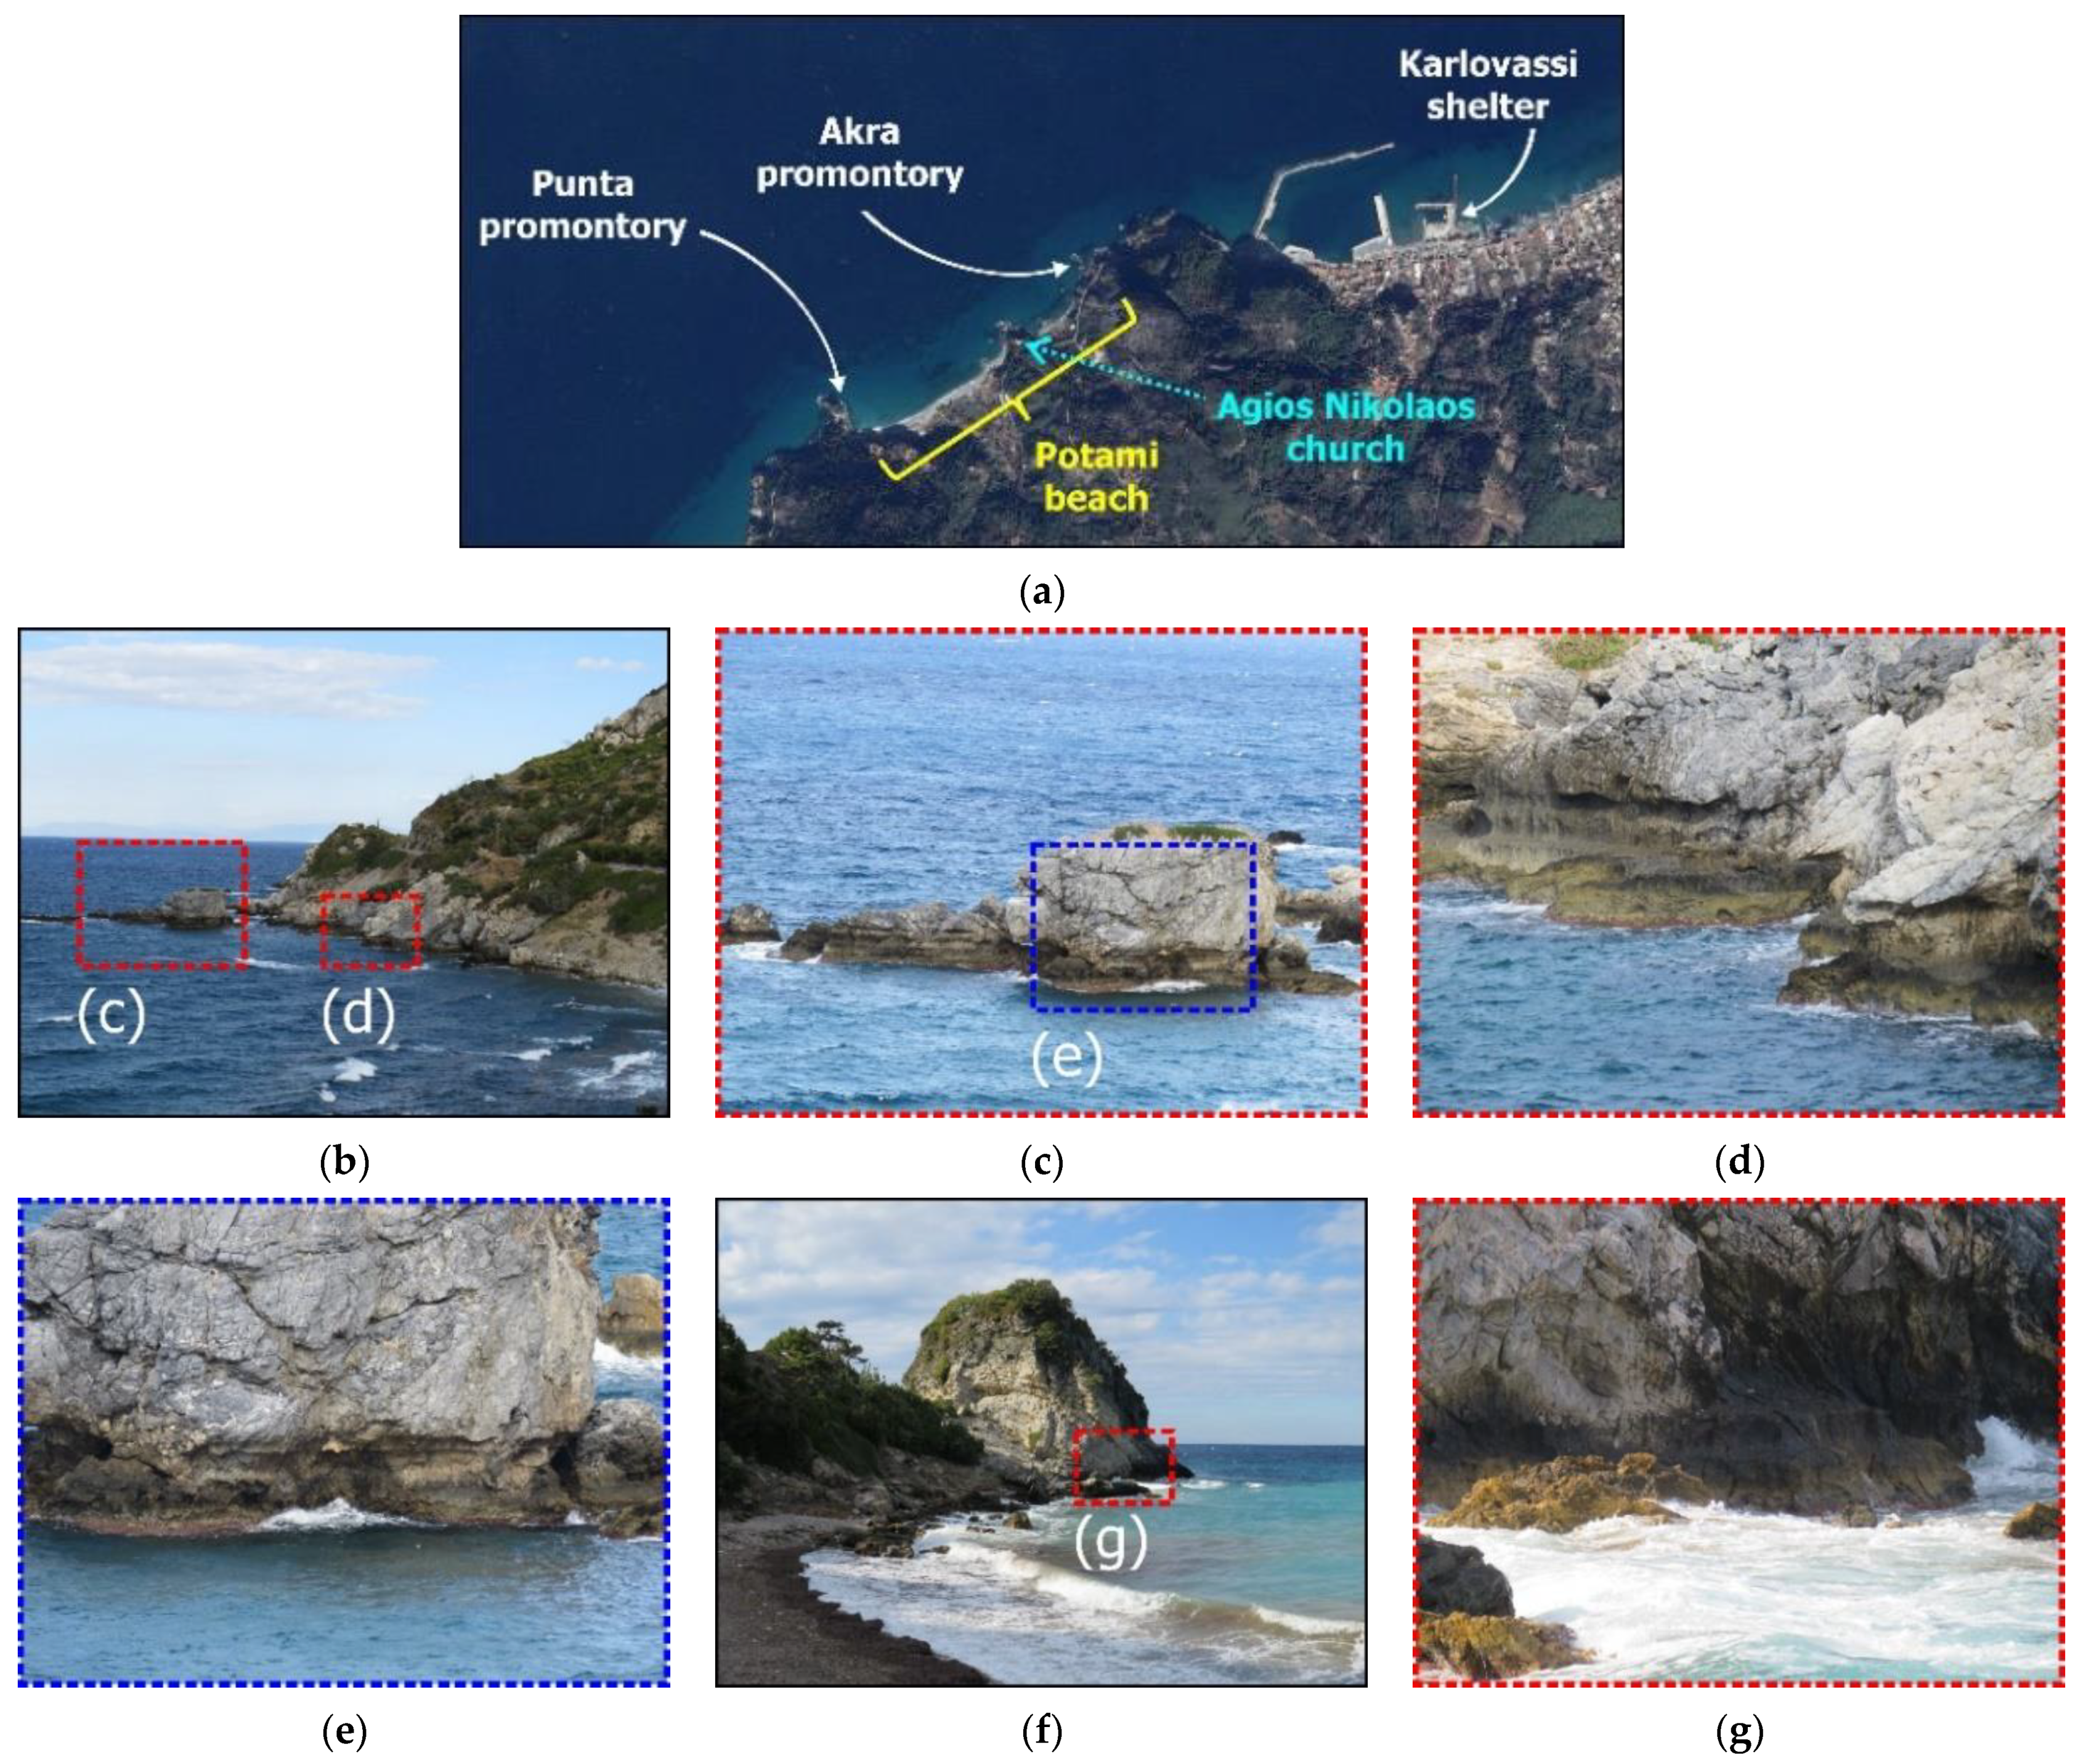
5.1.1. Permanent Surface Deformation in the Northwestern Part of Samos

The northwestern coastal part of Samos is disrupted by the NE–SW-striking and NW-dipping Karlovasi–Kallithea active normal fault. This structure is responsible for intense relief, comprising large morphological discontinuities corresponding to abrupt and steep fault scarps composed mainly of marbles at small distances from the shoreline and narrow and limited beaches with sand and pebbles. At larger distances from the shoreline, the morphological features are also attributed to faults with the same geometry but a different activity class, as they are characterized as inactive [7].
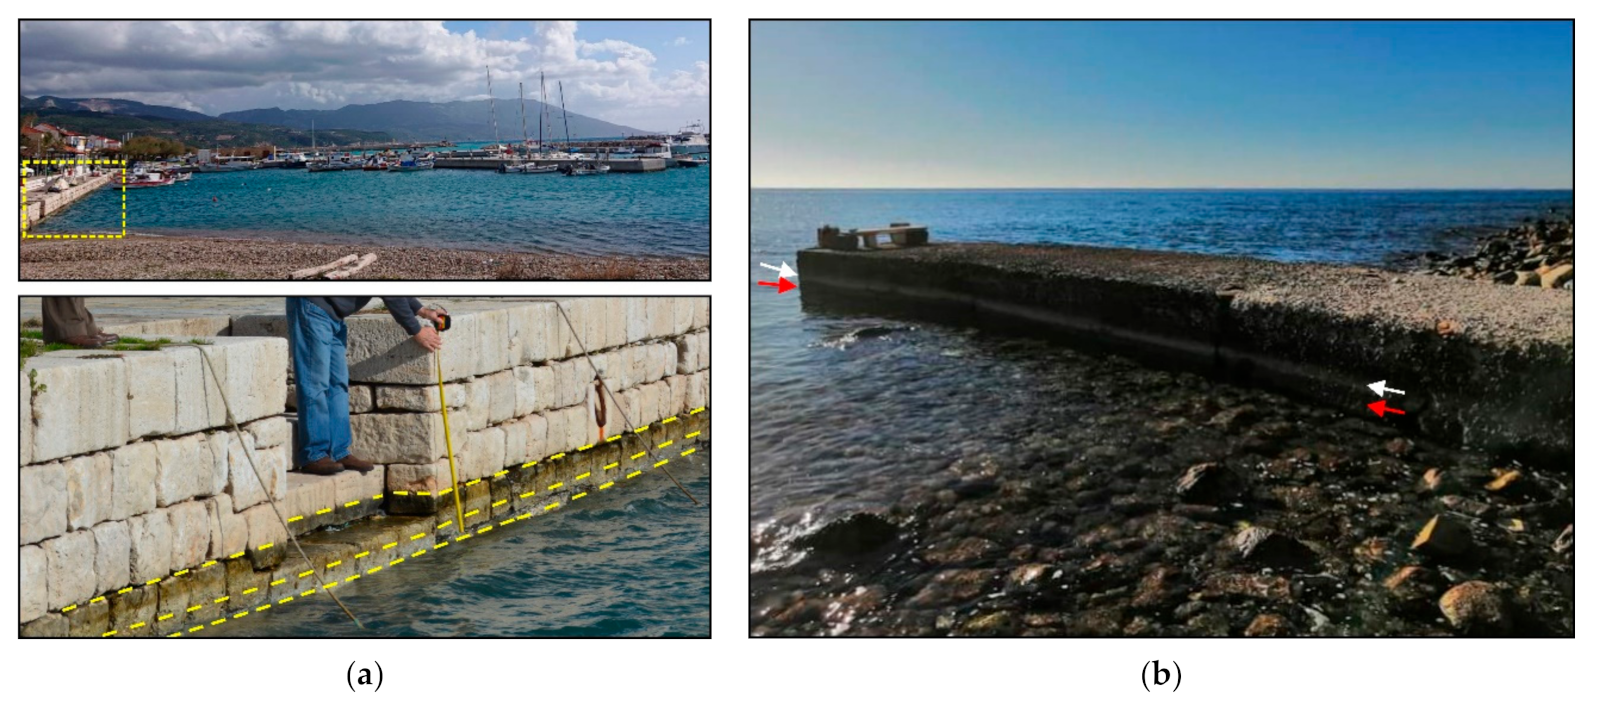
  • Uplift at the Karlovasi vessel shelter
Permanent coseismic uplift was detected at the Karlovasi vessel shelter located east of the Karlovasi port (Figure 7 and Figure 8), at a distance of about 16 km southwest of the mainshock epicenter. The vessel shelter has quay walls with a total length of 295 m, which are protected from strong waves and currents with natural boulders emplaced in the exposed side of the vessel shelter. The detected uplift was imprinted not only on the concrete works of the vessel shelter, but also on the protection boulders (Figure 8). Based on field measurements, the amplitude of the permanent coseismic uplift in this site reached 24 cm.
  • Uplift at Akra coast
The area of Akra, east of the Ayios Nikolaos church, is located at a distance of ~17 km southwest of the earthquake’s epicenter and 1.5 km west of the Karlovasi vessel shelter (Figure 7 and Figure 9). This area is mainly composed of metamorphic formations and in particular of grey to black-grey marbles of the Kerketeas unit [5,23,24]. Recent deposits are observed only along the narrow beach and within the beds of torrents flowing into the beach.
A coseismic permanent uplift of 20 cm, which was imprinted on the marbles of the Kerketeas unit, was observed at that site (Figure 9). At the base of the marbles along the rocky coast, the uplift has extirpated intertidal biota (Figure 9).
In contrast to the northern coastal alluvial zone of the Karlovasi basin, which has low preservation potential for primary earthquake environmental effects, the area west and southwest of the Karlovasi port constitutes areas with a rich record of previous uplifts attributed to historical earthquakes. The higher potential for the preservation of primary earthquake environmental effects in this area is strongly related to its geological structure, which comprises metamorphic rocks, mainly marble and schists, and results in imprinting of permanent coastal uplift in these formations [28].
Based on the interdisciplinary study on Holocene shorelines at the Akra site, [28] observed a well-preserved colony of vermetids that has built a thin reef capping slabs of beachrock up to a height of 50 cm above sea level. On the nearby rocks, remains of vermetids were found at a height of 0.6 m and 1.1 m above sea level (asl), on average, on coastal rocks. They certainly correspond to two fossil shorelines.
Such traces are useful tools and valuable geological records allowing us to increase the time window in the research on earthquake geology and paleoseismology from a few tens to hundreds or even thousands of years and to contribute to more accurate seismic risk assessments not only for the region of Samos, but also in similar seismic active areas around the world [22,46,47].
  • Uplift at the Punta promontory
The area of the Punta promontory is located at a distance of 18 km southwest of the earthquake’s epicenter and nearly 1 km southwest of the Akra site (Figure 7 and Figure 9). The area is composed of Kerketeas schists conformably overlying marbles of the same unit. This area was uplifted coseismically by 22 cm and was imprinted on the marbles of the Kerketeas unit (Figure 9). At the base of the marbles along the rocky coast, the uplift has extirpated the intertidal biota.
This site has also high potential for preserving uplift traces. Its geological structure comprises metamorphic formations, such as marbles and schists, which favor the imprint of permanent coastal uplift in its geomorphological record as evidence of uplift associated with historical and paleo-earthquakes [28]. More specifically, along parts of the eastern side of the Punta promontory, there is clear geomorphological evidence of at least three fossil shorelines, including benches and notches. In particular, there are two benches at a height of 0.6 ± 0.2 m and 1.1 ± 0.2 m above sea level and a notch at a height of 2.3 ± 0.2 m [28]. Relics of two polystromatic colonies of Dendropoma petraeum at a height of 0.7 ± 0.2 m and 1.1 ± 0.2 m asl, respectively, have been found at the eastern edge of the Punta promontory and correspond to two fossil shorelines [28].
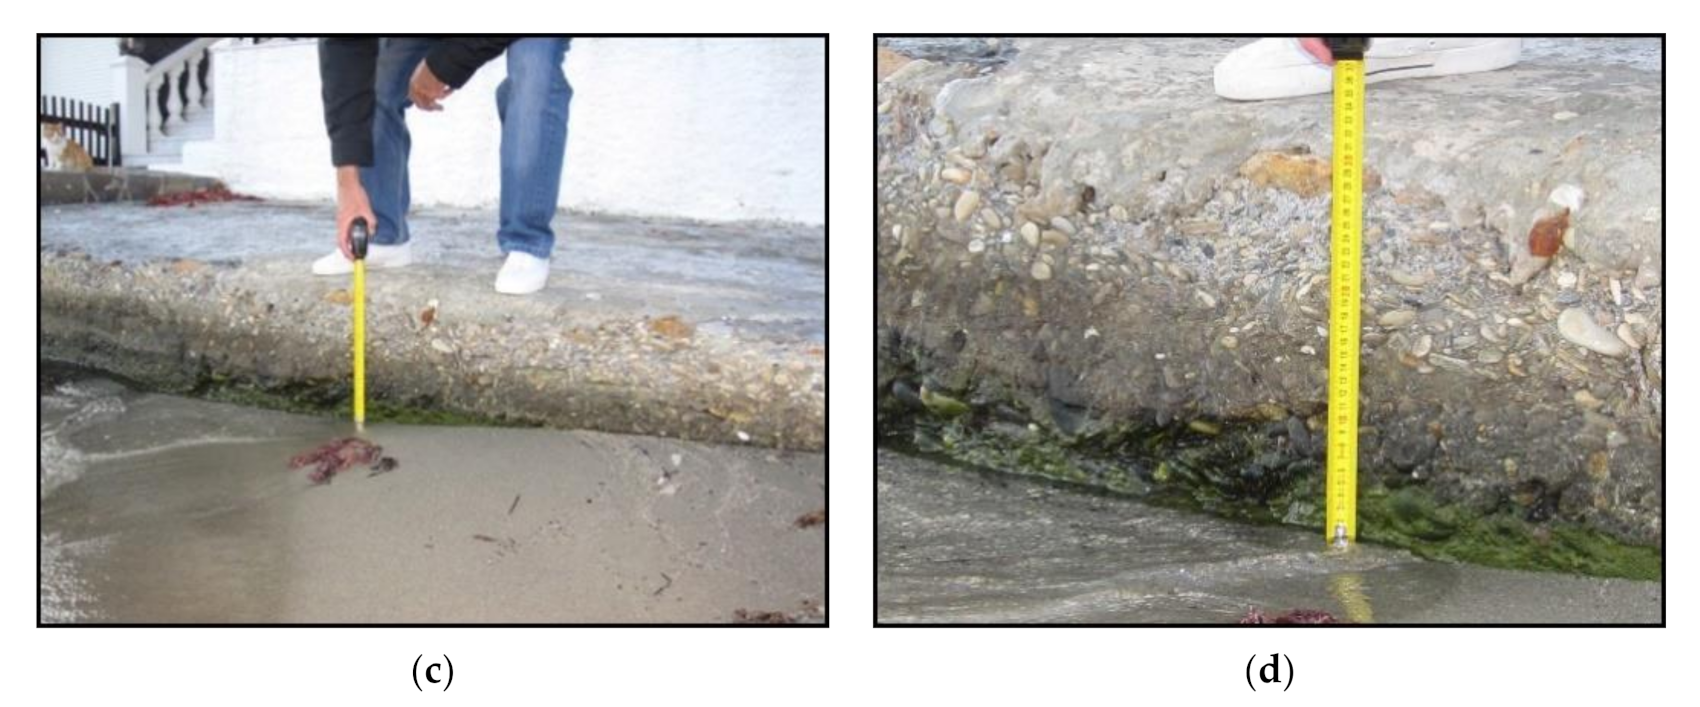
  • Uplift at Ayios Isidoros
The area of Ayios Isidoros is located at a distance of about 25 km southwest of the earthquake’s epicenter, ~7 km southwest of the Punta site (Figure 7). It is also composed of marbles of the Kerketeas unit [5,24]. During the earthquake, this area presented an uplift of 30 cm, which was also imprinted in the formations of the Kerketeas unit. At the base of the marbles along the rocky coast, the uplift has also extirpated intertidal biota. Based on the study on the Holocene shorelines conducted by [28], notches were found in the cape of Ayios Isidoros at the height of 0.50 ± 0.70 and 1.10 ± 1.30 m, respectively.
  • Uplift at Ayios Nikolaos
The area of Ayios Nikolaos is situated in the northwestern part of Samos at a distance of ~12 km southwest of the epicenter and ~4 km northeast of the town of Karlovasi (Figure 7 and Figure 10). It is composed of the clastic series of the Karlovasi basin and more specifically of incohesive conglomerates, which present alternations with and a lateral transition to more fine clastic deposits of grit and sandstones with a marly matrix. Locally, sandy loams and clays with disperse pebbles are also observed. The formations are of Miocene age.
In the Ayios Nikolaos bay, local people reported an uplift of coastal rocks observed immediately after the mainshock of 30 October 2020 (Figure 10). The same people observed a further uplift caused by the strong aftershock of 20 January 2021 measuring magnitude Mw = 4.5.
According to the epicentral determinations by the National Observatory of Athens (https://bbnet.gein.noa.gr/mt_solution/2021/210120_23_37_56.87_MTsol.html accessed on 21 January 2021), the aftershock’s epicenter is situated closer to the observation site with respect to the mainshock’s epicenter. We visited the area twice after both the mainshock (on 1 November 2020) and the aftershock (on 23 January 2021) and we were able to verify two uplift phases of an amplitude of 15–20 cm and 8–10 cm corresponding to the mainshock and the aftershock, respectively (Figure 10).

5.1.2. Permanent Surface Deformation in the Southwestern Part of Samos

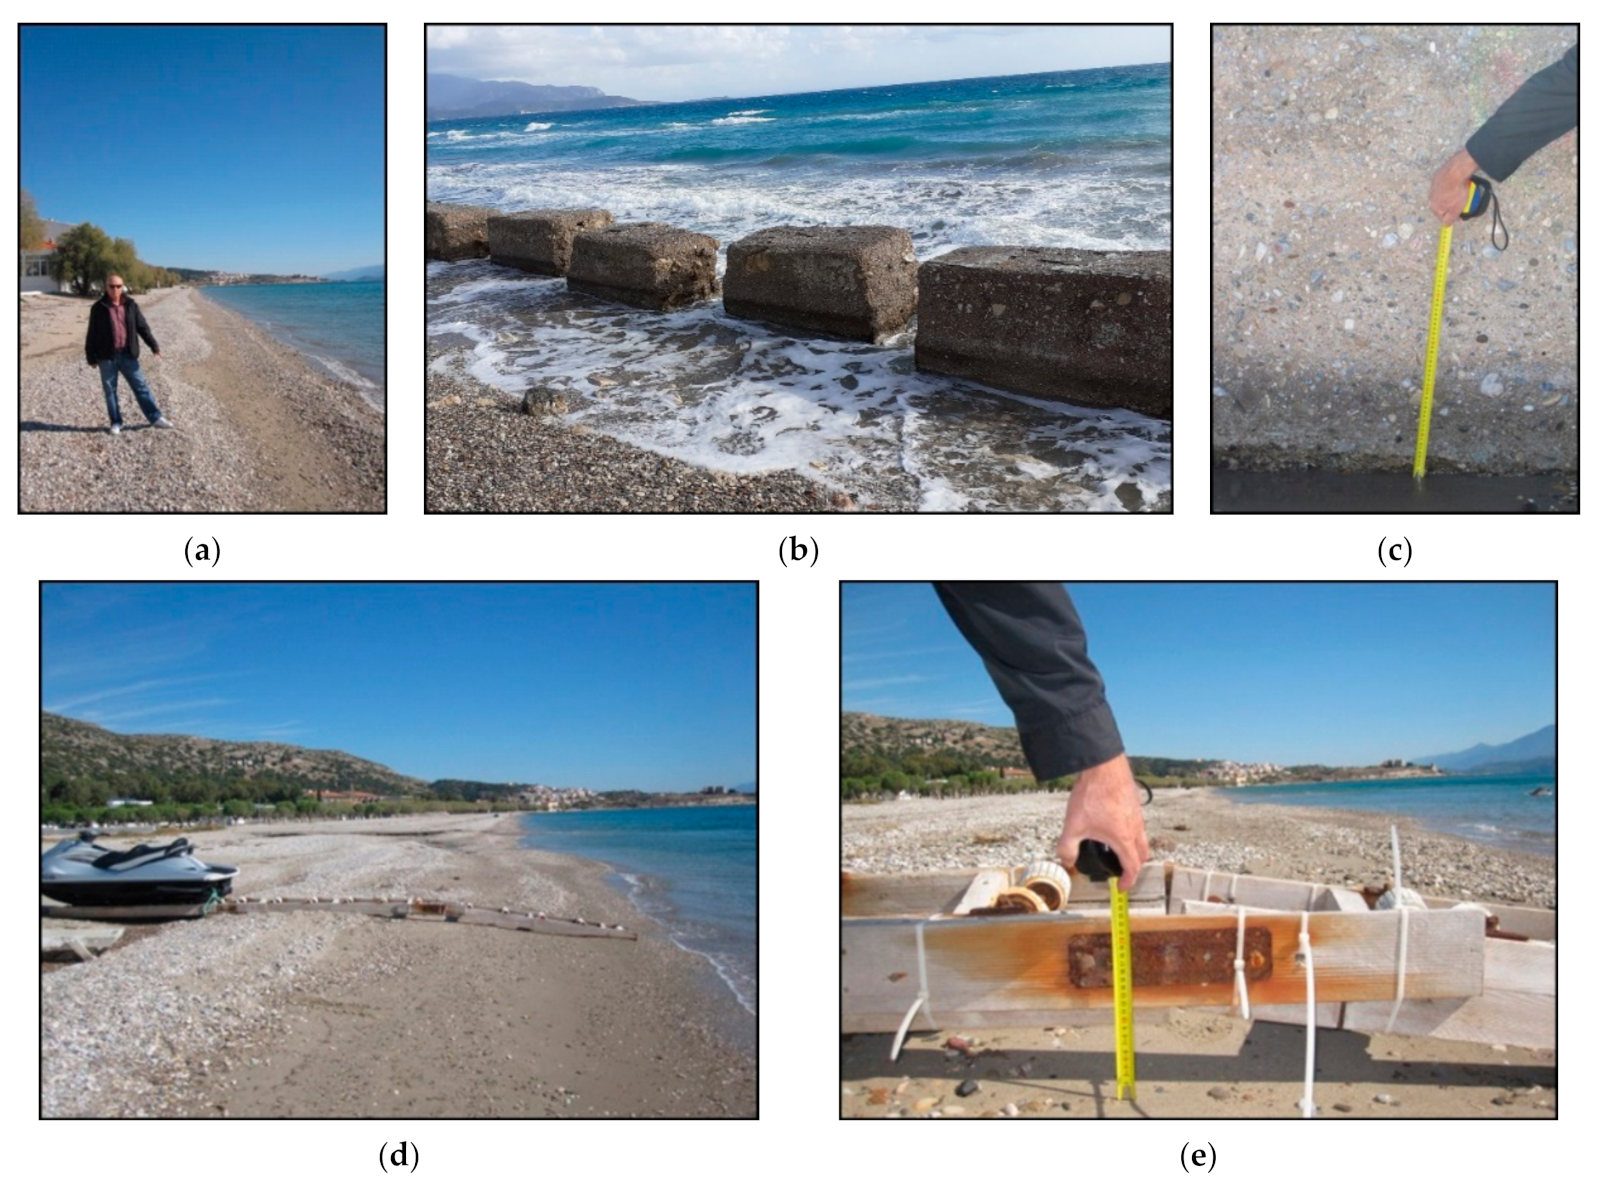
  • Uplift at Marathokampos bay
The Marathokampos bay is located at the southwestern end of the Karlovasi basin about 23 km southwest of the earthquake’s epicenter (Figure 7 and Figure 11). The affected coastal area is composed of sands and sand dunes, alluvial deposits, and scree and talus cones of Holocene age deposited over the Neogene formations of the Karlovasi basin situated to the north, east, and west of the Holocene deposits [5,7].
From the neotectonic point of view, the area has been affected by E–W-striking and N-dipping inactive faults. The main structure in the area is the Marathokampos–Kerketeas fault located north of Marathokampos bay. Along with the Pythagoreio fault, they constitute the most important neotectonic faults of Samos [7]. It is a fault zone comprising E–W-striking and N-dipping active normal faults. The scree and talus cones of Holocene age observed near the Marathokampos port are strongly related to a previous activation of the Marathokampos–Kerketeas fault.
The surrounding sands, sand dunes, and alluvial deposits are characterized by low potential for preservation of environmental earthquake effects. Therefore, the area with the permanent coseismic surface deformation has been detected only in engineered structures in the marina of the area (Figure 11). Namely, a local eyewitness, an engineer at the Merchant Navy, reported that an uplift was observed after both the mainshock and the aftershock of 20 January 2021 as exactly was independently reported by the Ayios Nikolaos settlement at the northern coast. We performed a field inspection on 24 January 2021, guided by the eyewitness, and verified the two phases of coseismic uplift imprinted on both the retaining stone wall of the coastal street (Figure 11) and the marina jetty (Figure 11). Due to the rough sea, we were unable to get an accurate measurement of the uplift amplitudes, which, however, were estimated to be about equal to those measured at the Ayios Nikolaos settlement, i.e., 15–20 cm and 8–10 cm corresponding to the mainshock and aftershock, respectively.
  • Uplift at the Kampos area
This observation site is situated about 2.5 km to the west of Marathokampos (Figure 7 and Figure 11). After the mainshock, a local resident reported a coseismic uplift imprinted in coastal limestones as well as on a small jetty of the village (Figure 11). Another eyewitness, a teacher of mathematics at the high school, verified the uplift related to the mainshock and also reported that a second uplift phase was noted after the aftershock of January 20, 2021. In our visit on 24 January 2021, we were able to visit the small jetty in spite of the rough sea and to verify the two coseismic uplift phases (Figure 11) of amplitudes comparable to those observed at the Ayios Nikolaos and Marathokampos observation sites.

5.1.3. Permanent Surface Deformation in the Southeastern Part of Samos

  • Uplift at the Pythagoreio area
The area of Pythagoreio is located 29 km southeast of the earthquake’s epicenter (Figure 7 and Figure 12). It is situated in the hanging-wall of the WNW–ESE-striking and S-dipping active normal Pythagoreio fault (Figure 7). Moreover, the area is also ruptured by NE–SW-striking and SE-dipping inactive faults. The Pythagoreio fault affects the lower non-clastic series of sediments of the Mytilinii basin, comprising marls, marly limestones, travertines, and sandy marls. Further to the west, this active normal fault juxtaposes the Neogene sediments of the Mytilinii basin in the footwall against the Quaternary deposits of the hanging-wall, including scree and talus cones along the fault and alluvial deposits at larger distances from the fault.
The permanent surface deformation of the Pythagoreio area was detected at the western and the northern part of the homonymous bay. The western uplifted site is the dock of the Pythagoreio port, which is located at the southern part of the town (Figure 7) and more specifically between the port park and the port parking lot (Figure 7). The dock is composed of shaped boulders, which are covered by concrete on the top of the dock. The detected permanent coseismic uplift was imprinted on the shaped boulders of the dock and was measured as ~20 cm (Figure 12a). In the northern part of the bay, the coseismic uplift was detected on nearshore rocks (Figure 12b) consisting of travertine limestones of the lower series of the Mytilinii basin [4]. The uplift varied from 15 to 20 cm in various parts of this coastal area (Figure 12b).
  • Uplift at the Psili Ammos area
The Psili Ammos beach is located at a distance of ~7 km to the east of the Pythagoreio site and 30 km from the epicenter (Figure 7). The coastal area is composed of sand and sand dunes, while the wider area is comprised of formations of the Vourliotes cover [4]. The area has been affected by numerous inactive faults either striking WNW–ESE and dipping to the south or striking NW–SE and dipping to the SW [4,7]. However, the main fault in this area, that bounds the occurrence of alluvial deposits in its eastern part, is the Vathy–Psili Ammos fault (Figure 7). This 11-km-long, NW–SE-striking and SW-dipping normal fault disrupts the metamorphic rocks of the Vourliotes nappe and extends from Psili Ammos in its southern end to the eastern part of Vathy bay in its northern end. This fault is characterized by an impressive surface offset mainly in the area of Paleokastro–Psili Ammos. According to the neotectonic study conducted by [7], this fault formed the Paleokastro basin during the Neogene–Quaternary.
As regards the permanent surface deformation in the Psili Ammos area, uplift was detected at a small dock along the Psili Ammos beach. The dock was built up with concrete, resulting in higher preservation potential of the uplift than the sand deposits along the coast. The uplift variation was measured to be around 15 cm (Figure 12c,d).
  • Uplift in the Potokaki area
The area of Potokaki is located 28 km southeast of the earthquake’s epicenter and 2 km to the west of the Pythagoreio uplift site (Figure 7). From the neotectonic point of view, it is located in the southeastern part of the Mytilinii basin. Its coastal zone is composed of coastal marine deposits, which include sands, dunes, and alluvial deposits that comprise clayey–sandy material, loam, sand, pebbles, and gravels. Northwards, Neogene sediments are also observed as a part of the sedimentary fill of the Mytilinii basin. The most recent coastal and alluvial deposits lie over the Neogene sediments. However, the area of Potokaki is not directly affected by faults.
A permanent coseismic uplift was detected at three spots of the Potokaki beach. At the first site, a local resident and owner of the Penelope hotel reported that a permanent sea retreat of ~2.5–3 m was observed after the earthquake event. This observation was verified independently by a couple of German tourists staying in a nearby hotel. All three eyewitnesses showed the old position of the seashore, which is marked by a ridge of gravels and pebbles. A drop of the sea level by ~20–25 cm was roughly estimated in this spot (Figure 13a).
Motivated by the eyewitnesses’ accounts, we searched for further evidence of coseismic coastal uplift. In a second observation spot, to the east of the first one, we found evidence of a permanent uplift imprinted on a series of cubic concrete blocks used as wave breakwall for the protection of the airport peripheral road (Figure 13b). The blocks lie at a distance of 230–500 m away from the first observation spot and are arranged in parallel to the seashore between the pre-earthquake and post-earthquake positions of the seashore. We inspected this observation spot twice, i.e., on 31 October 2020 and on 24 January 2021. During the first visit, on the landward side of the blocks we measured an uplift mark of ~17–20 cm (Figure 13b). Since the landward side of the blocks is at a distance of ~1 m from the pre-earthquake seashore, an uplift of up to ~25 cm was assumed. At the same spot, a permanent sea retreat was verified by a local resident who swims in the area. During our last visit, we realized that, except for the uplift associated with the mainshock, a second uplift episode is evident, which was attributed to the strong aftershock of 20 January 2021 (Figure 13d). Because of the rough sea prevailing on 24 January 2021, the amplitude of the second uplift episode was only roughly estimated at ~10 cm.
After the termination of the cubic block series, about 540 m to the east of the first observation spot, we inspected a jet ski stand with a wooden jet ski trailer consisting of two interconnected parts (Figure 13e,f). According to a local resident’s testimony, before the earthquake the seaward part of the trailer was partially placed in the water. However, after the earthquake the trailer was found to be completely out of the water, which is evidence of a permanent sea retreat. Additionally, the trailer was uplifted and partly broken at the interconnection place (Figure 13e,f), which can be explained by the abrupt ground uplift. However, it was not possible to reliably estimate the uplift in that spot.

5.1.4. Permanent Surface Deformation in the Northeastern Part of Samos

  • Uplift at Asprochorti
The Asprochorti site is located 23 km southeast of the earthquake’s epicenter (Figure 7). It is composed of marbles of the Vourliotes nappe formation [4,24] with beds dipping towards the NE. The dip in the Asprochorti area varies from 10° to 25° towards the NE. The area of Asprochorti is not directly affected by faults. From the neotectonic point of view, it is located in the hanging-wall of an almost E–W-striking and N-dipping inactive normal fault (7). From field observations, a coseismic uplift was imprinted and detected on marbles along the rocky Asprochorti beach (Figure 7 and Figure 14). The measured uplift amplitude was found to be ~10 cm. At the base of the emergent marbles, the uplift has extirpated intertidal biota (Figure 14).

5.2. Coseismic Surface Ruptures

Coseismic surface ruptures were observed in the northwestern part of the Karlovasi basin (Ayios Nikolaos, Ayios Elias, and Kontakaeika villages) and on the northern slopes of Ampelos Mt (Ampelos and the Ano Ayios Nikolaos village) (Figure 7, Figure 15, Figure 16 and Figure 17). From the neotectonic point of view, these areas are affected by normal faults with various geometries (Figure 7). There are N–S-striking and W-dipping faults, E–W-striking and S-dipping faults, and NW–SE-striking and SE-dipping faults. However, all these faults are of secondary order. The major fault of the area is the Hydroussa fault [7]. It is a NE–SW-striking and NW-dipping normal fault, which initially cuts formations of the metamorphic cover of the Ampelos unit in its northeastern part, then a volcanic formation and sediments of the lower series of the Karlovasi basin at its southwestern part. Although the geometry and the kinematic properties of the Hydroussa fault share the main features of predominant active tectonic structures in Samos Island, it is characterized as an inactive fault. The zone of the detected coseismic surface ruptures is located in the hanging-wall of the Hydroussa fault.

5.2.1. Ayios Nikolaos

The surface ruptures were observed at the Ayios Nikolaos village and south of it (Figure 7 and Figure 15). They constitute an almost 1-km-long zone. Their strike varies from N40° to N70°, while their vertical offset ranges from 5 to 8 cm. The northwestern rupture block had subsided, while the southeastern block was uplifted (Figure 15). The observed surface ruptures cut through the local coastal road of the village, and at higher altitudes they cut through olive fields as well as the northern regional road leading from Vathy in the east to Karlovasi in the west (Figure 15).

5.2.2. Ayios Elias

Surface ruptures were also observed in the area of Ayios Elias, at a distance of ~14 km southwest of the earthquake’s epicenter and ~2 km southwest of the Ayios Nikolaos site (Figure 7). The Ayios Elias area is composed of Miocene sediments from the clastic series of the Karlovasi basin. It comprises unbedded conglomerates in alternation with and a lateral transition to grit and sandstones with a marly matrix. In the western part of the area, sediments of the upper series of the Karlovasi basin are also observed to lie noncomformably over the conglomerates of the clastic series. The higher part of the upper series comprises marly and travertine limestones with intercalations of marls of low cohesiveness, which also include disperse pebbles.
The surface ruptures observed cut not only through the asphalt Vathy-Karlovasi road mentioned above, but also the ground on either side of it. The ruptures strike NW–SE with a total observable length of 600 m. Similarly to the site of Ayios Nikolaos, the northwestern rupture block subsided, while the southeastern one was uplifted. Their vertical offset varied from 5 to 10 cm, as derived from the field measurements.

5.2.3. Kontakaeika–Vrysses Area

The third area with detected surface ruptures is situated between the Vrysses and Kontakaeika villages at a distance of ~13 km southwest of the earthquake’s epicenter and ~1 km south of the Ayios Nikolaos site (Figure 7). They constitute an almost 1-km-long zone. The Kontakaeika–Vrysses area is composed of sediments of the clastic series of the Karlovasi basin and more specifically from conglomerates of low cohesiveness in alternation with and a lateral transition to loose grit and sandstones with a marly matrix. Locally, sandy loams and clays with disperse pebbles are also observed. The formation is of Miocene age [5].
The surface ruptures strike NE-SW and dip towards the NW (Figure 16 and Figure 17). Similarly to the Ayios Nikolaos and Ayios Elias sites, the northwestern rupture block subsided and the southeastern was uplifted (Figure 16 and Figure 17). The vertical offset varied from 5 to 10 cm. One of the observed surface ruptures within the village was observed to have caused a wide crack to a concrete road, displacement to the adjacent slope, damage to an adjacent perimeter wall of a garden, and a wide crack in the garden (Figure 16). Surface ruptures of strike, offset, and movement of the rupture blocks similar to those in the previous sites were also observed in an adjacent olive field.
Surface ruptures were also observed in the built environment of the Kontakaeika village. These ruptures very likely controlled the damage observed in the western part of the village, where some buildings with masonry load-bearing walls lying close to the surface ruptures suffered heavy structural damage. Some of the buildings collapsed, while others were characterized as temporarily uninhabitable until their proper reparation.
A 0.5-km-long and continuous surface rupture was observed in an olive field to the south of the Vrysses village. This rupture strikes NE–SW and dips towards the SE (Figure 17). Its vertical offset varied from 5 to 10 cm and its width from 5 to 15 cm. Based on the observed displacement, we concluded that the southeastern rupture block had been uplifted, while the northwestern one had subsided (Figure 17).
The zone of surface ruptures observed between the Kontakaeika and Vrysses villages can be considered as the southwestward continuation of the surface ruptures observed in the Ayios Nikolaos area.

5.2.4. Ampelos Village Area

The area of Ampelos is located in the northern central part of Samos and at a distance of ~12 km from the earthquake’s epicenter. It is composed of marbles of the Ampelos cover and from schists with many small volcanic bodies of the same unit. At the area situated immediately to the north of the Ampelos village, surface ruptures striking E–W and dipping NE were observed. The total length of the surface rupture zone was 350 m. Its vertical offset varied from 5 to 10 m and its width from 5 to 15 cm. Hot, humid air came out from a hole with a diameter of 30 cm. A few days after the mainshock, the air temperature in a shady spot of the surface rupture was measured as 14.5 °C, while at a depth of 30 cm in the hole of the rupture it was found to range from 20 °C to 22 °C. The air coming out from the ruptures was saturated with water vapor. In many spots, the surface ruptures were visible due to the moistened leaves along them contrasting with the surrounding completely dry soil. No sulfurous gas emissions were noticed along the surface ruptures.

5.2.5. Ayios Konstantinos Area

This area is located to the northeast and north of the Ampelos and Stavrinides villages, respectively, at distances of ~1.5 km from Ampelos, ~1 km from Stavrinides, and ~12 km southeast of the earthquake’s epicenter. The area is composed of schists of the Ampelos nappe [4]. The structure of the area is dominated by the occurrence of E–W-striking and N-dipping normal faults [4,7]. In the highest part of the village (the Ano Ayios Konstantinos area), we observed E–W-striking and N-dipping ruptures. The ruptures cut through a concrete pedestrian street and the adjacent road along with its small masonry retaining wall and the adjacent slope. The total observable length was more than 200 m, while the width was up to 15 cm. A vertical offset of 5 to 10 cm was measured. The northern block had subsided, while the southern one was uplifted. Buildings lying in the subsided block suffered important damage due to the earthquake.

6. Secondary Earthquake Environmental Effects
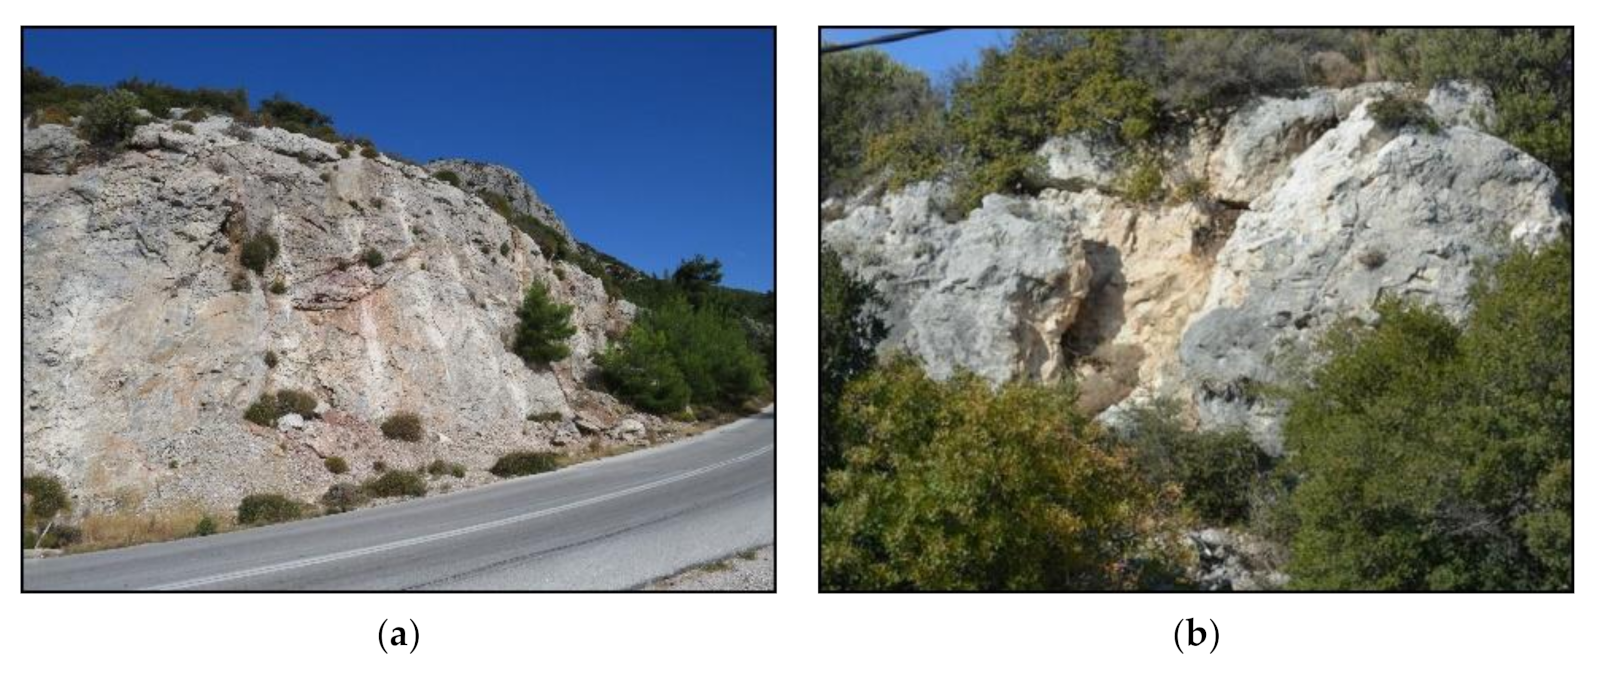
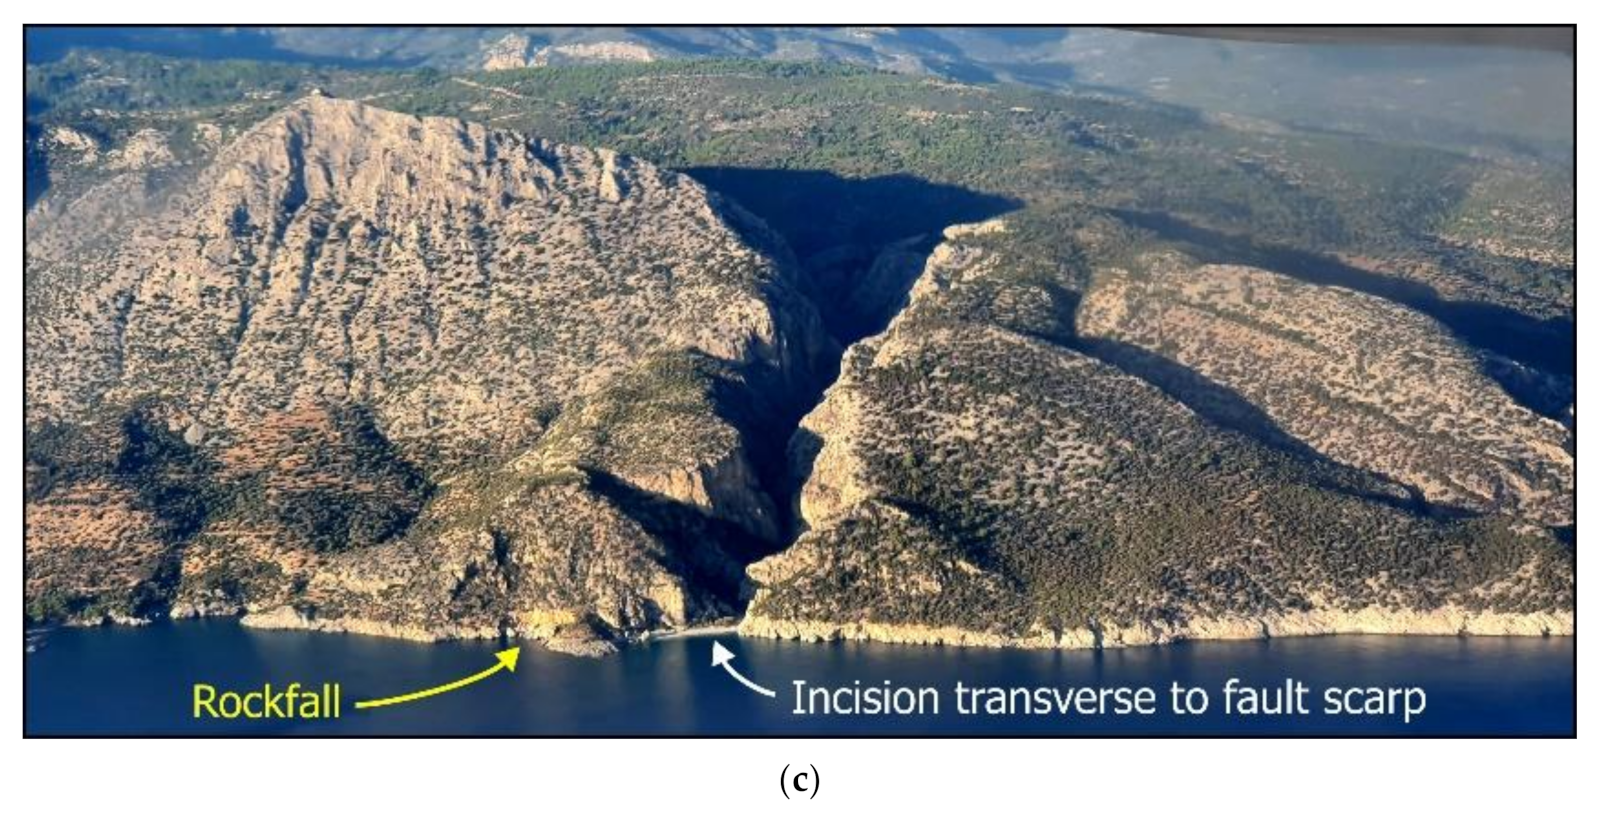
The 30 October 2020, Mw = 7.0, Samos earthquake induced secondary environmental effects. These effects included slope failures, liquefaction phenomena, hydrological anomalies, and ground cracks at several sites of the earthquake-affected Samos Island (Figure 18).

6.1. Slope Failures

During our post-event field surveys, we observed slope failures caused by the 2020 earthquake at several sites of Samos Island. The main observation sites included (Figure 18) the coastal fault scarps in the Potami area, the northwestern side of Samos, the southern slopes of the northern regional road of Samos from Vathy town to the Avlakia village, including the Kedros, Kokkari, Lemonakia, Avlakia, and Tsambou sites, the coastal slopes of Kokkari village, a slope on the local road leading from Ampelos village to Stavrinides village, slopes in the spots of Remataki and Marina and to the west of the Psili Ammos beach, all at the southeastern side of Samos, slopes in the Koumaeika area and on the road leading from Pyrgos town to Platanos village in central western Samos, and the coastal slope at Tsopela Cape at the southern end of the island.

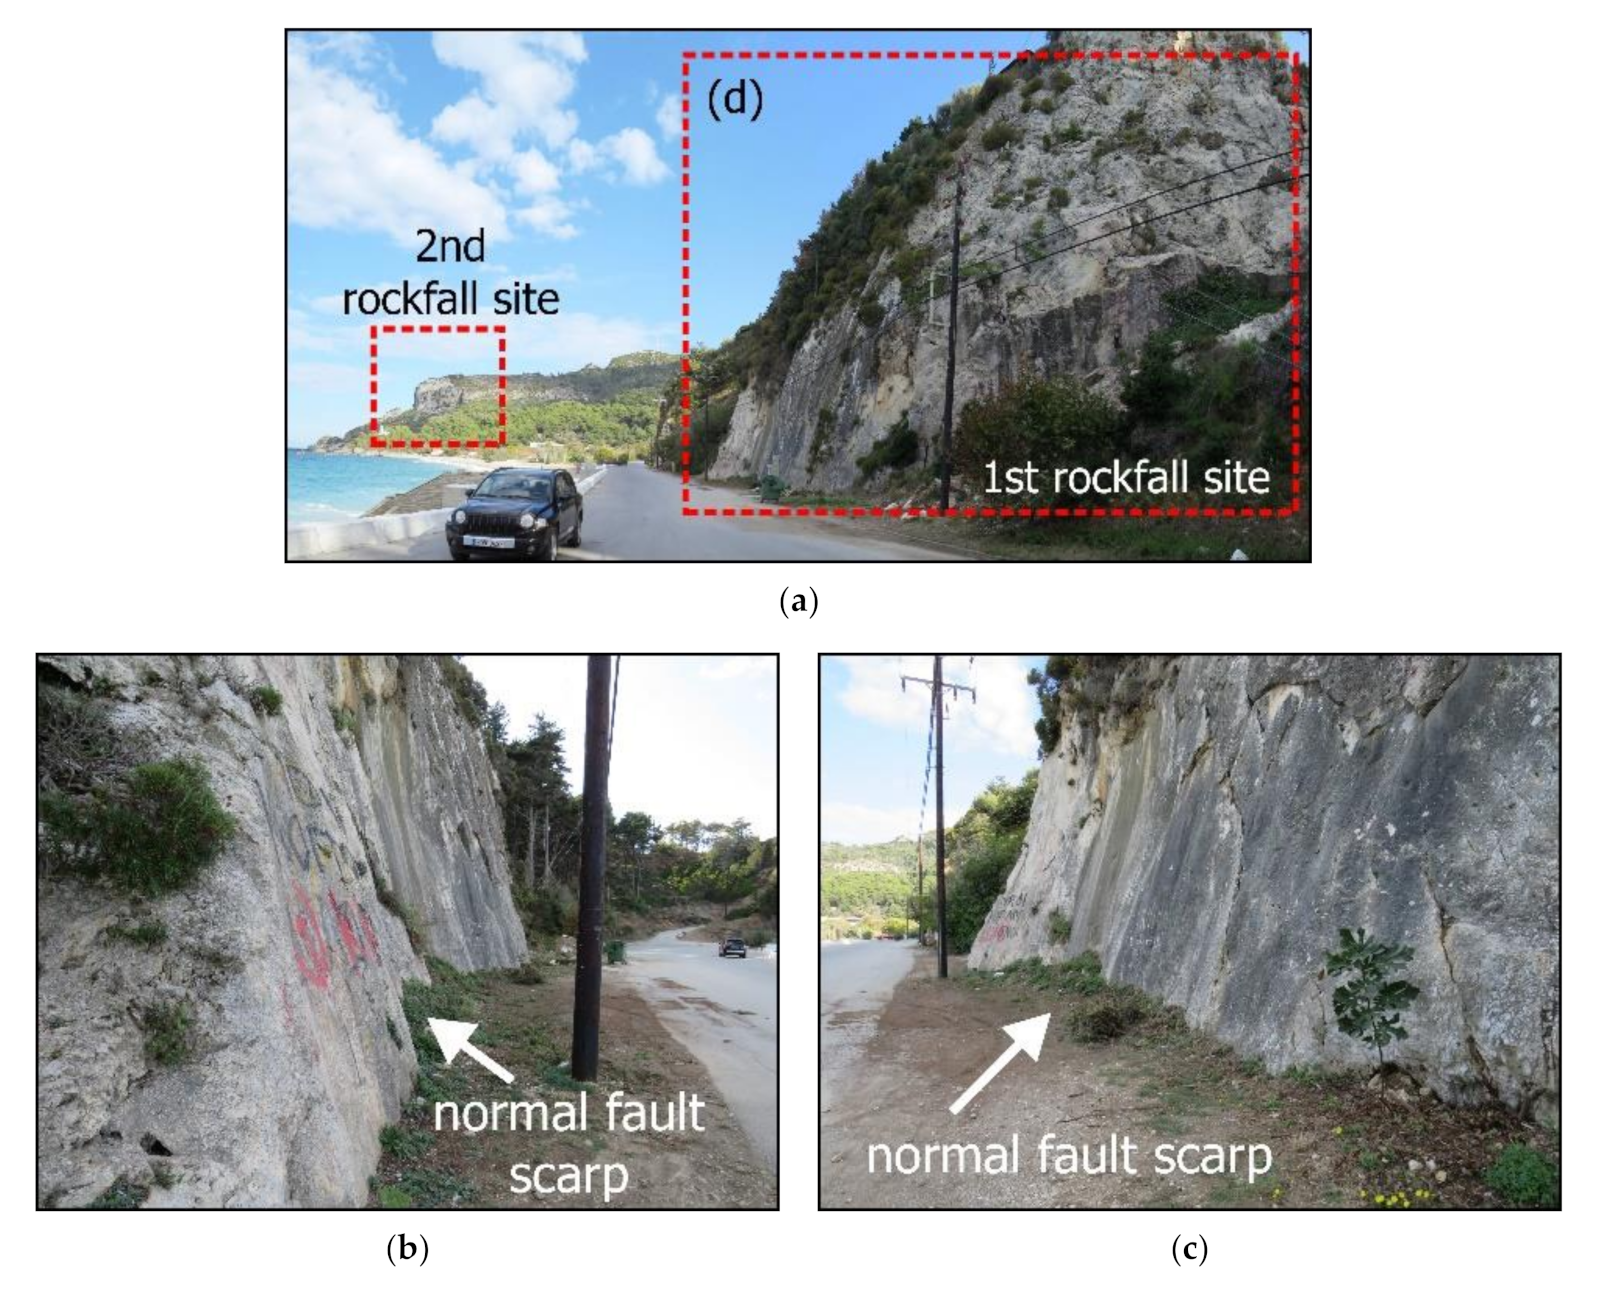
6.1.1. Failures along Fault Scarps in the Potami Coastal Area

In Section 5.1.1, it is noted that a permanent coseismic uplift was imprinted on metamorphic formations, and in particular in marbles of the Kerketeas unit, at the capes of Akra and Punta. The Potami area was affected by NE–SW-striking and NW-dipping active normal faults. The most important fault in the area is the Karlovasi–Kallithea fault, which dissects the area of Potami, resulting in large and impressive morphological discontinuities corresponding to coastal fault scarps and fault mirrors on marbles of the Kerketeas unit (Figure 19a–c).
Fall of marble fragments was triggered along the Karlovasi–Kallithea fault due to the ground shaking by the 2020 earthquake (Figure 19d,e). A spot of rockfall observation was located at the fault scarp situated a few meters southeast of the Punta promontory. This scarp has a height of more than 40 m and the marbles are strongly faulted, resulting in their disintegration into small fragments or their decomposition into powder (Figure 19d,e). During the mainshock, unstable blocks of marble were detached from the upper parts of the slopes and rolled down to the lower parts of the slope but without affecting the nearby coastal road (Figure 19e).
It is remarkable that at the base of this fault scarp, particularly at the contact of the marbles of the footwall with the hanging-wall formations, which are either schists underlying marble or scree of limited extent, many fresh surfaces of recent rock fractures were observed and many fresh fragments were observed along the base of the scarp. These fragments, however, were not produced from the failure of the above parts of the scarp, as no such detachments occurred at these sites. By all evidence, they are of tectonic origin and are attributable to the strong motion exercised along the contact between the footwall and the hanging-wall during the seismic excitation.
Slope failures were also triggered in another fault scarp that is part of the Karlovasi–Kallithea fault and located northeast of the first site and closer to the Akra promontory (Figure 19a, second rockfall site). Similar phenomena of detachment of marble fragments occurred in this location as well, without causing damage to the built environment.

6.1.2. Slope Failures along the Southern Coastal Part of Vathy Bay

The sites affected by slope failures along the northern regional road of Samos from Vathy town to Avlakia village as well as in the coastal area of Kokkari village (Figure 18 and Figure 20) present similar features in their geology, lithology, active tectonics, and geomorphology and, therefore, they will be presented in the same section.
Slope failures in this area were generated in the northeastern part of the Mytilinii basin, which is the eastern Neogene basin of Samos [4] (Figure 18 and Figure 20). It is built by formations of the upper series of the Mytilinii basin. In particular, it is composed of lacustrine limestones, travertine, and, in some places, a marly matrix with layers of loose marls, clays, and tuffitic bodies with disperse pebbles, while pure conglomeratic breccia are also present in intercalations [4]. These formations are of Pliocene age and their total thickness reaches 250 m.
The beds of the above formation dip towards the NE with the dip ranging from 10° to 55°. More specifically, the beds dip towards the NE with 15° at the Kedros site, 40° at the Kokkari site, 55° at the Lemonakia site, 50° at the Avlakia site, and 30° at the Tsambou beach. It is of importance that at all sites the dip of beds is nearly the same as the dip in the slope, which is a factor that favors the generation of slope failures, especially during strong ground motion such as that caused by the large 2020 earthquake, the epicenter of which is relatively close to the landslide-prone sites. The epicentral distance of these sites ranges from 14 km for the Tsampou beach at minimum to 20 km for Kedros at maximum.
From the neotectonic point of view, the area is dissected by NW–SE-striking and NE-dipping normal faults arranged parallel to the shoreline [4,7]. These faults affect the aforementioned formations and define the almost linear coastline, which has a similar average NW–SE trend. Moreover, they also form high and steep slopes, especially at the Avlakia and Kokkari coastal sites (Figure 20).
The 8-km-long, NW–SE-striking and NE-dipping Kokkari–Vathy normal fault dominates the area of the aforementioned slope movements in the southern coastal part of Vathy bay. It defines the southern margin of the structure of Vathy bay. Moreover, it caused tilting of the Pliocene limestones in the area. This tilting constitutes an indication of recent tectonic activity. Based on the available geological and seismological data, it has been characterized as probably an active fault [7].
The slopes at the Avlakia site, situated almost 100 m from the shoreline, have a height varying from 180 to 200 m and coincide with a steep coastal scarp of a normal fault (Figure 20). At this site, the presence of the normal fault with its steep coastal scarp along with the large slope of beds (50° towards the NE), which coincides with the slope of the scarp, forms an unstable zone characterized by formations that are extensively deformed. This zone is highly susceptible to slope failures. The synergy of these factors led to the triggering of the largest slope failure induced onshore by the 30 October 2020 earthquake (Figure 20).The slope failure at Avlakia comprises landslides and rockfalls (Figure 20). Unstable material was detached from the slope during the earthquake and filled the adjacent coastal road, resulting in a temporary disruption for many days. The road was blocked for fear of new failures during the aftershock sequence.
At the coast of Kokkari village, failures were generated along the slopes of the peninsula located at the northern end of the village and on the islet situated southeast of the peninsula (Figure 21). Both landforms are composed of sediments of the upper series of the Mytilinii basin and especially of travertine limestones with layers of loose marls, clays, and toffitic bodies, which contain dispersed pebbles. These formations appeared to be intensively deformed, very likely due to the tectonic structures of the area. In fact, the peninsula and the islet in the coastal area of Kokkari were affected by the probably active NW–SE-striking and NE-dipping normal fault of Kokkari–Vathy, whose NW tip was detected in this area to form the linear northeastern coastline of the landforms (Figure 21). Moreover, there are limestones with large slopes having a dip of 30° and 35° towards the NE on the peninsula and in the islet, respectively. The synergy of endogenic and exogenic processes caused rockfalls to occur in the past, which are attributed either to strong earthquakes or to extreme rainfall.
It is noteworthy that at the site of the rockfalls on the Kokkari peninsula, the unstable rocks fell towards adjacent buildings, causing damage to their non-structural elements and to a perimeter wall constructed along the base of the affected slope (Figure 21). Fortunately, neither structural building damage nor fatalities were reported.

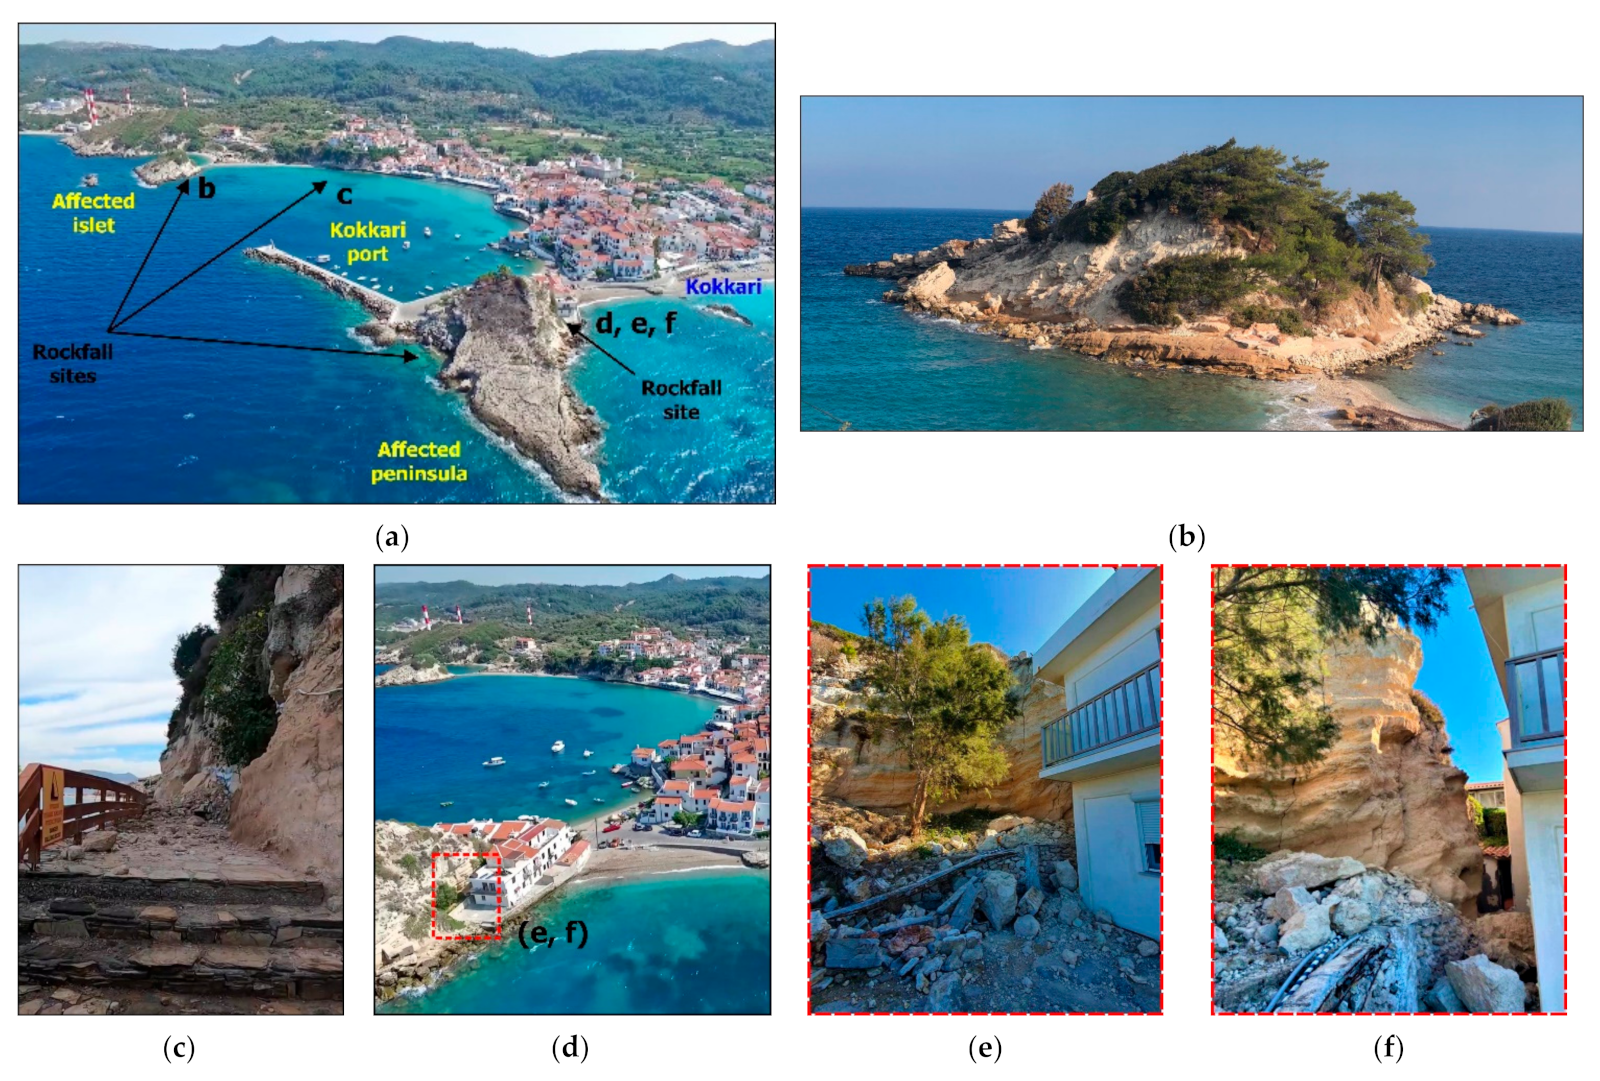
6.1.3. Slope Failures in Northern Samos

Slope failures were also observed west of Avlakia, along a slope in the local road connecting the Ampelos and Stavrinides villages. The site is located at a distance of ~13 km south of the earthquake’s epicenter. It is composed of Ampelos formations and especially of marbles and schists. The marbles are in the form of layers or large banks within schists and are often strongly folded and faulted.
The site of the slope failure comprises schists with layers of marble and it is affected by an E–W-striking and S-dipping normal fault. It is worth mentioning that, in the area north of Ampelos village, surface ruptures were also generated in a similar geometry to the fault.

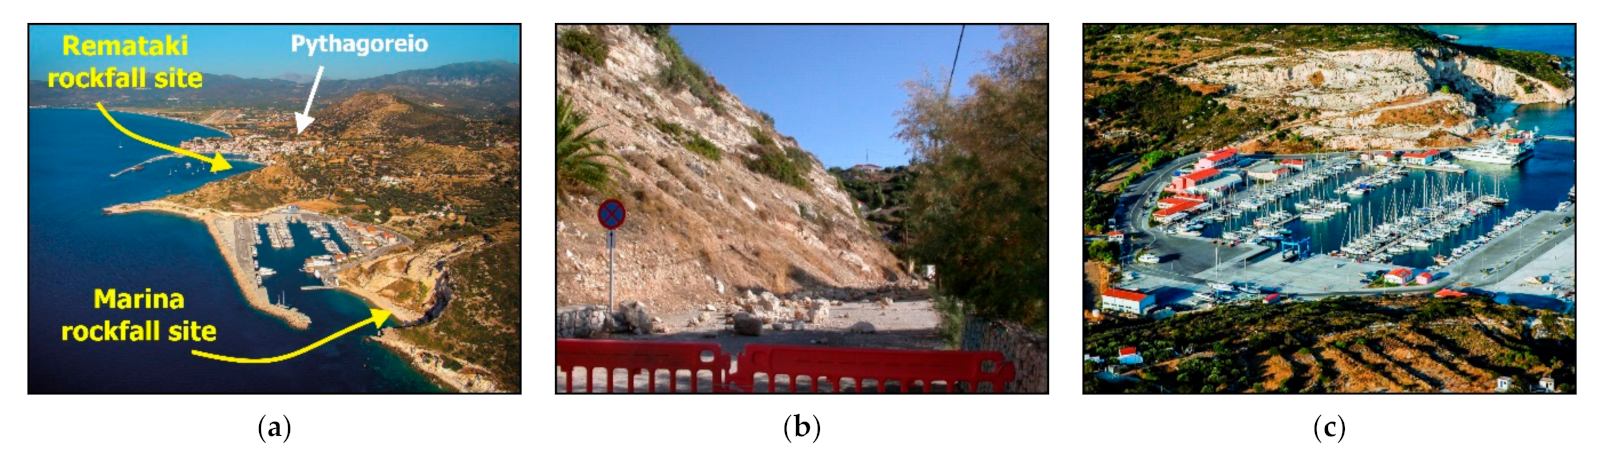
6.1.4. Slope Failures in the Southeastern Part of Samos

  • Rockfalls at Remataki
Remataki is located at the eastern end of the Pythagoreio town, at the southeastern part of the Mytilinii basin at a distance of ~28 km southeast of the mainshock’s epicenter (Figure 18). It is composed of travertine limestones and marls with intercalations of clay and layers of tuffs and tuffitic bodies. In the area of Pythagoreio, travertine limestones prevail. The rockfall-affected formation is of Miocene age.
From the neotectonic point of view, the area was affected by the Pythagoreio fault (Figure 18). Its onshore eastern end is located near the Remataki site. As mentioned previously, this fault is the most important neotectonic structure in eastern Samos with a WNW–ESE strike and a southward dip.
The upper and lower parts of the slope that failed at Remataki are composed of travertine limestone and marls, respectively. The slope failures due to the strong ground motion comprised blocks that fell from the overlying limestones (Figure 22). The generation of the blocks is attributed to the differential erosion of the formations. The underlying marls erode more easily than the overlying limestones, resulting in excavation and subsequently fall of the limestone blocks.
Extensive rockfalls were generated at the same site on January 2017 after a period of extreme rainfall. These rockfalls caused serious damage to passing and parked cars. No fatalities or injuries were reported. Since then, this section of the road at the Remataki site has remained closed and will remain closed until the completion of the protection works and the stabilization of the rockfall-affected slope.
  • Rockfalls at Marina of Samos
This site is located at the eastern end of the Marina of Samos, at a distance of ~1 km from the Remataki site and ~29 km southeast of the earthquake’s epicenter (Figure 18). It is composed of formations of the lower series of the Mytilinii basin and especially of travertine limestones, marls with intercalations of clay and loam, and layers of tuffs and tuffitic bodies. The site is likely affected by the Pythagoreio fault as it seems that the zone terminates onshore at this rockfall site (Figure 18). During the earthquake, only small rockfalls occurred without a further impact on the surrounding environment, on the road network, and on the Marina port facilities (Figure 22).
  • Rockfalls east of the Psili Ammos area
This site is located at a distance of ~7 km northeast of Samos Marina and ~31 km southeast of the earthquake’s epicenter (Figure 18). It is composed of marble of the Vourliotes nappe. The site is affected by an E–W-striking fault, whose westward continuation juxtaposes the formation of the Vourliotes nappe against Quaternary deposits. During the earthquake of 2020, several blocks of marble collapsed.

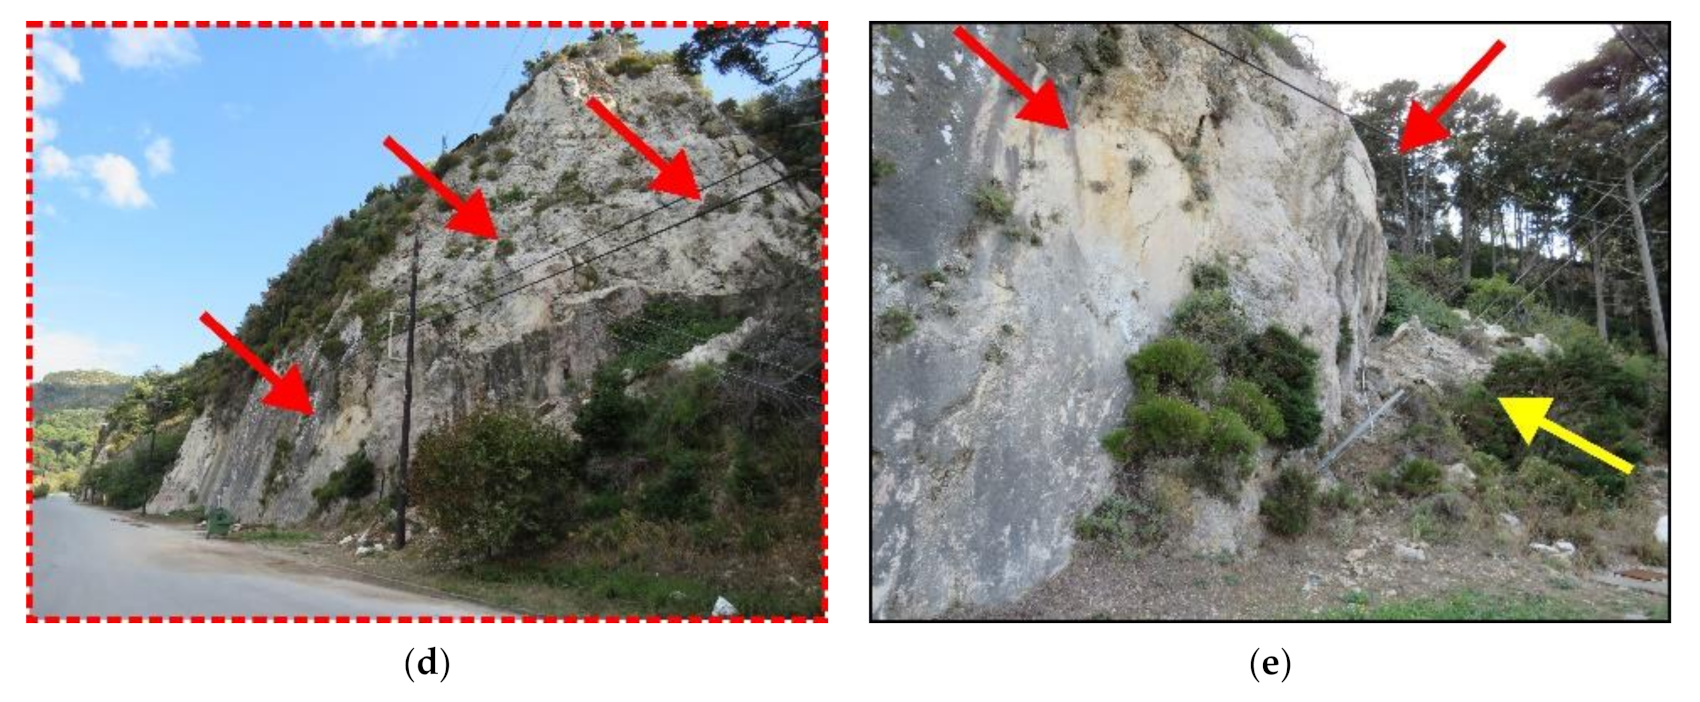
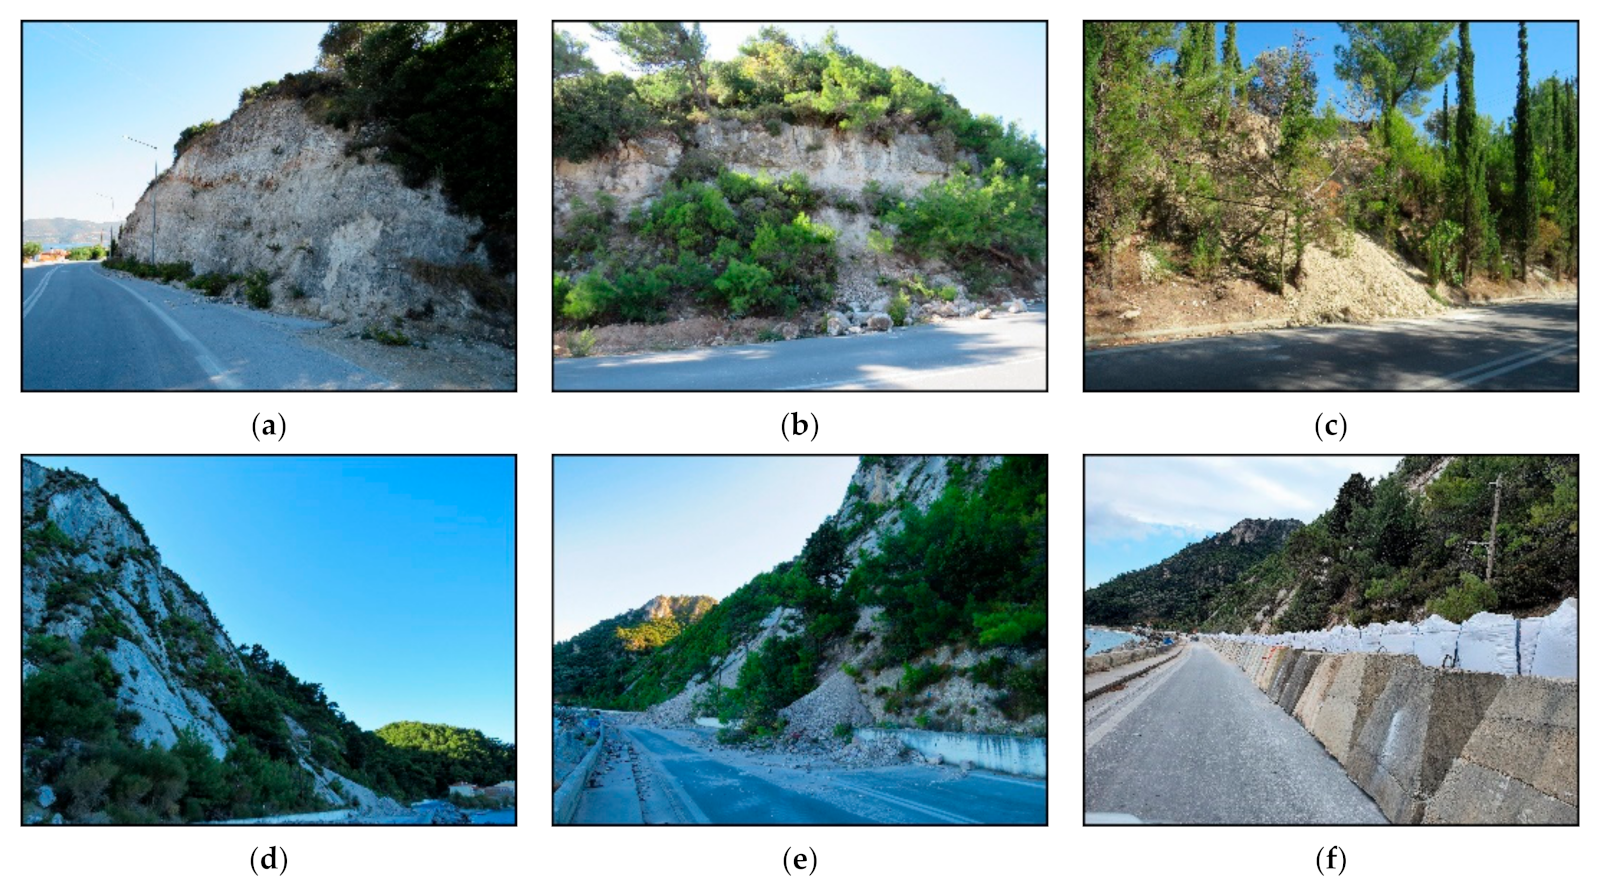
6.1.5. Slope Failures in the Southern and Southwestern Part of Samos

  • Rockfalls in slopes along the road from Pyrgos to Platanos
Another site affected by slope failures is located on the northern artificial slope of the road leading from Pyrgos town in the east to Platanos village in the west (Figure 18 and Figure 23). The area is located at a distance of ~22 km south of the earthquake’s epicenter. The site is composed of marbles of the Ampelos nappe with a dip of 30° to 40° to the north. Scree related to the Pythagoreio fault has also been observed close to this site. Unstable marble fragments were detached from the slope and fell at its base (Figure 23a).
  • Rockfalls at Koumaeika village
The Koumeaika area is located in the southern part of Samos; in particular, northeast of Marathokampos bay at a distance of ~23 km south of the 2020 earthquake’s epicenter (Figure 18 and Figure 23). The area is composed of lacustrine, medium-to-thick-bedded, travertine-like limestones, and thin-bedded marls with intercalations of loam and clay with beds of tuffs and tuffites. This formation is of Miocene age [5]. Moreover, the area comprises Neogene conglomerates of fluvial terrestrial origin, including pebbles from metamorphic rocks, mainly from quartzites, marbles, and schists. From the noetectonic point of view, the Koumaeika area is affected by E–W-striking and S-dipping and NW–SE-striking and SW-dipping normal faults, which are considered to be inactive [7]. The 2020 Samos earthquake triggered slope failures in the Koumaeika area. In particular, unstable fragments of travertine-like limestones were detached from slopes and fell down (Figure 19b). No damage to the built environment was reported.
  • Rockfalls at Tsopela Cape
This site is located at Tsopela Cape, at the southern end of Samos, at a distance of ~31 km from the earthquake’s epicenter (Figure 18 and Figure 23). It is composed of marble of the Ampelos nappe. From the neotectonic point of view, the site is affected by the E–W-striking and S-dipping normal fault of Tsopela Cape. Rockfalls were observed along the fault scarp and the fragments fell into the sea (Figure 23c). It is significant to note that east of the rockfall site, [15] detected an uplift of +23 cm.

6.2. Liquefaction Phenomena
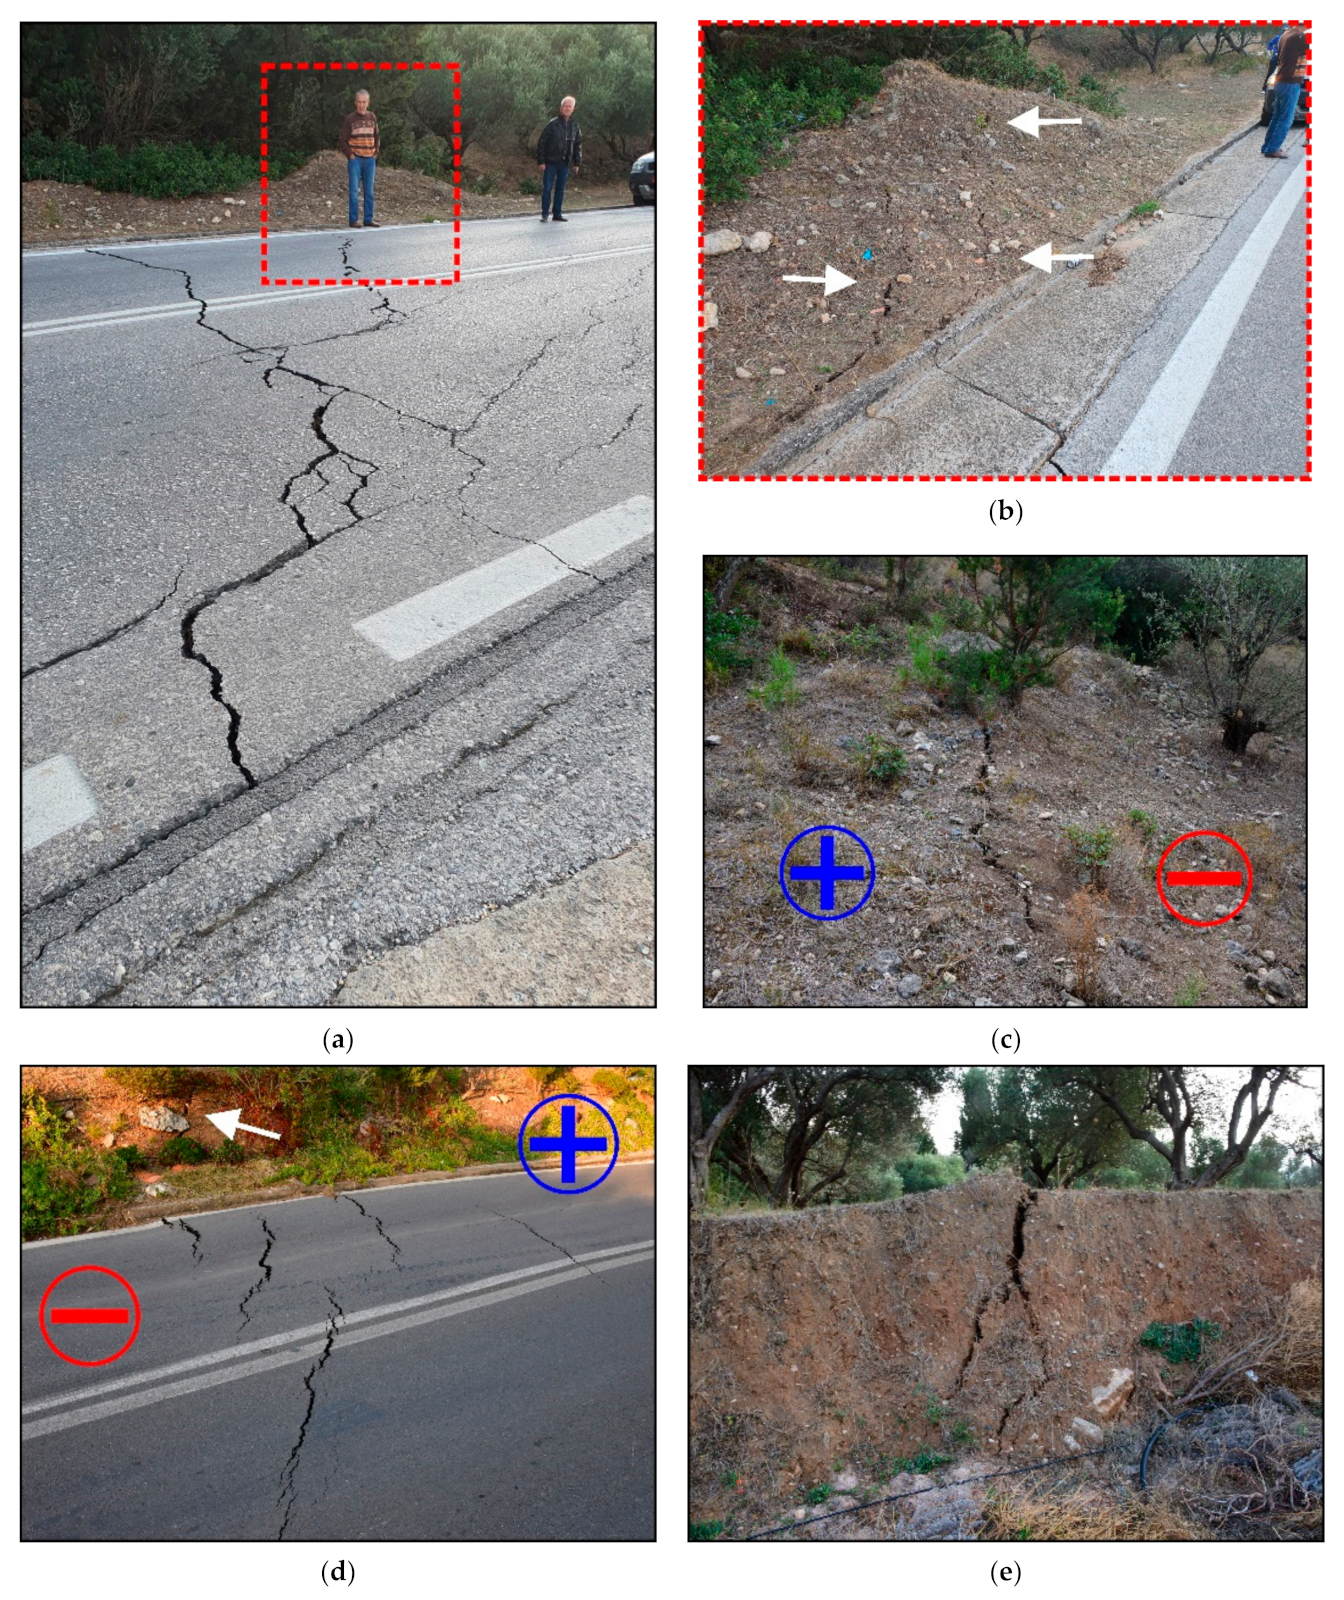
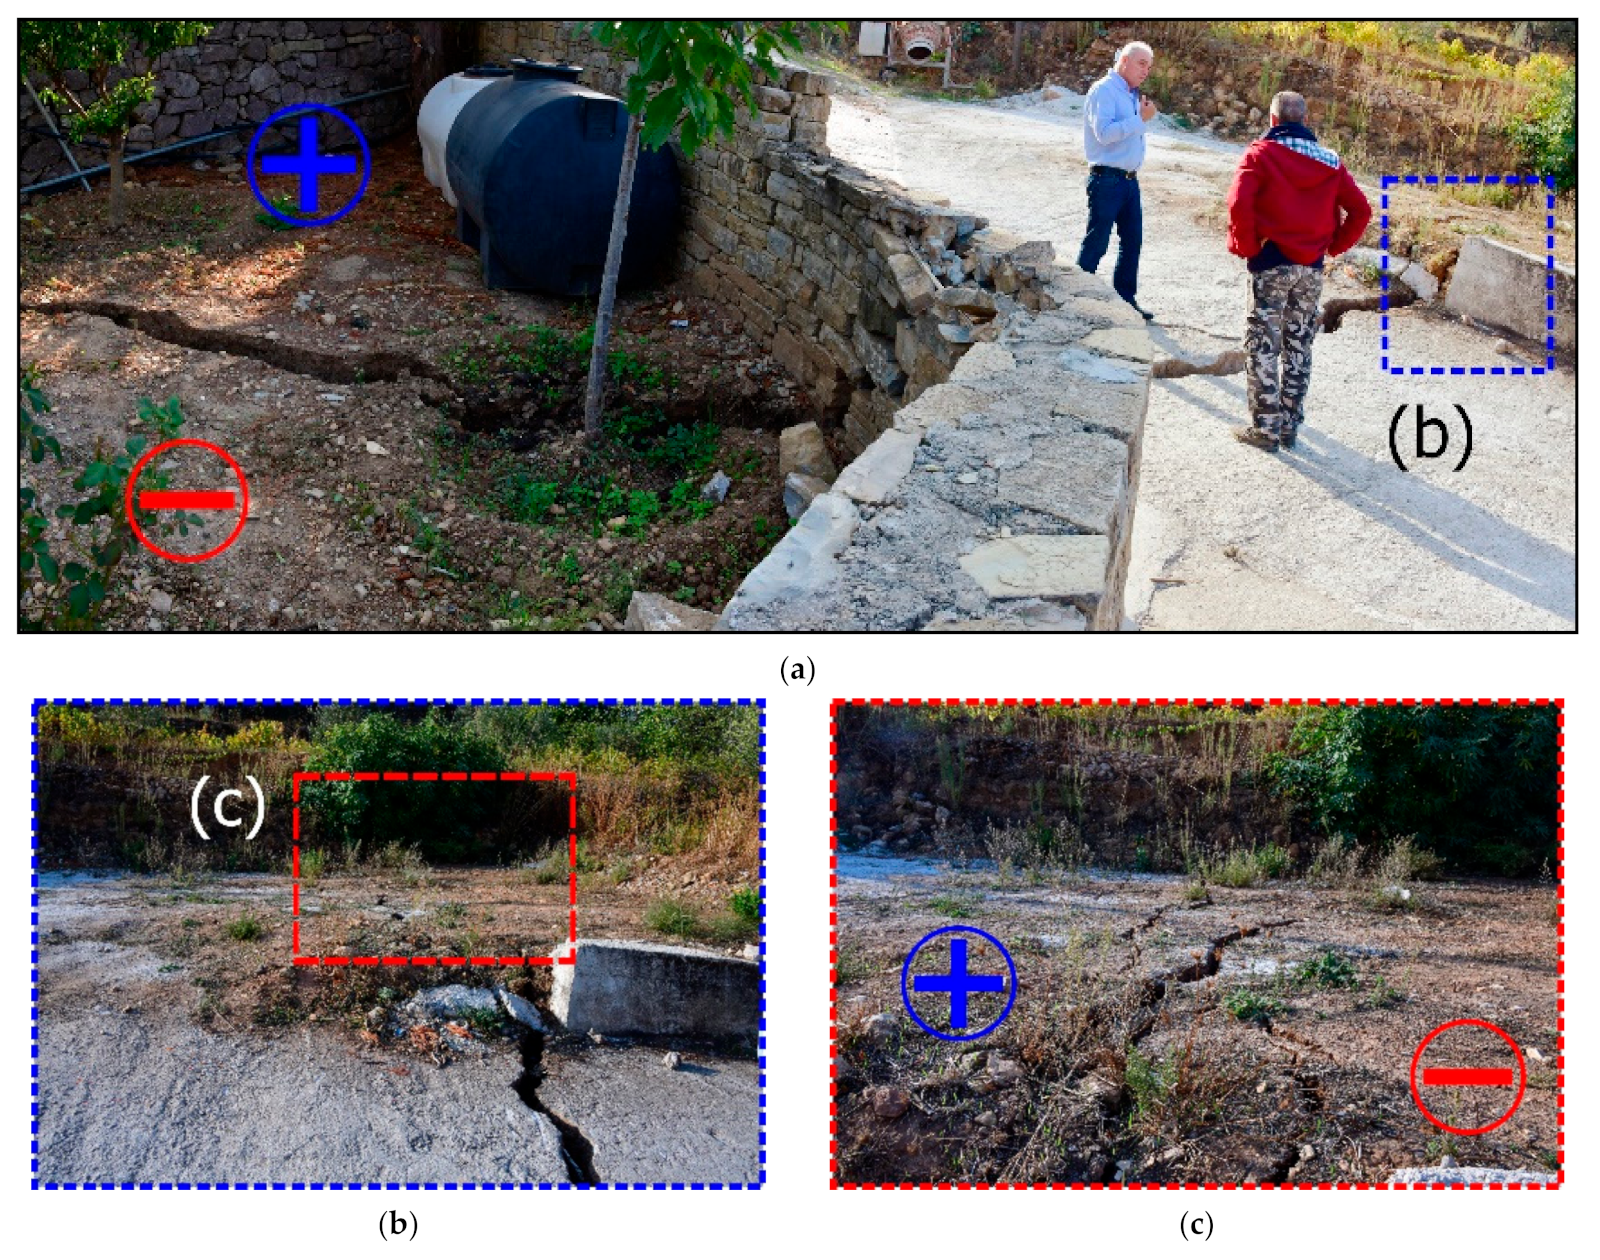
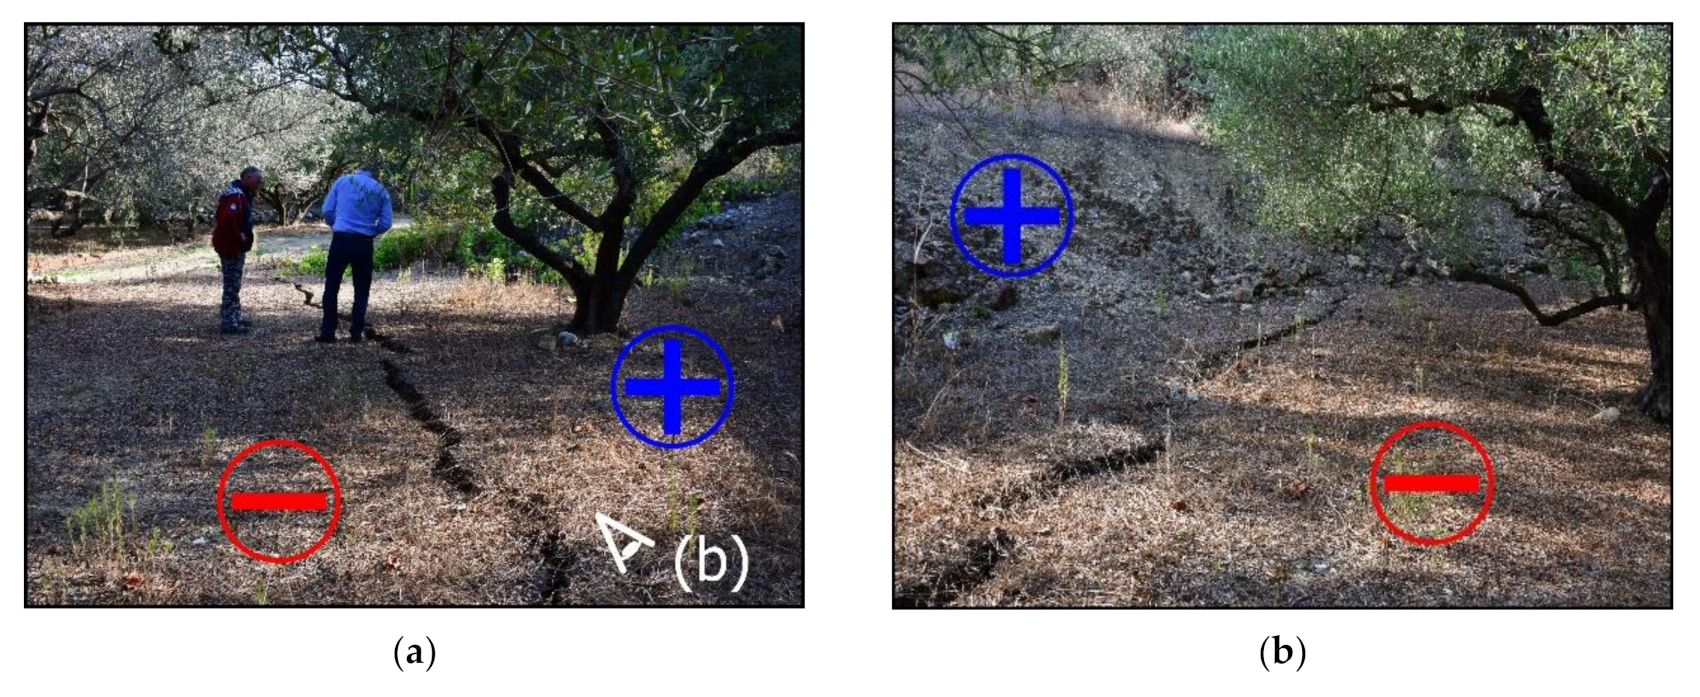
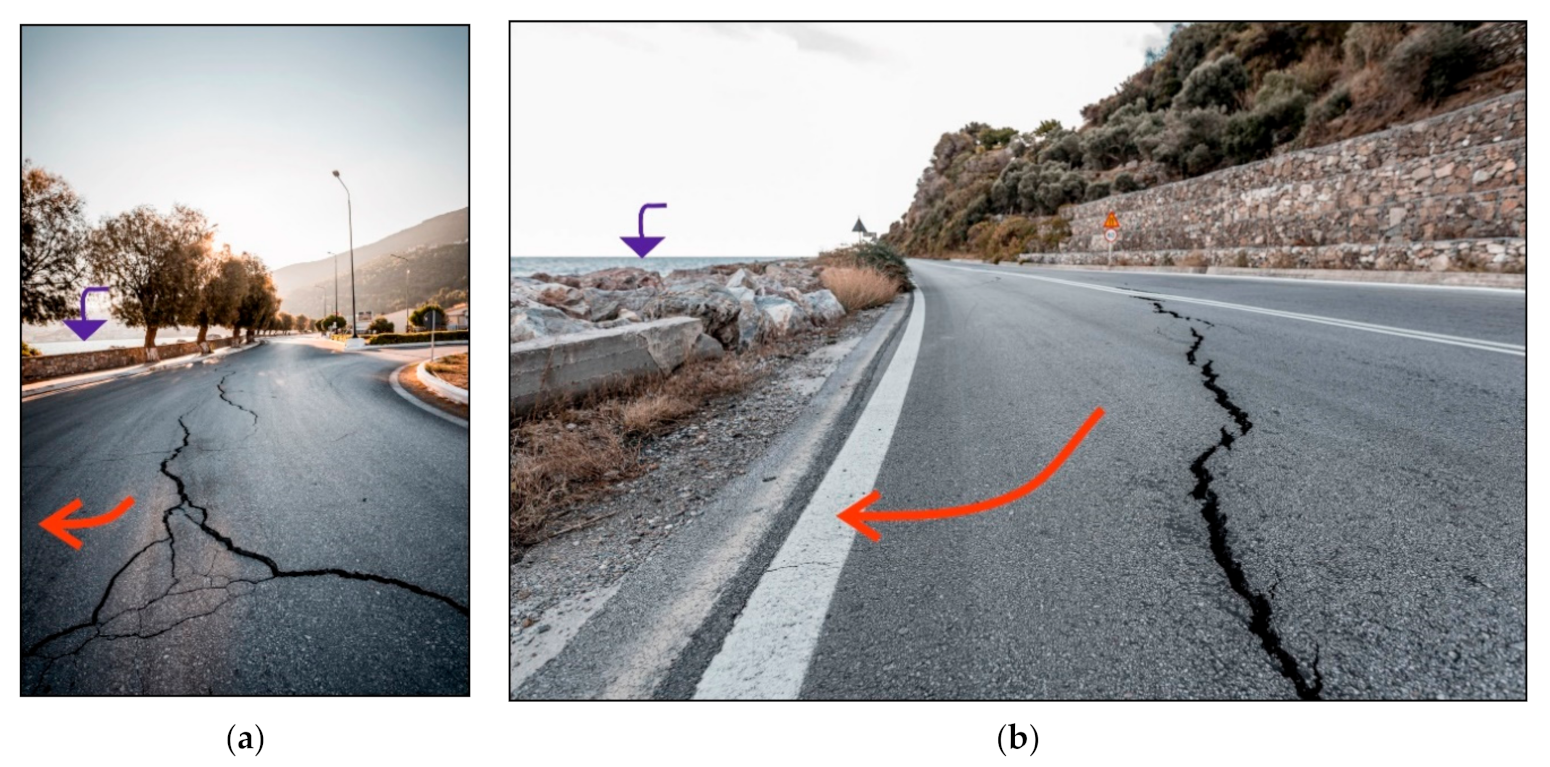
Liquefaction in soil was observed in the coastal area of Malagari, at the southern Vathy bay (Figure 18 and Figure 24), an area composed of alluvial deposits and sands. The occurrence of Holocene deposits is bounded to the west by a NW–SE-striking and NE-dipping fault, which juxtaposes the sediments of the upper series of the Mytilinii basin against alluvial deposits. This fault has been characterized as inactive [7]. The active Kokkari–Vathy fault is situated further to west. The observed liquefaction phenomena were generated in its hanging-wall.
The liquefaction phenomena were observed at the new commercial port of Malagari and further north at the Maounes beach (Figure 24). At the commercial port of Malagari, cracks were found in the pier. These cracks were not caused by the earthquake, but they are related to undercutting of the pier, which took place years before the earthquake and was attributed to poor workmanship. After the 2020 earthquake, these cracks appeared slightly enlarged, while sandy material was observed along them, which may be attributed to liquefaction due to the ground shaking.
At the Maounes beach, typical liquefaction phenomena were observed that included an extensive network of cracks in the ground, which at the same time subsided (Figure 24). Moreover, ejection of liquefied material composed of water and sand also occurred and resulted in the formation of extensive liquefaction deposits on both sides of the cracks (Figure 24). The ground subsidence took place at a part of the beach that was 1.5–2.0 m in width and its vertical amplitude was measured at 50–55 cm. At the same time, lateral spreading of the coast towards the sea moved small trees from their initial position at a shallow depth offshore (Figure 24).

6.3. Ground Cracks

6.3.1. Malagari Site

At the coastal area of Malagari, southeast of the aforementioned liquefaction sites, ground cracks were also observed (Figure 18 and Figure 25). This site is composed of artificial deposits used during the construction of the asphalt road. The cracks, being of a small aperture, cut through the Vathy–Kokkari road, especially near the roundabout before the new port (Figure 25a).

6.3.2. Petalides Site

The Petalides area is located on the northern central coastal side of Samos and along the northern regional Vathy–Karlovasi road (Figure 18 and Figure 25). The area is composed of scree and talus cones, the occurrence of which is bounded to the west by a NW–SE-striking and NW-dipping fault and to the east by a NE–SW-striking and NW-dipping fault. The fault in the east is the Hydroussa fault, which is described in a previous section in relation to the coseismic surface ruptures in Ayios Nikolaos. The ground cracks at Petalides were created in artificial deposits used in the past for the widening of the coastal road (Figure 25b). They are considered to be secondary earthquake environmental effects caused by the ground shaking.

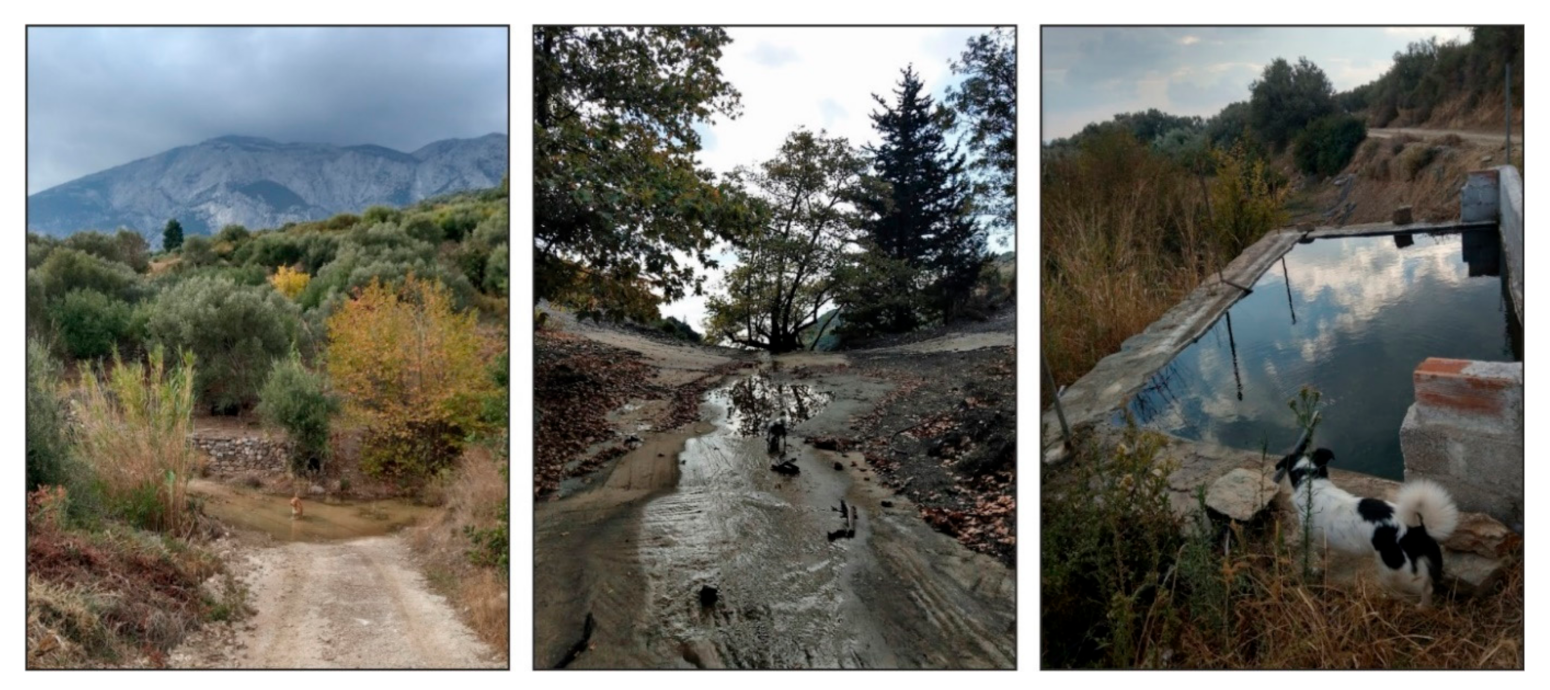
6.4. Hydrological Anomalies

Hydrological anomalies caused by the 2020 earthquake included changes in the flow rate in water springs and the reappearance of springs with increased water flow (Figure 18). Such an anomaly was reported north of Ampelos, in north Samos (Figure 18). Namely, increased water discharge at the Moutsara (or Karagatsa) spring was reported after the earthquake. This spring is located north of Ampelos village, at a distance of ~13 km southeast of the earthquake’s epicenter and a few meters north of the Ampelos surface ruptures described earlier (Figure 18).
Reappearance of springs was observed at the Kiourka site of the Marathokampos area and at a site over Pythagoras Cave in the eastern part of Mt. Kerketeas (Figure 18 and Figure 26). Both sites are located in the western part of the island. These water springs used to yield water after the first autumn rains. However, the springs remained dry during the autumn of 2020, but returned with increased water flow the same day of the earthquake. Based on eyewitness and footage documentation, the increased water discharge resulted in a temporary disruption of a local pedestrian crossing (Figure 26). Moreover, empty concrete water reservoirs in the Kiourka area were found to be full of water a few hours after the earthquake (Figure 26). A hydrological anomaly took place in the area of Kazania of Mytilinii. Water reappeared in springs and the discharge was increased for days after the mainshock.

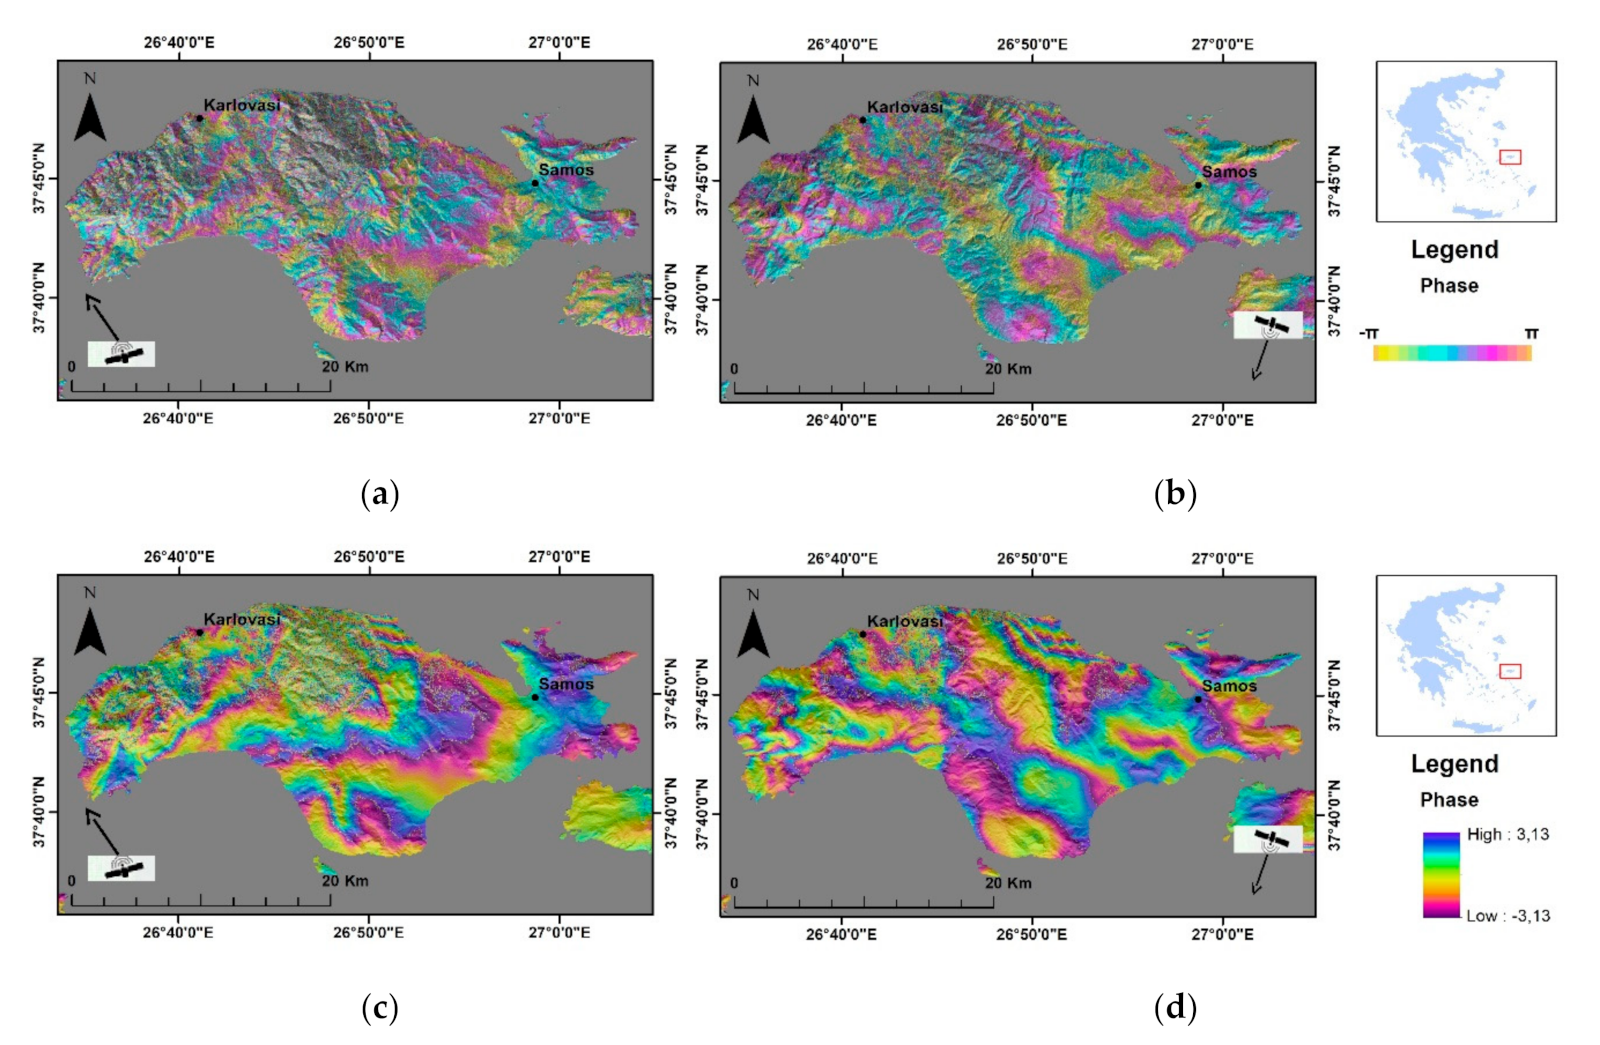
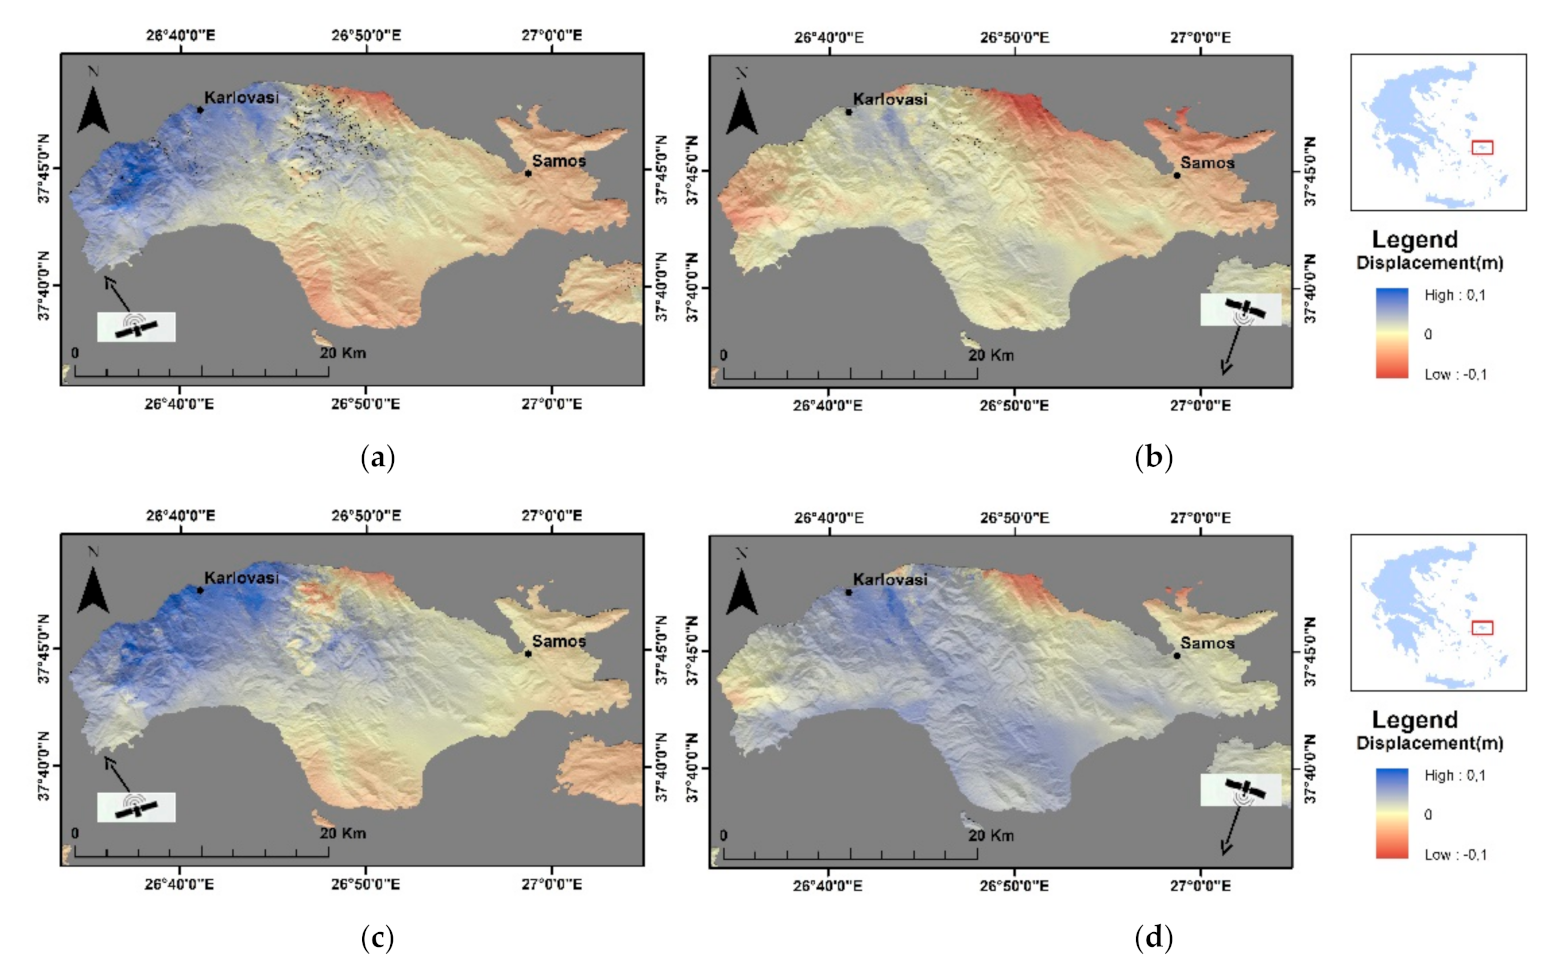
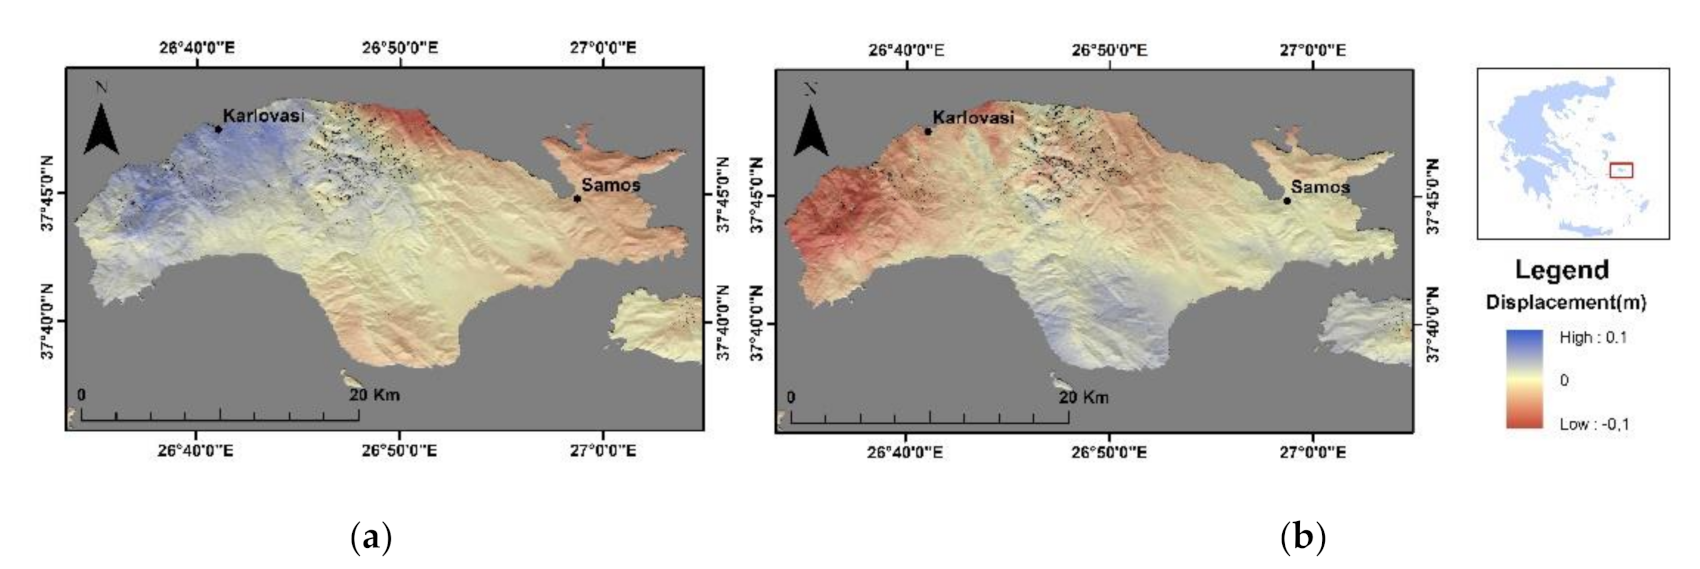
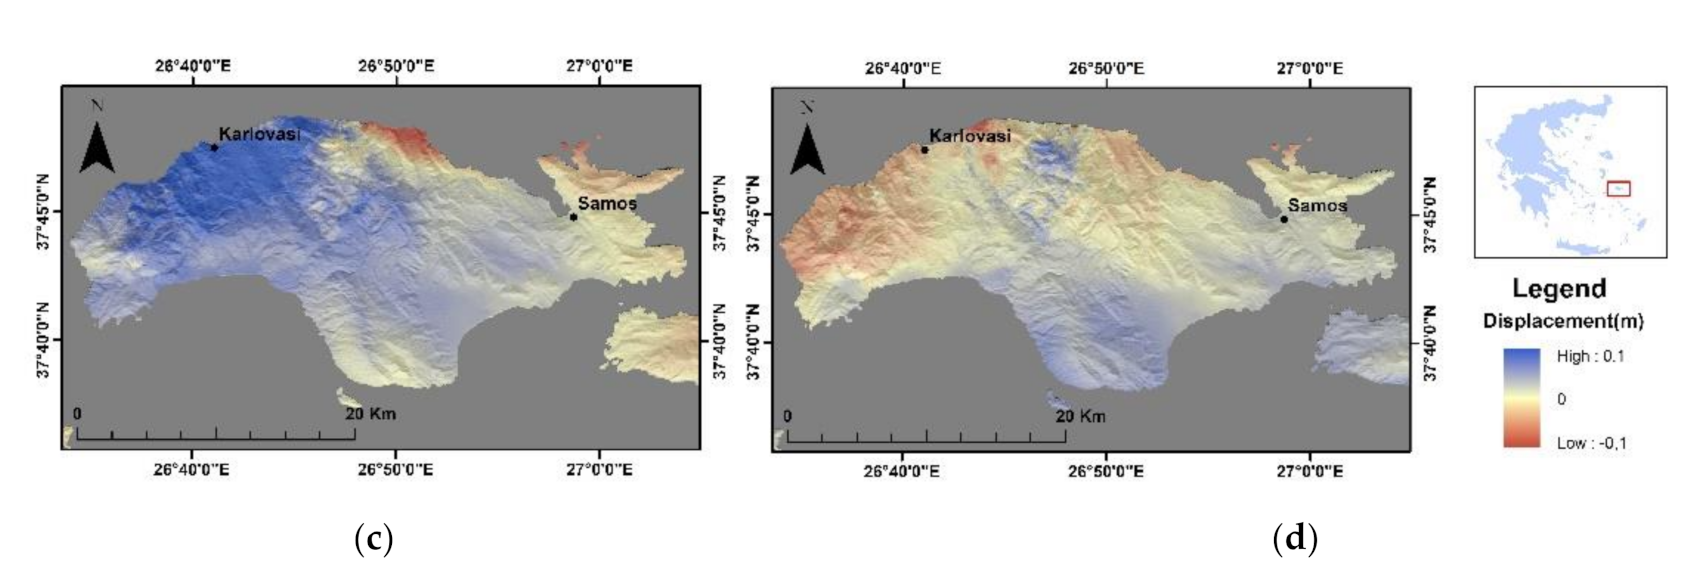
7. Results of the InSAR Processing

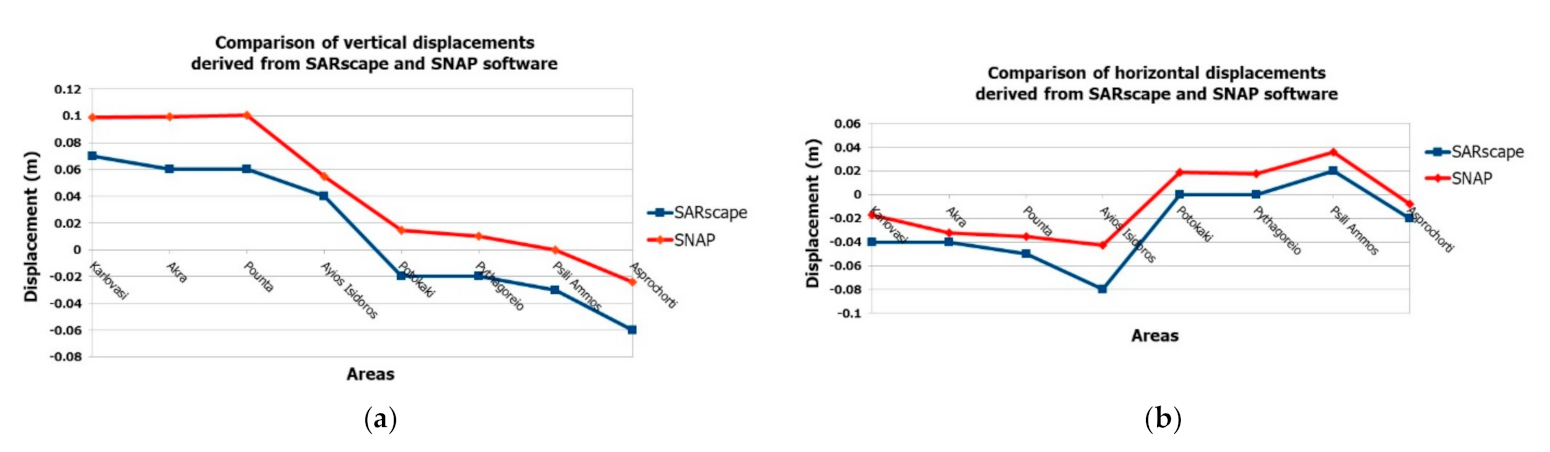
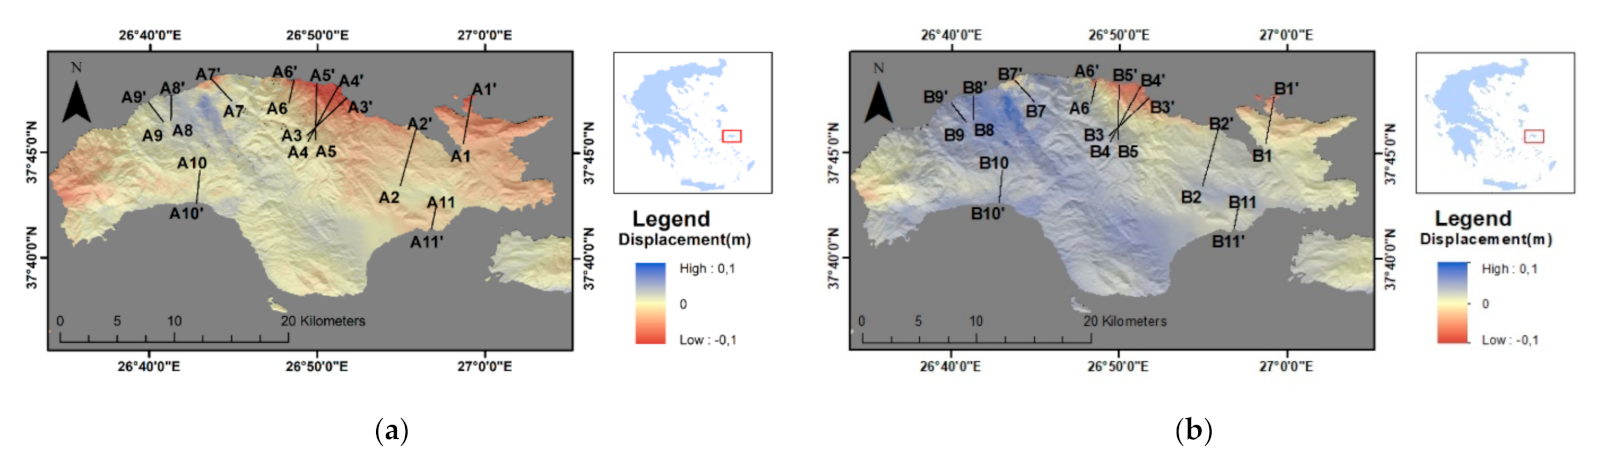
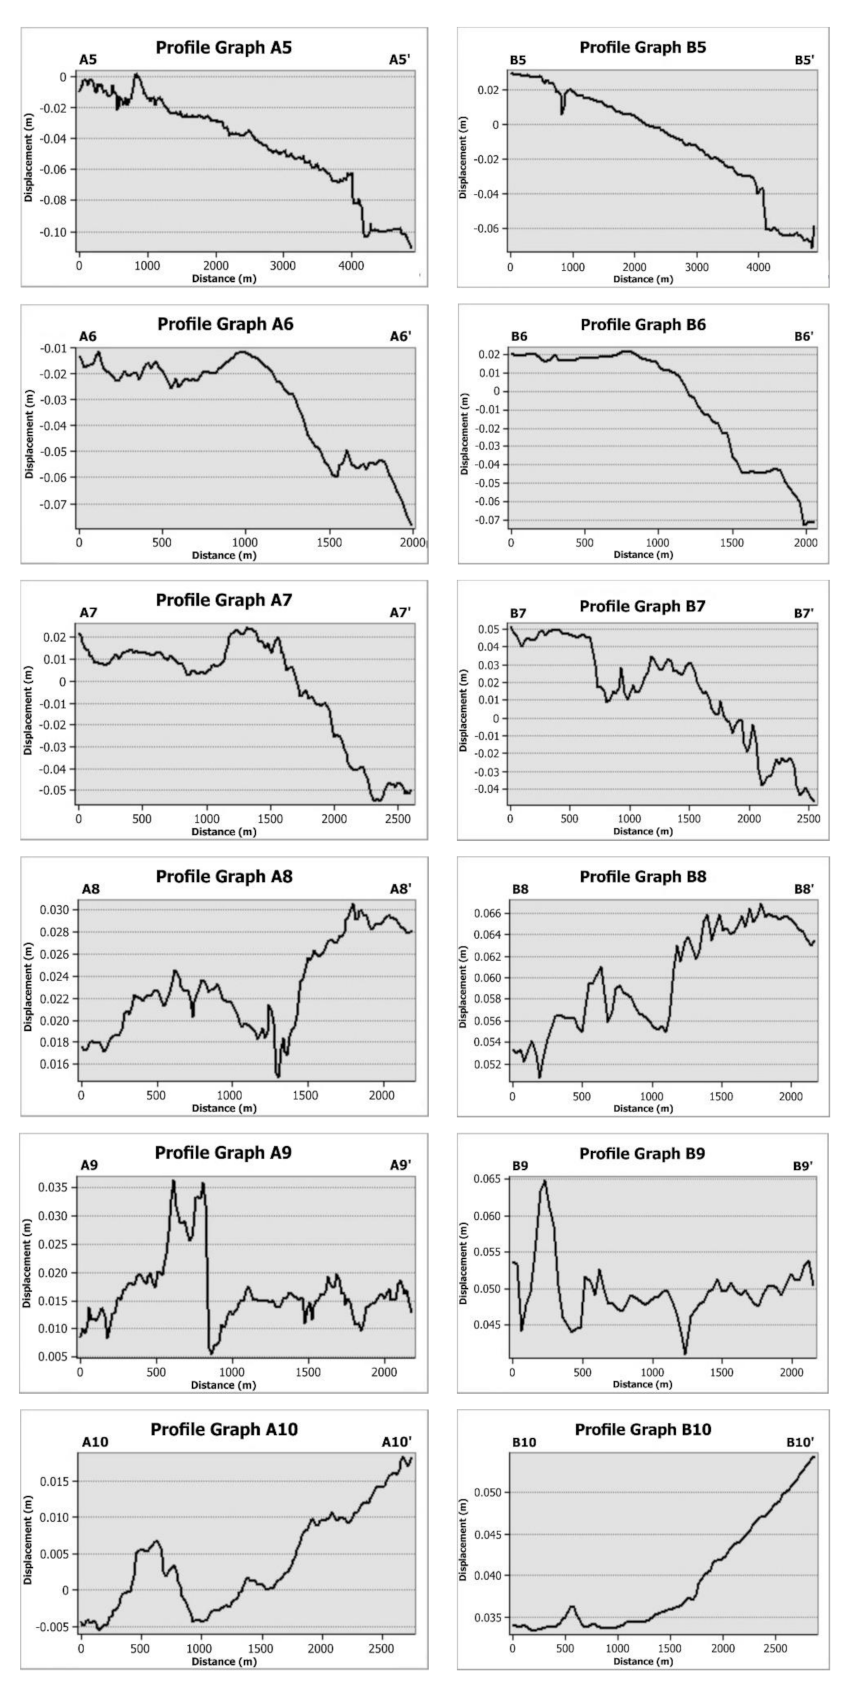
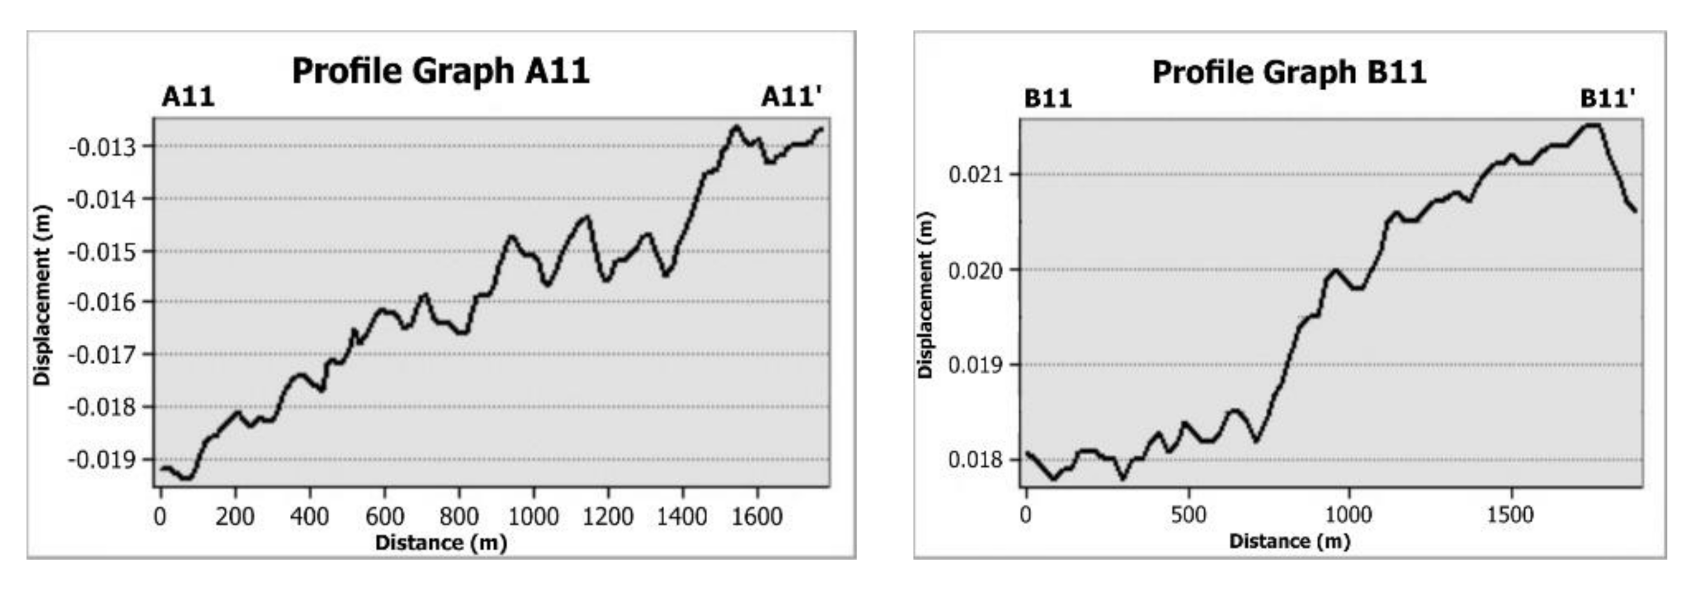
7.1. Vertical and Horizontal Displacements

The deformation field is clearly visualized in both interferograms created using SARscape and SNAP by a number of fringes with a negative phase in the northwestern part of the island and more specifically in the broad area of Karlovasi’s urban center, which means displacement towards the satellite, as well as a number of fringes with a positive phase, which means movement away from the satellite, along the northern coastal zone between the Ayios Konstantinos and Avlakia villages.
The displacement maps are similar qualitatively in terms of the direction of the displacement uplift in the central and the northwestern parts of the island and downlift along the coastal area (Figure 27). The displacement maps are very close quantitatively, showing an uplift of up to 13 cm along the line of sight (LOS) and a downlift of up to −12 cm in the LOS for the ascending data and 9 cm and -14 cm in the LOS, respectively, for the descending interferometric pair (Figure 27).
The up–down and east–west displacement decomposition results show that in the vertical displacement the positive values mean upward up to 13 cm and negative values downward up to −14 cm and, respectively, for the horizontal displacement map positive values mean eastward up to 8 cm and negative values westward up to −12 cm (Figure 28).
Comparing the vertical displacement obtained by the two different softwares, the results seem to agree in general, having a deviation of up to 2 cm. Horizontal deviations, however, are larger, especially in areas with high topography, which were not completely removed in the case of the SNAP software (Table 3 and Figure 29).

7.2. Comparison of the InSAR Results with the Field Observations

To compare the field observations and measurements with the results of the DInSAR analysis, d-displacement profile graphs were created based on sections constructed on the descending maps produced by the SARscape and SNAP softwares (Figure 30). More specifically, 11 sections (A1-A1′ to A11-A11′) and their profile graphs were derived from the descending map produced by the SARscape software and the same 11 sections (B1-B1′ to B11-B11′) and their profile graphs were derived from the descending map produced by the SNAP software (Figure 30 and Figure 31).
The sections and their respective profile graphs were created for various sites on the earthquake-affected Samos Island, where primary and secondary earthquake environmental effects were generated. They were created for areas with permanent coseismic uplift, coseismic subsidence, coseismic surface ruptures, and slope failures; more specifically, the sections A8-A8′ and B8-B8′ for the uplifted Karlovasi coastal area, the sections A9-A9′ and B9-B9′ for the uplifted Potami coastal area, the sections A10-A10′ and B10-B10′ for the uplifted Marathokampos area, the sections A11-A11′ and B11-B11′ for the uplifted Pythagoreio area, the sections A1-A1′ and B1-B1′ for the uplifted Asprochorti area, and the sections A2-A2′ and B2-B2′ for the Kokkari area (Figure 30). Moreover, the sections Α7-A7′ and B7-B7′ were created for the Ayios Nikolaos–Kontakaeika–Vrysses area, the sections Α6-Α6′ and Β6-Β6′ for the Ampelos area, and the sections Α5-Α5′ and Β5-Β5′ for the Ano Ayios Konstantinos area (Figure 30), all characterized by extended surface ruptures.
In addition to the above created for sites affected by primary effects, more sections and graphs were created for areas affected by secondary earthquake environmental effects; more specifically, the sections A9-A9′ and B9-B9′ for the Potami coastal area affected by slope failures associated with uplift and the sections Α3-Α3′, Α4-Α4′, Α5-Α5′, Β3-Β3′, Β3-Β3′, and Β3-Β3′ for the Avlakia coastal area also affected by slope failures associated with subsidence (Figure 30).
As regards the arrangement of these sections in the map, they were arranged transversely to the main faults, which cross the area, to the detected main surface ruptures and to the slope failure zones. This arrangement was preferred in order to detect changes in the surface displacement on either side of the faults and ruptures and to determine whether the triggered slope failures could be attributed either to the ground shaking or to gravitational movements in areas affected by permanent subsidence.
As regards the sections and the respective d-displacement profile graphs and the comparison of the displacement values from the DInSAR analysis with the corresponding field observations, large differences were observed. Typical examples of these large differences are the following (Figure 31 and Table 4):
(a)
The uplift detected in the field at the Asprochorti site in the northeastern part of Samos was 10 cm, while the InSAR analysis showed a small subsidence or relative stability (sections and profile graphs A1-A1′ and B1-B1′ in Figure 30 and Figure 31).
(b)
The uplift detected in the field at the Kokkari site in the northeastern part of Samos was 22 cm [15], while the InSAR analysis showed a subsidence of 2 cm from the SARscape software and an uplift of 1.4 cm from the SNAP software (sections and profile graphs A2-A2′ and B2-B2′ in Figure 30 and Figure 31).
(c)
The uplift detected in the field at the Karlovasi vessel shelter site was 24 cm, while the InSAR analysis showed a smaller uplift of 2.8 cm from the SARscape software and 6.3 cm from the SNAP software (sections and profile graphs A8-A8′ and B8-B8′ in Figure 30 and Figure 31).
(d)
The uplift detected at the Potami coastal area with the Akra and Pounta promontories was 20–22 cm, while the InSAR analysis showed a smaller uplift of 1.3 cm from the SARscape software and 5 cm from the SNAP software (sections and profile graphs A9-A9′ and B9-B9′ in Figure 30 and Figure 31).
(e)
The uplift detected at the Marathokambos coastal area was 10 cm, while the InSAR analysis showed a smaller uplift of 2 cm from the SARscape software and 5.5 cm from the SNAP software (sections and profile graphs A10-A10′ and B10-B10′ in Figure 30 and Figure 31).
Therefore, with the exception of the Asprochorti and Kokkari sites, where there is neither a qualitative nor a quantitative correlation between the field measurements and the InSAR results, in the other studied sites and areas the results from both methods are qualitatively identical, but quantitatively different.
As regards the studied areas affected by coeismic surface ruptures, a change in the surface deformation on both sides of the ruptures was observed. A typical example is the section and the corresponding graphs A7-A7′ and B7-B7′ (Figure 31) in the area of Ayios Konstantinos-Kontakaeika–Vrysses, where the southeastern fault block (the southeastern part of the section) is characterized by uplift and the northwestern fault block (northwestern part of the section) by subsidence. The type of the surface deformation detected by the InSAR analysis is qualitatively identical to the field observations since, as determined, the offset along the ruptures was normal with subsidence of the northwestern fault block and uplift of the southeastern one. Similar observations can be made and similar conclusions can be drawn for the sections and the respective graphs in the areas of Ano Ayios Konstantinos (A5-A5′ and B5-B5′) and Ampelos (A6-A6′ and B6-B6′) (Figure 31). A change in the type of surface deformation was observed on both sides of the surface ruptures. In both cases, the southern part was uplifted and the northern part had subsided.
As regards the sites where slope failures occurred, it was found from the displacement map and the respective sections and graphs that in the Avlakia area (A3-A3′ and B3-B3′) (Figure 31) the slope failures occurred in an area that suffered a subsidence of −9 cm (SARscape) and −5 cm (SNAP). Similarly, for the slope failures that occurred at the Tsambou Vourliotes beach (A4-A4′ and B4-B4′) (Figure 31), the area suffered the maximum detected subsidence on the affected island; more specifically, -12 cm from the SARscape software and -6 cm from the SNAP software.

8. Environmental Seismic Intensities

As mentioned above, the ESI-07 scale was also applied to sites affected by primary and secondary environmental effects triggered by the 30 October 2020, Mw = 7.0, Samos earthquake based on their qualitative and quantitative information and the guidelines of [22]. A table with all related information on the ESI-07 application is presented as Supplementary Material (Table S1). This table comprises several fields, including the affected fault block, the affected locality, the type of the triggered effect and its description, the source of the effect, the assigned ESI-07 intensity for its locality, and the epicentral distance. As regards the sources of the events, the majority of the primary and secondary effects were recorded from our post-event field surveys. Moreover, effects comprising uplift sites and sites affected by the subsequent tsunami were also used from the studies of [15,16], respectively.
Based on the spatial distribution of the assigned ESI-07 intensities on Samos Island (Figure 32), it was concluded that the maximum intensity is IXESI-07, assigned to sites affected by a coseismic uplift larger than 10 cm in northwestern, northern, northeastern, southeastern, southern, and southwestern Samos. VIII-IXESI-07 intensities were assigned to sites with smaller amounts of uplift induced by the January 2021 aftershock in southwestern Samos and to sites with surface ruptures in northern Samos. VIIIESI-07 intensities were assigned to sites affected by surface ruptures with a length of several hundred meters, by landslides with large volumes of mobilized materials, by extensive liquefaction phenomena, and by tsunami with large run-up and run-in distances and a large impact on objects. Sites affected by slope failures were characterized by intensities varying from IVESI-07 to VIIIESI-07. VIESI-07 and VIIIESI-07 were assigned to sites affected by liquefaction phenomena. VI-VIIESI-07 was assigned to sites with ground cracks. VIESI-07 and VIIESI-07 were assigned to springs suffered from hydrological anomalies. The tsunami-affected areas are characterized by intensities varying from VIESI-07 to VIIIESI-07.

9. Discussion

In addition to the permanent coseismic uplift and subsidence identified at the studied sites, the primary earthquake environmental effects also included coseismic surface ruptures located in the north-central part of Samos. The observed ruptures could be interpreted as evidence of coseismic surface faulting. Based on the provided focal mechanisms and the spatial distribution of the aftershock sequence [1] and on results from preliminary modeling of earthquake slip by inversion of GNSS and InSAR data [2], it was concluded that the causative fault is the E–W-striking and N-dipping normal fault offshore northern Samos. Based on its dimensions and the empirical equations of magnitude and rupture length from [48], it was concluded that this fault has the potential for the generation of an Mw = 7.0 earthquake.
Taking into account that the northern and northwestern parts of Samos Island have been uplifted and affected by coseismic surface ruptures and slope movements, it is suggested that this area constitutes an almost 30-km-long coseismic deformation zone extending from the Ayios Isidoros area to the west to the Kokkari area to the east. This coseismic deformation zone is characterized by permanent uplift and permanent subsidence. The permanent uplift can be attributed to the observed deformation of the western part of this zone and the shallow slope movements to the subsidence observed in its eastern part.
Moreover, the surface projection of the E–W-striking and N-dipping fault offshore northern Samos points to this coseismic deformation zone indicating a depth–surface connection. Taking also into account the spatial distribution of the aftershock sequence, it can be suggested that this zone played a significant role in stopping the rupture propagation.
From the aforementioned, it could be suggested that the 30 October 2020, Mw = 7.0, Samos earthquake ruptured multiple geometric or structural segments located not only offshore but also onshore northern Samos. The observed and presented primary and secondary earthquake environmental effects triggered in the northern part of Samos could be attributed to the failure of these segments.

10. Conclusions

The 2020 Samos earthquake caused primary and secondary environmental effects in various parts of the island. The primary environmental effects detected from our field survey in Samos included permanent coseismic surface deformation and coseismic surface ruptures. The permanent coseismic surface deformation included uplift at various sites of Samos. In particular, the field measurements of our survey showed uplift from +20 cm to +35 cm in northwestern Samos, +15 cm to +20 cm in northern Samos, +8 cm to +10 cm in northeastern Samos, +15 cm in southeastern Samos, and from +10 cm to +20 cm in southwestern Samos.
Taking into account the results of [15] on the relative sea level changes triggered by the 2020 Samos earthquake, similarities and differences are found. Moreover, new sites that suffered a coseismic uplift were detected onshore Samos during our post-event field surveys. Based on all available data, it is concluded that Samos Island, located in the footwall of the seismogenic offshore fault, suffered a general uplift, which has been imprinted at several sites.
The field survey for recording and mapping the primary seismic environmental effects did not reveal any subsidence in Samos. However, with the assistance of the InSAR analysis and the contribution of its results, areas that suffered subsidence were identified. A typical example is the wider area of Avlakia village, where the maximum subsidence was determined. The largest slope failure in Samos was generated in this subsided area, along with other smaller but remarkable failures.
From our field survey, uplift was detected in areas composed of Quaternary deposits, which are of low preservation potential for environmental effects. For example, the Karlovasi vessel shelter area in the northwestern part of Samos, the Pythagoreio, Potokaki, and Psili Ammos areas in the southeastern part of Samos, and the Marathokampos and Kampos in southwestern Samos, which were uplifted, comprise recent coastal deposits, which cannot preserve the evidence of the uplift for a long time. This low preservation potential is attributed to the low cohesiveness of the recent deposits and to their high susceptibility to exogenic erosion processes, including sea wave action and human intervention along the coast.
This fact reveals that the post-field surveys in earthquake-affected areas should be conducted shortly after the mainshock. Arriving as soon as possible at the affected area is very critical and important, because it contributes to the complete and accurate recording and mapping of the primary and secondary earthquake environmental effects, to the detection and identification of areas that have been significantly affected by accompanying geodynamic phenomena, and to the examination of their susceptibility and the generation of these phenomena. In conclusion, it contributes directly to a more complete interpretation of the phenomenon, but also indirectly to a better understanding and assessment of the seismic risk of an area.
From the InSAR section and the comparison of InSAR results with field observations in Table 4, it is concluded that the values of surface deformation that resulted from the field survey cannot be quantitatively correlated with the values obtained from the InSAR analysis. The field survey and InSAR results could be qualitatively correlated as regards the type of observed surface deformation (uplift and subsidence). At the vast majority of the studied sites, the type of surface deformation detected from both approaches is qualitatively identical, while they are also cases with no correlation at all.
As regards the secondary environmental effects triggered by the 2020 Samos earthquake, they comprised mainly slope failures and secondarily hydrological anomalies, liquefaction phenomena, and ground cracks. There was also a tsunami, which affected mainly the northern coast of Samos. However, tsunami observations were not included in this study since they have already been presented elsewhere [16].
The slope failures occurred mainly in the northern part of Samos and especially in the northwestern, north-central, and northeastern part of the island. Limited failures occurred in the southeastern and southern parts of the island. With the contribution of the InSAR methodology and its results, landslide occurrence sites were also identified on Kerketeas Mt, located in western Samos, in an area where access is difficult to impossible due to the absence of a mountainous road network. The InSAR methodology contributed to the more complete recording of the type and the spatial distribution of the environmental effects of the 2020 Samos earthquake.
Hydrological anomalies occurred in the north-central and southeastern parts of Samos and included a discharge increase in pre-existing springs or springs that had dried up. Liquefaction phenomena were limited to coastal areas of the northeastern part of Samos and especially to the coastal area of Vathy bay. Ground cracks appeared in coastal areas and they affected the surface of coastal roads. They were attributed either to liquefaction phenomena or to slope movements and sliding of the artificial road embankments towards the adjacent sea.
As regards the distribution of the effects on the fault blocks of Samos Island, it was found that effects were generated and distributed to all fault blocks (Figure 32). Particularly, coseismic uplift, slope failures, and hydrological anomalies were generated in the fault block of western Samos, coseismic uplift, surface ruptures, and slope failures in the Karlovasi basin, surface ruptures, slope failures, hydrological anomalies, and ground cracks in the fault block of central Samos, coseismic uplift and slope failures in the fault block of southern Samos, coseismic uplift and subsidence, slope failures, hydrological anomalies, liquefaction, and ground cracks in the Mytilinii Basin, and coseismic uplift and slope failures in the fault block of eastern Samos. The subsequent tsunami also affected the coastal areas of Samos [16], with its maximum intensity along the northern coasts.
Even in the parts of highest density and intensity of the secondary earthquake environmental effects, their distribution is not uniform. The effects are distributed in specific zones susceptible to the occurrence of such phenomena. Slope failures occurred along steep slopes with an incoherent lithology and steep slopes near faults and fault zones, which have created instability conditions favorable for the triggering of landslides and rockfalls in the case of strong earthquake ground motion. Liquefaction phenomena were triggered in coastal areas, which are formed by recent marine deposits of Holocene age susceptible to liquefaction. The ground cracks occurred in coastal areas with artificial embankments for the widening of coastal roads, which are susceptible to such failures, especially in the case of strong shaking.

Supplementary Materials

The following are available online at https://www.mdpi.com/article/10.3390/app11073281/s1, Table S1: ESI-07 intensities for the primary and secondary effects induced by the 30 October 2020, Mw = 7.0, Samos earthquake and recorded in post-event field surveys of this study (source a), by Evelpidou et al. (2021) (source b) and Triantafyllou et al. (2021) (source c).

Author Contributions

Conceptualization, S.M., E.L., and G.A.P.; methodology, S.M., E.L., G.A.P., K.-N.K., I.P., and A.K.; software, A.K., and I.P.; validation, S.M., A.K., and I.P.; investigation, S.M., I.T., A.K., M.G., K.-N.K., E.L., G.A.P., and I.P.; data curation, S.M., I.T., M.G., and K.-N.K.; writing—original draft preparation, S.M., G.A.P., A.K., and I.P.; writing—review and editing, S.M., I.T., G.A.P., A.K., and I.P.; visualization, S.M. and A.K.; supervision, S.M. All authors have read and agreed to the published version of the manuscript.

Funding

This research received no external funding.

Institutional Review Board Statement

Not applicable.

Informed Consent Statement

Not applicable.

Acknowledgments

This paper is a contribution to the Post-Graduate Program “Environmental, Disaster, and Crises Management Strategies”, Department of Dynamic, Tectonic and Applied Geology, Faculty of Geology and Geoenvironment, National and Kapodistrian University of Athens, Greece, which supported the post-event field surveys. The authors are thankful to all local people for their response to the questionnaire regarding the environmental effects. Dimitrios Galanakis and Geologist Kontantinos Kontodimos of the Hellenic Survey of Geology and Mineral Exploration are also acknowledged for discussions and exchanging opinions on the earthquake environmental effects during field surveys in the earthquake-affected Samos Island. Manolis Thravalos is also acknowledged for providing photographic documentation of the impact that the event had on the landscape of Samos Island (Asprochorti, Malagari, Petalides sites).

Conflicts of Interest

The authors declare no conflict of interest.

References

  1. Papadimitriou, P.; Kapetanidis, V.; Karakonstantis, A.; Spingos, I.; Kassaras, I.; Sakkas, V.; Kouskouna, V.; Karatzetzou, A.; Pavlou, K.; Kaviris, G.; et al. First results on the Mw = 6.9 Samos Earthquake of 30 October 2020. Bull. Geol. Soc. Gr. 2020, 56, 251–279. [Google Scholar] [CrossRef]
  2. Ganas, A.; Elias, P.; Briole, P.; Tsironi, V.; Valkaniotis, S.; Escartin, J.; Karasante, I.; Efstathiou, E. Fault responsible for Samos earthquake identified. Temblor 2020. [Google Scholar] [CrossRef]
  3. Nomikou, P.; Evangelidis, D.; Papanikolaou, D.; Lampridou, D.; Litsas, D.; Tsaparas, Y.; Koliopanos, I. Morphotectonic analysis along the northern margin of Samos Island, related to the seismic activity of October 2020, Aegean Sea, Greece. Geosciences 2021, 11, 102. [Google Scholar] [CrossRef]
  4. Theodoropoulos, D. Vathy sheet; scale 1:50000. In Geological Map of Greece; Institute of Geology and Mineral Exploration of Greece: Athens, Greece, 1979. [Google Scholar]
  5. Theodoropoulos, D. Neon Carlovassi sheet; scale 1:50000. In Geological Map of Greece; Institute of Geology and Mineral Exploration of Greece: Athens, Greece, 1979. [Google Scholar]
  6. Mascle, J.; Martin, L. Shallow structure and recent evolution of the Aegean Sea: A synthesis based on continuous reflection profiles. Mar. Geol. 1990, 94, 271–299. [Google Scholar] [CrossRef]
  7. Mountrakis, D.; Kilias, A.; Vavliakis, E.; Psilovikos, A.; Karakaisis, G.; Papazachos, C.; Thomaidou, E.; Seitanidis, G. “Samos” sheet; scale 1:75000. In Neotectonic Map of Greece; Earthquake Planning and Protection Organization: Athens, Greece, 2006; p. 78. [Google Scholar]
  8. Pavlides, S.; Tsapanos, T.; Zouros, N.; Sboras, S.; Koravos, G.; Chatzipetros, A. Using active fault data for assessing seismic hazard: A case study from NE Aegean Sea, Greece. In Proceedings of the Earthquake Geotechnical Engineering Satellite Conference, XVIIth International Conference on Soil Mechanics & Geotechnical Engineering, Alexandria, Egypt, 2–3 October 2009. [Google Scholar]
  9. Chatzipetros, A.; Kiratzi, S.; Sboras, N.; Zouros, S.; Pavlides, S. Active faulting in the north eastern Aegean Sea Islands. Tectonophysics 2013, 597–598, 106–122. [Google Scholar] [CrossRef]
  10. Sakellariou, D.; Tsampouraki-Kraounaki, K. Plio-quaternary extension and strike-slip tectonics in the Aegean. In Transform Plate Boundaries and Fracture Zones; Duarte, J.C., Ed.; Springer: Berlin/Heidelberg, Germany, 2019; pp. 339–374. [Google Scholar] [CrossRef]
  11. Theodoulidis, N.; Karakostas, C.; Lekidis, V.; Makra, K.; Margaris, B.; Morfidis, K.; Papaioannou, C.; Rovithis, E.; Salonikios, T. The Earthquake of 30 October 2020, M6.7 (11:51GMT) North of Samos Island (Greece): Observed Strong Ground Motion on Samos Island; Preliminary Report v3.0; Institute of Engineering Seismology and Earthquake Engineering: Thessaloniki, Greece, 2020; p. 9. [Google Scholar]
  12. Lekkas, E.; Mavroulis, S.; Gogou, Μ.; Papadopoulos, G.A.; Triantafyllou, I.; Katsetsiadou, K.-N.; Kranis, H.; Skourtsos, E.; Carydis, P.; Voulgaris, N.; et al. The 30 October 2020 Mw 6.9 Samos (Greece) earthquake. Newsl. Environ. Disaster Cris. Manag. Strateg. 2020, 21, 1–156. [Google Scholar] [CrossRef]
  13. Vadaloukas, G.; Vintzilaiou, E.; Ganas, A.; Giarlelis, C.; Ziotopoulou, K.; Theodoulidis, N.; Karasante, E.; Margaris, V.; Mylonakis, G.; Papachristidis, A. Samos Earthquake, 30 October 2020—Preliminary Report; Hellenic Association of Earthquake Engineering: Athens, Greece, 2020; 65p. [Google Scholar] [CrossRef]
  14. Cetin, K.O.; Mylonakis, G.; Sextos, A.; Stewart, J.P. Seismological and Engineering Effects of the M 7.0 Samos Island (Aegean Sea) Earthquake; Report GEER-069; Geotechnical Extreme Events Reconnaissance Association: Alameda County, CA, USA, 2021. [Google Scholar] [CrossRef]
  15. Evelpidou, N.; Karkani, A.; Kampolis, I. Relative sea level changes and morphotectonic implications triggered by the Samos earthquake of 30th October 2020. J. Mar. Sci. Eng. 2021, 9, 40. [Google Scholar] [CrossRef]
  16. Triantafyllou, I.; Gogou, M.; Mavroulis, S.; Lekkas, E.; Papadopoulos, G.A.; Thravalos, M. The tsunami caused by the 30 October 2020 Samos (Aegean Sea) Mw7.0 earthquake: Hydrodynamic features, source properties and impact assessment from post-event field survey and video records. J. Mar. Sci. Eng. 2021, 9, 68. [Google Scholar] [CrossRef]
  17. Caputo, R.; Chatzipetros, A.; Pavlides, S.; Sboras, S. The Greek database of seismogenic sources (GreDaSS): State-of-the-art for northern Greece. Ann. Geophys. 2012, 55, 5. [Google Scholar] [CrossRef]
  18. Berger, M.; Moreno, J.; Johannessen, J.; Levelt, P.; Hanssen, R. ESA’s sentinel missions in support of earth system science. Remote Sens. Environ. 2012, 120, 84–90. [Google Scholar] [CrossRef]
  19. Goldstein, R.M.; Werner, C.L. Radar interferogram filtering for geophysical applications. Geophys. Res. Lett. 1998, 25, 4035–4038. [Google Scholar] [CrossRef] [Green Version]
  20. Rosich, B.; Grimont, P.; Sabella, G.; Zito, F.; Izzo, G.; Miranda, N.; Potin, P.; Monjoux, E. Sentinel=1 Mission Operations Status; Fringe: Helsinki, Finland, 2017. [Google Scholar]
  21. Dalla Via, G.; Crosetto, M.; Crippa, B. Resolving vertical and east-west horizontal motion from differential interferometric synthetic aperture radar: The L’Aquila earthquake. J. Geophys. Res. Solid Earth 2012, 117, 8689. [Google Scholar] [CrossRef] [Green Version]
  22. Michetti, A.M.; Esposito, E.; Guerrieri, L.; Porfido, S.; Serva, L.; Tatevossian, R.; Vittori, E.; Audemard, F.; Azuma, T.; Clague, J.; et al. Environmental Seismic Intensity Scale 2007—ESI 2007. Mem. Descr. Carta Geol. Ital. 2007, 74, 7–54. [Google Scholar]
  23. Papanikolaou, D. Unités tectoniques et phases de deformation dans L’ile de Samos, Mer Egée. Bull. Soc. Geol. Fr. 1979, 7, 745–752. [Google Scholar] [CrossRef]
  24. Roche, V.; Jolivet, L.; Papanikolaou, D.; Bozkurtf, E.; Menant, A.; Rimmelé, G. Slab fragmentation beneath the Aegean/Anatolia transition zone: Insights from the tectonic and metamorphic evolution of the Eastern Aegean region. Tectonophysics 2019, 754, 101–129. [Google Scholar] [CrossRef]
  25. Ring, U.; Laws, S.; Bernet, M. Structural analysis of a complex nappe sequence and late-orogenic basins from the Aegean Island of Samos, Greece. J. Struct. Geol. 1999, 21, 1575–1601. [Google Scholar] [CrossRef]
  26. Ring, U.; Okrusch, M.; Will, T. Samos Island, Part I: Metamorphosed and non metamorphosed nappes, and sedimentary basins. J. Virtual Explor. 2007, 27, 5. [Google Scholar] [CrossRef]
  27. Mourtzas, N.; Stavropoulos, X. Recent tectonic evolution of the coast of the islands of Samos (E. Aegean). Bull. Geol. Soc. Gr. 1989, 23, 223–241. [Google Scholar]
  28. Stiros, S.C.; Laborel, J.; Laborel-Deguen, F.; Papageorgiou, S.; Evin, J.; Pirazzoli, P.A. Seismic coastal uplift in a region of subsidence: Holocene raised shorelines of Samos Island, Aegean Sea, Greece. Mar. Geol. 2000, 170, 41–58. [Google Scholar] [CrossRef]
  29. Evelpidou, N.; Pavlopoulos, K.; Vouvalidis, K.; Syrides, G.; Triantaphyllou, M.; Karkani, A.; Paraschou, T. Holocene palaeogeographical reconstruction and relative sea-level changes in the southeastern part of the island of Samos (Greece). Comptes Rendus Geosci. 2019, 351, 451–460. [Google Scholar] [CrossRef]
  30. Papazachos, B.C.; Papazachou, C.B. The Earthquakes of Greece; Ziti Publications: Athens, Greece, 2003. [Google Scholar]
  31. Ambraseys, N. Earthquakes in the Mediterranean and Middle East: A Multidisciplinary Study of Seismicity up to 1900; Cambridge University Press: Cambridge, UK, 2009. [Google Scholar]
  32. Makropoulos, K.; Kaviris, G.; Kouskouna, V. An updated and extended earthquake catalogue for Greece and adjacent areas since 1900. Nat. Hazards Earth Syst. Sci. 2012, 12, 1425–1430. [Google Scholar] [CrossRef] [Green Version]
  33. Stucchi, M.; Rovida, A.; Gomez Capera, A.A.; Alexandre, P.; Camelbeeck, T.; Demircioglu, M.B.; Gasperini, P.; Kouskouna, V.; Musson, R.M.W.; Radulian, M.; et al. The SHARE European Earthquake Catalogue (SHEEC) 1000–1899. J. Seismol. 2012, 17, 523–544. [Google Scholar] [CrossRef] [Green Version]
  34. Grünthal, G.; Wahlström, R.; Stromeyer, D. The SHARE European Earthquake Catalogue (SHEEC) for the time period 1900–2006 and its comparison to the European-Mediterranean Earthquake Catalogue (EMEC). J. Seismol. 2013, 17, 1339–1344. [Google Scholar] [CrossRef] [Green Version]
  35. Triantafyllou, I. Impact of Earthquakes in Greece from the Antiquity up to Now: Database Development and Space-Time Distribution with GIS Tools. Ph.D. Thesis, Department of Geology and Geoenvironment, Νational and Kapodistrian University of Athens, Athens, Greece, 2021. [Google Scholar]
  36. Papazachos, B.C.; Comninakis, P.E. Geophysical and tectonic features of the Aegean arc. J. Geophys. Res. 1971, 76, 8517–8533. [Google Scholar] [CrossRef]
  37. Papazachos, B.C.; Comninakis, P.E. The seismic activity in the area of Greece during the time period 1911–1971. Public Sci. Group Space Res. 1972, 4, 60. [Google Scholar]
  38. Karnik, V. Seismicity of the Europe and the Mediterranean; Academy of Sciences of the Czech Republic, Geophysics Institute: Praha, Czech Republic, 1996. [Google Scholar]
  39. Kalafat, D.; Güneş, Y.; Kara, M.; Deniz, P.; Kekovali, K.; Kuleli, H.S.; Gülen, L.; Yilmazer, M.; Özel, N.M. A Revised and Extended Earthquake Catalogue for Turkey since 1900 (M ≥ 4.0); Boğaziçi University, Kandilli Observatory and Earthquake Research Institute: Istanbul, Turkey, 2007. [Google Scholar]
  40. Papadopoulos, G.A.; Latoussakis, I.; Daskalaki, E.; Diakogianni, G.; Fokaefs, A.; Kolligri, M.; Liadopoulou, K.; Orfanogiannaki, K.; Pirentis, A. The East Aegean Sea strong earthquake sequence of October–November 2005: Lessons learned for earthquake prediction from foreshocks. Nat. Hazards Earth Syst. Sci. 2006, 6, 895–901. [Google Scholar] [CrossRef]
  41. Tan, O.; Papadimitriou, E.E.; Pabucçu, Z.; Karakostas, V.; Yörük, A.; Leptokaropoulos, K. 2014. A detailed analysis of microseismicity in Samos and Kusadasi (Eastern Aegean Sea) areas. Acta Geophys. 2014, 62, 1283–1309. [Google Scholar] [CrossRef]
  42. Papadimitriou, P.; Kassaras, I.; Kaviris, G.; Tselentis, G.-A.; Voulgaris, N.; Lekkas, E.; Chouliaras, G.; Evangelidis, C.; Pavlou, K.; Kapetanidis, V.; et al. The 12th June 2017 Mw = 6.3 Lesvos earthquake from detailed seismological observations. J. Geodyn. 2018, 115, 23–42. [Google Scholar] [CrossRef]
  43. Mavroulis, S.; Andreadakis, E.; Spyrou, N.-I.; Antoniou, V.; Skourtsos, E.; Papadimitriou, P.; Kassaras, I.; Kaviris, G.; Tselentis, G.-A.; Voulgaris, N.; et al. UAV and GIS based rapid earthquake-induced building damage assessment and methodology for EMS-98 isoseismal map drawing: The 12 June 2017 Mw 6.3 Lesvos (Northeastern Aegean, Greece) earthquake. Int. J. Disaster Risk Reduct. 2019, 37, 101169. [Google Scholar] [CrossRef]
  44. Papadopoulos, G.; Agalos, A.; Charalampakis, M.; Kontoes, C.; Papoutsis, I.; Atzori, S.; Svigkas, N.; Triantafyllou, I. Fault models for the Bodrum-Kos tsunamigenic earthquake (Mw6.6) of 20 July 2017 in the east Aegean Sea. J. Geodyn. 2019, 131, 1646. [Google Scholar] [CrossRef]
  45. Triantafyllou, I.; Papadopoulos, G.A.; Lekkas, E. Impact on built and natural environment of the strong earthquakes of 23 April 1933, and 20 July 2017, in the southeast Aegean Sea, eastern Mediterranean. Nat. Hazards 2020, 100, 671–695. [Google Scholar] [CrossRef]
  46. Porfido, S.; Esposito, E.; Guerrieri, L.; Vittori, E.; Tranfaglia, G.; Pece, R. Seismically induced ground effects of the 1805, 1930 and 1980 earthquakes in the Southern Apennines, Italy. Boll. Soc. Geol. Ital. 2007, 126, 333–346. [Google Scholar]
  47. Audemard, M. Geological criteria for evaluating seismicity revisited: Forty years of paleoseismic investigations and the natural record of past earthquakes. In Geological Criteria for Evaluating Seismicity Revisited: Forty Years of Paleoseismic Investigations and the Natural Record of Past Earthquakes; Audemard, F.A., Michetti, A.M., McCalpin, J.P., Eds.; Geological Society of America Special Paper: McLean, VA, USA, 2011; Volume 479, pp. 1–21. [Google Scholar]
  48. Wells, D.L.; Coppersmith, K.J. New empirical relationships among magnitude, rupture length, rupture width, rupture area, and surface displacement. Bull. Seismol. Soc. Am. 1994, 84, 974–1002. [Google Scholar]
Figure 1. Map illustrating the epicenter and the focal mechanism of the 2020, Mw = 7.0, Samos (eastern Aegean Sea) earthquake from [1] along with its aftershock sequence from 30 October to 5 March 2020 from the Earthquake Catalogue of the Seismological Laboratory of the Department of Geophysics–Geothermics, Faculty of Geology and Geoenvironment, National and Kapodistrian University of Athens (http://www.geophysics.geol.uoa.gr/stations/gmapv3_db/index.php?lang=en (accessed on 31 January 2021)). The largest aftershock of 30 October 2020 and the aftershock of 20 January 2021 are also noted. Active faults onshore and offshore Samos are also presented based on [3,9,10,17]. NIB: North Ikaria Basin; ΚΒ: Kuşadası Bay; GR: Greece; TR: Turkey.
Applsci 11 03281 g001
Figure 2. Age (a) and educational level (b) distributions of the responders to our questionnaire regarding the environmental effects induced by the 30 October 2020, Mw = 7.0, earthquake on Samos Island.
Applsci 11 03281 g002
Figure 3. Flow chart for the SARscape (left) and SNAP (right) main steps of processing.
Applsci 11 03281 g003
Figure 4. The two wrapped interferograms that resulted from SARscape ((a): ascending geometry, (b): descending geometry) and SNAP ((c): ascending geometry, (d): descending geometry) software. They are of good quality and contain the phase difference between the master and slave images due to the 30 October 2020, Mw = 7.0, Samos earthquake.
Applsci 11 03281 g004
Figure 5. Neotectonic map illustrating the geological formations, the active faults onshore and offshore Samos, the major inactive faults, the main fault blocks of Samos Island based on onshore and offshore studies, the 2020 Samos earthquake epicenter, and its largest aftershocks. Data from onshore studies on the active tectonics of Samos [4,5,7,8,9,15,17,23,24,27] and offshore studies based on continuous seismic reflection profiles [6]. ONSF: Offshore Northern Samos Fault; KF: Karlovasi fault; MF: Marathokampos Fault; PF: Pythagoreio fault; VF: Vathy Fault; PT: Pythagoras Thrust; VT: Vourliotes Thrust; KD: Kallithea Detachment; WSFB: Western Samos Fault Block; KB: Karlovasi Basin; CSFB: Central Samos Fault Block; PYB: Pyrgos Basin; SSFB: Southern Samos Fault Block; MB: Mytilinii Basin; PAB: Paleokastro Basin, ESFB: Eastern Samos Fault Block.
Applsci 11 03281 g005
Figure 6. The red circles correspond to the earthquakes of Table 2. The main active faults of the eastern Aegean are also presented with red lines based on [9] and [10] along with the epicenter of the 30 October 2020, Mw = 7.0, Samos earthquake (white star) from [1].
Applsci 11 03281 g006
Figure 7. Neotectonic map illustrating the sites of the detected primary environmental effects in Samos island triggered by the 30 October 2020, Mw = 7.0, earthquake. Details for the geological formations and faults in Figure 2.
Applsci 11 03281 g007
Figure 8. Permanent coseismic uplift was observed in the Karlovasi area (a). More specifically, in the Karlovasi vessel shelter located east of the Karlovasi port (a,b). The uplift reached 24 cm and was detected not only on the concrete works of the vessel shelter (c), but also on the protection boulders (d).
Applsci 11 03281 g008
Figure 9. (a) Permanent coseismic uplift in the area west of the Karlovasi vessel shelter, at the Akra and Pounta promontories. The uplift was imprinted on the coastal marbles of the Kerketeas unit at the Akra promontory (be) and at the Punta promontory (f,g). These locations have high potential for preservation of primary earthquake environmental effects due to their resistant lithology. Notches attributed to previous earthquakes are also observed at these sites (dg).
Applsci 11 03281 g009
Figure 10. The uplift at Ayios Nikolaos was imprinted on the rocky coast. The white stripe on the rocks pointed at with the white arrows corresponds to the uplift of the 30 October 2020 mainshock and the red stripe pointed to by red arrows to the aftershock on 20 January 2021.
Applsci 11 03281 g010
Figure 11. (a) The marina of Marathokampos, which was uplifted not only by the mainshock on 30 October 2020, but also by an aftershock on January 20, 2021. (b) The uplift from the mainshock and the aftershock was also imprinted on a small jetty of the Kampos village, located west of Marathokampos village. The white arrow points to the uplift induced by the mainshock and the red ones to the uplift by the aftershock.
Applsci 11 03281 g011
Figure 12. (a) Uplift of ~20 cm was detected on a dock in the Pythagoreio area. (b) Uplift from 15 to 20 cm was also imprinted on nearshore rocks close to the dock in Pythagoreio. The amount of uplift attributed to the 2020 Samos earthquake was observed below the white stripe and is pointed to with red arrows. (c,d) Uplift detected on a concrete dock in the Psili Ammos area.
Applsci 11 03281 g012aApplsci 11 03281 g012b
Figure 13. Uplift sites in the Potokaki area. (a) First uplift site in front of the Penelope hotel. A permanent sea retreat of ~2.5–3 m was observed after the mainshock. The old position of the seashore is marked by a ridge of gravels and pebbles. (b) The second uplift site in the Potokaki area is situated at distance of ~300 m to the east of the hotel site. This picture was taken on 24 January 2021 and shows both the permanent uplifts caused by the mainshock and the aftershock of 20 January 2021 on a series of cubic concrete blocks. (c) Permanent uplift ranging from ~17 cm to ~20 cm due to the mainshock was measured on the landward side of the concrete blocks on 31 October 2020. (d,e) The third uplift site in the Potokaki area. Before the earthquake, the wooden jet ski trailer was partially placed in the water. It was uplifted and partly broken at the interconnection place due to the earthquake and the abrupt coseismic ground uplift.
Applsci 11 03281 g013
Figure 14. Permanent coseismic uplift of ~10 cm was also detected at Asprochorti, located in the northeastern part of Samos. (a) The light blue arrows point to emergent rocks. (a,b) The red arrows point to the uplifted part of the rocky coast with the emergent intertidal biota.
Applsci 11 03281 g014
Figure 15. Coseismic surface ruptures in the Ayios Nikolaos area. Their strike varied from N 40° E to N 70° E. They presented a vertical offset varying from 5 to 8 cm. They were observed not only on the asphalt road (a,e), but also on adjacent slopes (bd). The white arrows indicate the continuation of the ruptures on the adjacent slopes, where the vertical offset was detected. The red symbol (−) corresponds to the subsided blocks, while the blue symbol (+) corresponds to the uplifted blocks.
Applsci 11 03281 g015
Figure 16. Coseismic surface ruptures in the area between the Vrysses village in the west and the Kontakaeika village in the east. They were continuous affecting a perimeter wall, a concrete road (a) and its adjacent slope (b,c). The red symbol (−) corresponds to the subsided block, while the green symbol (+) corresponds to the uplifted block.
Applsci 11 03281 g016
Figure 17. (a-d) NE–SW-striking coseismic surface ruptures observed in olive fields in the area south of the Vrysses village. Their vertical offset varied from 5 to 10 cm (a,b) and their width from 5 to 15 cm (c,d). The red symbol (−) corresponds to the subsided block, while the blue symbol (+) corresponds to the uplifted block.
Applsci 11 03281 g017aApplsci 11 03281 g017b
Figure 18. Neotectonic map illustrating the sites of the detected secondary environmental effects on Samos island triggered by the 30 October 2020, Mw = 7.0, earthquake. The sites affected by the tsunami are from [16]. Details for the geological formations and faults in the legend of Figure 5.
Applsci 11 03281 g018
Figure 19. Earthquake-induced slope failures and affected sites in the Potami coastal area (a). The area is affected by the active Karlovasi–Kallithea fault, which formed morphological discontinuities (a) corresponding to coastal fault scarps on marbles of the Kerketeas unit (b,c). (d) Unstable marble blocks were detached from the upper parts of the slopes and rolled down to the lower parts of the slope but without affecting the nearby coastal road. Red arrows point to the freshly detached surfaces (d,e) and the yellow arrow to the fallen fragments (e).
Applsci 11 03281 g019aApplsci 11 03281 g019b
Figure 20. Slope failures triggered by the 30 October 2020, Mw = 7.0, Samos earthquake at several sites of the eastern part of the island. (af) Rockfalls and landslides in the northeastern part of Samos: (a) Kedros, (b) Kokkari, (c) Lemonakia, and (df) Avlakia. The largest effects were generated at the Avlakia site, resulting in a temporary traffic disruption. Due to reactivation during the aftershock sequence, a barrier made of large concrete blocks was created along the base of the affected slope in order to protect the road and passengers from further slope failures and surface deformation.
Applsci 11 03281 g020
Figure 21. (a) The coastal Kokkari town along with its coastal landforms (peninsula and islet) affected by secondary environmental effects induced by the 30 October 2020, Mw = 7.0, Samos earthquake. Rockfalls were triggered along the slopes of the Kokkari islet (b), along slopes of the port (c), and along the peninsula (df). The rockfalls observed on the Kokkari peninsula caused light non-structural damage to the adjacent reinforced concrete building and partial destruction of a wall along the base of the slope (df).
Applsci 11 03281 g021
Figure 22. (a) Rockfall sites in southeastern Samos: (b) Remataki area and (c) Marina of Samos.
Applsci 11 03281 g022
Figure 23. Rockfalls at (a) the Platanos area, (b) the Koumaeika area, and (c) Tsopela Cape. All sites are located in southern Samos.
Applsci 11 03281 g023aApplsci 11 03281 g023b
Figure 24. Liquefaction in the Malagari coastal area. This area is mainly composed of sands. The induced phenomena comprised ground cracks and ejection of a liquefied mixture of water and sand along cracks. Lateral spreading was also observed along the coast, resulting in subsidence of the coast. The root system of the trees on the right side of the road before the earthquake were found almost at sea level after the earthquake.
Applsci 11 03281 g024
Figure 25. Ground cracks in the (a) Malagari and (b) Petalides coastal areas. They were observed on artificial deposits used during works for the widening of the coastal roads. Red arrows indicate the direction of slide towards the sea located in the left part of the images.
Applsci 11 03281 g025
Figure 26. Hydrological anomalies at the western part of Kerketeas Mt (Kiourka area). They resulted in a temporary disruption of a pedestrian crossing and filling of empty tanks with water a few hours after the earthquake.
Applsci 11 03281 g026
Figure 27. The line of sight (LOS) displacement maps in meters in ascending and descending geometry resulting from the SARscape (a,b) and SNAP (c,d) softwares.
Applsci 11 03281 g027
Figure 28. The vertical (a,c) and east–west (2D) (b,d) displacement maps were created by using the displacement decomposition tool in the SARscape software (a,b) and by further calculations performed through mathematical operations between the two layers in the LOS in the SNAP software (c,d).
Applsci 11 03281 g028aApplsci 11 03281 g028b
Figure 29. Comparative graphs of the (a) vertical and (b) horizontal displacements derived from the SARscape and SNAP softwares for selected sites on the earthquake-affected Samos Island.
Applsci 11 03281 g029
Figure 30. Displacement maps (descending) of Samos Island by using the SARscape (a) and SNAP (b) softwares. The presented sections were constructed at sites affected by environmental effects induced by the 2020 Samos earthquake. More specifically, the Α1-Α1′, Β1-Β1′, Α2-Α2′, Β2-Β2′, Α5-Α5′, Β5-Β5′, Α6-Α6′, Β6-Β6′, Α7-Α7′, Β7-Β7′, Α9-Α9′, Β9-Β9′, Α10-Α10′, Β10-Β10′, Α11-Α11′, and Β11-Β11′ sections refer to sites affected by primary effects, comprising coseismic uplifts and surface ruptures, while the others refer to sites affected by secondary effects, including slope failures.
Applsci 11 03281 g030
Figure 31. Surface displacement profile graphs resulting from the sections in the displacement map (descending) of Figure 30. Profile graphs (A1A11) resulted from the SARscape software and the profile graphs (B1B11) from the SNAP software.
Applsci 11 03281 g031aApplsci 11 03281 g031bApplsci 11 03281 g031c
Figure 32. Map of Environmental Seismic Intensity (ESI-07) scale intensities for sites affected by primary and secondary earthquake environmental effects triggered by the 30 October 2020, Mw = 7.0, Samos earthquake. * Tsunami sites from [16] and ** uplift sites with the dark blue symbol from [15].
Applsci 11 03281 g032
Table 1. Information on the Sentinel-1 SAR SCL images used.
Number of PairSatelliteSub Swath NumberSensing DayPass Direction
1st (master)Sentinel-1AIW106 October 2020Ascending
1st (slave)Sentinel-1AIW130 October 2020Ascending
2nd (master)Sentinel-1AIW224 October 2020Descending
2nd (slave)Sentinel-1AIW205 November 2020Descending
Table 2. Focal parameters of the known strong earthquakes of moment magnitude Mw ≥ 6.0 that occurred in the area of Samos before the 2020 earthquake based on [30].
YearMonthDayLong. N°Lat. E°Io (MM)Μw
−200 37.726.9VIII6.3
47 38.127.5VIII7.0
175161837.727.1VIII6.4
18314337.726.8VII6.0
184662537.626.976VII6.0
1865101137.627.0VII6.0
18685337.626.9VII6.0
187313137.727.1VII6.5
1877101437.727.0VIII6.0
189331238.027.2VII6.6
190481137.6626.93VIII6.8
195571637.5527.15VIII6.9
Table 3. Comparison of vertical and horizontal displacements derived from the SARscape and SNAP softwares at selected sites affected by permanent coseismic surface deformation from the 30 October 2020, Mw = 7.0, Samos earthquake.
AreaXYVertical SARscape (in m)Vertical SNAP (in m)Horizontal SARscape (in m)Horizontal SNAP (in m)
Karlovasi26.6937.790.070.10−0.04−0.02
Potami26.6737.790.060.10−0.04−0.03
Pounta26.6637.790.060.10−0.05−0.04
Ayios Isidoros26.5937.750.040.05−0.08−0.04
Potokaki26.9237.69−0.020.010.000.02
Pythagoreio26.9437.69−0.020.010.000.02
Psili Ammos27.0237.71−0.030.000.020.04
Asprochorti26.9837.78−0.06−0.02−0.02−0.01
Table 4. Uplift from field surveys and the interferometric synthetic aperture radar (InSAR) analysis.
Sites of Permanent Coseismic Surface DeformationSurface Deformation Measurements
Field SurveysInSAR Analysis
(Amount of Uplift Based on Sections A1–A11 and B1–B11)
Evelpidou et al. (2021)This StudySARscapeSNAP
Sykia (S Samos)+23 cm-stability
Klima (SE Samos)stability-stability
Posidonio (E Samos)+13 cm-stability
Mourtia (NE Samos)+8 cm-stability
Kokkari (NE Samos)+22 cm-−2.0 cm−1.4 cm
Ayios Nikolaos chapel, Potami beach(NW Samos)+20 cm+20 cmuplift
Punta Promontory (NW Samos)+22 cm+22 cmuplift
Megalo Seitani (W Samos)+22 cm-uplift
Ayios Isidoros (W Samos)+35 cm+30 cmuplift
Ayios Nikolaos (N Samos)-+15–20 cmuplift
Pythagoreio (SE Samos)+15 cm+15–20 cm−1.3 cm+2.5 cm
Psili Ammos (SE Samos)+13 cm+15 cmstability, small uplift
Potokaki (SE Samos)-+17–25 cmstability, small uplift
Karlovasi vessel shelter (NW Samos)-+24 cm+2.8 cm+6.3 cm
Marathokampos (Molos) (SW Samos)-+15–20 cm+2.0 cm+5.5 cm
Kampos (SW Samos)-+15–20 cmuplift
Asprochorti (NE Samos)-+10 cm−6.0 cm−1.0 cm
Publisher’s Note: MDPI stays neutral with regard to jurisdictional claims in published maps and institutional affiliations.

