Deep Malaria Parasite Detection in Thin Blood Smear Microscopic Images


 , and
, and
Abstract
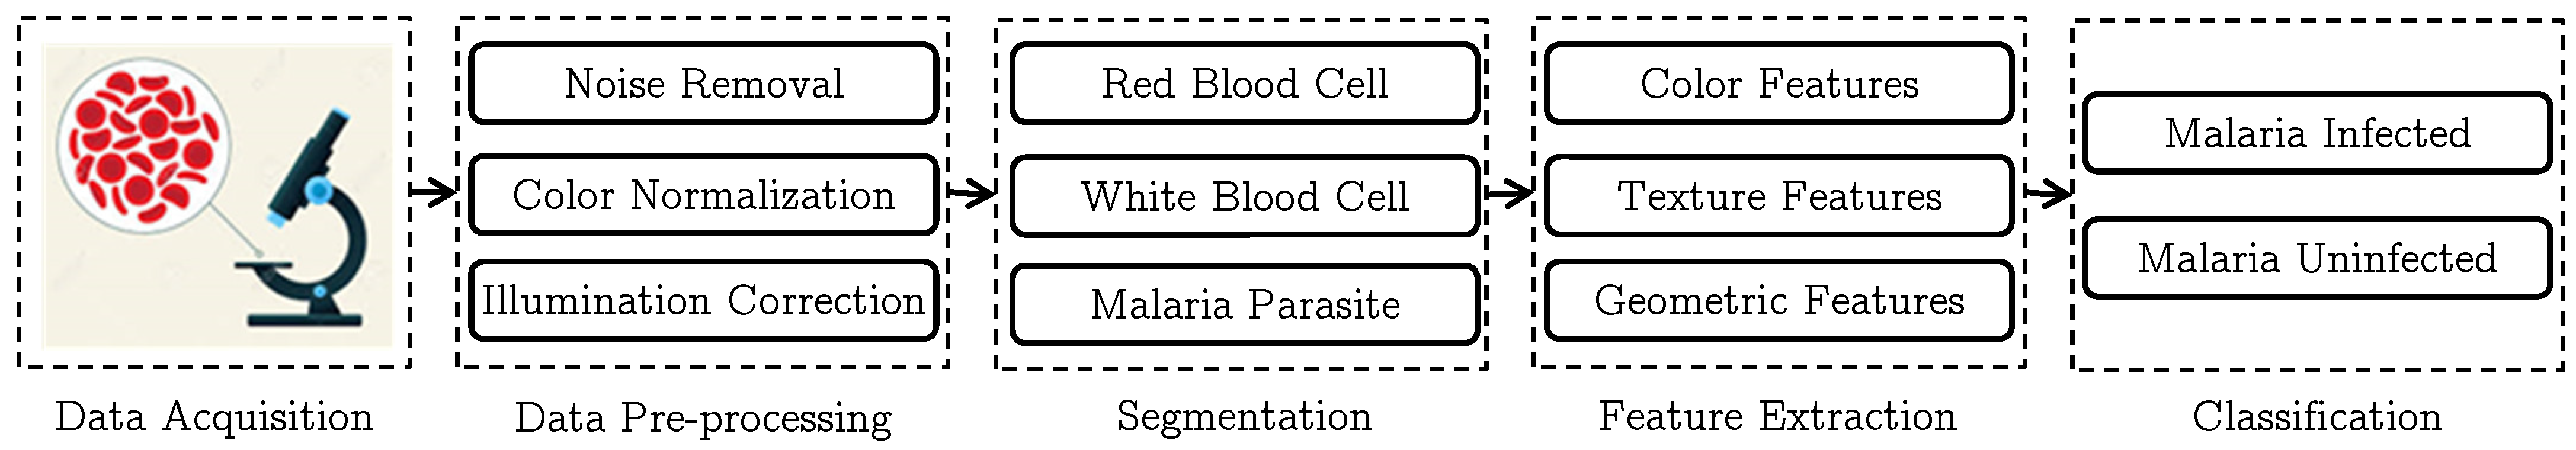
:1. Introduction
2. Related Work
3. Compared Deep Learning Models
3.1. VGG
3.2. ResNet
3.3. DenseNet
3.4. Inception
3.5. Xception
3.6. SqueezeNet
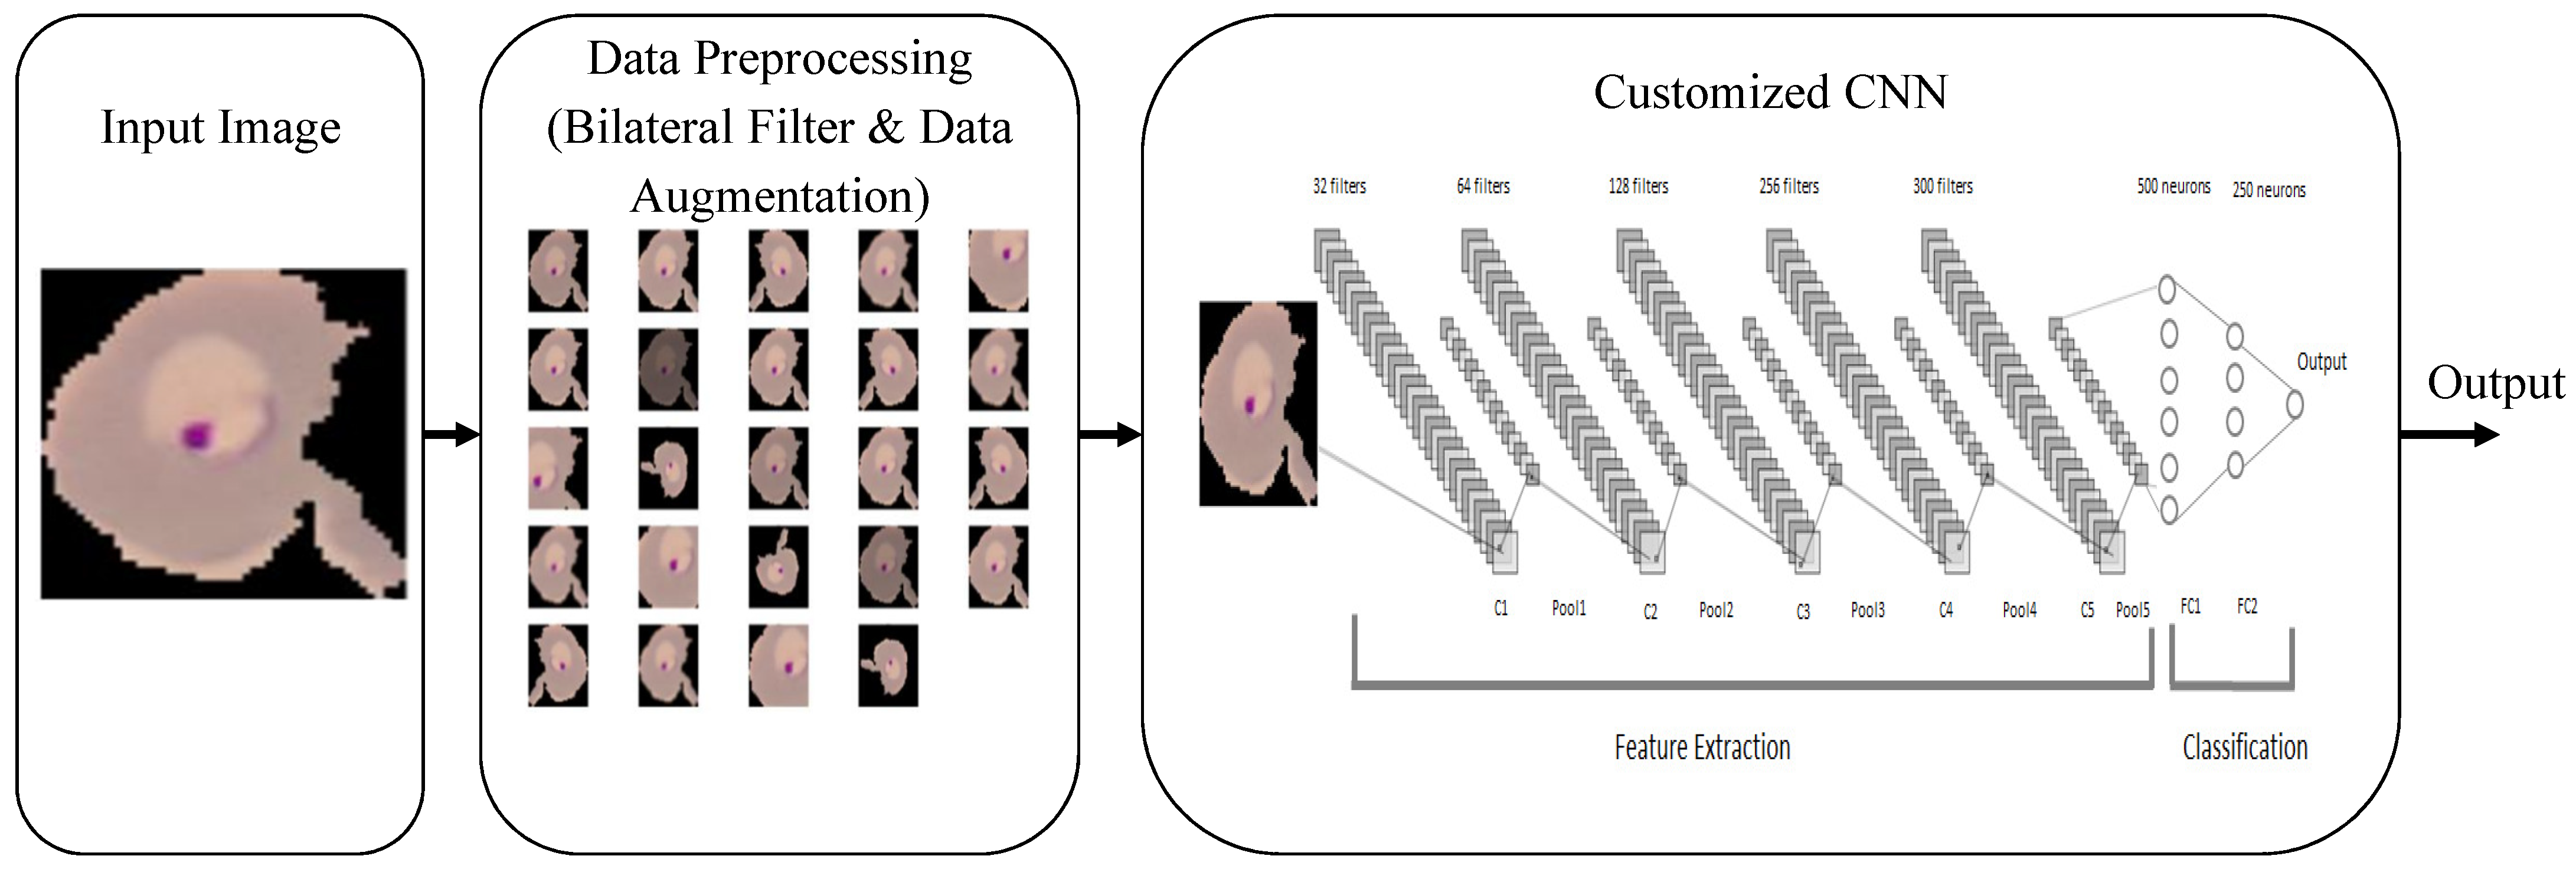
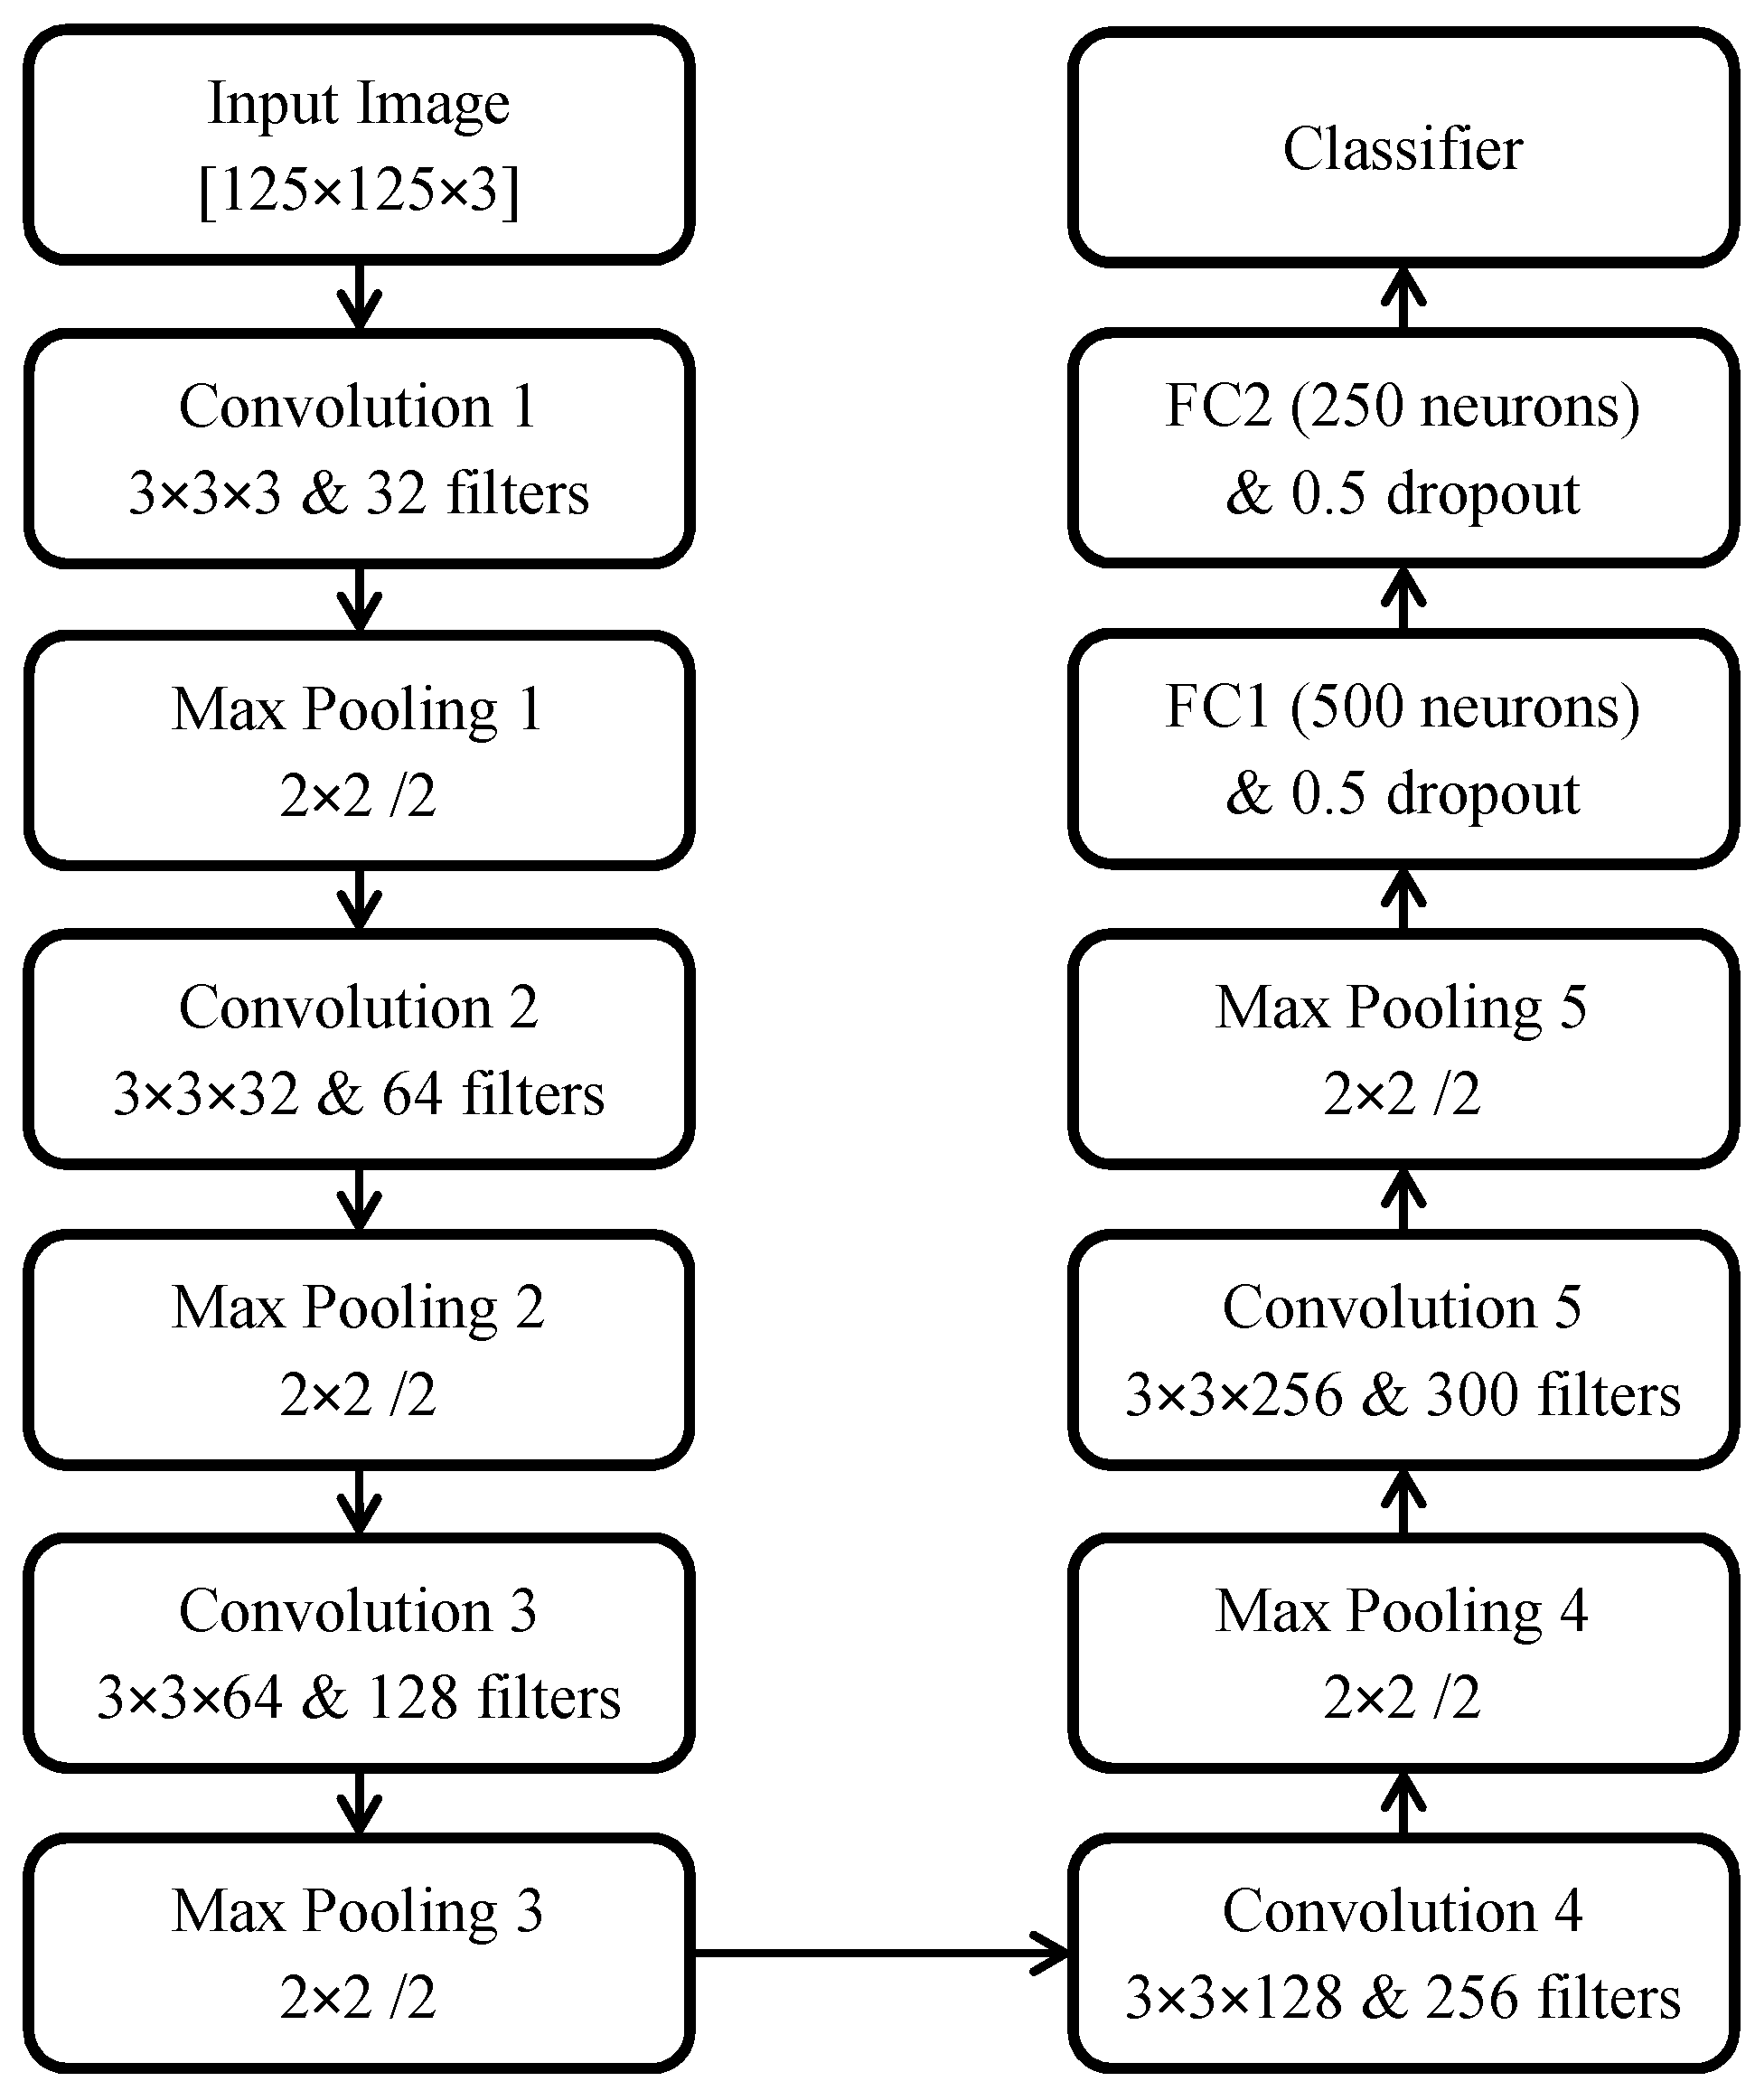
4. Proposed Deep Learning Model for Malaria Detection
5. Experimental Evaluations and Results
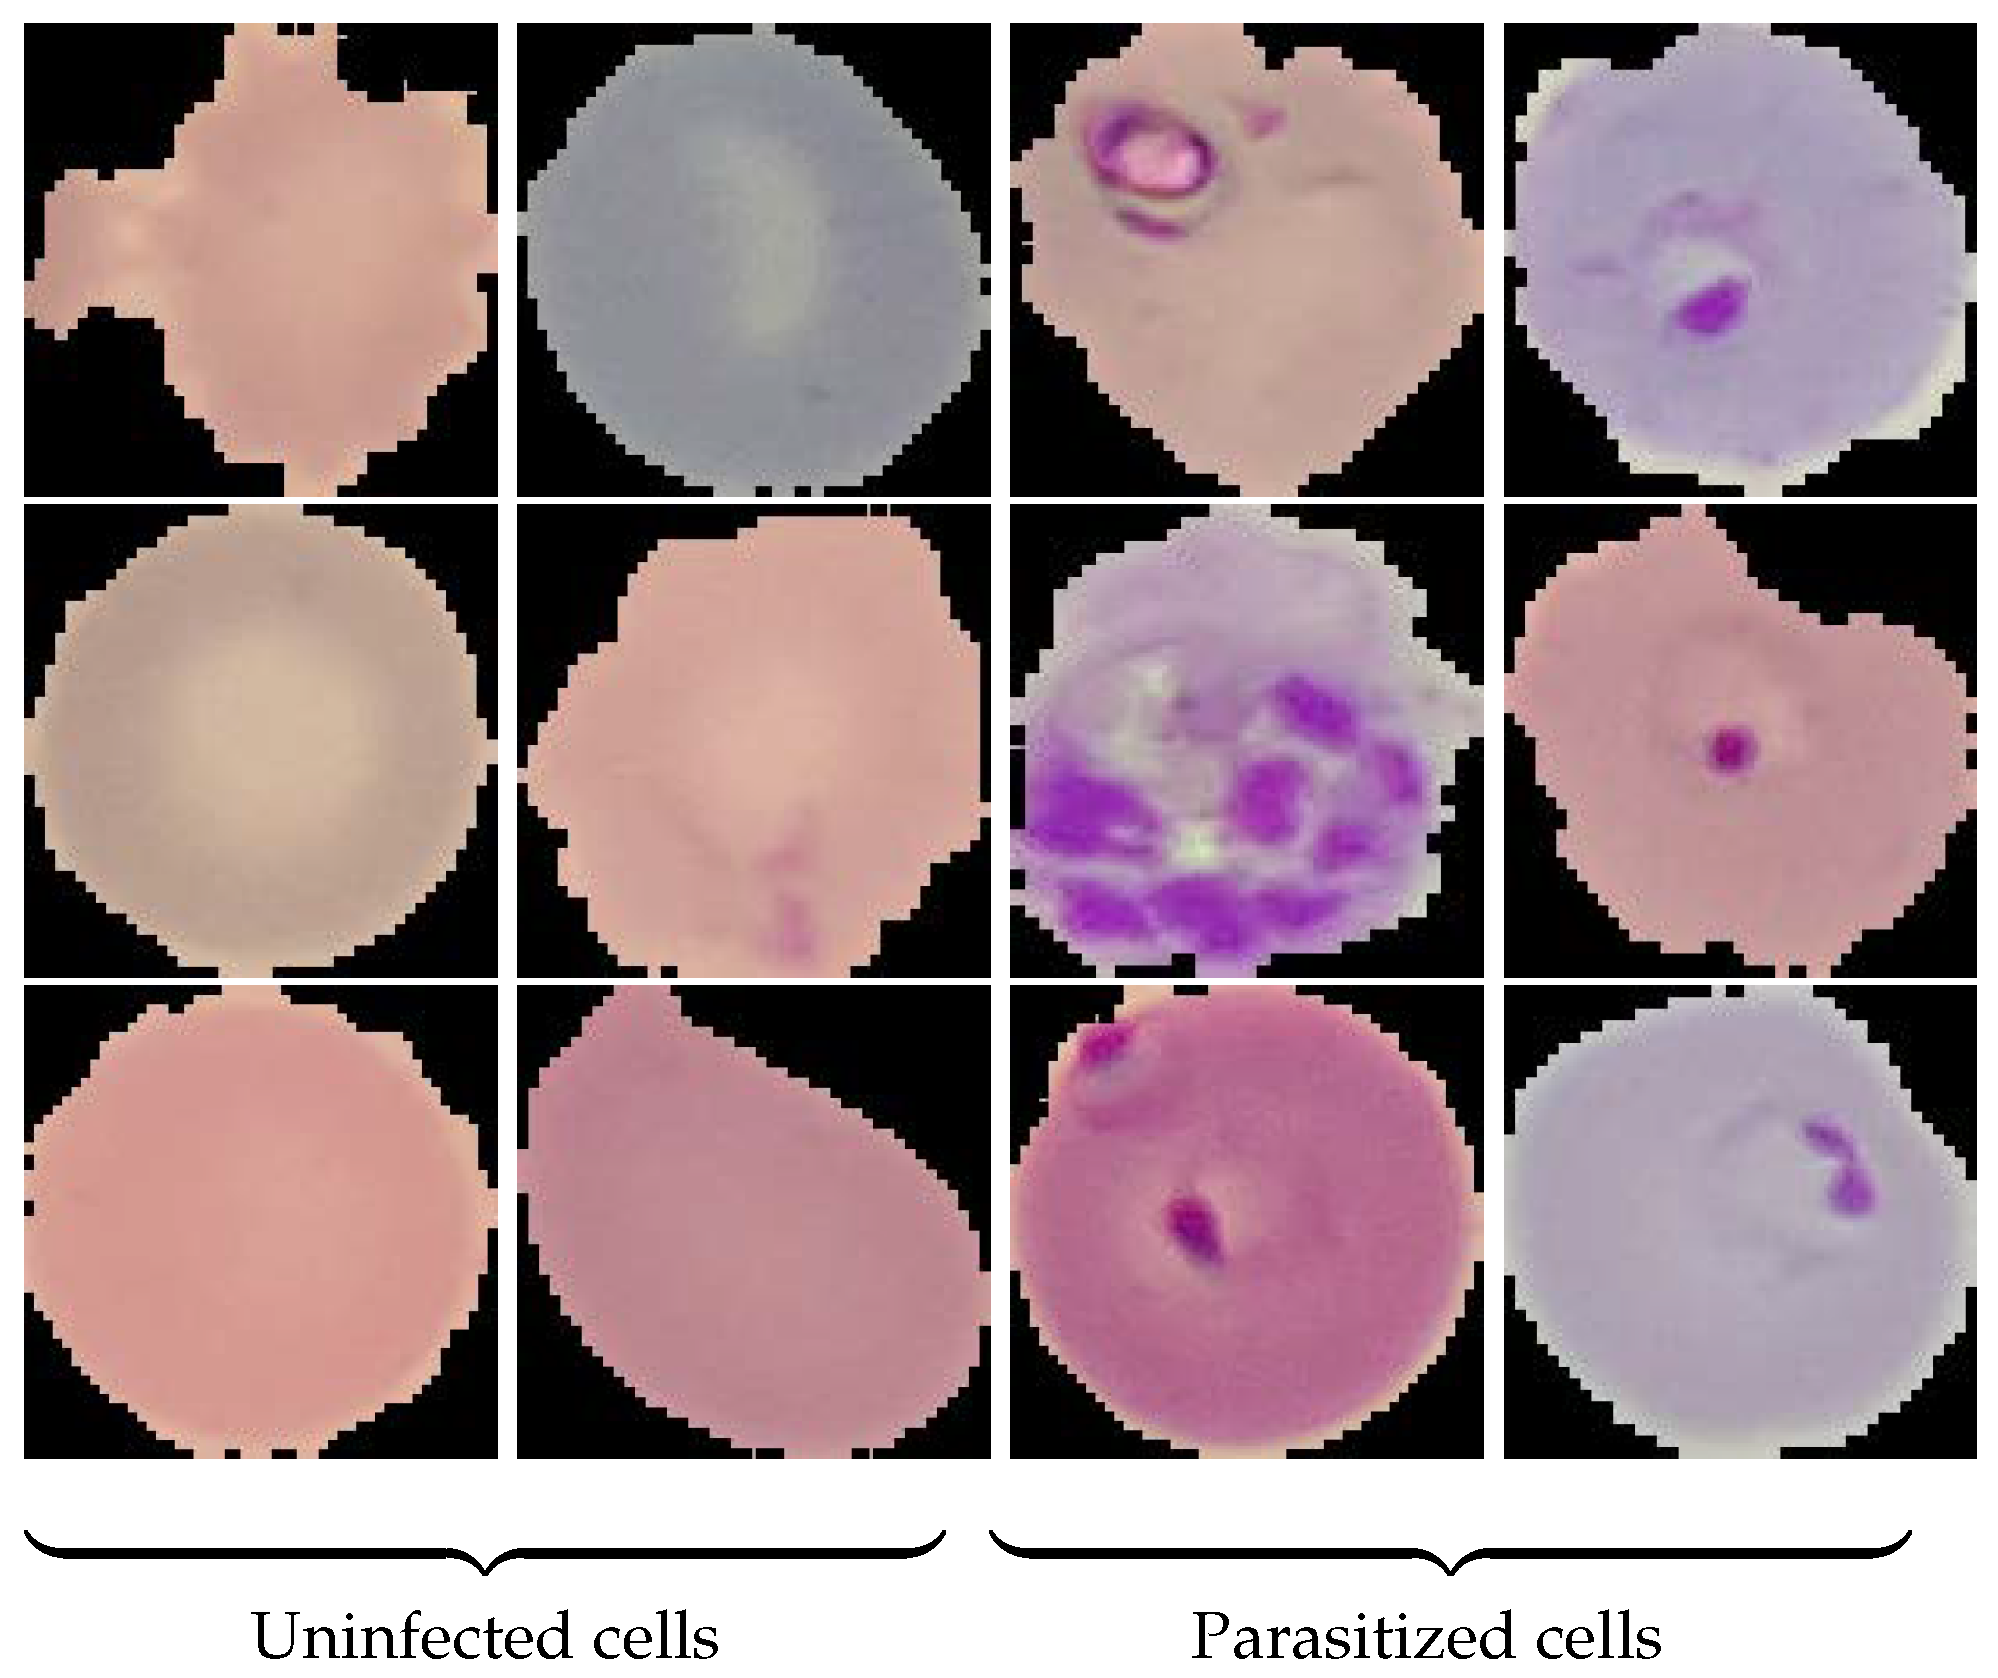
5.1. Data Acquisition
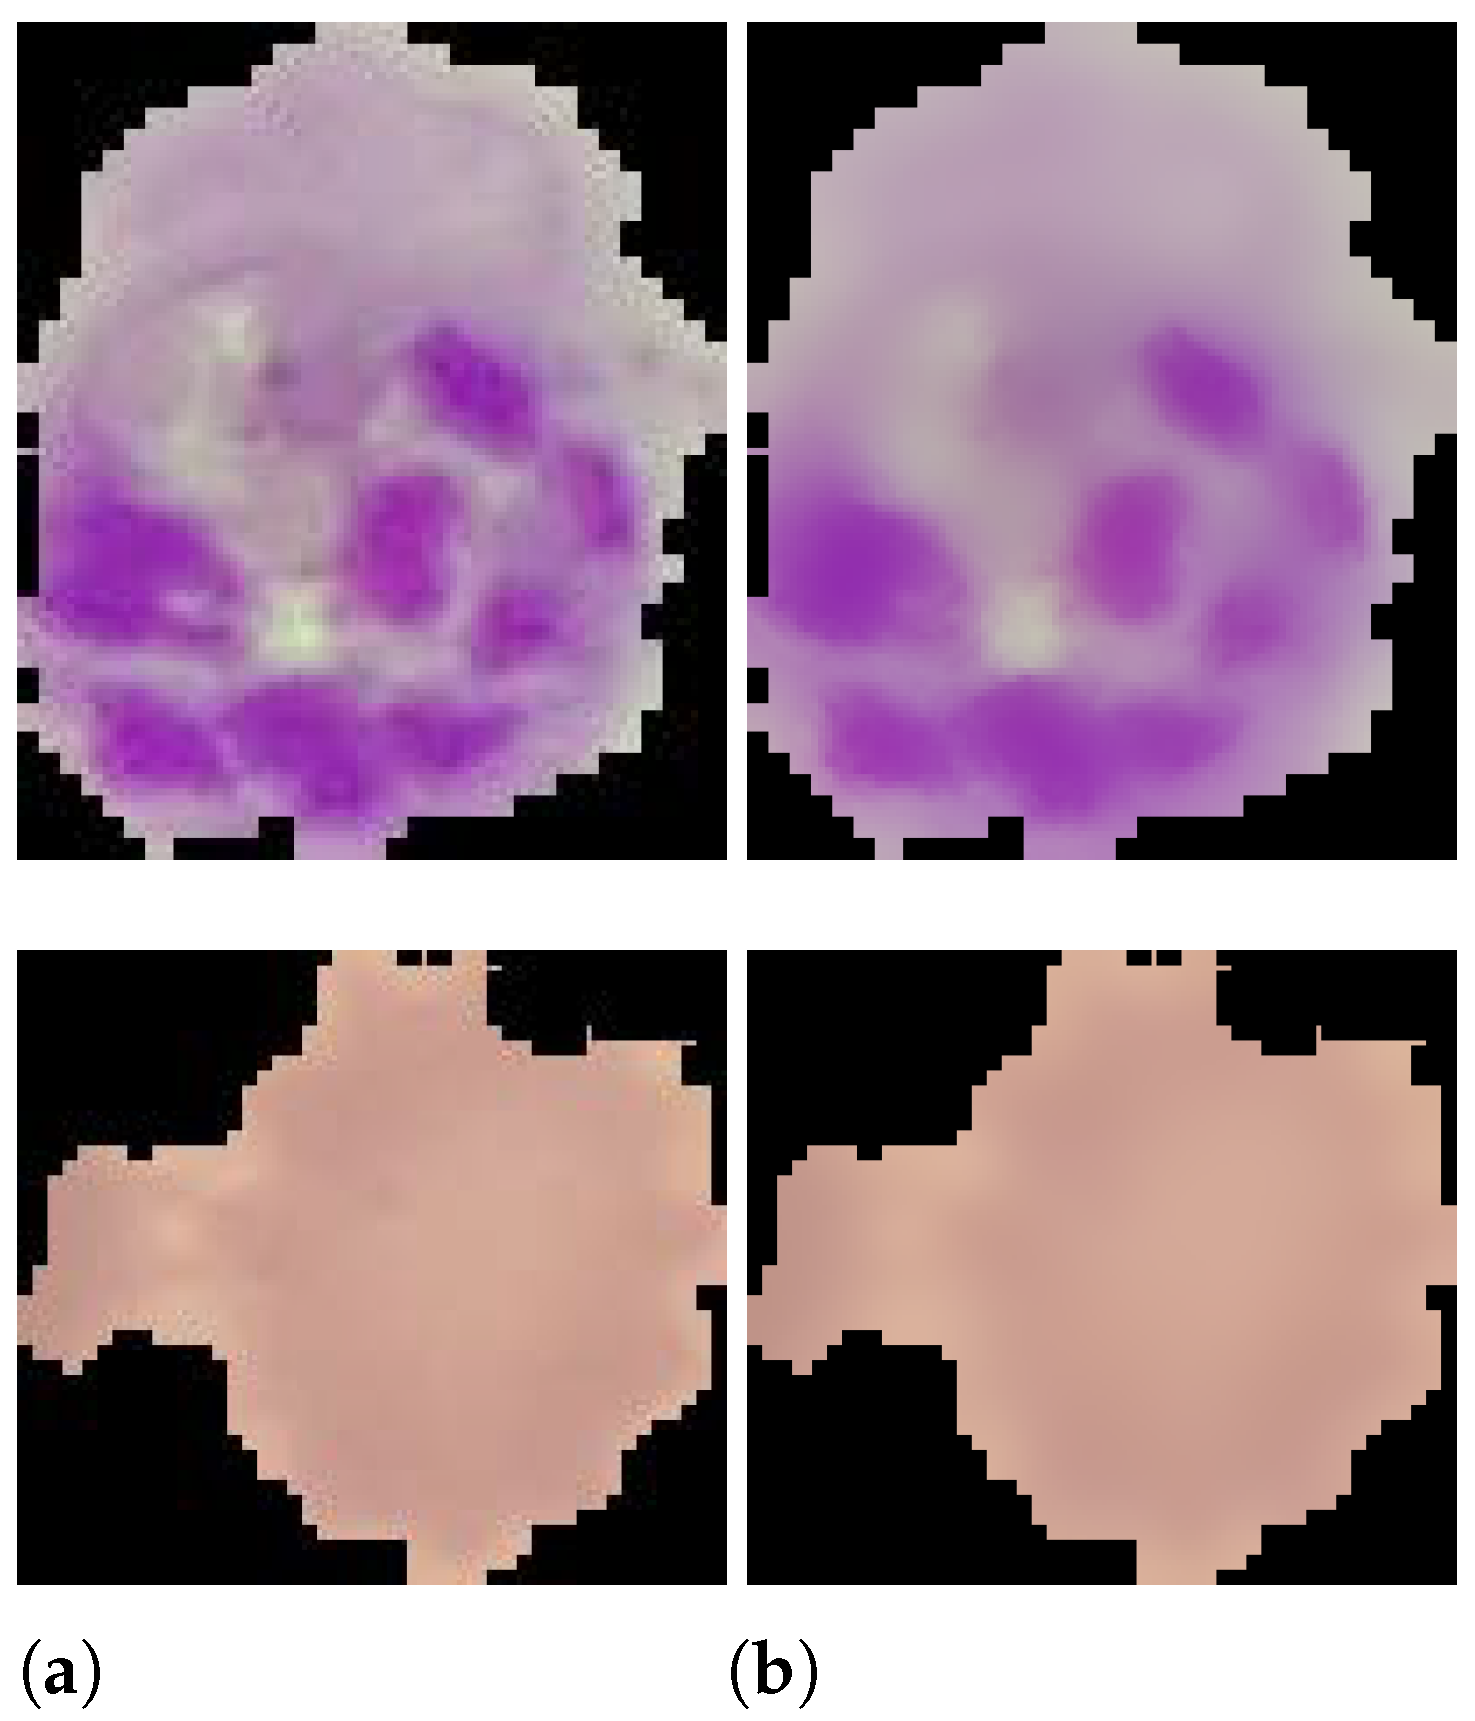
5.2. Data Preprocessing
5.3. Implementation Details
5.4. Performance Evaluation and Comparison
5.5. Performance Comparison with Existing Methods
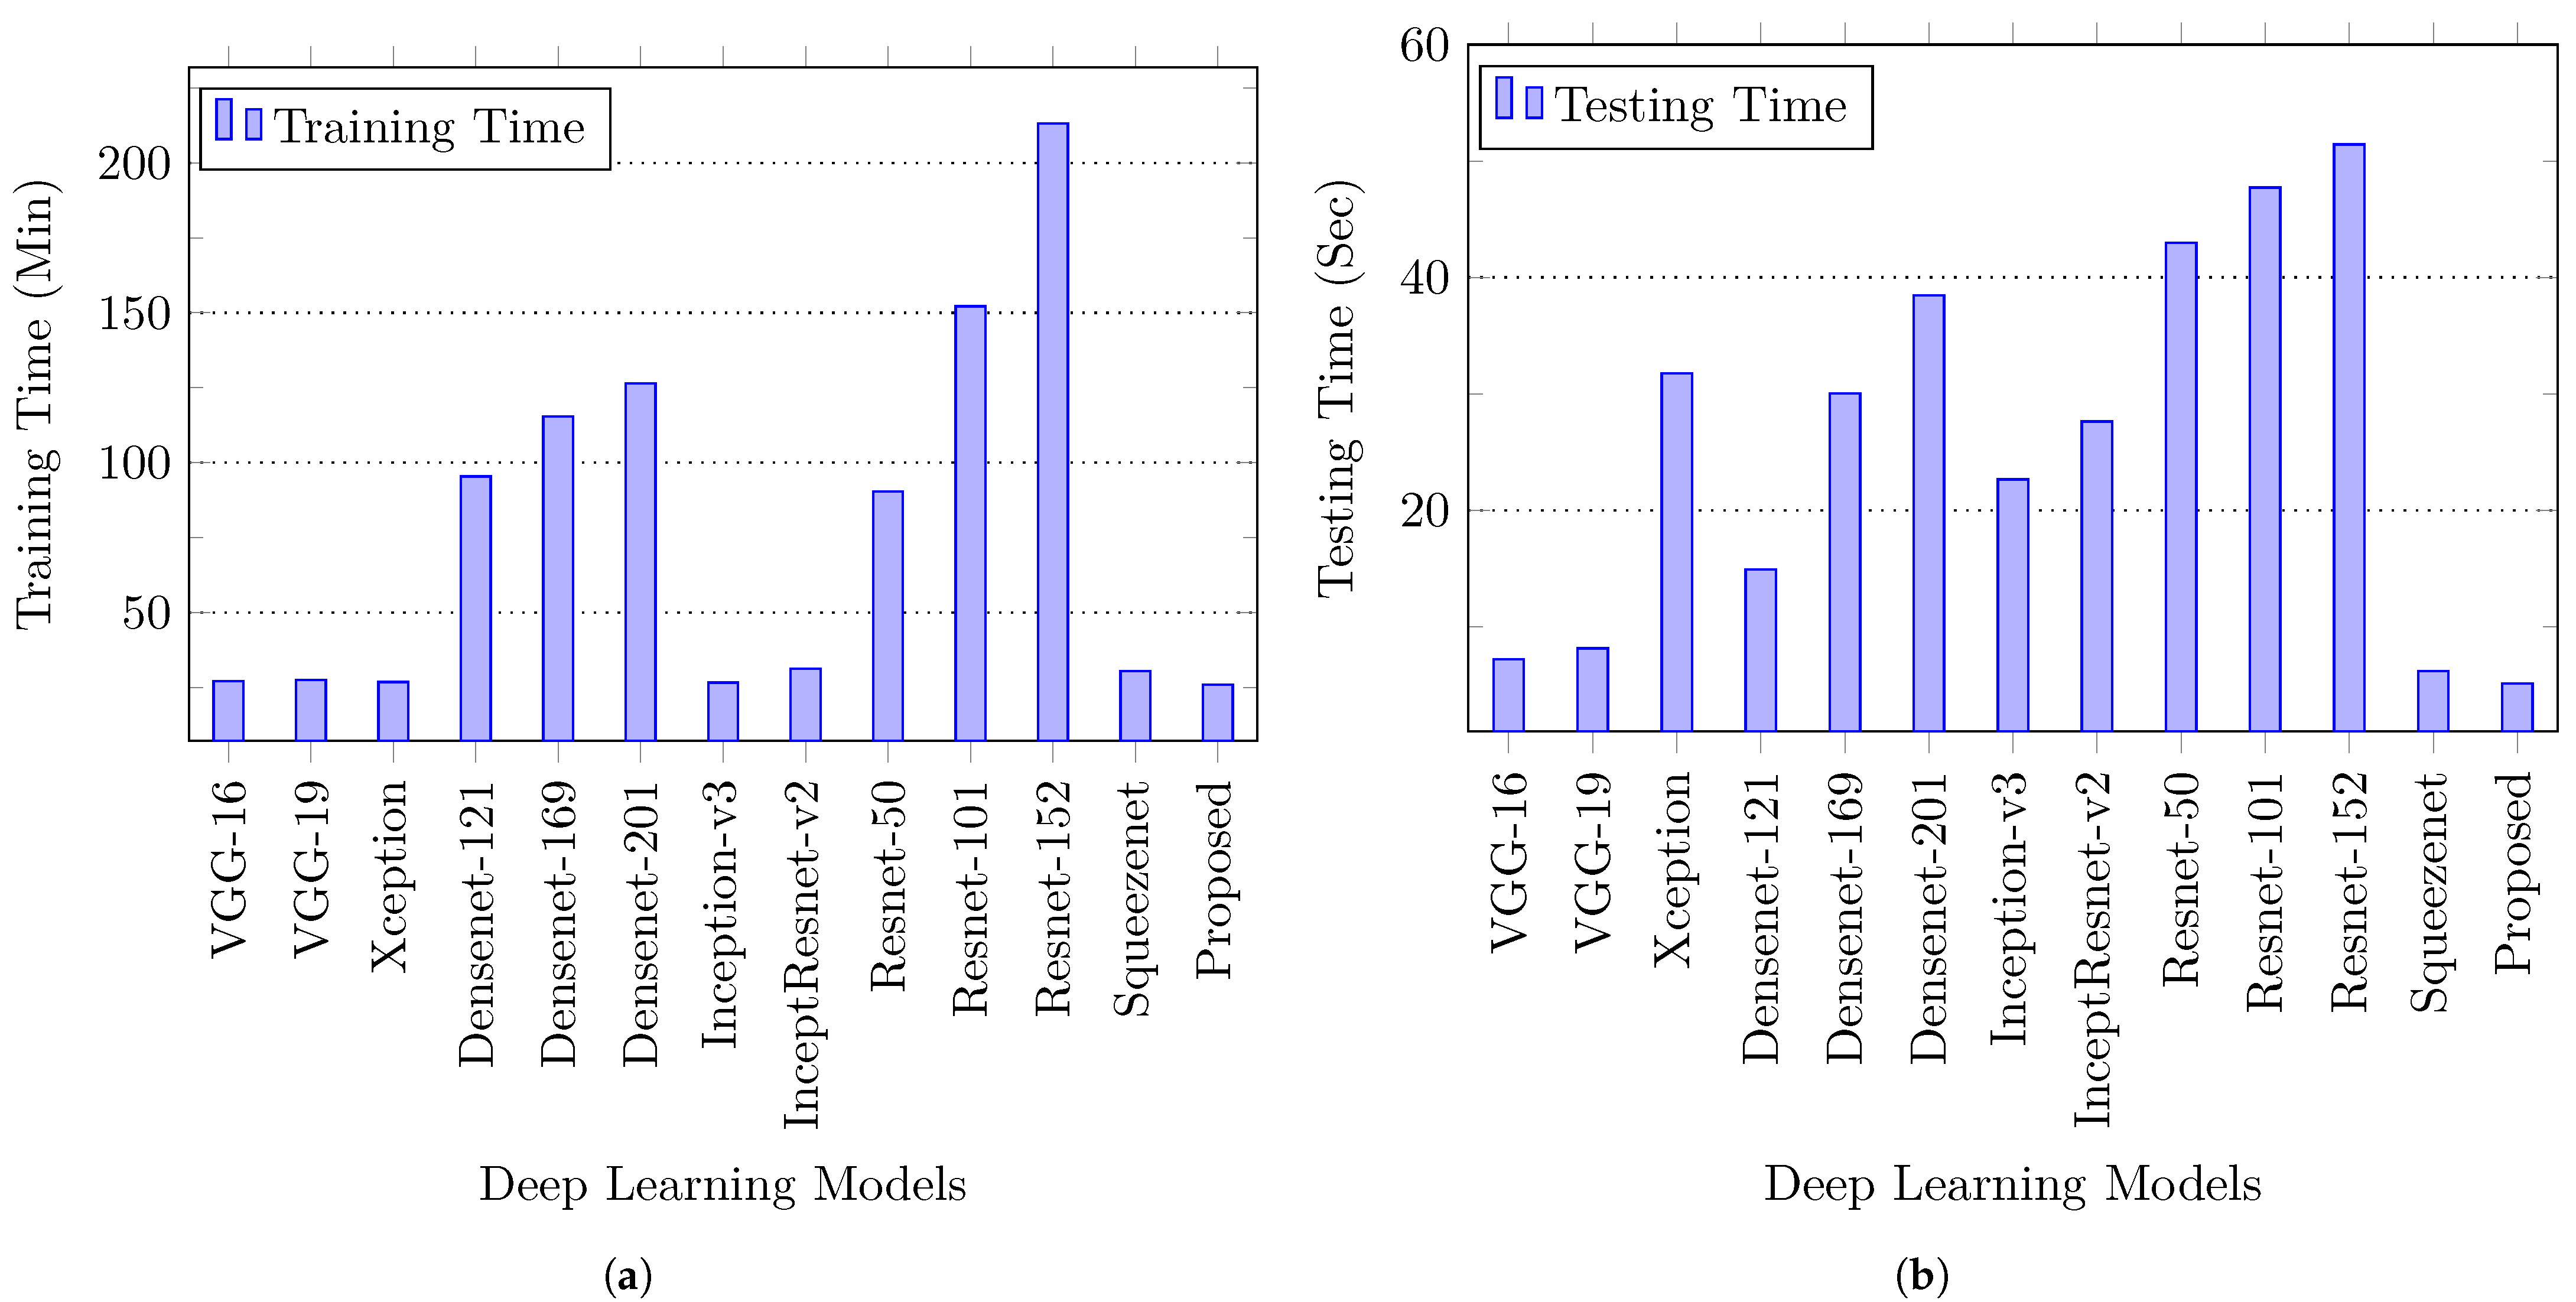
5.6. Time Complexity Analysis
6. Conclusions
Author Contributions
Funding
Institutional Review Board Statement
Informed Consent Statement
Conflicts of Interest
References
- World Health Organization. Malaria Microscopy Quality Assurance Manual-Version 2; World Health Organization: Geneva, Switzerland, 2016. [Google Scholar]
- Moody, A. Rapid diagnostic tests for malaria parasites. Clin. Microbiol. Rev. 2002, 15, 66–78. [Google Scholar] [CrossRef] [Green Version]
- Bosco, A.B.; Nankabirwa, J.I.; Yeka, A.; Nsobya, S.; Gresty, K.; Anderson, K.; Mbaka, P.; Prosser, C.; Smith, D.; Opigo, J.; et al. Limitations of rapid diagnostic tests in malaria surveys in areas with varied transmission intensity in Uganda 2017–2019: Implications for selection and use of HRP2 RDTs. PLoS ONE 2021, 15, e24445. [Google Scholar] [CrossRef]
- Grabias, B.; Kumar, S. Adverse neuropsychiatric effects of antimalarial drugs. Expert Opin. Drug Saf. 2016, 15, 903–910. [Google Scholar] [CrossRef] [PubMed]
- Frean, J. Microscopic determination of malaria parasite load: Role of image analysis. Microsc. Sci. Technol. Appl. Educ. 2010, 862–866. [Google Scholar]
- Moon, S.; Lee, S.; Kim, H.; Freitas-Junior, L.H.; Kang, M.; Ayong, L.; Hansen, M.A.E. An Image Analysis Algorithm for Malaria Parasite Stage Classification and Viability Quantification. PLoS ONE 2013, 8, e61812. [Google Scholar] [CrossRef]
- Maity, M.; Maity, A.K.; Dutta, P.K.; Chakraborty, C. A web-accessible framework for automated storage with compression and textural classification of malaria parasite images. Int. J. Comput. Appl. 2012, 52, 31–39. [Google Scholar] [CrossRef]
- Jan, Z.; Khan, A.; Sajjad, M.; Muhammad, K.; Rho, S.; Mehmood, I. A review on automated diagnosis of malaria parasite in microscopic blood smears images. Multimed. Tools Appl. 2018, 77, 9801–9826. [Google Scholar] [CrossRef]
- Poostchi, M.; Silamut, K.; Maude, R.J.; Jaeger, S.; Thoma, G. Image analysis and machine learning for detecting malaria. Transl. Res. 2018, 194, 36–55. [Google Scholar] [CrossRef] [PubMed] [Green Version]
- Manzo, M.; Pellino, S. Bucket of Deep Transfer Learning Features and Classification Models for Melanoma Detection. J. Imaging 2020, 6, 129. [Google Scholar] [CrossRef]
- Fatima, T.; Farid, M.S. Automatic detection of Plasmodium parasites from microscopic blood images. J. Parasit. Dis. 2020, 44, 69–78. [Google Scholar] [CrossRef]
- Das, D.K.; Ghosh, M.; Pal, M.; Maiti, A.K.; Chakraborty, C. Machine learning approach for automated screening of malaria parasite using light microscopic images. Micron 2013, 45, 97–106. [Google Scholar] [CrossRef]
- Di Ruberto, C.; Dempster, A.; Khan, S.; Jarra, B. Analysis of infected blood cell images using morphological operators. Image Vis. Comput. 2002, 20, 133–146. [Google Scholar] [CrossRef]
- Arco, J.E.; Górriz, J.M.; Ramírez, J.; Álvarez, I.; Puntonet, C.G. Digital image analysis for automatic enumeration of malaria parasites using morphological operations. Expert Syst. Appl. 2015, 42, 3041–3047. [Google Scholar] [CrossRef]
- Tek, F.B.; Dempster, A.G.; Kale, I. Malaria parasite detection in peripheral blood images. In Proceedings of the British Machine Vision Conference 2006, Edinburgh, UK, 4–7 September 2006; BMVA: Edinburgh, UK, 2006; pp. 347–356. [Google Scholar]
- Díaz, G.; González, F.A.; Romero, E. A semi-automatic method for quantification and classification of erythrocytes infected with malaria parasites in microscopic images. J. Biomed. Inform. 2009, 42, 296–307. [Google Scholar] [CrossRef] [Green Version]
- Savkare, S.S.; Narote, S.P. Automated system for malaria parasite identification. In Proceedings of the 2015 International Conference on Communication, Information & Computing Technology (ICCICT), Mumbai, India, 15–17 January 2015; pp. 1–4. [Google Scholar]
- Rakshit, P.; Bhowmik, K. Detection of presence of parasites in human RBC in case of diagnosing malaria using image processing. In Proceedings of the IEEE Second International Conference on Image Information Processing (ICIIP-2013), Shimla, India, 9–11 December 2013; pp. 329–334. [Google Scholar]
- Purwar, Y.; Shah, S.L.; Clarke, G.; Almugairi, A.; Muehlenbachs, A. Automated and unsupervised detection of malarial parasites in microscopic images. Malar. J. 2011, 10, 364. [Google Scholar] [CrossRef] [Green Version]
- Arbelaez, P.; Maire, M.; Fowlkes, C.; Malik, J. Contour detection and hierarchical image segmentation. IEEE Trans. Pattern Anal. Mach. Intell. 2010, 33, 898–916. [Google Scholar] [CrossRef] [Green Version]
- Savkare, S.; Narote, S. Automatic system for classification of erythrocytes infected with malaria and identification of parasite’s life stage. Proc. Technol. 2012, 6, 405–410. [Google Scholar] [CrossRef] [Green Version]
- Damahe, L.B.; Krishna, R.; Janwe, N.; Thakur, N. Segmentation based approach to detect parasites and RBCs in blood cell images. Int. J. Comput. Sci. Appl. 2011, 4, 71–81. [Google Scholar]
- Chakrabortya, K.; Chattopadhyayb, A.; Chakrabarti, A.; Acharyad, T.; Dasguptae, A.K. A combined algorithm for malaria detection from thick smear blood slides. J. Health Med. Inf. 2015, 6, 645–652. [Google Scholar] [CrossRef]
- Ghosh, M.; Das, D.; Chakraborty, C.; Ray, A.K. Plasmodium vivax segmentation using modified fuzzy divergence. In Proceedings of the 2011 International Conference on Image Information Processing, Shimla, India, 3–5 November 2011; pp. 1–5. [Google Scholar]
- Chayadevi, M.; Raju, G. Automated colour segmentation of malaria parasite with fuzzy and fractal methods. In Computational Intelligence in Data Mining-Volume 3; Springer: New Delhi, India, 2015; Volume 33, pp. 53–63. [Google Scholar]
- Zhang, Z.; Ong, L.L.S.; Fang, K.; Matthew, A.; Dauwels, J.; Dao, M.; Asada, H. Image classification of unlabeled malaria parasites in red blood cells. In Proceedings of the 2016 38th Annual International Conference of the IEEE Engineering in Medicine and Biology Society (EMBC), Orlando, FL, USA, 16–20 August 2016; pp. 3981–3984. [Google Scholar]
- Aimi Salihah, A.N.; Yusoff, M.; Zeehaida, M. Colour image segmentation approach for detection of malaria parasites using various colour models and k-means clustering. WSEAS Trans. Biol. Biomed 2013, 10. [Google Scholar]
- Bhowmick, S.; Das, D.K.; Maiti, A.K.; Chakraborty, C. Structural and textural classification of erythrocytes in anaemic cases: A scanning electron microscopic study. Micron 2013, 44, 384–394. [Google Scholar] [CrossRef]
- Devi, S.S.; Sheikh, S.A.; Talukdar, A.; Laskar, R.H. Malaria infected erythrocyte classification based on the histogram features using microscopic images of thin blood smear. Ind. J. Sci. Technol. 2016, 9, 1–10. [Google Scholar] [CrossRef]
- Mandal, S.; Kumar, A.; Chatterjee, J.; Manjunatha, M.; Ray, A.K. Segmentation of blood smear images using normalized cuts for detection of malarial parasites. In Proceedings of the Annual IEEE India Conference (INDICON), Kolkata, India, 17–19 December 2010; pp. 1–4. [Google Scholar]
- Kareem, S.; Kale, I.; Morling, R.C.S. Automated P. falciparum Detection System for Post-Treatment Malaria Diagnosis Using Modified Annular Ring Ratio Method. In Proceedings of the 2012 UKSim 14th International Conference on Computer Modelling and Simulation, Cambridge, UK, 28–30 March 2012; pp. 432–436. [Google Scholar]
- Kareem, S.; Kale, I.; Morling, R.C.S. Automated malaria parasite detection in thin blood films: A hybrid illumination and color constancy insensitive, morphological approach. In Proceedings of the 2012 IEEE Asia Pacific Conference on Circuits and Systems, Kaohsiung, Taiwan, 2–5 December 2012; pp. 240–243. [Google Scholar]
- Maitethia Memeu, D.; Kaduki, K.; Mjomba, A.; Muriuki, N.; Gitonga, L. Detection of plasmodium parasites from images of thin blood smears. Open J. Clin. Diagn. 2013, 03, 183–194. [Google Scholar] [CrossRef] [Green Version]
- Abdul Nasir, A.S.; Mashor, M.Y.; Mohamed, Z. Segmentation based approach for detection of malaria parasites using moving k-means clustering. In Proceedings of the 2012 IEEE-EMBS Conference on Biomedical Engineering and Sciences, Langkawi, Malaysia, 17–19 December 2012; pp. 653–658. [Google Scholar]
- Das, D.; Ghosh, M.; Chakraborty, C.; Maiti, A.K.; Pal, M. Probabilistic prediction of malaria using morphological and textural information. In Proceedings of the 2011 International Conference on Image Information Processing, Shimla, India, 3–5 November 2011; pp. 1–6. [Google Scholar]
- Linder, N.; Turkki, R.; Walliander, M.; Mårtensson, A.; Diwan, V.; Rahtu, E.; Pietikäinen, M.; Lundin, M.; Lundin, J. A malaria diagnostic tool based on computer vision screening and visualization of Plasmodium falciparum candidate areas in digitized blood smears. PLoS ONE 2014, 9, e104855. [Google Scholar] [CrossRef] [PubMed] [Green Version]
- Muralidharan, V.; Dong, Y.; David Pan, W. A comparison of feature selection methods for machine learning based automatic malarial cell recognition in wholeslide images. In Proceedings of the 2016 IEEE-EMBS International Conference on Biomedical and Health Informatics (BHI), Las Vegas, NV, USA, 24–27 February 2016; pp. 216–219. [Google Scholar]
- Suwalka, I.; Sanadhya, A.; Mathur, A.; Chouhan, M.S. Identify malaria parasite using pattern recognition technique. In Proceedings of the 2012 International Conference on Computing, Communication and Applications, Dindigul, India, 22–24 February 2012; pp. 1–4. [Google Scholar]
- Chavan, S.N.; Sutkar, A.M. Malaria disease identification and analysis using image processing. Int. J. Latest Trends Eng. Technol. 2014, 3, 218–223. [Google Scholar]
- Ghate, D.A.; Jadhav, C.; Rani, N. Automatic detection of malaria parasite from blood images. Int. J. Comput. Sci. Appl. 2012, 1, 66–71. [Google Scholar]
- Suryawanshi, M.S.; Dixit, V. Improved technique for detection of malaria parasites within the blood cell images. Int. J. Sci. Eng. Res. 2013, 4, 373–375. [Google Scholar]
- Annaldas, M.S.; Shirgan, S.; Marathe, V. Enhanced identification of malaria parasite using different classification algorithms in thick film blood images. Int. J. Res. Advent Technol. 2014, 2, 16–20. [Google Scholar]
- Tsai, M.H.; Yu, S.S.; Chan, Y.K.; Jen, C.C. Blood smear image based malaria parasite and infected-erythrocyte detection and segmentation. J. Med. Syst. 2015, 39, 118. [Google Scholar] [CrossRef]
- Poostchi, M.; Ersoy, I.; McMenamin, K.; Gordon, E.; Palaniappan, N.; Pierce, S.; Maude, R.J.; Bansal, A.; Srinivasan, P.; Miller, L.; et al. Malaria parasite detection and cell counting for human and mouse using thin blood smear microscopy. J. Med. Imaging 2018, 5, 044506. [Google Scholar] [CrossRef]
- Dong, Y.; Jiang, Z.; Shen, H.; David Pan, W.; Williams, L.A.; Reddy, V.V.B.; Benjamin, W.H.; Bryan, A.W. Evaluations of deep convolutional neural networks for automatic identification of malaria infected cells. In Proceedings of the 2017 IEEE EMBS International Conference on Biomedical Health Informatics (BHI), Orlando, FL, USA, 16–19 February 2017; pp. 101–104. [Google Scholar]
- Quinn, J.A.; Nakasi, R.; Mugagga, P.K.; Byanyima, P.; Lubega, W.; Andama, A. Deep convolutional neural networks for microscopy-based point of care diagnostics. In Proceedings of the Machine Learning for Healthcare Conference, Los Angeles, CA, USA, 19–20 August 2016; pp. 271–281. [Google Scholar]
- Xie, W.; Noble, J.A.; Zisserman, A. Microscopy cell counting and detection with fully convolutional regression networks. Comput. Methods Biomech. Biomed. Eng. Imaging Vis. 2018, 6, 283–292. [Google Scholar] [CrossRef]
- Gopakumar, G.P.; Swetha, M.; Sai Siva, G.; Sai Subrahmanyam, G.R.K. Convolutional neural network-based malaria diagnosis from focus stack of blood smear images acquired using custom-built slide scanner. J. Biophotonics 2018, 11, e201700003. [Google Scholar] [CrossRef]
- Liang, Z.; Powell, A.; Ersoy, I.; Poostchi, M.; Silamut, K.; Palaniappan, K.; Guo, P.; Hossain, M.A.; Sameer, A.; Maude, R.J.; et al. CNN-based image analysis for malaria diagnosis. In Proceedings of the 2016 IEEE International Conference on Bioinformatics and Biomedicine (BIBM), Shenzhen, China, 15–18 December 2016; pp. 493–496. [Google Scholar]
- Pattanaik, P.A.; Wang, Z.; Horain, P. Deep CNN frameworks comparison for malaria diagnosis. In Proceedings of the IMVIP 2019 Irish Machine Vision and Image Processing Conference, Dublin, Ireland, 28–30 August 2019. [Google Scholar]
- Hung, J.; Carpenter, A. Applying faster R-CNN for object detection on malaria images. In Proceedings of the IEEE Conf. Comput. Vis. Pattern Recognit. Workshop (CVPRW), Honolulu, HI, USA, 21–26 July 2017; pp. 56–61. [Google Scholar]
- Pan, W.D.; Dong, Y.; Wu, D. Classification of malaria-infected cells using deep convolutional neural networks. In Machine Learning—Advanced Techniques and Emerging Applications; Intech Open: London, UK, 2018; Volume 159. [Google Scholar]
- Vijayalakshmi, A. Deep learning approach to detect malaria from microscopic images. Multimed. Tools Appl. 2019, 79, 15297–15317. [Google Scholar] [CrossRef]
- Rajaraman, S.; Antani, S.K.; Poostchi, M.; Silamut, K.; Hossain, M.A.; Maude, R.J.; Jaeger, S.; Thoma, G.R. Pre-trained convolutional neural networks as feature extractors toward improved malaria parasite detection in thin blood smear images. PeerJ 2018, 6, e4568. [Google Scholar] [CrossRef]
- Sánchez, C.S. Deep Learning for Identifying Malaria Parasites in Images. Master’s Thesis, University of Edinburgh, Edinburgh, UK, 2015. [Google Scholar]
- Bibin, D.; Nair, M.S.; Punitha, P. Malaria parasite detection from peripheral blood smear images using deep belief networks. IEEE Access 2017, 5, 9099–9108. [Google Scholar] [CrossRef]
- Rahman, A.; Zunair, H.; Rahman, M.S.; Yuki, J.Q.; Biswas, S.; Alam, M.A.; Alam, N.B.; Mahdy, M. Improving Malaria Parasite Detection from Red Blood Cell using Deep Convolutional Neural Networks. arXiv 2019, arXiv:1907.10418. [Google Scholar]
- Krizhevsky, A.; Sutskever, I.; Hinton, G.E. ImageNet Classification with Deep Convolutional Neural Networks. Commun. ACM 2017, 60, 84–90. [Google Scholar] [CrossRef]
- Sharma, N.; Jain, V.; Mishra, A. An analysis of convolutional neural networks for image classification. Procedia Comput. Sci. 2018, 132, 377–384. [Google Scholar] [CrossRef]
- He, K.; Zhang, X.; Ren, S.; Sun, J. Deep Residual Learning for Image Recognition. In Proceedings of the IEEE Conference on Computer Vision and Pattern Recognition, Las Vegas, NV, USA, 27–30 June 2016; pp. 770–778. [Google Scholar]
- Huang, G.; Liu, Z.; Van Der Maaten, L.; Weinberger, K.Q. Densely Connected Convolutional Networks. In Proceedings of the IEEE Conference on Computer Vision and Pattern Recognition (CVPR), Honolulu, HI, USA, 21–26 July 2017; pp. 4700–4708. [Google Scholar]
- Szegedy, C.; Liu, W.; Jia, Y.; Sermanet, P.; Reed, S.; Anguelov, D.; Erhan, D.; Vanhoucke, V.; Rabinovich, A. Going deeper with convolutions. In Proceedings of the IEEE Conference on Computer Vision and Pattern Recognition (CVPR), Boston, MA, USA, 7–12 June 2015; pp. 1–9. [Google Scholar]
- Russakovsky, O.; Deng, J.; Su, H.; Krause, J.; Satheesh, S.; Ma, S.; Huang, Z.; Karpathy, A.; Khosla, A.; Bernstein, M.; et al. Imagenet large scale visual recognition challenge. Int. J. Comput. Vis. 2015, 115, 211–252. [Google Scholar] [CrossRef] [Green Version]
- Simonyan, K.; Zisserman, A. Very Deep Convolutional Networks for Large-Scale Image Recognition. arXiv 2015, arXiv:1409.1556. [Google Scholar]
- Zhu, Y.; Newsam, S. DenseNet for dense flow. In Proceedings of the IEEE International Conference on Image Processing (ICIP), Beijing, China, 17–20 September 2017; pp. 790–794. [Google Scholar]
- Szegedy, C.; Vanhoucke, V.; Ioffe, S.; Shlens, J.; Wojna, Z. Rethinking the inception architecture for computer vision. In Proceedings of the IEEE Conference on Computer Vision and Pattern Recognition (CVPR), Las Vegas, NV, USA, 27–30 June 2016; pp. 2818–2826. [Google Scholar]
- Szegedy, C.; Ioffe, S.; Vanhoucke, V.; Alemi, A.A. Inception-v4, inception-resnet and the impact of residual connections on learning. In Proceedings of the Thirty-First AAAI Conference on Artificial Intelligence, San Francisco, CA, USA, 4–9 February 2017; pp. 4278–4284. [Google Scholar]
- Chollet, F. Xception: Deep learning with depthwise separable convolutions. In Proceedings of the IEEE Conf. Comput. Vis. Pattern Recognit (CVPRW), Honolulu, HI, USA, 21–26 July 2017; pp. 1800–1807. [Google Scholar]
- Deng, J.; Dong, W.; Socher, R.; Li, L.J.; Li, K.; Fei-Fei, L. Imagenet: A large-scale hierarchical image database. In Proceedings of the IEEE Conference on Computer Vision and Pattern Recognition (CVPR), Miami, FL, USA, 20–25 June 2009; pp. 248–255. [Google Scholar] [CrossRef] [Green Version]
- Iandola, F.N.; Han, S.; Moskewicz, M.W.; Ashraf, K.; Dally, W.J.; Keutzer, K. SqueezeNet: AlexNet-level accuracy with 50x fewer parameters and <0.5 MB model size. arXiv 2016, arXiv:1602.07360. [Google Scholar]
- Tomasi, C.; Manduchi, R. Bilateral Filtering for Gray and Color Images. In Proceedings of the Sixth International Conference on Computer Vision (ICCV ’98), Bombay, India, 4–7 January 1998; IEEE Computer Society: Washington, DC, USA, 1998; p. 839. [Google Scholar]
- Srivastava, N.; Hinton, G.; Krizhevsky, A.; Sutskever, I.; Salakhutdinov, R. Dropout: A simple way to prevent neural networks from overfitting. J. Mach. Learn. Res. 2014, 15, 1929–1958. [Google Scholar]
- Wang, J.; Perez, L. The effectiveness of data augmentation in image classification using deep learning. arXiv 2017, arXiv:1712.04621. [Google Scholar]
- Chollet, F. Building powerful image classification models using very little data. Keras Blog, 5 June 2016. [Google Scholar]
- Cohen, J. A coefficient of agreement for nominal scales. Educ. Psychol. Meas. 1960, 20, 37–46. [Google Scholar] [CrossRef]
- Fawcett, T. An introduction to ROC analysis. Pattern Recognit. Lett. 2006, 27, 861–874. [Google Scholar] [CrossRef]
- Matthews, B.W. Comparison of the predicted and observed secondary structure of T4 phage lysozyme. Biochim. Biophys. Acta Protein Struct. 1975, 405, 442–451. [Google Scholar] [CrossRef]
- Sasaki, Y. The truth of the F-measure. Teach Tutor Mater 2007, 1, 1–5. [Google Scholar]
- Farid, M.S.; Lucenteforte, M.; Grangetto, M. DOST: A distributed object segmentation tool. Multimed. Tools Appl. 2018, 77, 20839–20862. [Google Scholar] [CrossRef] [Green Version]
- Chicco, D.; Jurman, G. Machine learning can predict survival of patients with heart failure from serum creatinine and ejection fraction alone. BMC Med. Inform. Decis. Mak. 2020, 20, 16. [Google Scholar] [CrossRef]
- LeCun, Y.; Bottou, L.; Bengio, Y.; Haffner, P. Gradient-based learning applied to document recognition. Proc. IEEE 1998, 86, 2278–2324. [Google Scholar] [CrossRef] [Green Version]


| Model | Attributes |
|---|---|
| VGG |
|
| ResNet |
|
| DenseNet |
|
| Inception |
|
| Xception |
|
| SqueezeNet |
|
| Dataset | Parasitized | Uninfected |
|---|---|---|
| Training | 8604 | 8766 |
| Testing | 4196 | 4076 |
| Validation | 979 | 952 |
| Model | Specificity | Sensitivity | Precision | Accuracy | F Score | MCC | |
|---|---|---|---|---|---|---|---|
| VGG-16 | 0.9632 | 0.9538 | 0.9585 | 0.9585 | 0.9585 | 0.9170 | 0.9170 |
| VGG-19 | 0.9655 | 0.9529 | 0.9593 | 0.9592 | 0.9592 | 0.9185 | 0.9185 |
| Xception | 0.9753 | 0.9255 | 0.9508 | 0.9494 | 0.9494 | 0.9002 | 0.8989 |
| Densenet-121 | 0.9526 | 0.9378 | 0.9453 | 0.9452 | 0.9452 | 0.8905 | 0.8904 |
| Densenet-169 | 0.9436 | 0.9327 | 0.9382 | 0.9382 | 0.9382 | 0.8764 | 0.8764 |
| Densenet-201 | 0.8769 | 0.9399 | 0.9079 | 0.9054 | 0.9052 | 0.8132 | 0.8106 |
| Inception_v3 | 0.9313 | 0.9297 | 0.9306 | 0.9306 | 0.9306 | 0.8611 | 0.8611 |
| Inc. Resnet_v2 | 0.9662 | 0.9556 | 0.9539 | 0.9539 | 0.9539 | 0.9179 | 0.9179 |
| Resnet-50 | 0.9727 | 0.9237 | 0.9536 | 0.9517 | 0.9617 | 0.9054 | 0.9035 |
| Resnet-101 | 0.9710 | 0.9419 | 0.9566 | 0.9562 | 0.9562 | 0.9129 | 0.9124 |
| Resnet-152 | 0.9726 | 0.9215 | 0.9525 | 0.9505 | 0.9505 | 0.9031 | 0.9011 |
| Squeeze Net | 0.9562 | 0.9311 | 0.9438 | 0.9435 | 0.9435 | 0.8874 | 0.8871 |
| Proposed | 0.9778 | 0.9633 | 0.9682 | 0.9682 | 0.9682 | 0.9364 | 0.9364 |
| Method | Dataset | Size | Specificity | Sensitivity | Precision | Accuracy | F1 Score |
|---|---|---|---|---|---|---|---|
| Das [12] | Self collected | – | 0.6890 | 0.9810 | – | 0.8400 | – |
| Sanchez [55] | – | – | – | – | 0.8927 | – | 0.9530 |
| Hung [51] | Self collected | 1300 | 0.8519 | 0.7766 | 0.7804 | 0.8215 | 0.7784 |
| Bibin [56] | Self collected | 630 | 0.9590 | 0.9760 | – | 0.9630 | 0.8960 |
| Pan [52] | PEIR-VM | 24,648 | 0.8273 | 0.7402 | 0.7439 | 0.7921 | 0.7420 |
| Rajaraman [54] | NIH dataset | 27,558 | 0.9720 | 0.9470 | – | 0.9590 | 0.9590 |
| Vijayalakshmi [53] | Self collected | 2550 | 0.9292 | 0.9344 | 0.8995 | 0.9313 | 0.9166 |
| Fatima [11] | NIH dataset | 27,558 | 0.9500 | 0.8860 | 0.9466 | 0.9180 | 0.9153 |
| Proposed | NIH dataset | 27,558 | 0.9778 | 0.9633 | 0.9682 | 0.9682 | 0.9682 |
Publisher’s Note: MDPI stays neutral with regard to jurisdictional claims in published maps and institutional affiliations. |
© 2021 by the authors. Licensee MDPI, Basel, Switzerland. This article is an open access article distributed under the terms and conditions of the Creative Commons Attribution (CC BY) license (http://creativecommons.org/licenses/by/4.0/).
Share and Cite
Maqsood, A.; Farid, M.S.; Khan, M.H.; Grzegorzek, M. Deep Malaria Parasite Detection in Thin Blood Smear Microscopic Images. Appl. Sci. 2021, 11, 2284. https://doi.org/10.3390/app11052284
Maqsood A, Farid MS, Khan MH, Grzegorzek M. Deep Malaria Parasite Detection in Thin Blood Smear Microscopic Images. Applied Sciences. 2021; 11(5):2284. https://doi.org/10.3390/app11052284
Chicago/Turabian StyleMaqsood, Asma, Muhammad Shahid Farid, Muhammad Hassan Khan, and Marcin Grzegorzek. 2021. "Deep Malaria Parasite Detection in Thin Blood Smear Microscopic Images" Applied Sciences 11, no. 5: 2284. https://doi.org/10.3390/app11052284