Article

Raman Spectrometry as a Tool for an Online Control of a Phototrophic Biological Nutrient Removal Process

by
Rita D. G. Franca
1,2,
Virgínia C. F. Carvalho
1,2,
Joana C. Fradinho
1,2,
Maria A. M. Reis
1,2 and
Nídia D. Lourenço
1,2,*
1
Associate Laboratory i4HB–Institute for Health and Bioeconomy, NOVA School of Science and Technology, NOVA University Lisbon, 2829-516 Caparica, Portugal
2
UCIBIO—Applied Molecular Biosciences Unit, Department of Chemistry, NOVA School of Science and Technology, NOVA University Lisbon, 2829-516 Caparica, Portugal
*
Author to whom correspondence should be addressed.
Appl. Sci. 2021, 11(14), 6600; https://doi.org/10.3390/app11146600
Submission received: 4 June 2021 / Revised: 14 July 2021 / Accepted: 16 July 2021 / Published: 18 July 2021

Abstract

:
Real-time bioprocess monitoring is crucial for efficient operation and effective bioprocess control. Aiming to develop an online monitoring strategy for facilitating optimization, fault detection and decision-making during wastewater treatment in a photo-biological nutrient removal (photo-BNR) process, this study investigated the application of Raman spectroscopy for the quantification of total organic content (TOC), volatile fatty acids (VFAs), carbon dioxide (CO2), ammonia (NH3), nitrate (NO3), phosphate (PO4), total phosphorus (total P), polyhydroxyalkanoates (PHAs), total carbohydrates, total and volatile suspended solids (TSSs and VSSs, respectively). Specifically, partial least squares (PLS) regression models were developed to predict these parameters based on Raman spectra, and evaluated based on a full cross-validation. Through the optimization of spectral pre-processing, Raman shift regions and latent variables, 8 out of the 11 parameters that were investigated—namely TOC, VFAs, CO2, NO3, total P, PHAs, TSSs and VSSs—could be predicted with good quality by the respective Raman-based PLS calibration models, as shown by the high coefficient of determination (R2 > 90.0%) and residual prediction deviation (RPD > 5.0), and relatively low root mean square error of cross-validation. This study showed for the first time the high potential of Raman spectroscopy for the online monitoring of TOC, VFAs, CO2, NO3, total P, PHAs, TSSs and VSSs in a photo-BNR reactor.

1. Introduction

Demographic expansion and the improvement of standards of living around the world have led to rapid urbanization, intensive agricultural practices and industrial expansion. Consequently, environmental and water pollution increased, either through the release of waste streams with high concentrations of carbon, nitrogen (N) and/or phosphorus (P), or through the excessive use of fertilizers [1]. Exceeding N and P discharge limits into natural water reserves can lead to eutrophication, perturbing the equilibrium of aquatic ecosystems [2]. Improving the ecological status of water sources is a growing concern for many nations, particularly regarding the reduction in N and P concentrations during wastewater treatment [3].
The technologies currently applied for N and P removal in wastewater treatment plants (WWTPs) are highly oxygen (O2) and/or chemical-dependent, which not only increases the operation costs of wastewater treatment, but also has a negative impact on the environment, due to the high greenhouse gas emissions that occur both during the wastewater treatment process and energy production for aeration. Biological nutrient removal (BNR) is the most common process implemented for simultaneous P and N removal, typically through sequential zones in activated sludge systems: anaerobic for carbon uptake and P release; anoxic for heterotrophic denitrification and P uptake; and aerobic for nitrification and P uptake. Such BNR systems require intensive O2 supply, often accounting for approximately 60% of WWTPs energy costs [4,5].
The use of phototrophic anoxygenic bacteria or microalgae systems for wastewater treatment is a good alternative to decrease aeration energy costs in WWTPs [3,6,7,8]. Furthermore, microalgal–bacterial consortia can achieve higher nutrient removal efficiencies than bacterial or microalgal systems alone and with reduced oxygenation costs. In fact, microalgae not only perform nutrient removal but also consume carbon dioxide (CO2) produced by bacteria, while producing, through photosynthesis, the O2 required for system oxygenation and heterotrophic bacterial growth [3]. In addition, higher nutrient recovery can be achieved when compared with anaerobic technologies in WWTPs [9,10], and the good settling properties of the microalgal–bacterial flocs reduce the biomass harvesting costs associated with microalgal systems [11,12]. Recently, a photo-enhanced biological phosphorus removal (photo-EBPR) system composed of a consortium of microalgae and bacteria demonstrated a good capacity for P removal at a low chemical oxygen demand (COD) to P ratio (COD/P) and without external aeration requirements [13]. The photo-EBPR system was operated with dark–light cycles, simulating conventional anaerobic–aerobic EBPR cycles, resulting in a culture enriched with polyphosphate accumulating organisms (PAOs) and microalgae [13].
In the current work, a photo-BNR system combining P and N removal was operated and monitored [14]. In photo-BNR systems, volatile fatty acids (VFAs), or other organic carbon sources, are consumed during the dark period. During the light period, microalgae consume CO2 and produce O2 to be used by PAOs and nitrifiers. Furthermore, PAOs will store excess P as polyphosphate, while nitrifiers oxidize ammonia to nitrate. Since both nitrifiers and microalgae are CO2 dependent, the CO2 mitigation ability of the photo-BNR process is potentially higher than that of other BNR processes. An anoxic dark period is added after the light period, to allow denitrification to occur. During the dark anoxic period, when no external carbon source is added, denitrifying PAOs are expected to perform denitrification by using the anaerobically stored polyhydroxyalkanoates (PHAs). The main mechanisms of nutrient removal observed in the photo-BNR were ammonia assimilation by the microbial biomass, phosphorus accumulation as poly-P by PAOs, and nitrate removal by denitrification. Due to the interaction between microalgae and bacteria, cells can aggregate as flocs more easily and settle very fast, resulting in a solids-free effluent and thus, solving one of the main problems of using microalgae for wastewater treatment. The goal of the photo-BNR process is to remove BNR aeration requirements and mitigate CO2 without the need for costly external COD dosing, thus reducing the operational costs and ecological footprint of the WWTP [14].
Real-time bioprocess monitoring is of crucial importance for efficient operation and effective bioprocess control [15]. In contrast with offline, retrospective and time-consuming reference analytical methods, which do not provide a real-time knowledge of process performance, the use of fast, non-destructive, robust and sensitive online spectroscopy probes, in combination with chemometrics, have great potential for the real-time monitoring of key bioprocess parameters, significantly reducing the time required for bioprocess control and optimization [16]. Raman spectroscopy can provide a wide range of information, from molecular structure to chemical environment, being among the most interesting spectroscopic-based techniques reported for the online monitoring of microbiological processes [16]. In fact, in addition to representing a rapid, eco-friendly and economic alternative to reference analytical methods (e.g., chromatography), Raman spectroscopy is particularly suitable for the in situ quantitative monitoring of multiple component bioprocesses, owing to the incorporation of fiber optic-based probes, as well as due to its insensitivity to water [17]. Nevertheless, applications of online bioprocess monitoring and control using Raman spectroscopy coupled with chemometrics are still scarce. Examples include nitrate and nitrite monitoring in a wastewater treatment bioreactor [18], the real-time prediction of glucose concentration during microalgae cultivation in a photo-bioreactor [19] and during mammalian cell cultivations [20], as well as the monitoring substrates and products during bacterial and yeast fermentation processes [15,16], especially for pharmaceutical industrial application [21,22].
In this context, the application of Raman spectroscopy for the online monitoring of a photo-BNR is of upmost interest, facilitating optimization, fault detection and decision-making during the wastewater treatment process. Specifically, real-time knowledge on key-parameters such as NH3, nitrate (NO3), phosphate (PO4) and total organic content (TOC), VFA and CO2 can be crucial for optimizing nutrient and carbon removal, namely by controlling the CO2 dosing and the time length of the anaerobic (dark), aerobic (light) and anoxic periods. In addition to PO4, polyphosphate (poly-P), or total P (which allow a more direct monitoring and control of the P removal performance), PHAs and carbohydrates are key functionally relevant intracellular polymers also involved in the EBPR process, as their real-time quantification significantly contributes to understanding the dynamics and optimizing the nutrient removal process. Moreover, monitoring cell growth by following the total suspended solids (TSSs) and volatile suspended solids (VSSs) by Raman spectroscopy would also provide important information on the system performance, such as, for example, the light availability per biomass concentration, a parameter that can affect photosynthesis efficiency [23].
Micro-Raman spectroscopy has been used for the simultaneous identification and quantification of the intracellular polymers poly-P, poly(3-hydroxybutyrate) (PHB) and glycogen in individual microbial cells from complex environmental samples, characterizing their distribution among conventional EBPR microbial populations [24,25]. Recent studies have further developed Raman microscopy-based quantitative approaches to assess the structural dynamics and storage states of these relevant intracellular polymers, crucial for a fundamental understanding of the EBPR process [26,27]. In addition, Raman microscopy was shown to identify and quantify poly-P in microalgal cells, specifically Chlorella vulgaris [28]. However, Raman microscopy is not suitable for online measurements and although Raman spectroscopy has been suggested to be a fast and efficient tool for process control of PHB bioproduction through qualitative and quantitative in situ monitoring of intracellular PHB content in Cupriavidus necator H16 cultures [29], its application to real-time monitoring in mixed microbial bioprocesses is limited and has never been demonstrated for a photo-BNR system.
Unlike Raman microscopy, where specific Raman peaks can be used to follow the associated biomolecules, Raman spectra acquired through an immersion probe in a complex environmental ecosystem, such as a photo-BNR reactor, are very complex, including a large amount of data. Therefore, Raman spectroscopy needs to be combined with chemometric tools to extract the relevant information from the spectral data and develop quantitative mathematical models that will ultimately allow real-time predictions of the system properties and a concentration of various analytes based on new, in line, fast and non-destructive spectroscopic measurements.
The present study aimed to develop a Raman-based monitoring strategy for the real-time prediction of several key parameters of a photo-BNR reactor for process control and optimization. Therefore, Raman spectra were acquired at-line, directly from mixed liquor samples harvested from a lab-scale photo-BNR reactor, and partial least squares (PLS) calibration models were developed to predict the concentration of TOC, VFAs, CO2, NH3, NO3, PO4, total P, PHAs, carbohydrates, TSSs and VSSs in the mixed liquid. The capacity of the calibration models to predict the reference data measured by standard analytical methods was evaluated by a full cross-validation procedure.

2. Materials and Methods

2.1. Reactor Operation and Sampling

An acrylic sequencing batch reactor (SBR) with a working volume of 2 L was inoculated with wastewater sludge from the aerobic tank of a WWTP located in Lisbon (Beirolas, Portugal). The SBR was fed with synthetic domestic wastewater and operated for 128 days in 8 h cycles, comprising subsequent periods of anaerobic (dark), aerobic (light) and anoxic phases for 7 h, followed by 1 h for settling and withdrawal. The synthetic medium, fed at the beginning of each cycle, was composed of 75% (v/v) of a phosphate solution (253 mg/L of K2HPO4 and 154 mg/L of KH2PO4) and 25% (v/v) of carbon and nitrogen medium with a concentration per liter of: 0.64 g C2H3O2Na·3H2O; 68 µL C3H6O2; 0.59 g NH4Cl; 0.95 g MgSO4·7H2O; 0.44 g CaCl2·2H2O; 11.7 mg allyl-N thiourea (ATU, only added during PAO enrichment to prevent nitrification); 31.7 mg ethylene-diaminetetraacetic (EDTA) to prevent salts precipitation and 3.17 mL of a micronutrients solution, with a concentration per liter of: 1.5 g FeCl3·6H2O; 0.15 g H3BO3; 0.03 g CuSO4·5H2O; 0.18 g KI; 0.12 g MnCl2·4H2O; 0.06 g Na2MoO·2H2O; 0.12 g ZnSO4·7H2O and 0.15 g CoCl2·6H2O. The carbon media contained volatile fatty acids (VFAs) at a ratio of 75% acetate and 25% propionate, to promote PAO enrichment [30]. The temperature of the reactor was set to 20 °C while the pH was controlled at 7.5 through the addition of 0.1 M HCl. Anaerobic, aerobic, anoxic and idle periods were stirred with a magnetic stirrer at a constant rate of 700 rpm. At the end of the anoxic period, the culture was settled and decanted, with 1 L of supernatant being removed. During the following idle period, argon was bubbled to ensure anaerobic conditions before the next cycle. The anoxic phase was introduced at the end of day 73, upon the suspension of ATU addition for nitrification inhibition. The HRT and sludge retention time were 16 h and 18 days, respectively. Illumination was supplied by external Osram halogen lamps (two lamps of 40 W and one of 60 W), providing an intensity of 99 W/m2 on the reactor surface, which corresponds to 4.5 W/L. This light intensity was chosen to simulate the sun irradiance levels that occur during a summer day in Portugal [31]. For more information about reactor operation details, please see [14].
Mixed liquor samples were harvested from the SBR during 7 h of each reactor cycle (Figure S1 in Supplementary Materials), along the selected treatment cycles (13 samples per cycle) [14] and used for both at-line Raman spectra acquisition and offline quantification of TOC, VFAs, CO2, NH3, NO3, PO4, total P, PHAs, glycogen, TSSs and VSSs through reference analytical methods. Total P, TSSs and VSSs were only determined on samples collected at specific timepoints. Four SBR cycles were selected for this study, corresponding to the SBR operation days 73 (cycle A; samples 1–13); 79 (cycle B; samples 14–26); 85 (cycle C; samples 27–39); and 101 (cycle D; samples 40–52). Specifically, the duration of the anaerobic/aerobic/anoxic phases were 3 h/4 h/0 h on cycle A, 1.5 h/2.5 h/3 h on cycles B and C, and 1.5 h/3.5 h/2 h on cycle D. The quantification of all parameters was performed in the four selected cycles, except for TOC, which was only measured on cycle A.

2.2. Reference Analytical Methods

The reference measurements were carried out on the same samples used for the Raman spectral acquisition. PO4, NH3, NO3 and nitrite (NO2) concentrations were determined by colorimetric methods implemented in a flow segmented analyzer (Skalar 5100, Skalar Analytical, Breda, The Netherlands). For the total P content, an acidic digestion of a mixed liquor sample was performed with 0.3 M H2SO4 and 400 mg of K2S2O8 and analyzed using the flow segmented analyzer. Acetate and propionate (VFA) were determined by high-performance liquid chromatography (HPLC), using a VWR Hitachi Chromaster with a Biorad Aminex HPX-87H 300 7.8 MM column and a DAD detector (0.01 N sulfuric acid was used as eluent with an elution rate of 0.5 mL/min). The total carbohydrates hydrolysable to glucose (i.e., bacterial glycogen and microalgae starch) were determined through an acidic digestion of lyophilized biomass [32]. PHAs were determined by GC according to the method described by Lanham et al. [33], using a Bruker 430-GC gas chromatograph equipped with an FID detector and a Restek column (60 m, 0.53 mm internal diameter, 1 µM df, crossbond). TSSs and VSSs were calculated according to APHA/AWWA/WEF standard methods [34]. Aqueous carbon dioxide was measured with a CO2 Mettler Toledo sensor and the concentrations were corrected considering the pH of the reactor, taking into account the equations of CO2 equilibrium in water and their respective constants according to Henry’s Law (K = 0.0017 M; Ka1 = 4.47 × 10⁻⁷ M; Ka2 = 4.69 × 10⁻¹¹ M) [35,36].

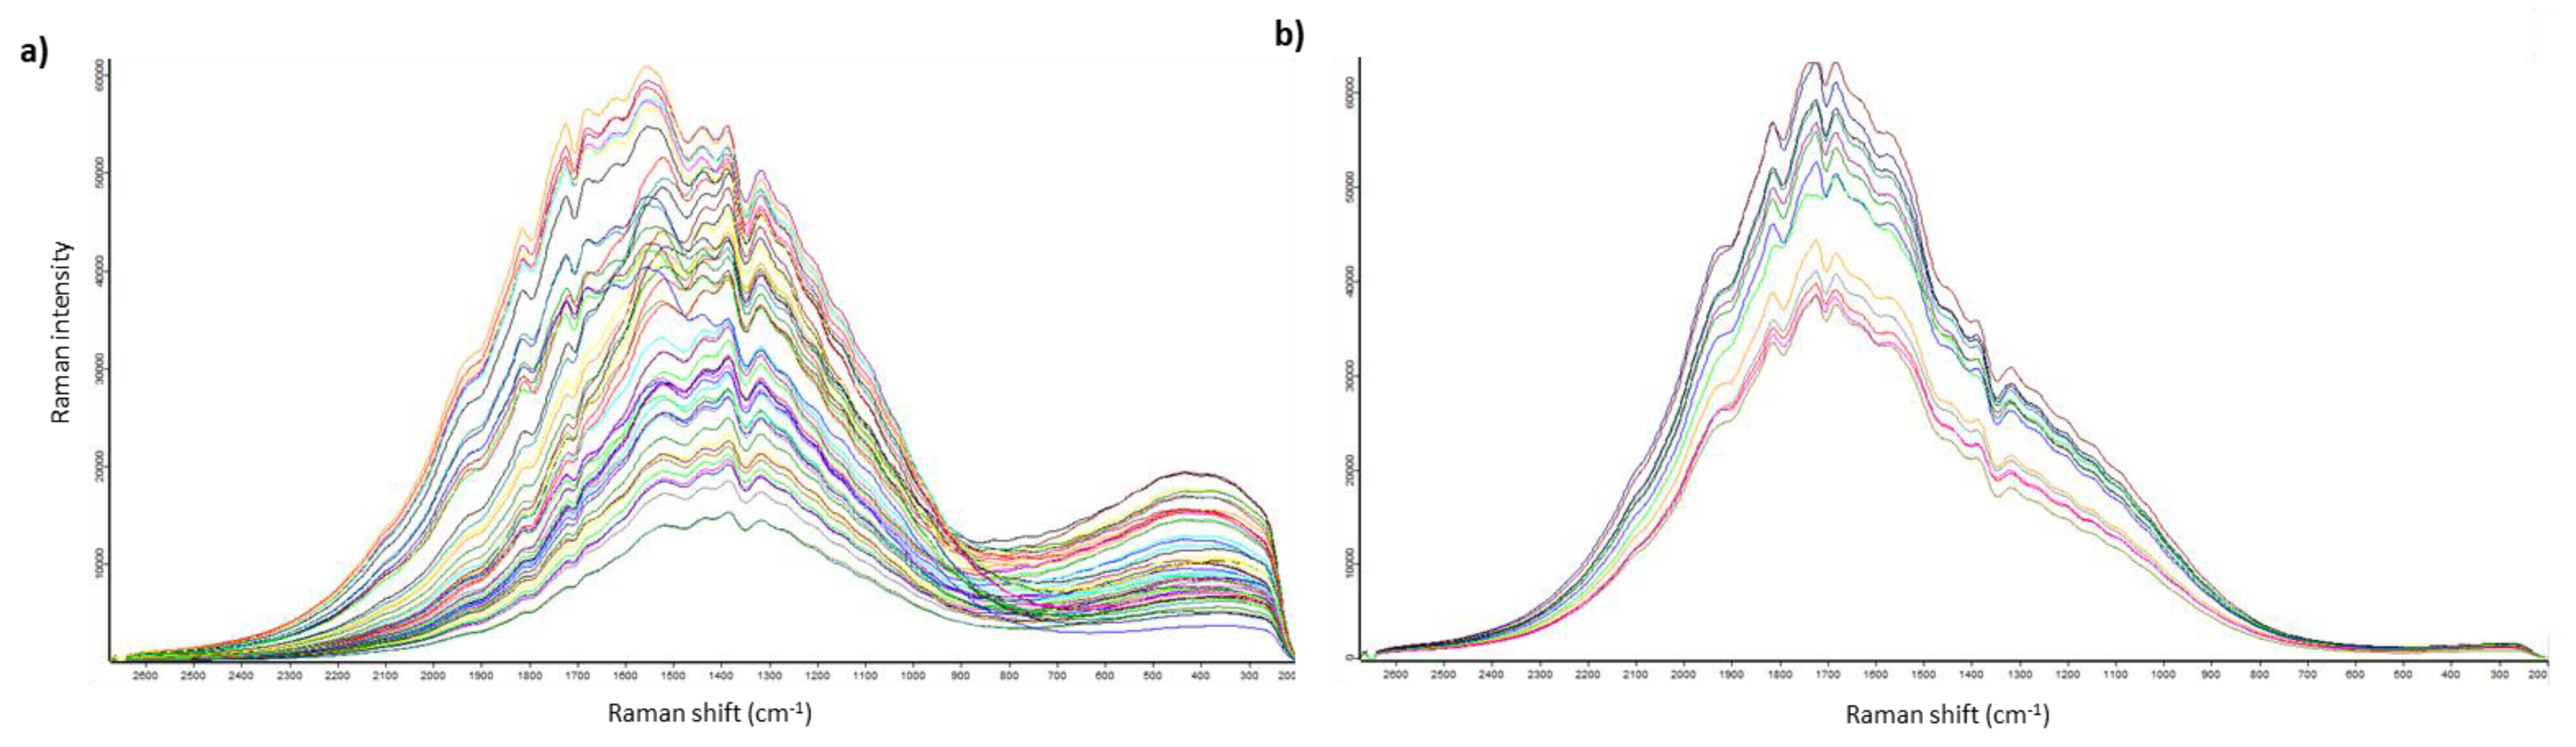
2.3. Raman Spectroscopic Method

Raman spectra of 2 mL mixed liquor samples were directly acquired after collection and without pre-treatment using a fiber coupled Raman probe (RPB Raman probe, InPhotonics) routed to a modular spectrometer (Ocean Optics QE65 Pro), and an 785 nm excitation laser (RGBLase LLc, Fremont, CA, USA) with 500 mW output. The Raman probe used was a non-immersible anodized aluminum probe with a stainless steel tip and focused light with a working distance of 7.5 mm. Thermo-electric cooling was applied in the spectrometer with a detector set point of −10 °C. Each spectrum was obtained in the Raman shift range from 2677.68 to −62.34 cm−1, with a 3.69 cm−1/pixel linear dispersion, corresponding to 1044 data points. Raman spectroscopy analysis was directly performed at-line on the mixed liquor samples, without any pre-treatment, in order to mimic online measurements. One scan was performed for each sample. A 5-s integration time was applied during spectral acquisitions on cycles A, B and C, and an integration time of 200 ms was used on samples from cycle D to avoid signal oversaturation. The acquired spectra correspond to the first basic measurements in a lab-scale photo-BNR. In real systems, overlaying fluorescence is an expected interference and this aspect will be focused on a future work.

2.4. Chemometric Analysis

PLS calibration models were developed based on Raman spectra of mixed liquor samples (Raman spectroscopic method) and on respective standard measurements of the selected parameters (reference analytical method). Commercial OPUS Quant2 software, version 8.2.28 (Bruker Optik GmbH, Leipzig, Germany), was used for spectral data pre-processing and a chemometric PLS calibration model development for each selected parameter.
Raman spectral pre-processing is crucial to remove undesired systematic variations in the spectral data that are unrelated to the analytical information, consequently degrading the predictive ability of a calibration model. To extract the spectral information related to each one of the parameters considered, the corresponding PLS calibration models were optimized in terms of spectral range, pre-processing method and the number of factors or latent variables (LVs) employed, a maximum of 10 LVs being considered.
The optimization of calibration models was performed using the OPUS Quant2 optimization tool, which evaluates the combination of different data pre-processing strategies with various spectral ranges, resulting in more than 1000 tested combinations [37]. Specifically, a Raman shift region defined by the user is divided into 10 equal subregions and the best combination of subregions is iteratively searched by the optimization tool. Mean-centering was applied as the default in every pre-processing strategy, in addition to the eleven default pre-processing strategies, which include no further spectral data pre-processing, constant offset elimination, straight line subtraction (SLS), vector normalization (standard normal variate; SNV), minimum–maximum (Min–Max) normalization, multiplicative scatter correction (MSC), first derivative (1st Der) and second derivatives (17 smoothing points used as default), as well as the combined methods 1st Der + SLS, 1st Der + SNV and 1st Der + MSC.
A full cross-validation (leave-one-out) procedure was adopted to determine the optimal number of LVs, based on the minimum value obtained for the root mean square error of cross-validation (RMSECV). The prediction performance and accuracy of the PLS models were evaluated based on the coefficient of determination of cross-validation (R2CV), the RMSECV and the residual prediction deviation of cross-validation (RPDCV). The RPD value indicates specifically whether a PLS model has insufficient prediction quality (RPD < 2.5) or whether it can be used as a rough screening method (2.5 < RDP < 3), as a good screening method (3 < RPD < 5), as a quality control method (5 < RPD < 8) or as an excellent method for analytical tasks (RPD > 8) [38]. Bias was also considered, corresponding to the systematic averaged deviation between the predicted and the reference values. Overall, robust, reliable, and unbiased calibration models are characterized by combining low values of RMSECV, high R2CV and RPDCV, a bias value close to zero, as well as a low number of LVs in order to avoid overfitting the model. Depending on the studied parameter, some samples were excluded from the calibration set during PLS model development, either in the case of no detectable amounts of the analyte in a sample (null concentration determined by the reference method) or when the associated measurement was considered an outlier based on the Mahalanobis distance. The spectra of samples containing null concentration of a parameter were not included in the PLS model in order to avoid an imbalanced calibration model focused on the concentration region around zero, instead of the concentration range of interest for each parameter. Since NO2 was not detectable in any of the analyzed samples, PLS models were not developed for this parameter.

3. Results and Discussion

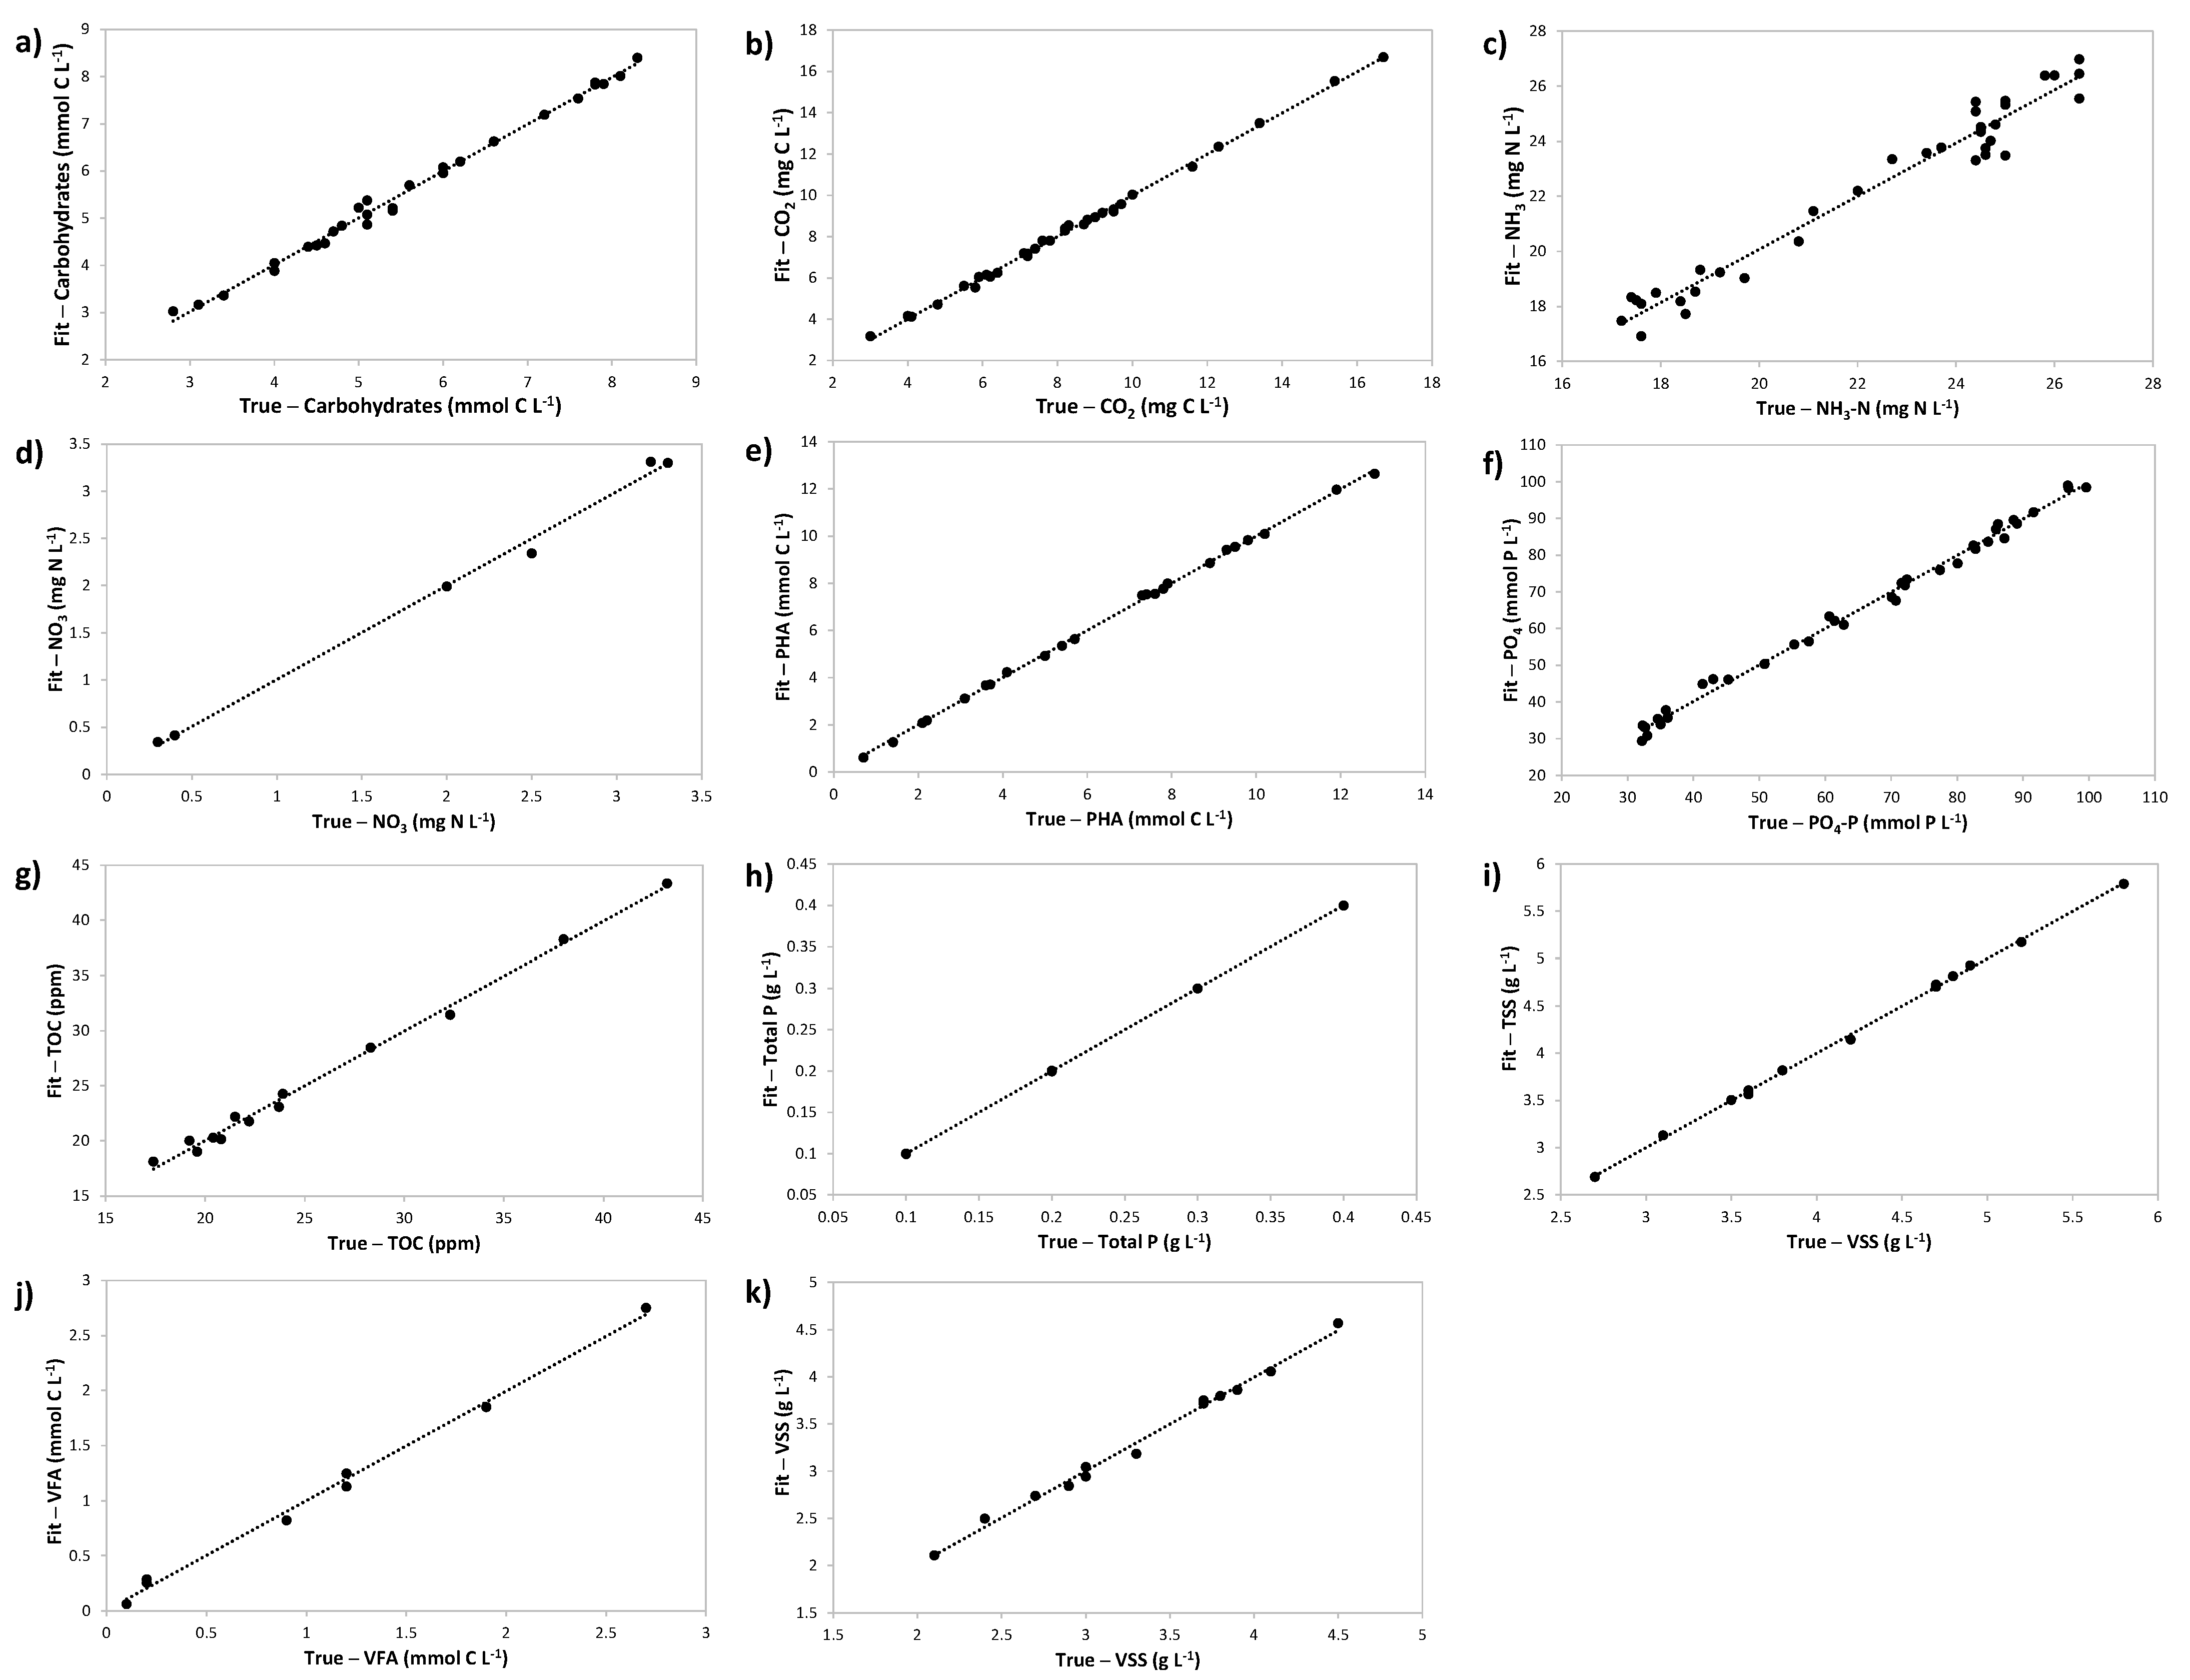
3.1. Development of PLS Calibration Models

To study the possibility of using Raman spectroscopy as a monitoring tool in a photo-BNR wastewater treatment process, Raman spectra were acquired from mixed liquor samples harvested along four selected SBR cycles (13 samples/cycle), as described in Section 2.1. Although each spectrum was obtained in the Raman shift range from 2677.68 to −62.34 cm−1, the region below 200 cm−1 corresponded to spectral noise, not being considered in the development of PLS models. The most intense peaks in the Raman spectra were observed within the range of 2000–1000 cm−1, as observed in the raw Raman spectra of all samples used in this study (Figure 1). Nevertheless, it was difficult to make direct peak attributions through visual inspection due to overlapping vibrational modes of different constituents in such complex samples, confirming the need for multivariate analysis methods such as PLS regression.
To extract relevant spectral information, PLS model optimization was carried out by testing different spectra pre-processing strategies in combination with various spectral regions using the OPUS software, as described in Section 2.4. The proper selection of spectral ranges is essential to avoid that bands of interfering components are accounted for by the PLS algorithm, consequently deteriorating the quality of the model. The main spectral truncations used as input for this optimization process included the total spectral range without the noise region (2677.68–200 cm−1) and two spectral truncations covering the most peak-concentrated areas of the spectra (2000–200 cm−1 and 2000–1000 cm−1). In addition, aiming for a more refined search of relevant spectral data, different spectral regions were considered for each parameter, according to Raman shift attributions described in the literature [39]. Specifically, distinct regions within the Raman shift range 1200–600 cm−1 were considered in the development of models for PO4 and poly-P for comprising P–O–P and PO2 stretching vibrations [25,26,27,28,39,40,41], whereas the 1450–1200 cm−1 range was tested for modelling CO2 [42]. Similarly, the region 1600–1350 cm−1 was tested for NH3 models owing to the N-H in plane deformation reported within this range [39], while the 1100–1000 cm−1 range was tested for NO3 models due to symmetric N–O stretching vibrations [18]. Moreover, the regions 1800–400 cm−1 and 1200–800 cm−1 were studied during the construction of PLS models for VFA due to characteristic C–C, C=O, C–H, CH2 and CH3 bands [24,25,27,43,44], and the regions 1800–1700 cm−1 + 1000–800 cm−1 + 500–400 cm−1 were specifically tested in PHAs modelling for comprising previously associated Raman shifts [24,26,43,44,45]. Finally, the Raman shifts 500–450 cm−1 + 1200–800 cm−1 were used to build calibration models for carbohydrates owing to their specific association with glycogen [24,25,39].

3.2. Evaluation of PLS Calibration Models

The models developed for each parameter were evaluated mostly based on the RMSECV and R2CV, while still considering the calibration parameters, i.e., the root mean square error of calibration (RMSEC) and the coefficient of determination of calibration (R2Cal). Table 1 presents the optimized pre-processing strategy, the spectral region and number of LVs used in the final PLS models selected for each studied parameter, along with the respective calibration and cross-validation statistical results. According to the pre-processing information presented in Table 1, the optimized pre-processed Raman spectra of the calibration samples used for the development of each PLS model are represented in Figures S2–S12 in Supplementary Materials. These calibration models are graphically represented in Figure 2, which depicts the regression line that correlates the analytically measured values of each calibration sample with the corresponding values predicted by the calibration model. Overall, it was possible to establish a good relation between the Raman spectral data and the concentration of all the studied parameters. This was denoted by the very high R2Cal (>99.3%) and prediction deviation of calibration (RPDCal > 11.6), and by the relatively low RMSEC values registered for almost all parameters (Table 1), except for NH3, which presented slightly less favorable calibration results (R2Cal = 96.2%; RPDCal = 5.2). These statistical results reflect the data represented in Figure 2, where the calibration points fit the regression line for each parameter very well, with more scattered data points around the regression line being exceptionally observed in the NH3 model.
Regarding the prediction performance of these calibration models, the excellent statistical results (R2CV > 90.0%; RPDCV > 3.2) obtained for TOC, VFAs, CO2, NO3, Total P, PHAs, TSSs and VSSs (Table 1) indicate that these parameters can be quantified with good quality through the respective Raman-based PLS models. On the other hand, the models developed for the prediction of PO4, NH3 and carbohydrates did not perform as well, according to their lower cross-validation quality parameters, i.e., R2 < 90% and RPDCV < 3.0. Overall, the RMSECV values are higher than the corresponding RMSEC, but the determined bias values were close to zero for all parameters, except for PO4 (Bias = 0.364; Table 1). The cross-validation outcome, which represents the performance of each PLS model to predict the concentrations of the respective parameter, is graphically illustrated in Figure 3, where the reference analytical values measured for each sample are plotted together with the corresponding values predicted by a full cross-validation (leave-one-out) procedure. In addition, Figure 3 allows to observe each parameter’s profile and the trend of predicted values along the SBR cycles. Overall, the analytical data for each parameter (Figure 3) followed the expected profile along the photo-BNR reactor cycles [14], i.e., the decrease in VFA and carbohydrates concentration values, in parallel with the increase in PHAs and PO4 concentrations along the anaerobic phase; followed by the decrease in NH3, PO4 and PHAs concentrations, along with the increase in NO3 concentration (nitrification) and poly-P and glycogen contents in the subsequent aerobic phase.
The parameter predictions based on the Raman spectra in Figure 2 and Figure 3 correspond to single measurements and there is only one parameter prediction for each spectrum. Repetitions of spectra acquisition were not performed since the biological reactions continued to occur in each sample after collection from the bioreactor. Thus, variations were expected to occur between those repetitions over a short period of time. However, the continuous monitoring during a long period allows the generation of continuous data and reveals the reproducibility of the monitored system.
Despite the procedures to minimize the noise in the calibration data set (simple pre-processing, spectral region selection and outlier removal), for some parameters, the low number of samples available and the low diversity of analytical values might have contributed to PLS model overfitting. In order to minimize this effect, a full cross-validation procedure was used for PLS model development. However, an external validation using an independent test set was required to evaluate the degree of overfitting of the developed PLS models by comparing the performance of the test set with that of the calibration set.

3.3. Nitrate (NO3)

NO3 was not detected on cycles A, B and C, because denitrification was only occurring on cycle D (Figure 3d), leading to a very small number of calibration samples available for developing the Raman-based PLS model to predict NO3 concentrations. Nevertheless, the reference values were broadly spanned through the investigated concentration range (0.3–3.3 mgN L−1; Figure 2d), allowing to obtain predictions of NO3 concentration with high accuracy (RMSECV = 97.7% and RPDCV = 6.7) simply requiring three LVs and the mean centering of the spectral data (no additional pre-processing needed) in the 1080.4–1069.4 cm−1 range (Table 1). In fact, according to the UV resonance Raman spectra of nitrate solutions, symmetric N−O stretching vibrations were reported to produce strong bands at 1044 cm−1 for NO3 [18]. The possibility of implementing Raman-based real-time monitoring of NO3 in a photo-BNR reactor would contribute to control denitrification efficiency, by adapting the length of the anoxic phase, for example, and consequently, guaranteeing that no NO3 is present when organic carbon is fed. The simultaneous presence of NO3 and organic carbon promotes the growth of heterotrophic denitrifying organisms, which compete for carbon with PAOs and lead to photo-BNR failure over the time [2,46].

3.4. Ammonia (NH3)

The best model obtained for monitoring NH3 concentration involved eight LVs and used the 1st Der + MSC as the pre-processing method in three spectral regions (Table 1), one of which (1439.2–1189.0 cm−1) comprising Raman shifts previously attributed to N–H in plane deformation (1400 and 1425 cm−1), and part of a band associated with NH3 (1550–1428 cm−1) [39]. Despite the promising calibration parameters (R2Cal = 96.2% and RMSEC = 0.72 mgN L−1), the low R2CV and RDPCV values of 65.5% and 1.7, respectively, and the substantial RMSECV (1.89 mgN L−1) obtained imply that this model has a poor prediction capacity, being unable to extract the relevant information from the spectral data. This is evidenced by the scattering of data points around the regression line (Figure 2c) and the discrepancy between the measured and predicted NH3 concentration values for some of the samples (Figure 3c). However, no further samples were excluded from the data set, as no clear outliers were detected. The significantly better calibration results in comparison to cross-validation suggest that a higher number of samples should be used for PLS model development in order to represent the whole NH3 concentration range under study. Accordingly, is it possible that the prediction accuracy of the PLS model could be improved by including more samples to equally cover the total NH3 concentration range. In fact, real-time knowledge on the NH3 concentration in a photo-BNR reactor would allow the assessment of its nutrient removal capacity and the adaptation of the operational conditions when the treatment efficiency would not meet the discharge requirements.

3.5. Phosphate (PO4) and Total Phosphorus (Total P)

Regarding PO4, PLS model optimization led to the selection of a spectral region comprising a Raman shift specific for the ν1 vibration domain of the PO4 group, i.e., 960 cm−1 [40]. Similarly to the model developed for NH3, the cross-validation results obtained for the PO4 model in the 32.2–99.6 mgP L−1 range (R2CV = 70.0%; RMSEC = 12.10 mgP L−1; Figure 3f) were significantly worse than the calibration statistics (R2Cal = 99.4%; RMSEC = 1.95 mgP L−1). Accordingly, the RPDCV of 1.7 confirmed the insufficient prediction quality of the model. In contrast, the PLS model developed for estimating total P concentrations presented an excellent prediction performance (Figure 3h), as evidenced by the cross-validation results, i.e., R2CV = 99.0% and RPDCV = 10.3 (Table 1). In fact, the RMSEC and RMSECV values (0.0 and 0.01 g L−1) were very similar, denoting a good calibration model for the P concentration range from 0.1 to 0.4 g L−1 (as illustrated in Figure 3h). The spectral data pre-processing involved the application of 1st Der + MSC in the regions 1179.8–1168.7 cm−1 + 1159.5–1139.3 cm−1, which is in accordance with the PO2 stretching vibrations band reported to occur around 1175–1168 cm−1 [24] and 1163–1130 [26] and used to quantify the intracellular poly-P content [24,25,26,27,38,40]. However, this model required nine LVs, which is a relatively high number of factors, eventually leading to the overfitting of data. Future work is needed to confirm the prediction capacity of this potentially relevant model, by performing external validation tests. Accurate real-time monitoring of total P would significantly improve the capacity to understand which is the main mechanism of P removal in the photo-BNR process, and thus evaluate the possibility of using the excess sludge as fertilizer, since high P amounts in the biomass indicate high accumulation as poly-P.

3.6. Total Carbohydrates and Polyhydroxyalkanoates (PHAs)

Most studies using Raman as a monitoring tool for PHAs production have focused on intracellular polymer content, composition and degree of crystallinity [43]. The most prominent contributions of PHB to a bacterial Raman spectrum were associated with a peak at around 1734 cm−1 [45]. Furthermore, studies using commercial copolymers of poly(3-hydroxybutyrate-co-3-hydroxyvalerate) (PHBV) identified specific Raman bands associated with 3-hydroxyvalerate (3HV) [43] and quantified the molar fraction of 3HV in polyester solutions and molten polyester films based on specific Raman peaks [44]. Subsequently, Raman spectroscopy has been suggested as a potentially fast and efficient tool for the process control of PHB bioproduction through qualitative and quantitative in situ monitoring of intracellular PHB content in biomass, specifically in Cupriavidus necator H16 cultures [29].
In the context of wastewater treatment in a photo-BNR reactor, the online monitoring of intracellular polymers such as PHAs and glycogen (accounted for as part of the total carbohydrates), which are involved in the P removal process, is relevant to assess whether nutrient removal is limited by the low concentration of biopolymers and to optimize this process. The Raman region located at 1200–800 cm−1 has been reported to be mainly dominated by polysaccharide peaks, and the spectral region between 1288 and 987 cm−1 was previously used to develop a Raman-based PLS model for carbohydrates in powdered milk samples [47]. Accordingly, the optimization of the PLS models for total carbohydrates in the present study led to the selection of spectral regions within the 1200–800 cm−1 range (Table 1), which include some of the peaks characteristic of glycogen vibrations (484–478, 860–840, 944–937, 1087–1048, 1131, 1383–1333, and 1460 cm−1) [24].
The glycogen skeletal deformation band (484–478 cm−1) was not accounted for in the carbohydrates model, probably due to overlapping peak positions between PHAs and glycogen in this region [41]. In fact, the optimized PLS model for PHAs included the 484–478 cm−1 band within the selected spectral regions, i.e., 491.6–464.0 cm−1 + 850.4–798.9 cm−1 + 1001.3–898.2 cm−1 (Table 1). The selection of these spectral regions is in accordance with two of the most prominent bands reported in the Raman spectra of PHB and PHBV: 433 and 860–840 cm−1, assigned to δ(C–C) skeletal deformations and ν(C–C) skeletal stretches, respectively [24].
Despite the excellent calibration statistical results obtained in both models (R2Cal and RMSEC of 99.4% and 0.15 mmolC L−1 for total carbohydrates, and 99.9% and 0.12 mmolC L−1 for PHAs, respectively), good cross-validation performance was only reached in the PHAs model (R2CV = 95.9%, RPDCV = 5.0; Figure 3e), while only satisfactory results were obtained in the model developed for total carbohydrates (R2CV = 88.2%, RPDCV = 2.9; Figure 3a). Overall, the predicted values follow the measured values along the SBR treatment cycles, as represented in Figure 3a,e for total carbohydrates and PHAs, respectively. Nevertheless, according to the respective RPD values, the PLS model constructed for PHAs prediction could be used as a good screening method within the 0.7–12.8 mmolC L−1 concentration range, while the one for total carbohydrates can only be considered as a rough screening method for concentration values within 2.8–8.3 mmolC L−1 [38]. In light of the labor-intensive, complex and time-consuming protocols involved in the analytical methods used to measure PHAs and total carbohydrates (involving biomass digestions, GC and HPLC analysis, respectively), the application of Raman spectroscopy as a fast, direct and not destructive monitoring tool would enable timely decisions regarding process control and optimization.

3.7. Volatile Fatty Acids (VFA) and Total Organic Carbon (TOC)

Modelling VFA concentration was based on the spectral regions 944.2–694.0 cm−1 and 1934.2–1685.8 cm−1 (Table 1) which include v(C–C) skeletal stretches (860–840 cm−1) [43] and c(C=O) stretching vibrations (1725–1750 cm−1) [24,43,44], respectively. By applying mean centering alone as pre-processing, this model yielded very good cross-validation results in the VFA concentration range from 0.1 to 2.7 mmolC L−1 (RMSECV = 0.18 mmolC L−1, R2CV = 95.4% and RPDCV = 4.7; Figure 3j). In contrast to the time-consuming analytical method used for assessing VFA concentration (HPLC), Raman spectroscopy has the potential to deliver much faster information about the reactor performance.
Regarding the final model selected for predicting TOC concentration, the spectral regions used in the model span over a large range of the Raman spectrum (from 1500 to 600 cm−1; Table 1). In fact, important regions for the vibrations associated with organic matter are expected to involve a wide spectral range, including aliphatic C–H stretching, vibrations related to carboxylic groups, aromatic groups, carboxylate groups and protein amide [37]. Although TOC measurements were only available for one of the studied cycles, a good correlation between the reference analytical data and the pre-processed (constant offset elimination) selected Raman spectral regions could be obtained by using five LVs, as indicated by the calibration results (R2Cal = 99.5%, RMSEC = 0.76 ppm, RPDCal = 13.6; Table 1). Moreover, the cross-validation was successful (R2CV = 96.7%; RPDCV = 5.5), the reference TOC profile within the 17.4–43.2 ppm range being very well predicted by the Raman-based PLS model (Figure 3g).
Real-time information on the concentration of VFAs and TOC can help in preventing the presence of organic carbon during the light aerobic period of the SBR cycles. The presence of organic carbon during the light aerobic period promotes the growth of heterotrophic phototrophic purple bacteria and ordinary aerobic heterotrophs, which consequently, reduce the efficiency of the photo-BNR, since PAOs accumulate more P [7].

3.8. Total Suspended Solids (TSSs) and Volatile Suspended Solids (VSSs)

As expected, the spectral regions used by the PLS models for estimating TSSs and VSSs are very similar, covering related regions within the 2000–1000 cm−1 range (Table 1). Despite the application of different normalization methods as pre-processing (SNV for TSSs versus Min–Max normalization for VSSs), both models were constructed based on five LVs and the statistical calibration and cross-validation results were comparable, so the TSS performs slightly better (RMSECV and RPDCV of 97.5% and 6.3 for TSS versus 93.9% and 4.1 for VSSs, Figure 3i,k, respectively).

3.9. Carbon Dioxide (CO2)

The CO2 concentration model used two short regions of Raman shifts (1450.3–1398.8 cm−1 + 1374.8–1297.6 cm−1), which comprise two peaks attributed to vibrational modes of CO2, specifically 1388  cm−1 and 1285  cm−1 [42]. The spectral pre-processing involved MSC, and cross-validation revealed a good prediction accuracy within a large CO2 concentration range (3.0–16.7 g L−1), as indicated by the cross-validation results (R2CV = 90.0%, RMSECV of 0.96 g L−1; RPDCV = 3.2; Table 1). In fact, Figure 3b shows excellent correlations between Raman spectroscopy and reference analysis, highlighting Raman spectroscopy as a potentially useful tool for providing real-time information on the CO2 concentration. Real-time knowledge on the CO2 level in a photo-BNR reactor is essential for understanding whether photosynthesis, and thus oxygen production by microalgae, is limited by inorganic carbon availability and when it happens, whether it increases the CO2 feed to the system. Compared to regular CO2 sensors, this can be advantageous because no further correction, based on pH, is necessary to know the real CO2 concentration, reducing the delay time and improving the overall nutrient removal efficiency of the photo-BNR.

4. Conclusions

Raman spectra were acquired at-line during the operation of a lab-scale photo-BNR reactor and PLS regression was performed to develop calibration models for the prediction of key monitoring parameters, essential for process control and optimization. This study showed that Raman spectroscopy, allied with PLS, is a very promising tool for monitoring the concentrations of TOC, VFAs, CO2, NO3, total P, PHAs, TSSs and VSSs in a photo-BNR reactor in real-time. This was shown by the high R2CV and RPDcv values obtained for these parameters: 96.7% and 5.5 for TOC, 95.4% and 4.7 for VFAs, 90.0% and 3.2 for CO2, 97.7% and 6.7 for NO3, 99.0% and 10.3 for Total P, 95.9% and 5.0 for PHAs, 97.5% and 6.3 for TSSs, 93.9% and 4.1 for VSSs, respectively. Regarding NH3, PO4 and total carbohydrates, the prediction accuracy of the respective Raman-based PLS models (R2CV and RPDcv of 65.5% and 1.7 for NH3, 70.0% and 1.8 for PO4; 88.2% and 2.9 for total carbohydrates, respectively) could possibly be improved by including more samples in the calibration set.
The performance of the PLS calibration models was evaluated by a full cross-validation procedure and can be further assessed by an external validation using additional samples that were not included in model development (external test set). After external validation, the models can then be used for predicting the concentration of the different parameters simply based on the Raman spectral data, minimizing the need for performing extensive off-line analyses. Although the external validation of the developed PLS calibration models was not performed due to the lack of an external test set, this study presents very promising results for the real-time monitoring of a photo-BNR reactor using Raman spectroscopy, being the first to report this specific application. Overall, the application of Raman-based monitoring in a photo-BNR reactor offers a fast, simple, non-destructive, eco-friendly and holistic alternative to laborious standard analytical and expensive methods, enabling the quantification of various parameters within a single Raman measurement. Once robust and reliable PLS calibration models have been developed, Raman spectroscopy can be used online to provide real-time process information, facilitating decision-making during wastewater treatment. Nevertheless, regular reference analytical data will always be needed in order to guarantee the long-term validity of PLS models.

Supplementary Materials

The following figures are available online at https://www.mdpi.com/article/10.3390/app11146600/s1, Figure S1: Photo-BNR daily cycle of day 85; Figures S2–S12: Pre-processed Raman spectra of calibration samples used for the development of the PLS model for total carbohydrates, CO2, NH3, NO3, PHAs, PO4, TOC, total P, TSS, VFAs, and VSSs, respectively.

Author Contributions

Conceptualization, M.A.M.R. and N.D.L.; data curation, R.D.G.F. and V.C.F.C.; formal analysis, R.D.G.F. and V.C.F.C.; funding acquisition, M.A.M.R.; investigation, R.D.G.F. and V.C.F.C.; methodology, R.D.G.F. and N.D.L.; project administration, M.A.M.R. and N.D.L.; resources, J.C.F., M.A.M.R. and N.D.L.; supervision, M.A.M.R. and N.D.L.; validation, J.C.F., M.A.M.R. and N.D.L.; visualization, R.D.G.F.; writing—original draft, R.D.G.F. and V.C.F.C.; writing—review and editing, J.C.F., M.A.M.R. and N.D.L. All authors have read and agreed to the published version of the manuscript.

Funding

This research was funded by Fundação para a Ciência e a Tecnologia—FCT, Portugal, grant number UIDP/04378/2020 and UIDB/04378/2020.

Data Availability Statement

The data presented in this study are contained within the article and supplementary materials and are available on request from the corresponding author.

Acknowledgments

This work was supported by the Applied Molecular Biosciences Unit—UCIBIO which is financed by national funds from FCT (UIDP/04378/2020 and UIDB/04378/2020). Virgínia Carvalho acknowledges the financial support of FCT through the Ph.D. grant PD/BD/114574/2016.

Conflicts of Interest

The authors declare no conflict of interest. The funders had no role in the design of the study; in the collection, analyses, or interpretation of data; in the writing of the manuscript, or in the decision to publish the results.

References

  1. Taziki, M.; Ahmadzadeh, H.; Murry, M.A.; Lyon, S.R. Nitrate and Nitrite Removal from Wastewater using Algae. Curr. Biotechnol. 2016, 4, 426–440. [Google Scholar] [CrossRef]
  2. Izadi, P.; Eldyasti, A. Design, operation and technology configurations for enhanced biological phosphorus removal (EBPR) process: A review. Rev. Environ. Sci. Bio/Technol. 2020, 19, 561–593. [Google Scholar] [CrossRef]
  3. Mohsenpour, S.F.; Hennige, S.; Willoughby, N.; Adeloye, A.; Gutierrez, T. Integrating micro-algae into wastewater treatment: A review. Sci. Total Environ. 2021, 752, 142168. [Google Scholar] [CrossRef] [PubMed]
  4. Rosso, D.; Larson, L.E.; Stenstrom, M. Aeration of large-scale municipal wastewater treatment plants: State of the art. Water Sci. Technol. 2008, 57, 973–978. [Google Scholar] [CrossRef] [PubMed]
  5. Luo, L.; Dzakpasu, M.; Yang, B.; Zhang, W.; Yang, Y.; Wang, X.C. A novel index of total oxygen demand for the comprehensive evaluation of energy consumption for urban wastewater treatment. Appl. Energy 2019, 236, 253–261. [Google Scholar] [CrossRef]
  6. Capson-Tojo, G.; Batstone, D.J.; Grassino, M.; Vlaeminck, S.E.; Puyol, D.; Verstraete, W.; Kleerebezem, R.; Oehmen, A.; Ghimire, A.; Pikaar, I.; et al. Purple phototrophic bacteria for resource recovery: Challenges and opportunities. Biotechnol. Adv. 2020, 43, 107567. [Google Scholar] [CrossRef] [PubMed]
  7. Hülsen, T.; Batstone, D.; Keller, J. Phototrophic bacteria for nutrient recovery from domestic wastewater. Water Res. 2014, 50, 18–26. [Google Scholar] [CrossRef] [PubMed]
  8. Winkler, M.K.; Straka, L. New directions in biological nitrogen removal and recovery from wastewater. Curr. Opin. Biotechnol. 2019, 57, 50–55. [Google Scholar] [CrossRef] [PubMed]
  9. Muñoz, R.; Guieysse, B. Algal–bacterial processes for the treatment of hazardous contaminants: A review. Water Res. 2006, 40, 2799–2815. [Google Scholar] [CrossRef]
  10. Toledo-Cervantes, A.; Posadas, E.; Bertol, I.; Turiel, S.; Alcoceba, A.; Muñoz, R. Assessing the influence of the hydraulic retention time and carbon/nitrogen ratio on urban wastewater treatment in a new anoxic-aerobic algal-bacterial photobioreactor configuration. Algal Res. 2019, 44, 101672. [Google Scholar] [CrossRef]
  11. Liu, L.; Fan, H.; Liu, Y.; Liu, C.; Huang, X. Development of algae-bacteria granular consortia in photo-sequencing batch reactor. Bioresour. Technol. 2017, 232, 64–71. [Google Scholar] [CrossRef]
  12. Muñoz, R.; Jacinto, M.; Guieysse, B.; Mattiasson, B. Combined carbon and nitrogen removal from acetonitrile using algal-bacterial bioreactors. Appl. Microbiol. Biotechnol. 2005, 67, 699–707. [Google Scholar] [CrossRef]
  13. Carvalho, V.; Freitas, E.; Silva, P.; Fradinho, J.; Reis, M.A.; Oehmen, A. The impact of operational strategies on the performance of a photo-EBPR system. Water Res. 2018, 129, 190–198. [Google Scholar] [CrossRef]
  14. Carvalho, V.; Kessler, M.; Fradinho, J.; Oehmen, A.; Reis, M. Achieving nitrogen and phosphorus removal at low C/N ratios without aeration through a novel phototrophic process. Sci. Total Environ. 2021, 793, 148501. [Google Scholar] [CrossRef]
  15. Lourenço, N.D.; Lopes, J.; Almeida, C.F.; Sarraguça, M.; Pinheiro, H. Bioreactor monitoring with spectroscopy and chemometrics: A review. Anal. Bioanal. Chem. 2012, 404, 1211–1237. [Google Scholar] [CrossRef]
  16. Veloso, A.C.A.; Ferreira, E.C. Online Analysis for Industrial Bioprocesses. Curr. Dev. Biotechnol. Bioeng. 2017, 23, 679–704. [Google Scholar] [CrossRef] [Green Version]
  17. Barra, I.; Haefele, S.M.; Sakrabani, R.; Kebede, F. Soil spectroscopy with the use of chemometrics, machine learning and pre-processing techniques in soil diagnosis: Recent advances—A review. TrAC Trends Anal. Chem. 2021, 135, 116166. [Google Scholar] [CrossRef]
  18. Ianoul, A.; Coleman, T.; Asher, S.A. UV Resonance Raman Spectroscopic Detection of Nitrate and Nitrite in Wastewater Treatment Processes. Anal. Chem. 2002, 74, 1458–1461. [Google Scholar] [CrossRef] [PubMed]
  19. Paudel, A.; Raijada, D.; Rantanen, J. Raman spectroscopy in pharmaceutical product design. Adv. Drug Deliv. Rev. 2015, 89, 3–20. [Google Scholar] [CrossRef] [PubMed] [Green Version]
  20. Kozma, B.; Hirsch, E.; Gergely, S.; Párta, L.; Pataki, H.; Salgó, A. On-line prediction of the glucose concentration of CHO cell cultivations by NIR and Raman spectroscopy: Comparative scalability test with a shake flask model system. J. Pharm. Biomed. Anal. 2017, 145, 346–355. [Google Scholar] [CrossRef] [PubMed]
  21. Claßen, J.; Aupert, F.; Reardon, K.F.; Solle, D.; Scheper, T. Spectroscopic sensors for in-line bioprocess monitoring in research and pharmaceutical industrial application. Anal. Bioanal. Chem. 2016, 409, 651–666. [Google Scholar] [CrossRef]
  22. Esmonde-White, K.A.; Cuellar, M.; Uerpmann, C.; Lenain, B.; Lewis, I.R. Raman spectroscopy as a process analytical technology for pharmaceutical manufacturing and bioprocessing. Anal. Bioanal. Chem. 2017, 409, 637–649. [Google Scholar] [CrossRef] [Green Version]
  23. Foladori, P.; Petrini, S.; Andreottola, G. How suspended solids concentration affects nitrification rate in microalgal-bacterial photobioreactors without external aeration. Heliyon 2020, 6, e03088. [Google Scholar] [CrossRef] [PubMed] [Green Version]
  24. Majed, N.; Gu, A.Z. Application of Raman Microscopy for Simultaneous and Quantitative Evaluation of Multiple Intracellular Polymers Dynamics Functionally Relevant to Enhanced Biological Phosphorus Removal Processes. Environ. Sci. Technol. 2010, 44, 8601–8608. [Google Scholar] [CrossRef] [PubMed]
  25. Li, Y.; Cope, H.A.; Rahman, S.M.; Li, G.; Nielsen, P.H.; Elfick, A.P.D.; Gu, A.Z. Toward Better Understanding of EBPR Systems via Linking Raman-Based Phenotypic Profiling with Phylogenetic Diversity. Environ. Sci. Technol. 2018, 52, 8596–8606. [Google Scholar] [CrossRef] [PubMed]
  26. Guo, G.; Wu, D.; Ekama, G.A.; Ivleva, N.P.; Hao, X.; Dai, J.; Cui, Y.; Biswal, B.K.; Chen, G. Investigation of multiple polymers in a denitrifying sulfur conversion-EBPR system: The structural dynamics and storage states. Water Res. 2019, 156, 179–187. [Google Scholar] [CrossRef]
  27. Fernando, E.; McIlroy, S.J.; Nierychlo, M.; Herbst, F.-A.; Petriglieri, F.; Schmid, M.C.; Wagner, M.; Nielsen, J.L.; Nielsen, P.H. Resolving the individual contribution of key microbial populations to enhanced biological phosphorus removal with Raman–FISH. ISME J. 2019, 13, 1933–1946. [Google Scholar] [CrossRef] [Green Version]
  28. Moudříková, Š.; Mojzeš, P.; Zachleder, V.; Pfaff, C.; Behrendt, D.; Nedbal, L. Raman and fluorescence microscopy sensing energy-transducing and energy-storing structures in microalgae. Algal Res. 2016, 16, 224–232. [Google Scholar] [CrossRef]
  29. Samek, O.; Obruča, S.; Šiler, M.; Sedláček, P.; Benešová, P.; Kučera, D.; Márova, I.; Ježek, J.; Bernatová, S.; Zemánek, P. Quantitative Raman Spectroscopy Analysis of Polyhydroxyalkanoates Produced by Cupriavidus necator H16. Sensors 2016, 16, 1808. [Google Scholar] [CrossRef] [Green Version]
  30. Carvalheira, M.; Oehmen, A.; Carvalho, G.; Reis, M.A. The effect of substrate competition on the metabolism of polyphosphate accumulating organisms (PAOs). Water Res. 2014, 64, 149–159. [Google Scholar] [CrossRef]
  31. Gschwind, B.; Ménard, L.; Albuisson, M.; Wald, L. Converting a successful research project into a sustainable service: The case of the SoDa Web service. Environ. Model. Softw. 2006, 21, 1555–1561. [Google Scholar] [CrossRef] [Green Version]
  32. Lanham, A.B.; Ricardo, A.R.; Coma, M.; Fradinho, J.; Carvalheira, M.; Oehmen, A.; Carvalho, G.; Reis, M.A. Optimisation of glycogen quantification in mixed microbial cultures. Bioresour. Technol. 2012, 118, 518–525. [Google Scholar] [CrossRef]
  33. Lanham, A.B.; Ricardo, A.R.; Albuquerque, M.G.; Pardelha, F.; Carvalheira, M.; Coma, M.; Fradinho, J.; Carvalho, G.; Oehmen, A.; Reis, M.A. Determination of the extraction kinetics for the quantification of polyhydroxyalkanoate monomers in mixed microbial systems. Process. Biochem. 2013, 48, 1626–1634. [Google Scholar] [CrossRef]
  34. American Public Health Association/American Water Works Association/Water Environment Federation (APHA/AWWA/WEF). Standard Methods for the Examination of Water and Wastewater, 21st ed.; APHA/AWWA/WEF: Washington, DC, USA, 2005; ISBN 0875532357. [Google Scholar]
  35. Dias, J.M.; Pardelha, F.; Eusébio, M.; Reis, M.A.; Oliveira, R. On-line monitoring of PHB production by mixed microbial cultures using respirometry, titrimetry and chemometric modelling. Process. Biochem. 2009, 44, 419–427. [Google Scholar] [CrossRef]
  36. Lueker, T.J.; Dickson, A.G.; Keeling, C.D. Ocean pCO2 calculated from dissolved inorganic carbon, alkalinity, and equations for K1 and K2: Validation based on laboratory measurements of CO2 in gas and seawater at equilibrium. Mar. Chem. 2000, 70, 105–119. [Google Scholar] [CrossRef]
  37. Ludwig, B.; Murugan, R.; Parama, V.R.R.; Vohland, M. Accuracy of Estimating Soil Properties with Mid-Infrared Spectroscopy: Implications of Different Chemometric Approaches and Software Packages Related to Calibration Sample Size. Soil Sci. Soc. Am. J. 2019, 83, 1542–1552. [Google Scholar] [CrossRef] [Green Version]
  38. Mendes, T.D.O.; Rodrigues, B.V.M.; Porto, B.L.S.; da Rocha, R.A.; de Oliveira, M.A.L.; de Castro, F.K.; Anjos, V.D.C.D.; Bell, M.J.V. Raman Spectroscopy as a fast tool for whey quantification in raw milk. Vib. Spectrosc. 2020, 111, 103150. [Google Scholar] [CrossRef]
  39. Movasaghi, Z.; Rehman, S.; Rehman, I.U. Raman Spectroscopy of Biological Tissues. Appl. Spectrosc. Rev. 2007, 42, 493–541. [Google Scholar] [CrossRef]
  40. Ma, H.; Xue, Y.; Zhang, Y.; Kobayashi, T.; Kubota, K.; Li, Y.-Y. Simultaneous nitrogen removal and phosphorus recovery using an anammox expanded reactor operated at 25 °C. Water Res. 2020, 172, 115510. [Google Scholar] [CrossRef]
  41. Majed, N.; Gu, A.Z. Phenotypic dynamics in polyphosphate and glycogen accumulating organisms in response to varying influent C/P ratios in EBPR systems. Sci. Total Environ. 2020, 743, 140603. [Google Scholar] [CrossRef]
  42. Kobayashi, T.; Yamamoto, J.; Hirajima, T.; Ishibashi, H.; Hirano, N.; Lai, Y.; Prikhod’Ko, V.S.; Arai, S. Conformity and precision of CO2 densimetry in CO2 inclusions: Microthermometry versus Raman microspectroscopic densimetry. J. Raman Spectrosc. 2012, 43, 1126–1133. [Google Scholar] [CrossRef]
  43. Jost, V.; Schwarz, M.; Langowski, H.-C. Investigation of the 3-hydroxyvalerate content and degree of crystallinity of P3HB-co-3HV cast films using Raman spectroscopy. Polymer 2017, 133, 160–170. [Google Scholar] [CrossRef]
  44. Izumi, C.; Temperini, M.L.A. FT-Raman investigation of biodegradable polymers: Poly(3-hydroxybutyrate) and poly(3-hydroxybutyrate-co-3-hydroxyvalerate). Vib. Spectrosc. 2010, 54, 127–132. [Google Scholar] [CrossRef]
  45. De Gelder, J.; Willemse-Erix, D.; Scholtes, M.J.; Sanchez, J.I.; Maquelin, K.; Vandenabeele, P.; De Boever, P.; Puppels, G.J.; Moens, L.; De Vos, P. Monitoring Poly(3-hydroxybutyrate) Production in Cupriavidus necator DSM 428 (H16) with Raman Spectroscopy. Anal. Chem. 2008, 80, 2155–2160. [Google Scholar] [CrossRef] [PubMed]
  46. Valverde Perez, B. Wastewater Resource Recovery via the Enhanced Biological Phosphorus Removal and Recovery (EBP2R) Process Coupled with Green Microalgae Cultivation. Ph.D. Thesis, Technical University of Denmark, DTU Environment, Lyngby, Denmark, 2015. [Google Scholar]
  47. Moros, J.; Garrigues, S.; de la Guardia, M. Evaluation of nutritional parameters in infant formulas and powdered milk by Raman spectroscopy. Anal. Chim. Acta 2007, 593, 30–38. [Google Scholar] [CrossRef] [PubMed]
Figure 1. Raw Raman spectra of mixed liquor samples harvested from the SBR on (a) cycles A, B and C (samples 1–39; 5 s integration time); and (b) cycle D (samples 40–52; 200 ms integration time).
Applsci 11 06600 g001
Figure 2. Representation of the Raman-PLS calibration models developed for (a) total carbohydrates; (b) carbon dioxide (CO2); (c) ammonia (NH3); (d) nitrate (NO3); (e) polyhydroxyalkanoates (PHAs); (f) phosphate (PO4); (g) total organic content (TOC); (h) total phosphorus (total P); (i) total suspended solids (TSSs); (j) volatile fatty acids (VFAs); and (k) volatile suspended solids (VSSs) along with the statistical calibration results.
Applsci 11 06600 g002
Figure 3. Representation of the prediction capabilities of the Raman-PLS models developed for (a) total carbohydrates; (b) carbon dioxide (CO2); (c) ammonia (NH3); (d) nitrate (NO3); (e) polyhydroxyalkanoates (PHAs); (f) phosphate (PO4); (g) total organic content (TOC); (h) total phosphorus (total P); (i) total suspended solids (TSSs); (j) volatile fatty acids (VFA); and (k) volatile suspended solids (VSSs). For each parameter and calibration sample, the analytical values measured by reference methods (▲) are represented along with the corresponding parameter values predicted by the respective cross-validation model (○). The pre-processing strategy, spectral regions, and number of latent variables used in the development of the PLS models are indicated in Table 1, for each studied parameter, along with the statistical cross-validation results. Vertical dashed lines separate the sample sets from each studied cycle, corresponding to the SBR operational days 73 (cycle A; samples 1–13); 79 (cycle B; samples 14–26); 85 (cycle C; samples 27–39); and 101 (cycle D; samples 40–52).
Applsci 11 06600 g003
Table 1. Raman-PLS models developed for each studied parameter, within the indicated concentration range: total carbohydrates, carbon dioxide (CO2), ammonia (NH3), nitrate (NO3), polyhydroxyalkanoates (PHAs), phosphate (PO4), total organic content (TOC), total phosphorus (total P), total suspended solids (TSSs), volatile fatty acids (VFAs), and volatile suspended solids (VSSs). For each parameter, the optimized pre-processing strategy, spectral regions, and number of latent variables (LVs) used in the selected model are indicated, along with the respective statistical results from the calibration (coefficient of determination of calibration, R2Cal; root mean square error of calibration, RMSEC; residual prediction deviation of calibration, RPDCal) and the full (leave-one-out) cross-validation (coefficient of determination of cross-validation, R2CV; root mean square error of cross-validation, RMSECV; residual prediction deviation of cross-validation, RPDCV; Bias) obtained during the prediction of the indicated parameters. The number of samples included in the calibration set (n) of each calibration model is indicated for each parameter.
CalibrationCross-Validation
ParameternRangeSpectral Regions (cm−1)Pre-Processing aLVR2Cal
(%)
RMSEC bRPDCalR2CV (%)RMSECV bRPDCVBias
Carbohydrates282.8–8.3 mmolC L−11200.0–1159.5
999.4–959.0
920.3–878.0
839.4–798.9
n.a.p.799.40.1512.588.20.532.9−0.012
CO2333.0–16.7
g L−1
1450.3–1398.8
1374.8–1297.6
MSC899.80.1621.990.00.963.20.063
NH33717.2–26.5 mgN L−12677.7–1685.8
1439.2–1189.0
944.2–199.0
1st Der + MSC896.20.725.265.51.891.7−0.018
NO360.3–3.3 mgN L−11080.4–1069.4n.a.p399.60.1414.997.70.186.7−0.028
PHA240.7–12.8 mmolC L−11001.3–898.2
850.4–798.9
491.6–464.0
1st Der + SNV999.90.1237.695.90.715.0−0.011
PO43632.2–99.6 mgP L−11030.7–940.6
670.1–579.9
n.a.p.899.41.9513.170.012.101.80.364
TOC1317.4–43.2 ppm1501.8–1349.1
1051.0–898.2
751.0–598.3
COE599.50.7613.696.71.385.50.070
Total P110.1–0.4
g L−1
1179.8–1168.7
1159.5–1139.3
1st Der + MSC9100.00.00323.099.00.0110.30.001
TSS132.7–5.8
g L−1
1801.8–1698.7
1601.2–1500.0
1100.7–999.4
SNV599.90.0334.297.50.146.3−0.003
VFA80.1–2.7 mmolC L−11934.2–1685.8
944.2–694.0
n.a.p.499.50.1013.995.40.184.70.027
VSS132.1–4.5
g L−1
1901.1–1500.0
1400.6–1299.4
1100.7–999.4
Min–Max599.30.0811.693.90.174.1−0.019
a Mean centering of spectral data was applied for all PLS models, in addition to the pre-processing methods indicated. 1st Der: first derivative; COE: constant offset elimination; Min–Max: minimum–maximum normalization; MSC: multiplicative scatter correction; n.a.p.: no additional pre-processing; SNV: vector normalization (single normal variate). b RMSEC and RMSECV values are expressed in the same dimensions indicated for the respective parameter’s range.
Publisher’s Note: MDPI stays neutral with regard to jurisdictional claims in published maps and institutional affiliations.

