Article

Virtual Geosite Communication through a WebGIS Platform: A Case Study from Santorini Island (Greece)

by
Federico Pasquaré Mariotto
1,
Varvara Antoniou
2,*,
Kyriaki Drymoni
3,
Fabio Luca Bonali
4,5,
Paraskevi Nomikou
2,
Luca Fallati
4,
Odysseas Karatzaferis
2 and
Othonas Vlasopoulos
2
1
Department of Human and Innovation Sciences, Insubria University, Via S. Abbondio 12, 22100 Como, Italy
2
Department of Geology and Geoenvironment, National and Kapodistrian University of Athens, Panepistimioupoli Zografou, 15784 Athens, Greece
3
Department of Earth Sciences, Queen’s Building, Royal Holloway University of London, Surrey, Egham TW20 0EX, UK
4
Department of Earth and Environmental Sciences, University of Milan Bicocca, Piazza della Scienza 4, 20126 Milan, Italy
5
CRUST-Interuniversity Center for 3D Seismotectonics with Territorial Applications, 66100 Chieti Scalo, Italy
*
Author to whom correspondence should be addressed.
Appl. Sci. 2021, 11(12), 5466; https://doi.org/10.3390/app11125466
Submission received: 23 May 2021 / Revised: 7 June 2021 / Accepted: 9 June 2021 / Published: 12 June 2021

Abstract

:
We document and show a state-of-the-art methodology that could allow geoheritage sites (geosites) to become accessible to scientific and non-scientific audiences through immersive and non-immersive virtual reality applications. This is achieved through a dedicated WebGIS platform, particularly handy in communicating geoscience during the COVID-19 era. For this application, we selected nine volcanic outcrops in Santorini, Greece. The latter are mainly associated with several geological processes (e.g., dyking, explosive, and effusive eruptions). In particular, they have been associated with the famous Late Bronze Age (LBA) eruption, which made them ideal for geoheritage popularization objectives since they combine scientific and educational purposes with geotourism applications. Initially, we transformed these stunning volcanological outcrops into geospatial models—the so called virtual outcrops (VOs) here defined as virtual geosites (VGs)—through UAV-based photogrammetry and 3D modeling. In the next step, we uploaded them on an online platform that is fully accessible for Earth science teaching and communication. The nine VGs are currently accessible on a PC, a smartphone, or a tablet. Each one includes a detailed description and plenty of annotations available for the viewers during 3D exploration. We hope this work will be regarded as a forward model application for Earth sciences’ popularization and make geoheritage open to the scientific community and the lay public.

1. Introduction

Virtual reality techniques can be used for 3D visualization in geoinformation, and geological sciences [1,2], where the virtual scenario (or landscape) can be based on open or ad hoc created geospatial datasets [3], including digital terrain/surface models and bathymetric data [4]. We focused our attention on key parts of virtual landscapes, the so-called virtual outcrops, which can also be called “virtual geosites” (VGs) as defined in a recent work [5]. In our work, VGs are 3D representations of surface geology [6,7] that are suitable for (i) popularizing geoheritage for a general audience by highlighting active geoenvironmental processes and (ii) engaging the young audience, which is particularly interested in cutting-edge forms of communication [8]. For the sake of clarity, in the following sections, we will use the term VG exclusively, as defined in [5].
As stated above, VGs may be regarded as particularly suitable for showcasing the geological heritage, or geoheritage, of a certain area. Geoheritage has been described and discussed in several papers during the last two decades [7,9,10,11,12,13,14,15]. Geoheritage is strictly related to geological heritage sites or geosites. These can be regarded as elements of the geosphere, which can contribute to a better knowledge and understanding of Earth’s history; they are also geological features, marked by a cultural, scientific, social, aesthetic, and economic value [16]. Geosites can be both geological and geomorphological features [17] and may be individual outcrops, mines, caves, tectonic structures, and volcanic landforms [18]. On the basis of their features, geosites can have local, regional, or global importance [19]. They also can be characterized based on their appearance: they may be outcrops, faults, and dikes, or isolated mountain peaks. It is worth noting that they can be subdivided into two categories based on whether they are active features/processes or inactive ones. During the last twenty years, many authors have focused on assessing geosites utilizing a wide gamut of criteria. Almost all assessments make use of the scientific value [20], made of three categories: representativeness, uncommonness [21], and the level of knowledge about the geosite, represented by published papers [15]. Representativeness regards how a geosite is representative of the geological phenomena that may be observed there. Concerning uncommonness, this represents how a geosite is uncommon at the local or worldwide level [21].
Furthermore, other values, which are “additional” [22,23], can be identified and determined: cultural, ecological, aesthetic, economic, and educational values. Among these, it is worth mentioning the educational one, which [15] is composed of a few aspects: educational potential (how easily the lay public can understand the features of a geosite), accessibility, and safety.
The present paper aims to showcase nine virtual geosites (VGs) belonging to the Santorini volcanic complex, representing a stunning volcanotectonic environment, the result of multiple caldera collapses associated with major explosive activity [24], using both VR applications and web-based GIS technologies. Web-based GIS platforms have succeeded in enhancing data access and dissemination, spatial data exploration, and visualization capabilities and provide additional options for processing, analyzing, and modeling available datasets [25]. This has led to the ever-increasing popularity of WebGIS in various fields. Several initiatives have previously utilized WebGIS functionalities to promote areas of interest and boost their tourism attractiveness. Using dynamic and interactive web-based maps to promote tourism resources [26], utilizing a participatory WebGIS platform to stimulate the promotion of a historical city center [27], and designing a narrative-oriented web map to showcase a geosite [28] are only a few of the numerous relevant applications. Moreover, ref. [29] has assessed the climate change strategies of the world’s countries and their spatial configuration and underlined the power of geovisualization through open access WebGIS tools. Another study [30] focused on presenting the geovisualization of spatial environmental databases using the open source WebGIS system and Google application programming interfaces (APIs). With recent developments in VR technology and functionalities, researchers and developers are armed with additional visualization and promotional options of spatially explicit information. VR applications allow for an interactive application through which the user is immersed in a site of interest [31]. At the same time, digital visitors can navigate freely through an area using their smartphones or VR specific equipment [32]. Implementing VR technologies can greatly enhance an application both in terms of promoting tourist activities [33] but also as a means of creating added educational value for geoplatforms [34].
To summarize, the purpose of our work is (i) to illustrate and describe the selected VGs, (ii) to perform a qualitative assessment of the selected VGs, and (iii) to show how a dedicated, WebGIS platform can be used to make the VGs available worldwide, thus contributing to the promotion and valorization of such invaluable elements of the Greek geoheritage.

2. Geological Setting

The active volcanic arc in Greece lies in the southern part of the Aegean microplate and results from the subduction of the African plate below the Eurasian plate [35,36]. The aforementioned geodynamic setting generates an extensional to transtensional field [37,38] in the central part of the arc where many normal and strike-slip regional faults permeate the thin crust [39]. In this part of the arc, especially at its southernmost portion, the Santorini volcanic field was formed [40].
The island of Santorini is arranged around a flooded caldera and consists of five main islands (Figure 1c): the main island of Santorini (or Thera), the island of Therasia, Aspronisi, and two post-caldera centres, i.e., the Palaia and Nea Kameni volcanoes. The active post-caldera volcano (Nea Kameni) and Kolumbo submarine volcano lie along a NE–SW volcanic line in the Christianna–Santorini–Kolumbo rift zone [41,42] parallel to two volcanotectonic lines: the Kameni line in the centre of the island and the Kolumbo line to the north [43,44] (Figure 1c). Current activity in Santorini has taken place at the Nea Kameni centre since 1570 [45]. In 2011–2012, the latter experienced unrest, not followed by an eruption [46,47].
The Santorini complex has been active since the Quaternary and formed by numerous pyroclastic and effusive eruptions (Figure 1b), dike-fed volcanism [43], and multiple caldera collapse events [24,48]. This activity generated a plethora of onshore and offshore volcanotectonic morphological structures [49,50,51,52], such as a large caldera, volcanic craters, cinder cones, levees, lava domes, and a local dike swarm in the northern part of the island (Figure 1a) [53]. All the above make this complex an open-air physical laboratory for studying fossilized geological processes. The combination of the volcanotectonic and erosional activity has sculpted the subaerial deposits, resulting in a series of unique geomorphological features onshore and offshore around the island. Some of the most distinctive sites are the LBA deposits, the northern caldera wall dike swarm, and the Nea Kameni volcano [49,54,55,56].

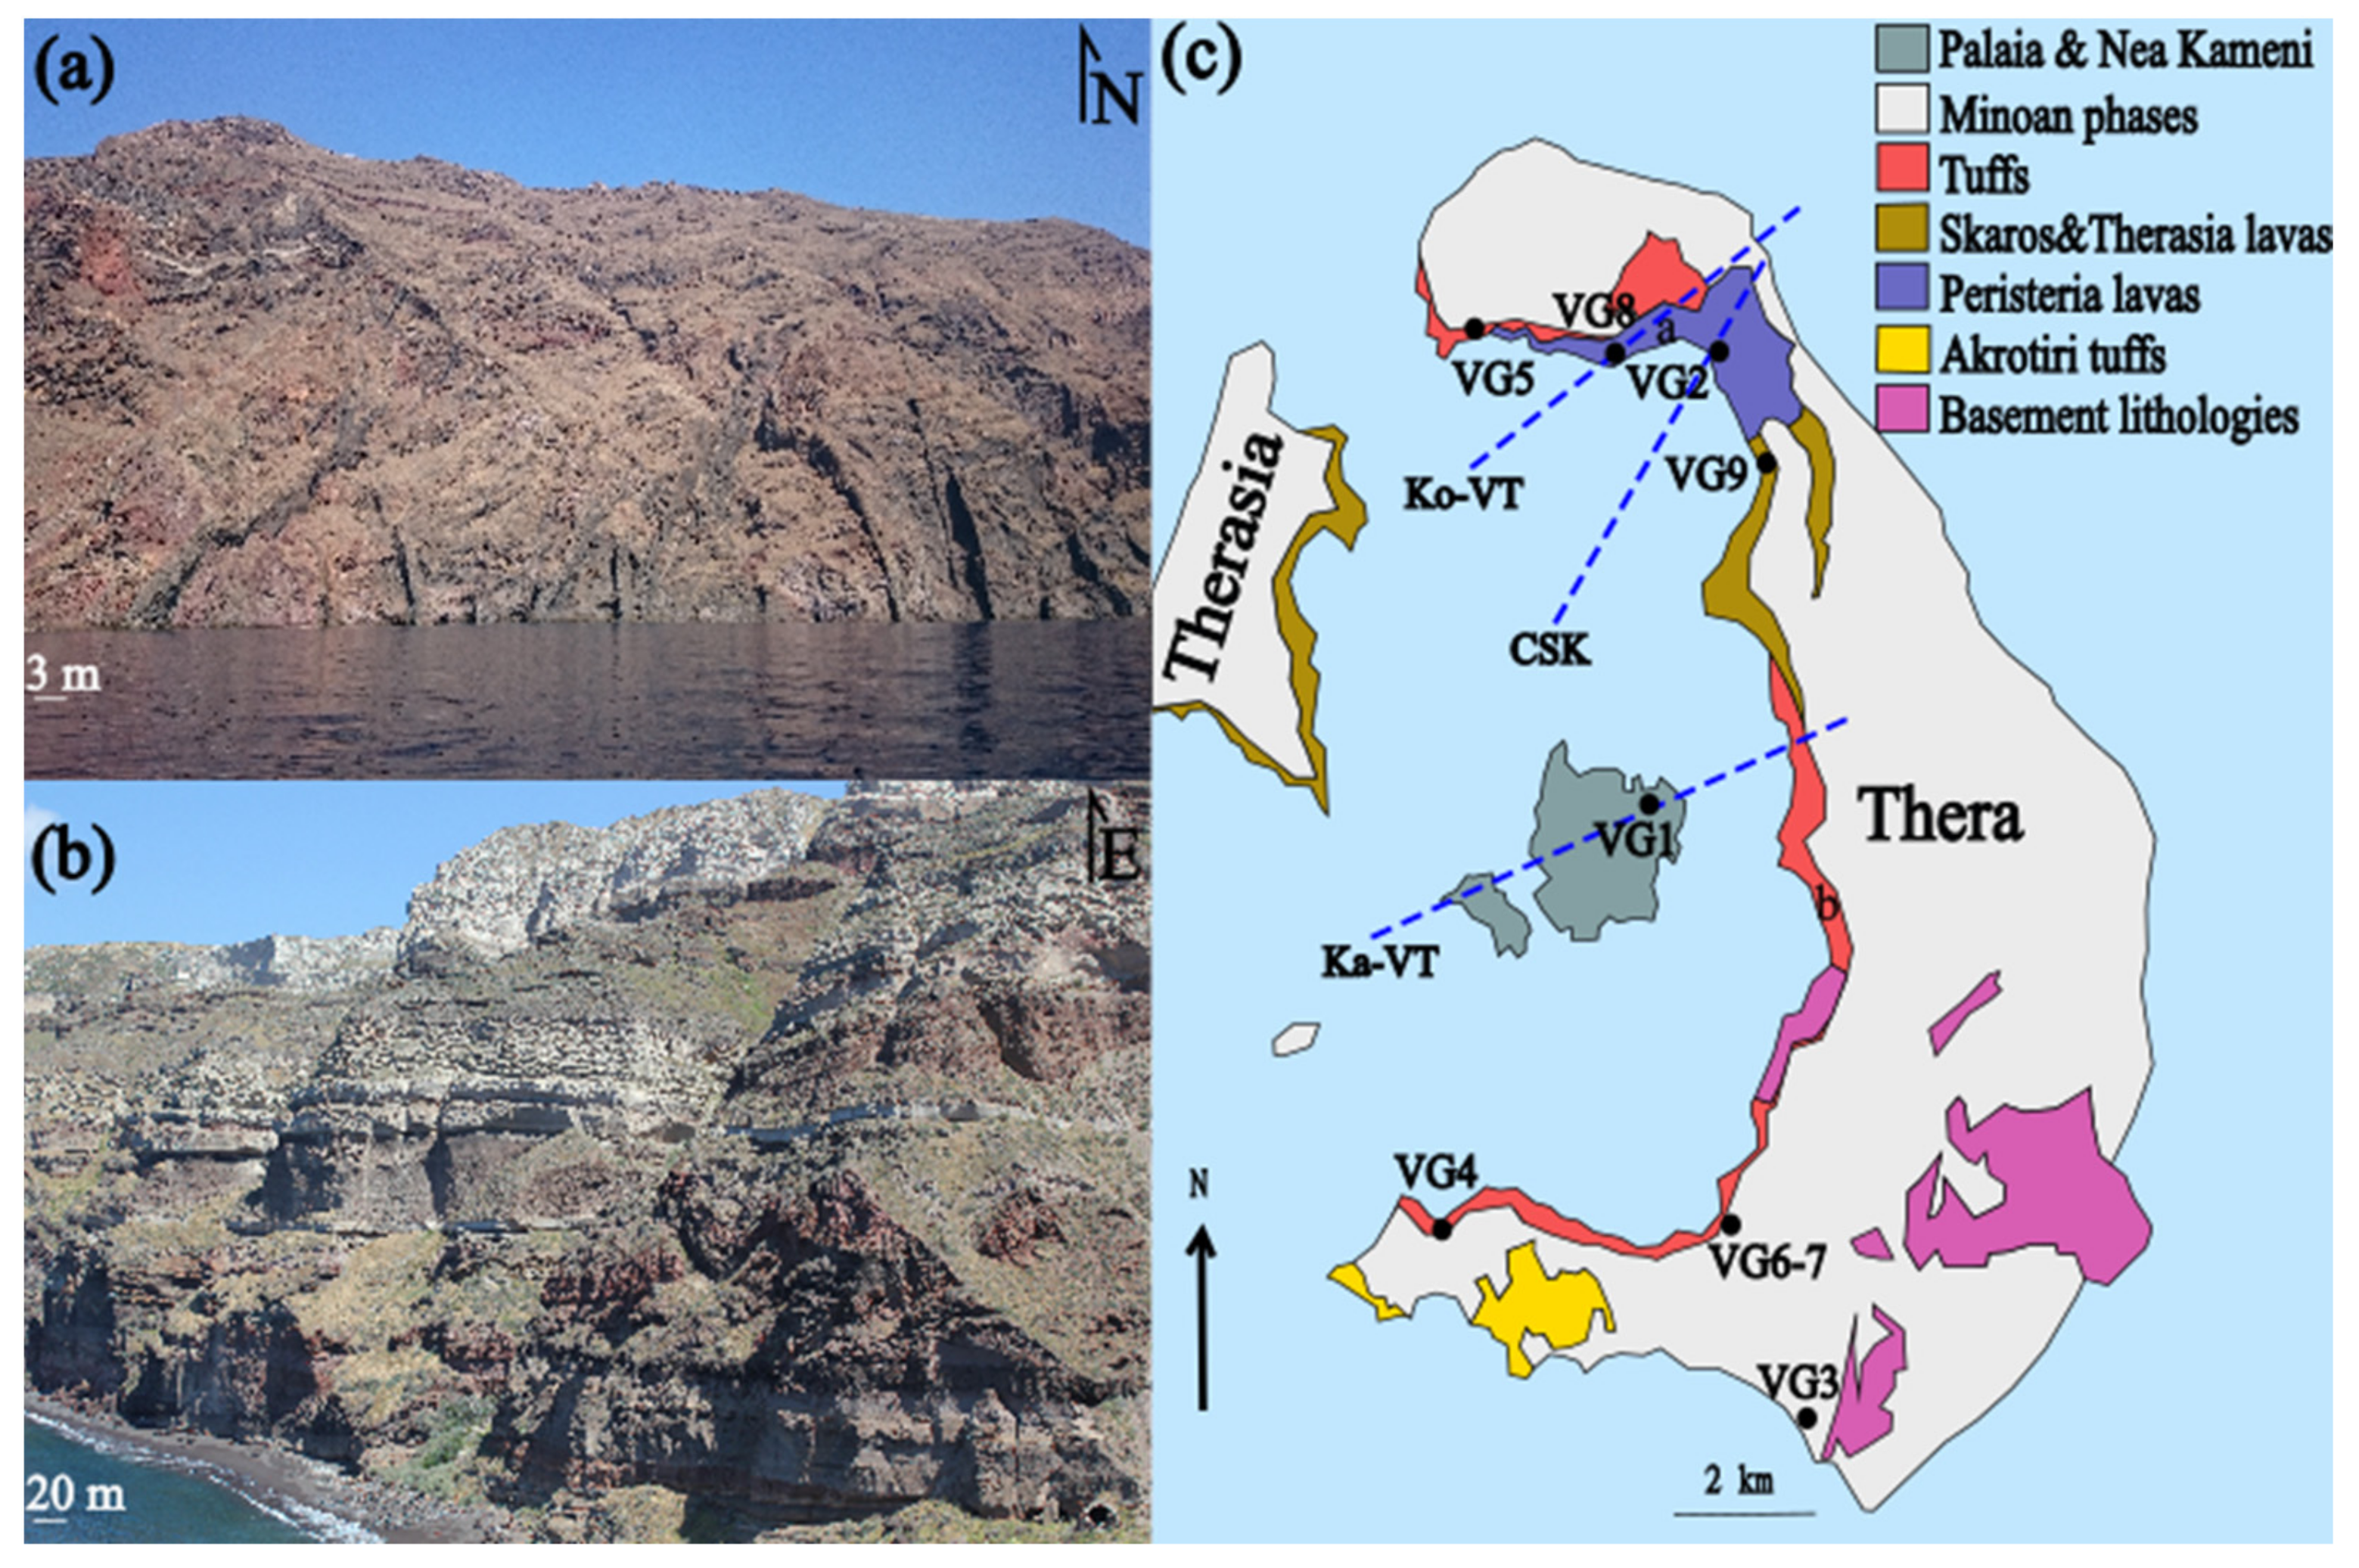
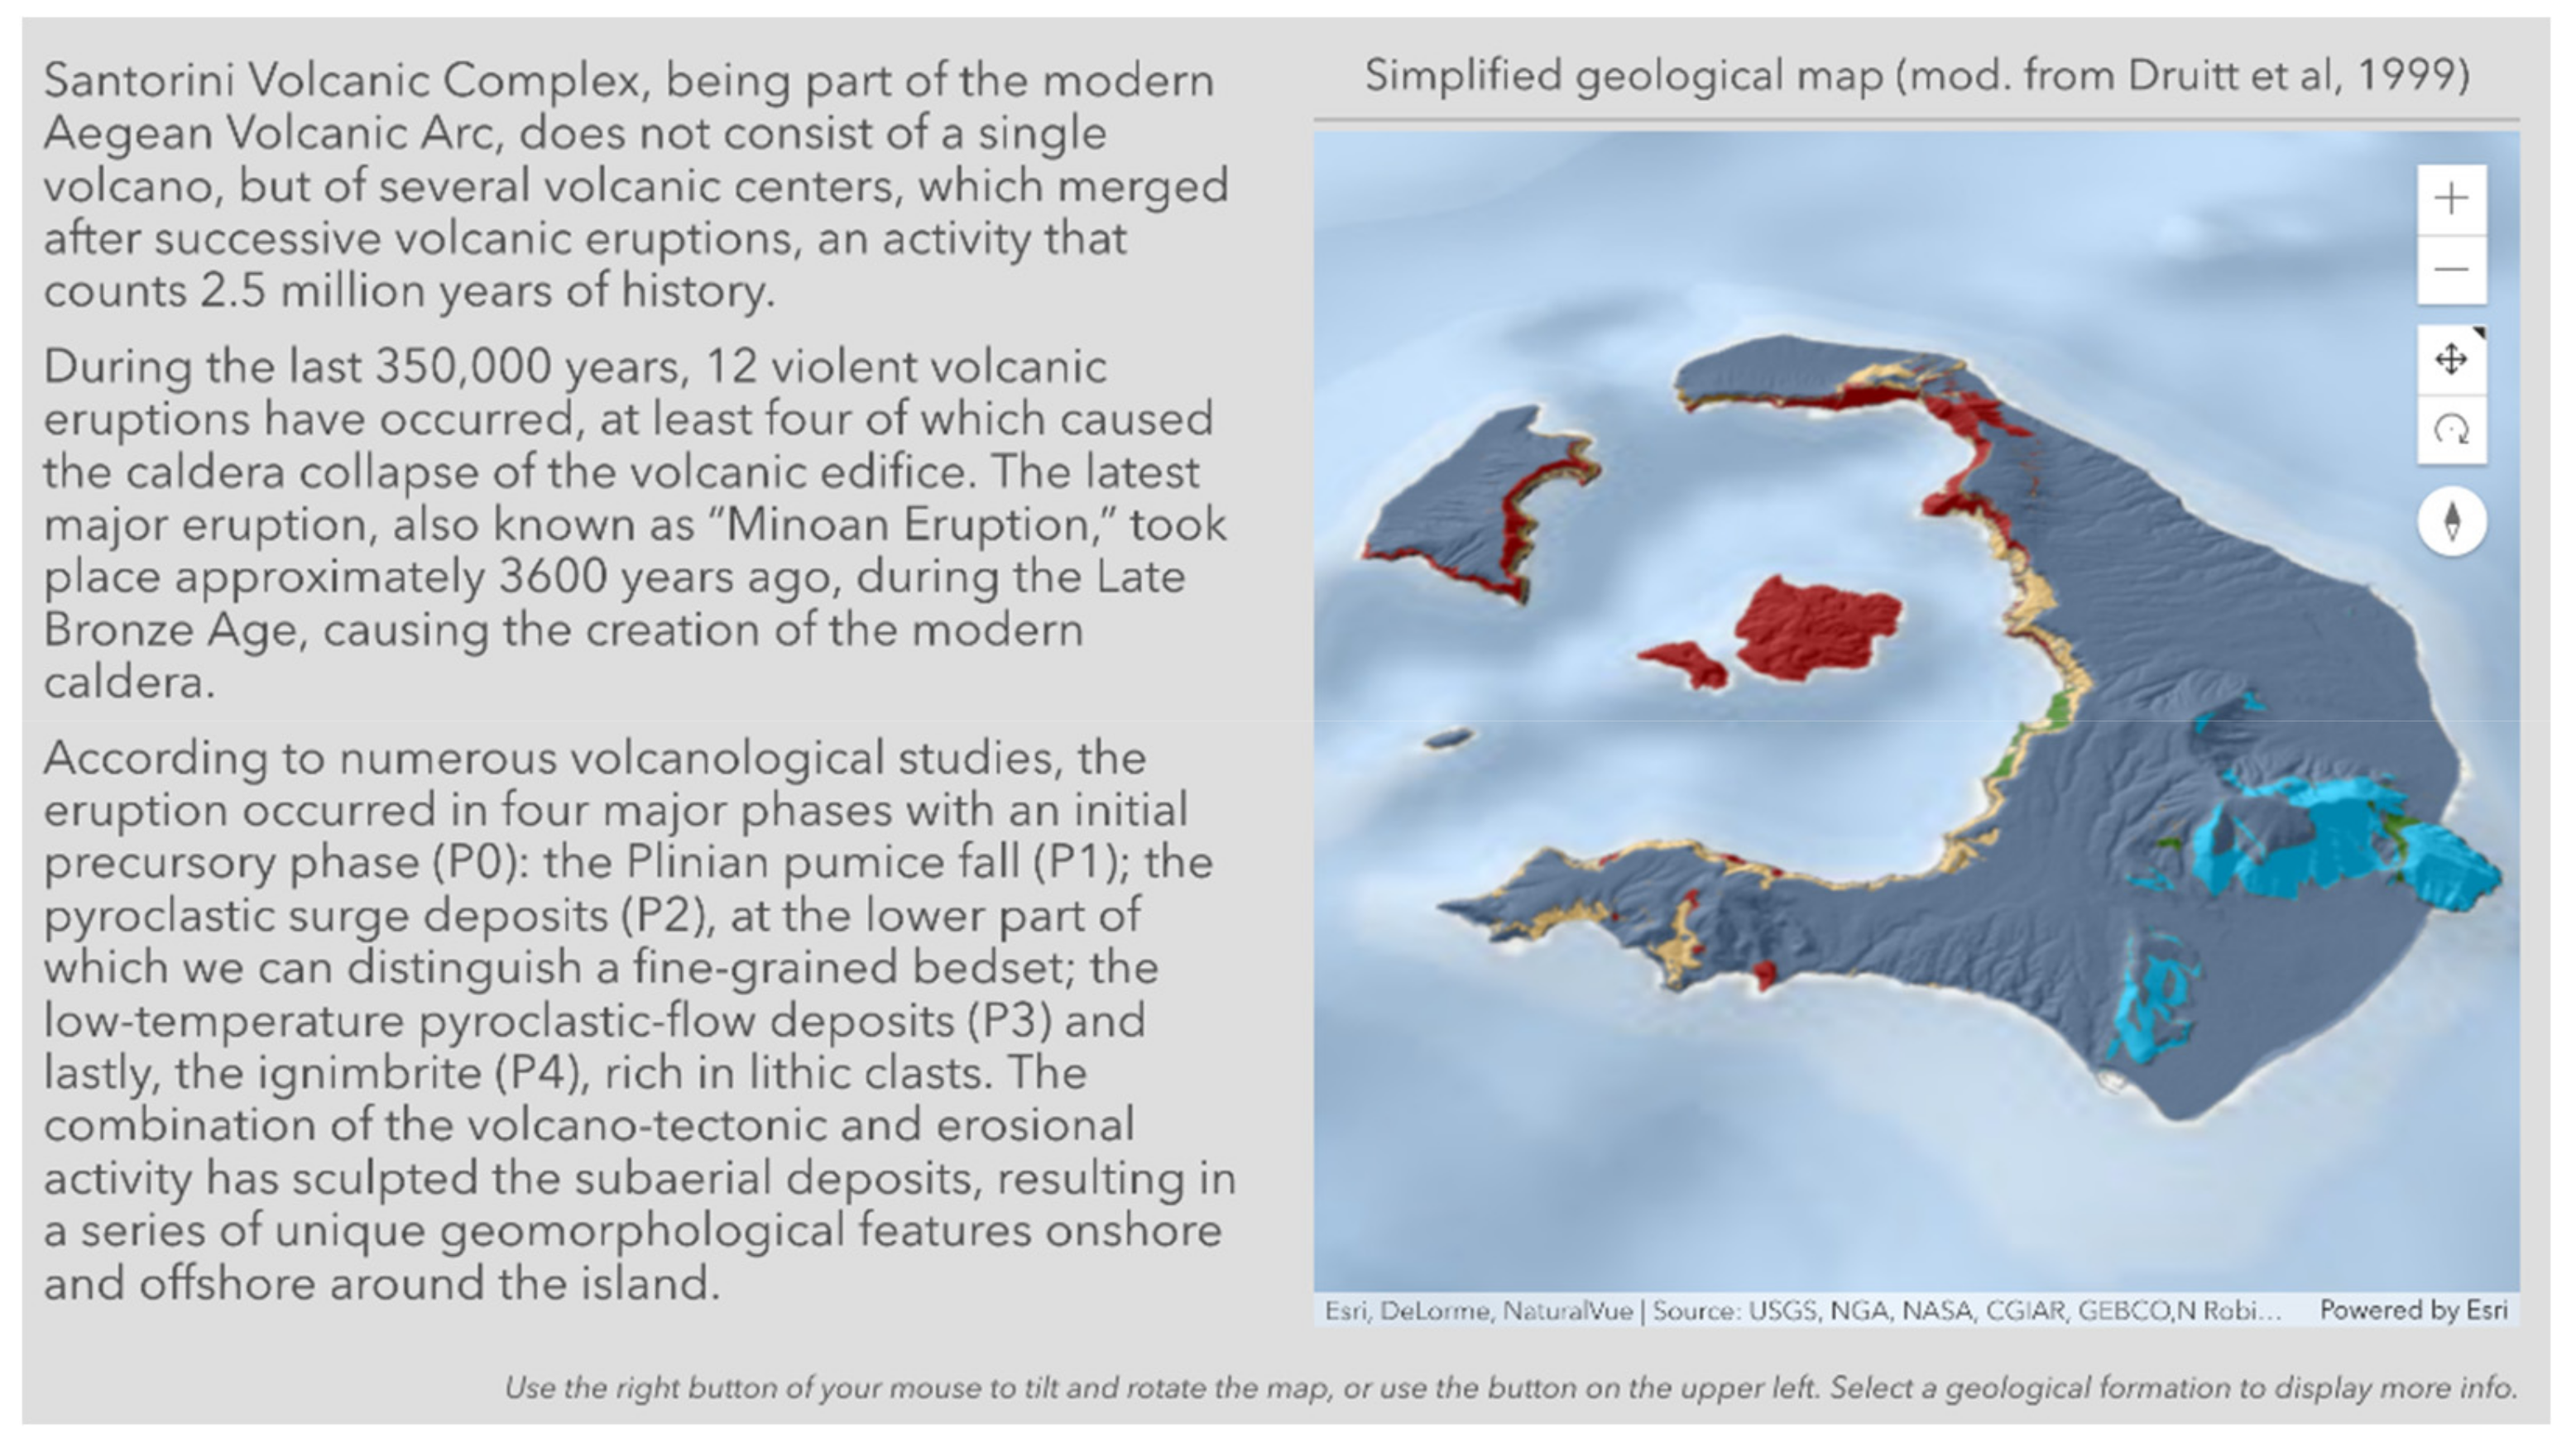
2.1. The Evolution of the Santorini Volcanic Activity

The sequence of effusive and explosive products of the eruptions, so far, compose a heterogeneous and anisotropic crustal segment, which is made of basaltic to rhyodacitic lava layers, tuffs, scoria, hyaloclastites, and phreatomagmatic ash [43]. At the same time, the nonvolcanic basement can be found in the southern and center of the island and is represented by metapelites and limestones [57]. In general, the island formed over at least 650 ky; based on geological mapping and chronological (K–Ar,40Ar/39Ar) investigations, the following stages can be defined [43,58] (Figure 1c):
(a)
The early centres and cinder cones of the Akrotiri peninsula (650–550 ka) in the south where marine activity at shallow depth as well as onshore activity, predominantly resulting in dacites and rhyodacites, was followed by an about 200 m uplift;
(b)
The construction of the Peristeria stratovolcano (andesitic stratocone complex) (530–430 ka) in the northern part of the island;
(c)
A first explosive cycle represented by pyroclastic eruptions and shields;
(d)
A second explosive cycle with pyroclastic eruptions leading to the formation of the Simandiri, Skaros shields, and the Therasia dome complex;
(e)
The post-caldera Kameni shield made of the Palaia and Nea Kameni centres.

2.2. The Geological ”Chronicles” of the Minoan Eruption

Santorini experienced several Plinian eruptions so far, with the Minoan eruption being the latest [59,60,61]. Previous volcanological studies related to this Plinian activity reported a distinct sequence of events represented by a precursory stage (P0) followed by four more phases [45,48,60], which are described as follows:
(i)
P0 Phase: This phase indicates the precursory events that resulted in the deposition of two lapilli fallout layers from a 7–10 km high subplinian plume. The latter formed a phreatomagmatic ash cloud deposited in the island’s SSE part [48].
(ii)
Phase 1: This phase produced a 6–10 cm thick pumice fall deposit on the central and southern part of the island, resulting from a 36 ± 5 km high plume [59,60,62]. The bottom part of the deposit is reverse-graded (phase P1a) and covered by a coarse unbedded part, partly bedded at the top, and mixed with scoria (phase P1b) [60].
(iii)
Phase 2: Mixing with seawater initiated a phreatomagmatic eruption that produced up to 12 m-thick stratified surge deposits [59,63]. These contain multiple bedsets and represent the phase 2 products. In addition, they are interrupted by dune-like bedforms and bomb sag horizons [48,64]. The bottom unit comprises fine-grained accretionary lapilli (P2a), whereas the upper part is coarser-grained (P2b).
(iv)
Phase 3: The formation of low-T pyroclastic flows, which gradually developed into mudflows, characterizes this phase. The flows constructed a shield-like single flow deposit [59,65].
(v)
Phase 4: High-T pyroclastic flows produced fine-grained ignimbrites, covering the caldera cliffs and the coastal areas [43,48,57]. The main product is a pink-coloured ignimbrite (called ”tan” ignimbrite) [59], which is up to 80 m thick in some parts of the island, representing the most dominant unit of the Minoan eruption [66].

3. Building the Vitual Geosites

Our 3D model building method comprises the application of the structure from motion (SfM) photogrammetry technique, largely used in Earth and environmental sciences (including studies in volcanic areas), for both research and communication purposes [54,67,68]. This technique enables obtaining high-resolution photorealistic 3D models as final products by producing three-dimensional structures from two-dimensional image sequences [69,70]. As some of the 3D models presented here result from our previous research, we, therefore, summarize the overall methodology.
Generally, our methodology is subdivided into three main steps: (i) drone-based image collection, (ii) photogrammetry processing, and (iii) 3D model export for online sharing as VG.

3.1. Drone-Based Image Collection

Step one focused on image collection, using unmanned aerial vehicles (UAVs), also called drones. We chose two different types of multirotor vehicles: (i) the DJI Spark (UAV1), a 300 gr drone supplied with a small CMOS sensor (1/2.3 inch), suitable for taking pictures with a resolution of 12 megapixels and (ii) the DJI Phantom 4 PRO (UAV2), a 1388 gr drone supplied with a larger CMOS sensor (1 inch), suitable for collecting pictures with a resolution of 20 megapixels. The latter’s flight time is approximately 30 min and can be remotely controlled. Both can capture images, comprising the exchangeable image file format (EXIF) information and the location of the pictures reported in geographic coordinates (DATUM WGS84). Both have very stable hovering and a stabilized camera. They can be easily carried in the field and collect pictures flying at a very low height, resulting in a greater ground resolution and proving very useful for VGs reconstruction [71]. In addition, UAV2 is also designed for automatized flight missions, a peculiarity that is especially suitable for modeling large areas (further details in [72]). Generally speaking, the pictures collected using drones or cameras need to have a high overlap ratio, usually greater than 75–80% with the following pictures and must be orthogonally oriented to the target [73].
Regarding the specific area where we collected the pictures, it is recommended to fly the drones with the straight sun overhead (zenith), so the middle part of the day; it is also helpful to reduce shadows around elevated features. Moreover, it is also suggested to perform this kind of activity during the low-wind season; in Santorini, this corresponds to mid-spring (April–May) and late summer, or the beginning of autumn (September–October). Taking into account logistics, we have adopted different approaches for the different VGs:
(i)
For VG1 and VG3, we used UAV1; images were taken by flying the drone at a height lower than 30 m, with the camera in nadir and oblique orientation, respectively. The drone was manually flown, keeping the velocity at 2 m/s, and pictures were taken in equal interval mode (every two seconds). Further details are provided in [73].
(ii)
For VG2, VG4, VG5, VG8, and VG9, we used UAV2; pictures were taken in a range of elevations between 25 and 120 m, with the camera orthogonal to the caldera wall (oblique orientation); the drone was manually flown at a constant velocity of 2 m/s and pictures were captured every two seconds. Further details are provided in [2].
(iii)
For VG6 and VG7, we ran two different surveys. The first one aimed to cover the entire area with an automatized flight mission and the camera in nadir settings. The second mission was devoted to collecting pictures all along the mine’s vertical wall, with the camera oriented orthogonally to it (oblique orientation); in the latter case, the drone was manually flown at a constant velocity of 2 m/s and pictures were collected every two seconds. Further details are provided in [71].

3.2. Photogrammetry Processing for 3D Model Building

We processed the collected images using Agisoft Metashape (http://www.agisoft.com/ (accessed on 10 June 2021)), which is software aimed at processing images to generate 3D spatial data. This software has been increasingly employed for UAV-based photogrammetry 3D modeling, thanks to the simple and easy to use workflow, excellent graphic user interface, and high-quality results regarding dense clouds [74]. In a later section, we describe the steps through which we produced our VGs. The first step was to import and prepare the pictures, ensuring that all the areas outside the target (e.g., sky and clouds) are masked to achieve a better alignment and obtain a greater sparse and dense cloud [54]. Subsequently, we ran an initial low-quality alignment of the images, taking into account both generic and reference preselection settings; after this, we deleted the images with low quality (quality value less than 0.8) or out-of-focus through visual inspection. Then, we aligned the remaining pictures based on high-quality settings (both generic and reference preselection), thus obtaining the sparse cloud. The following step regarded the reconstruction of the dense point cloud (setting the quality as medium) that results from the sparse point cloud; in doing this, we applied a depth filtering set to mild. We first applied the “filter by confidence” tool on the resulting dense cloud to remove the wrong points, selecting those with a value equal to one. Then, we removed possibly persisting wrong points by visual inspection. Finally, although not an essential task for visualization purposes, it was worth referencing and scaling the resulting dense cloud [70,75,76,77,78], if possible, by collecting some ground control points (GPCs) with high-resolution (centimetric) GPS, which were added in the model. It is advisable to add at least four artificial referenced markers near the corners of the model. An additional marker needs to be positioned in the centre; this procedure aimed at reducing any “doming” effects resulting from photogrammetry modeling. More details regarding our workflow are in [54,68,72]. As explained in the previous section, some models are derived from previous work. We summarized all details in Table 1, including the number of GPCs we used and the resulting texture resolution.

3.3. Three Dimensional Model Export for Online Sharing as Virtual Geosites

We created the 3D model from the dense cloud using the following steps and settings. In step 1, we built the mesh, characterised by several faces in high-quality settings, noting that the maximum number of faces cannot exceed 2,100,000. Then, it was necessary to create the texture to cover the mesh with a photorealistic aspect; this was accomplished by creating two different 4096 × 4096 pixel files for the texture. Subsequently, the 3D model was exported into a Collada file format [79], resulting in one file for the mesh (.dae file extension) and two for the texture (.jpg file extension). These settings were designed to obtain an overall file size within the 200 MB limit imposed by the educational license for Sketchfab and still providing excellent quality, as shown in the VGs section. The texture resolution in our models was always between 1 and 6 cm/pixel.

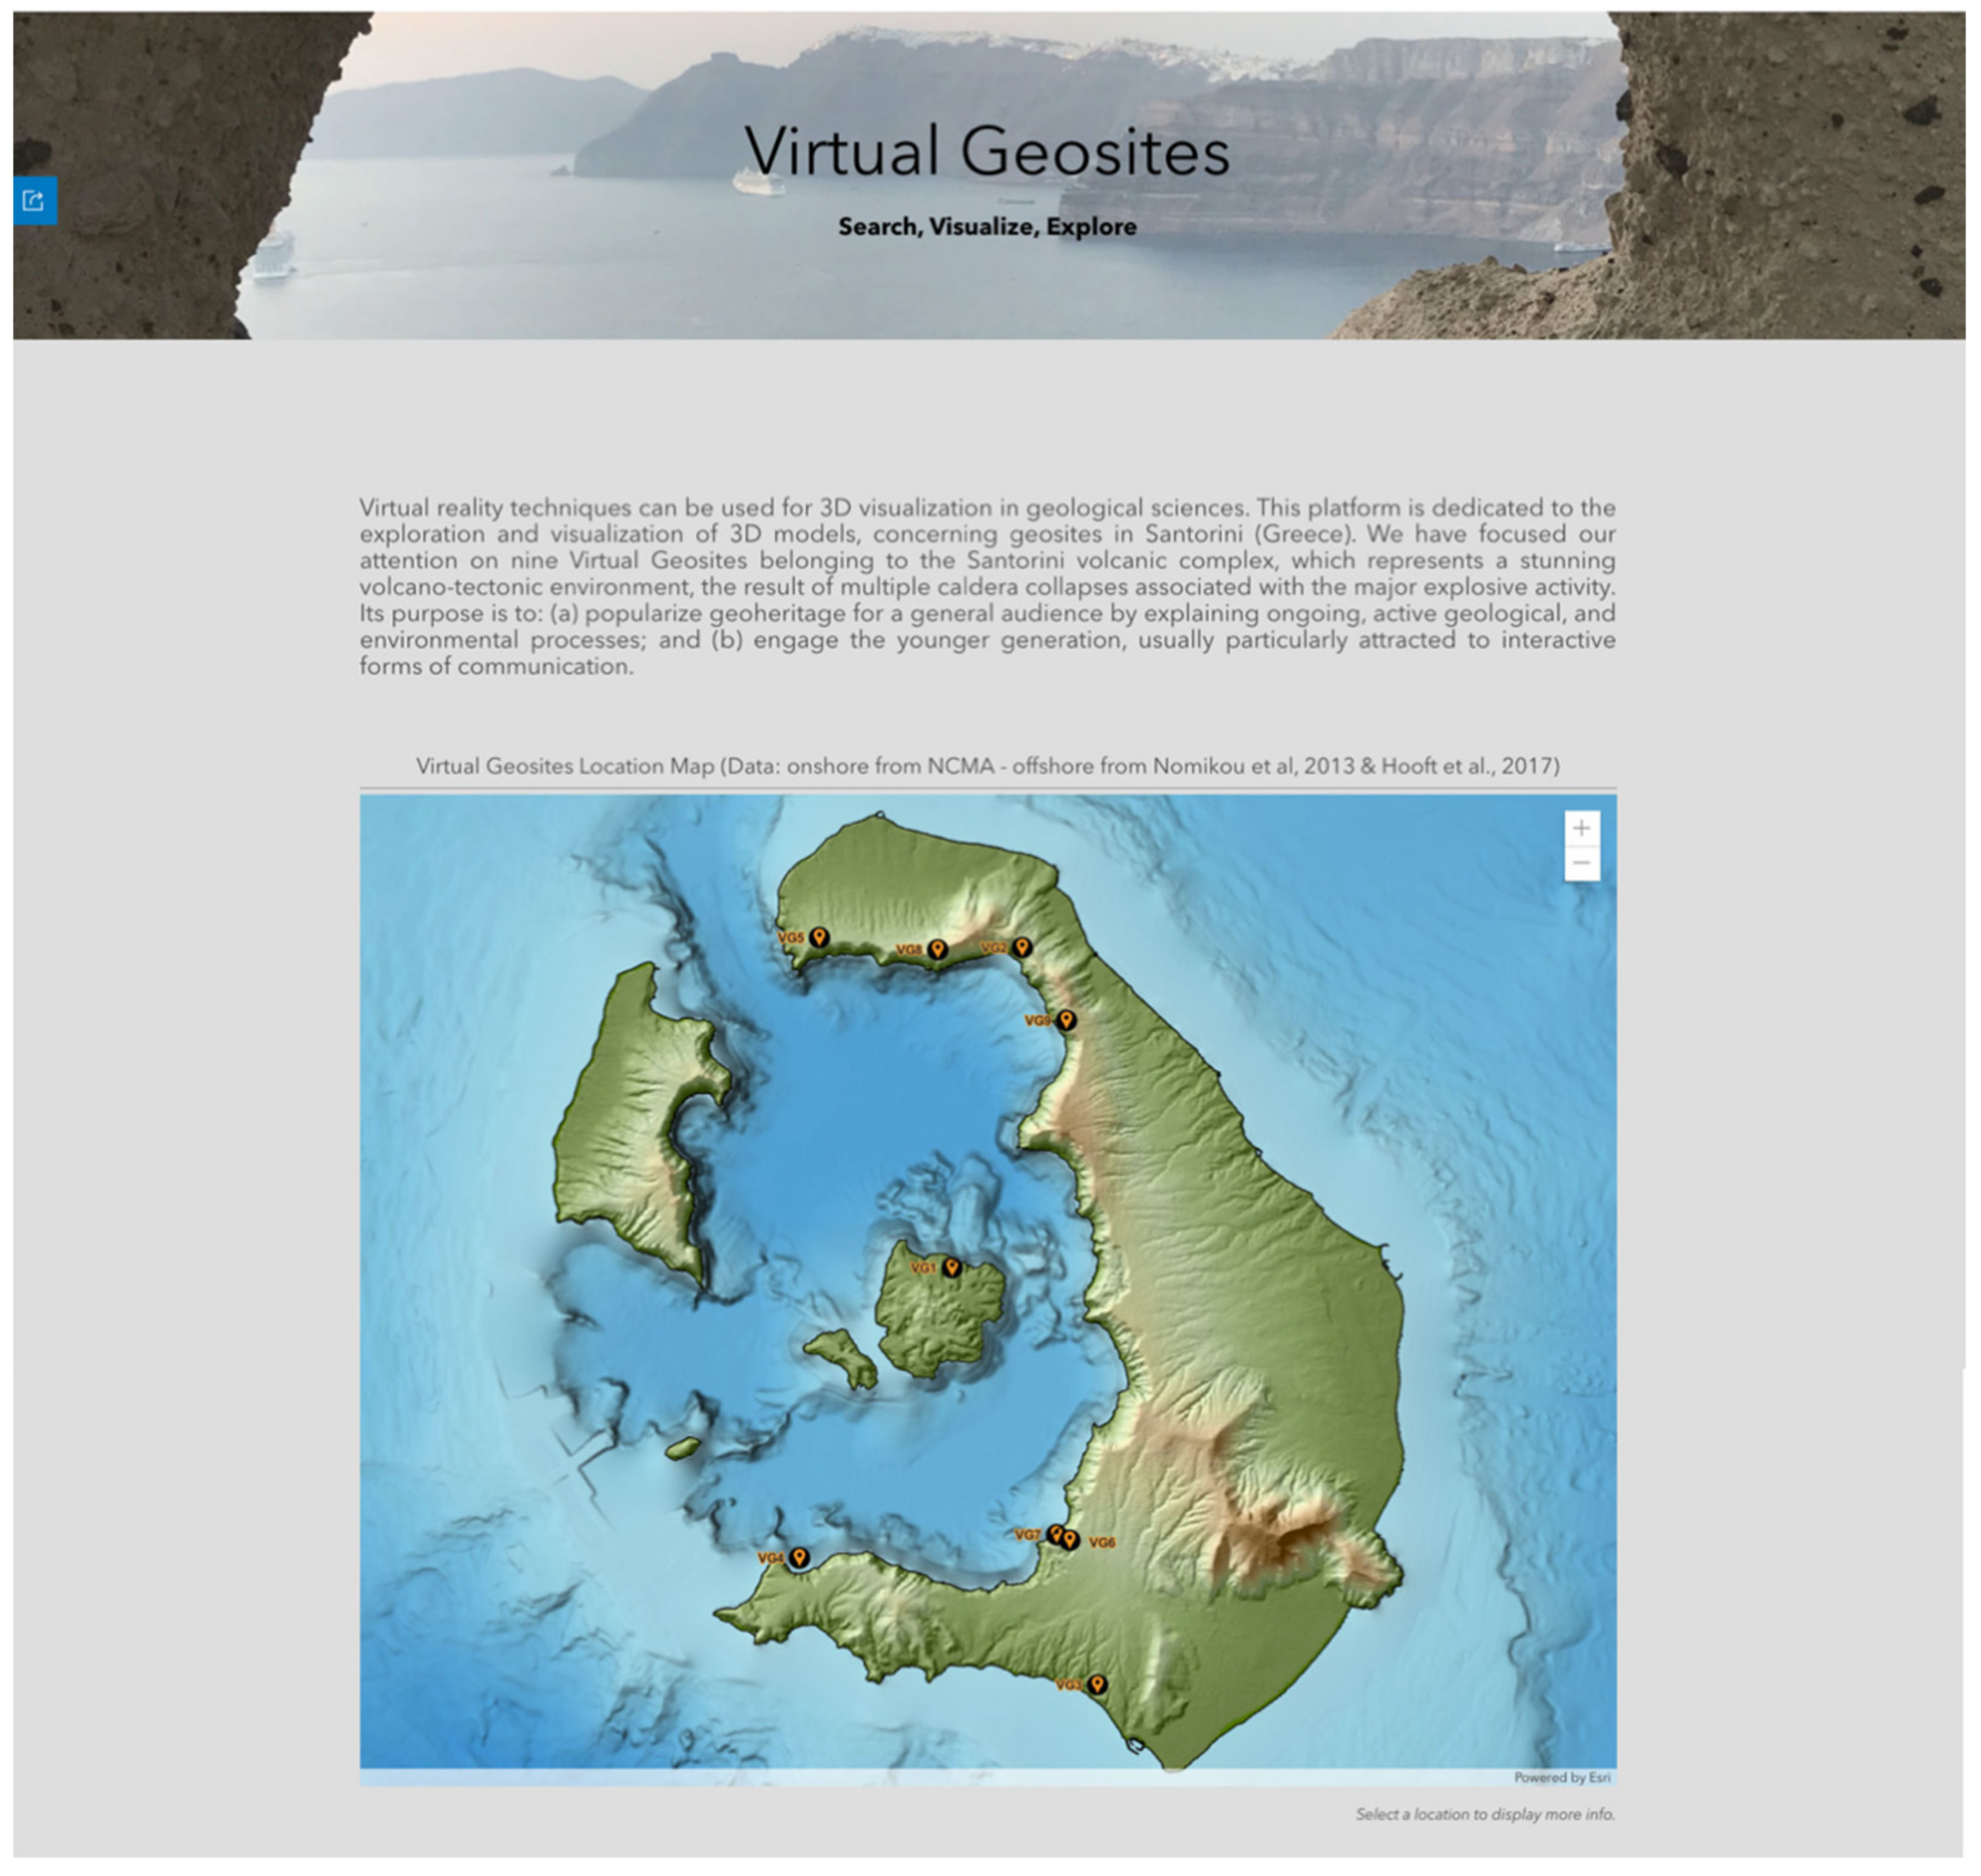
4. Virtual Geosites Sharing (WebGIS Platform)

In this section, we present an innovative approach to make Santorini’s VGs accessible worldwide through the internet, together with a wealth of information suitable for highlighting and explaining the geological features and processes observed on the island. To this end, we combined a WebGIS platform with 3D models available in virtual reality, as detailed below.
To more efficiently disseminate all available models amongst the cooperating parties and the general public, we had to use a dedicated media through which the models can be properly grouped and shared. After looking into the available options, and thanks to the consortium’s previous extensive experience with ESRI products, the ArcGIS Hub platform (https://hub.arcgis.com/ (accessed on 10 June 2021)) was deemed the best choice. ArcGIS Hub, developed by ESRI in 2020, is a platform that allows for the creation of interactive sites through which an organisation can share its spatial content. All team members can customize and enhance the developed site with 2D and 3D maps, smart layouts, templates, and multimedia content that can be configured to better showcase the available information. External media, and other applications developed within the ESRI platform, can be added. An educational account was used to create the virtual geosites hub accessible at: https://arcg.is/1e4erK0 (accessed on 10 June 2021).
In the present case, narration starts with an eye-catching photograph of the Santorini panorama combining natural and anthropogenic environments, followed by a short introduction on the hub’s purpose. Scrolling down, the user can view an interactive 2D morphological web map outlining the location of the selected geosites (Figure 2). A 5 m resolution digital elevation model from the National Cadastre and Mapping Agency S.A. of Greece was rendered according to elevation. A multidirectional shaded relief map was also used to represent the onshore morphology. Concerning offshore morphology, a 16 m resolution grid [41,50] and a multidirectional shaded relief were combined to show the unique seabed of the area thoroughly. The users may select a VG location on the map to obtain further details.
A brief overview of the island’s volcanic history, accompanied by a 3D simplified geological map, modified from Druitt et al. [43], are provided. The viewers can use the tools on the map to zoom in and out, or right-click anywhere on the map to tilt and rotate the scene, observing it from different points of view (Figure 3). Both the two-dimensional and three-dimensional (scene) web maps were created through the ArcGIS Online platform (www.arcgis.com (accessed on 10 June 2021)).
The final part is dedicated to a gallery that includes all nine virtual geosites (Figure 4). Buttons allow the user to access a StoryMap application about each VG. The value of using such applications to illustrate and promote the proposed geosites was based on previous related applications of this kind and especially the ones employed by some of the authors of the present work [73,74,75].
ESRI provides several configured apps (https://storymaps-classic.arcgis.com/en/app-list/ (accessed on 10 June 2021)) and a new StoryMap template (https://storymaps.arcgis.com/ (accessed on 10 June 2021)) combining popular features from those previously mentioned, to be used as story maps. The second approach, called ArcGIS StoryMaps, was employed, featuring a user-friendly interface that has a responsive design and enhanced capabilities to incorporate 3D visualization. Furthermore, the ArcGIS StoryMaps template has many important accessibility functions to support viewers with impaired vision or limited mobility. Each StoryMap developed combines descriptive information and the corresponding 3D model; credits and references are also mentioned in each one (Figure 5).
To be embedded in the StoryMap, a model must first be uploaded on an online 3D viewer. The Sketchfab platform (educational license), allowing for a stunning viewing experience through the immersive virtual reality (VR) [1,2,80], was used for our work. The viewer can access 3-D visualization on a computer [6], tablet, or smartphone, in this case, through non-immersive VR. Furthermore, augmented reality (AR) items can be added as scientific annotations [81]. According to [82], the uploaded material can be used for non-immersive VR experience of each model on a PC screen or a mobile device without head-mounted displays; on the other hand, a fully immersive VR experience can be obtained, which guarantees more effective interactivity, utilizing head-mounted displays such as goggles and VR headsets. To enable the viewer to experience a 3-D visualization, each VO was uploaded on the Sketchfab platform with a straightforward drag-and-drop procedure; Sketchfab automatically builds the 3-D scene, which is almost ready for non-immersive visualization; a number of settings can be adjusted, regarding the initial view, field of view, model orientation, light/shadow, etc.
Furthermore, by employing the Sketchfab platform, each model can be explored through the embedded immersive virtual reality (VR) tool; VR contents can be made available for many devices: Google Cardboard and more generic VR Goggles for mobile phones, HTC Vive, Oculus Rift, and others (https://sketchfab.com/virtual-reality (accessed on 10 June 2021)). To make it possible to enjoy a more effective, immersive VR experience, the viewer’s starting point, the height, and the direction of observation, need to be set (e.g., Figure 6). The user can observe the model through an immersive VR experience and move across the scene by selecting the annotations to explain the most relevant features in each model.
The hub concludes with a footer, naming the consortium members and providing contact information.

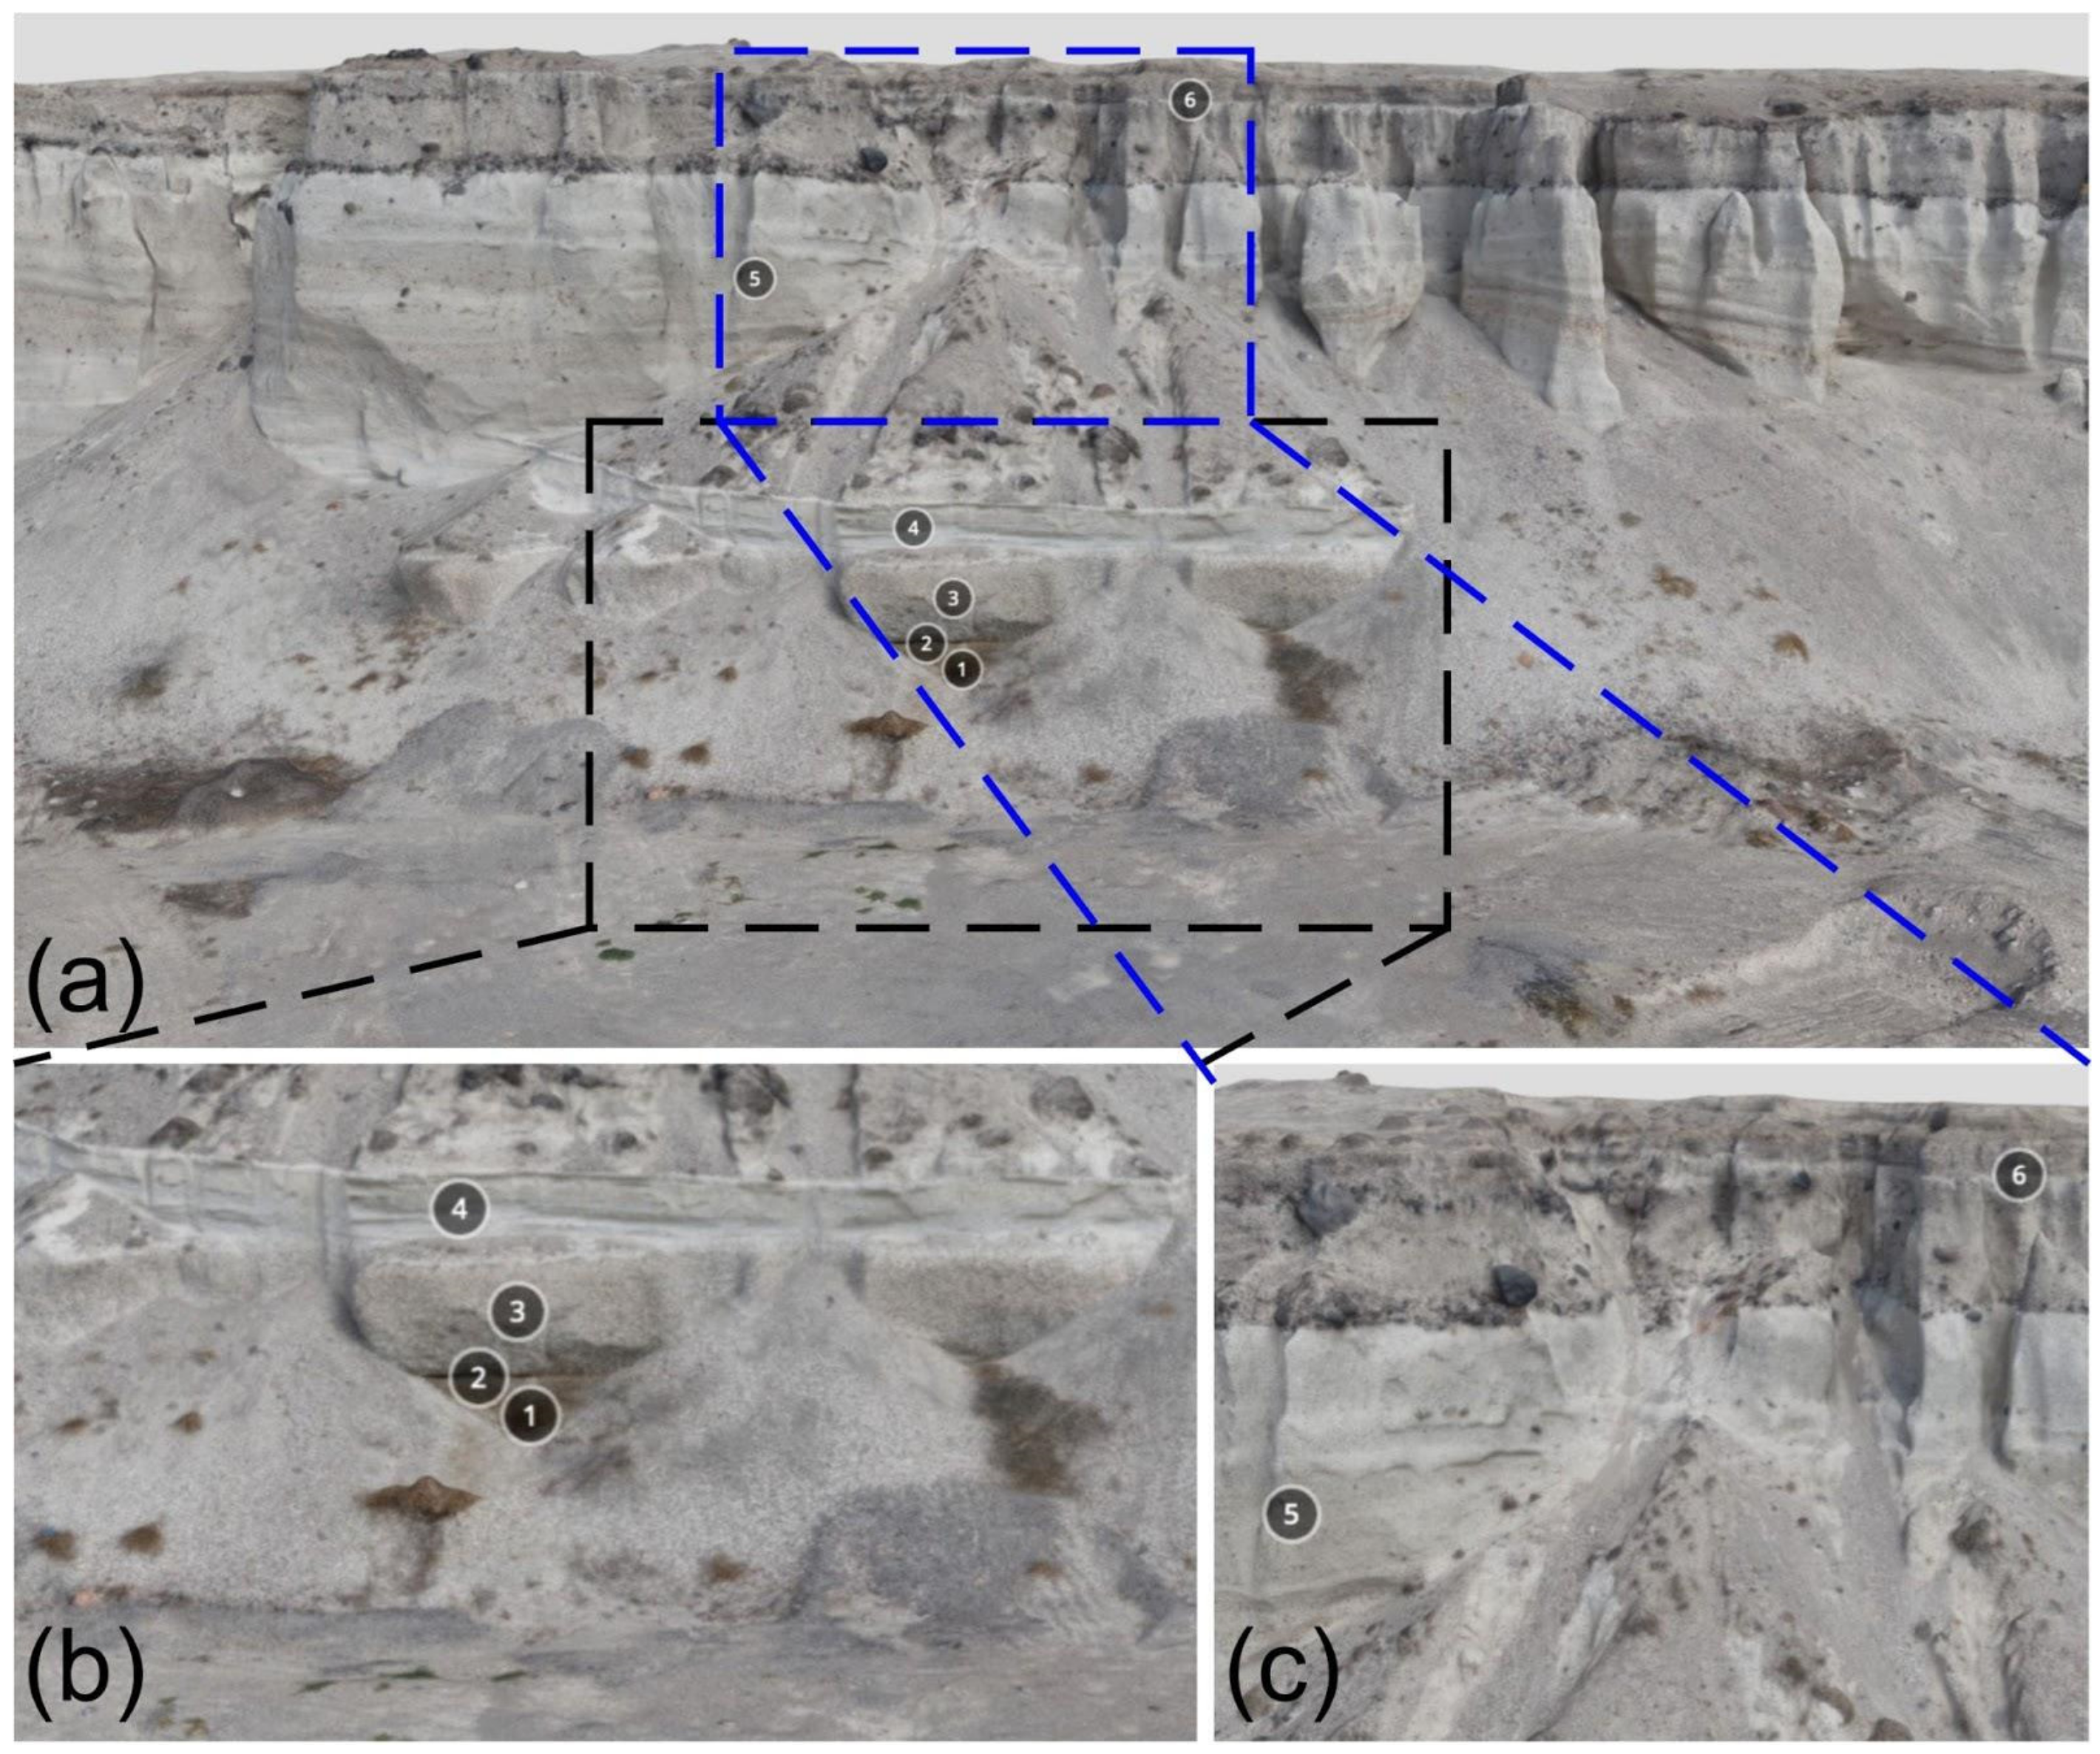
5. Description of the Selected VGs and Related “Scientific Virtual Geotours”

In this section, we present each VG, including a brief geological description.

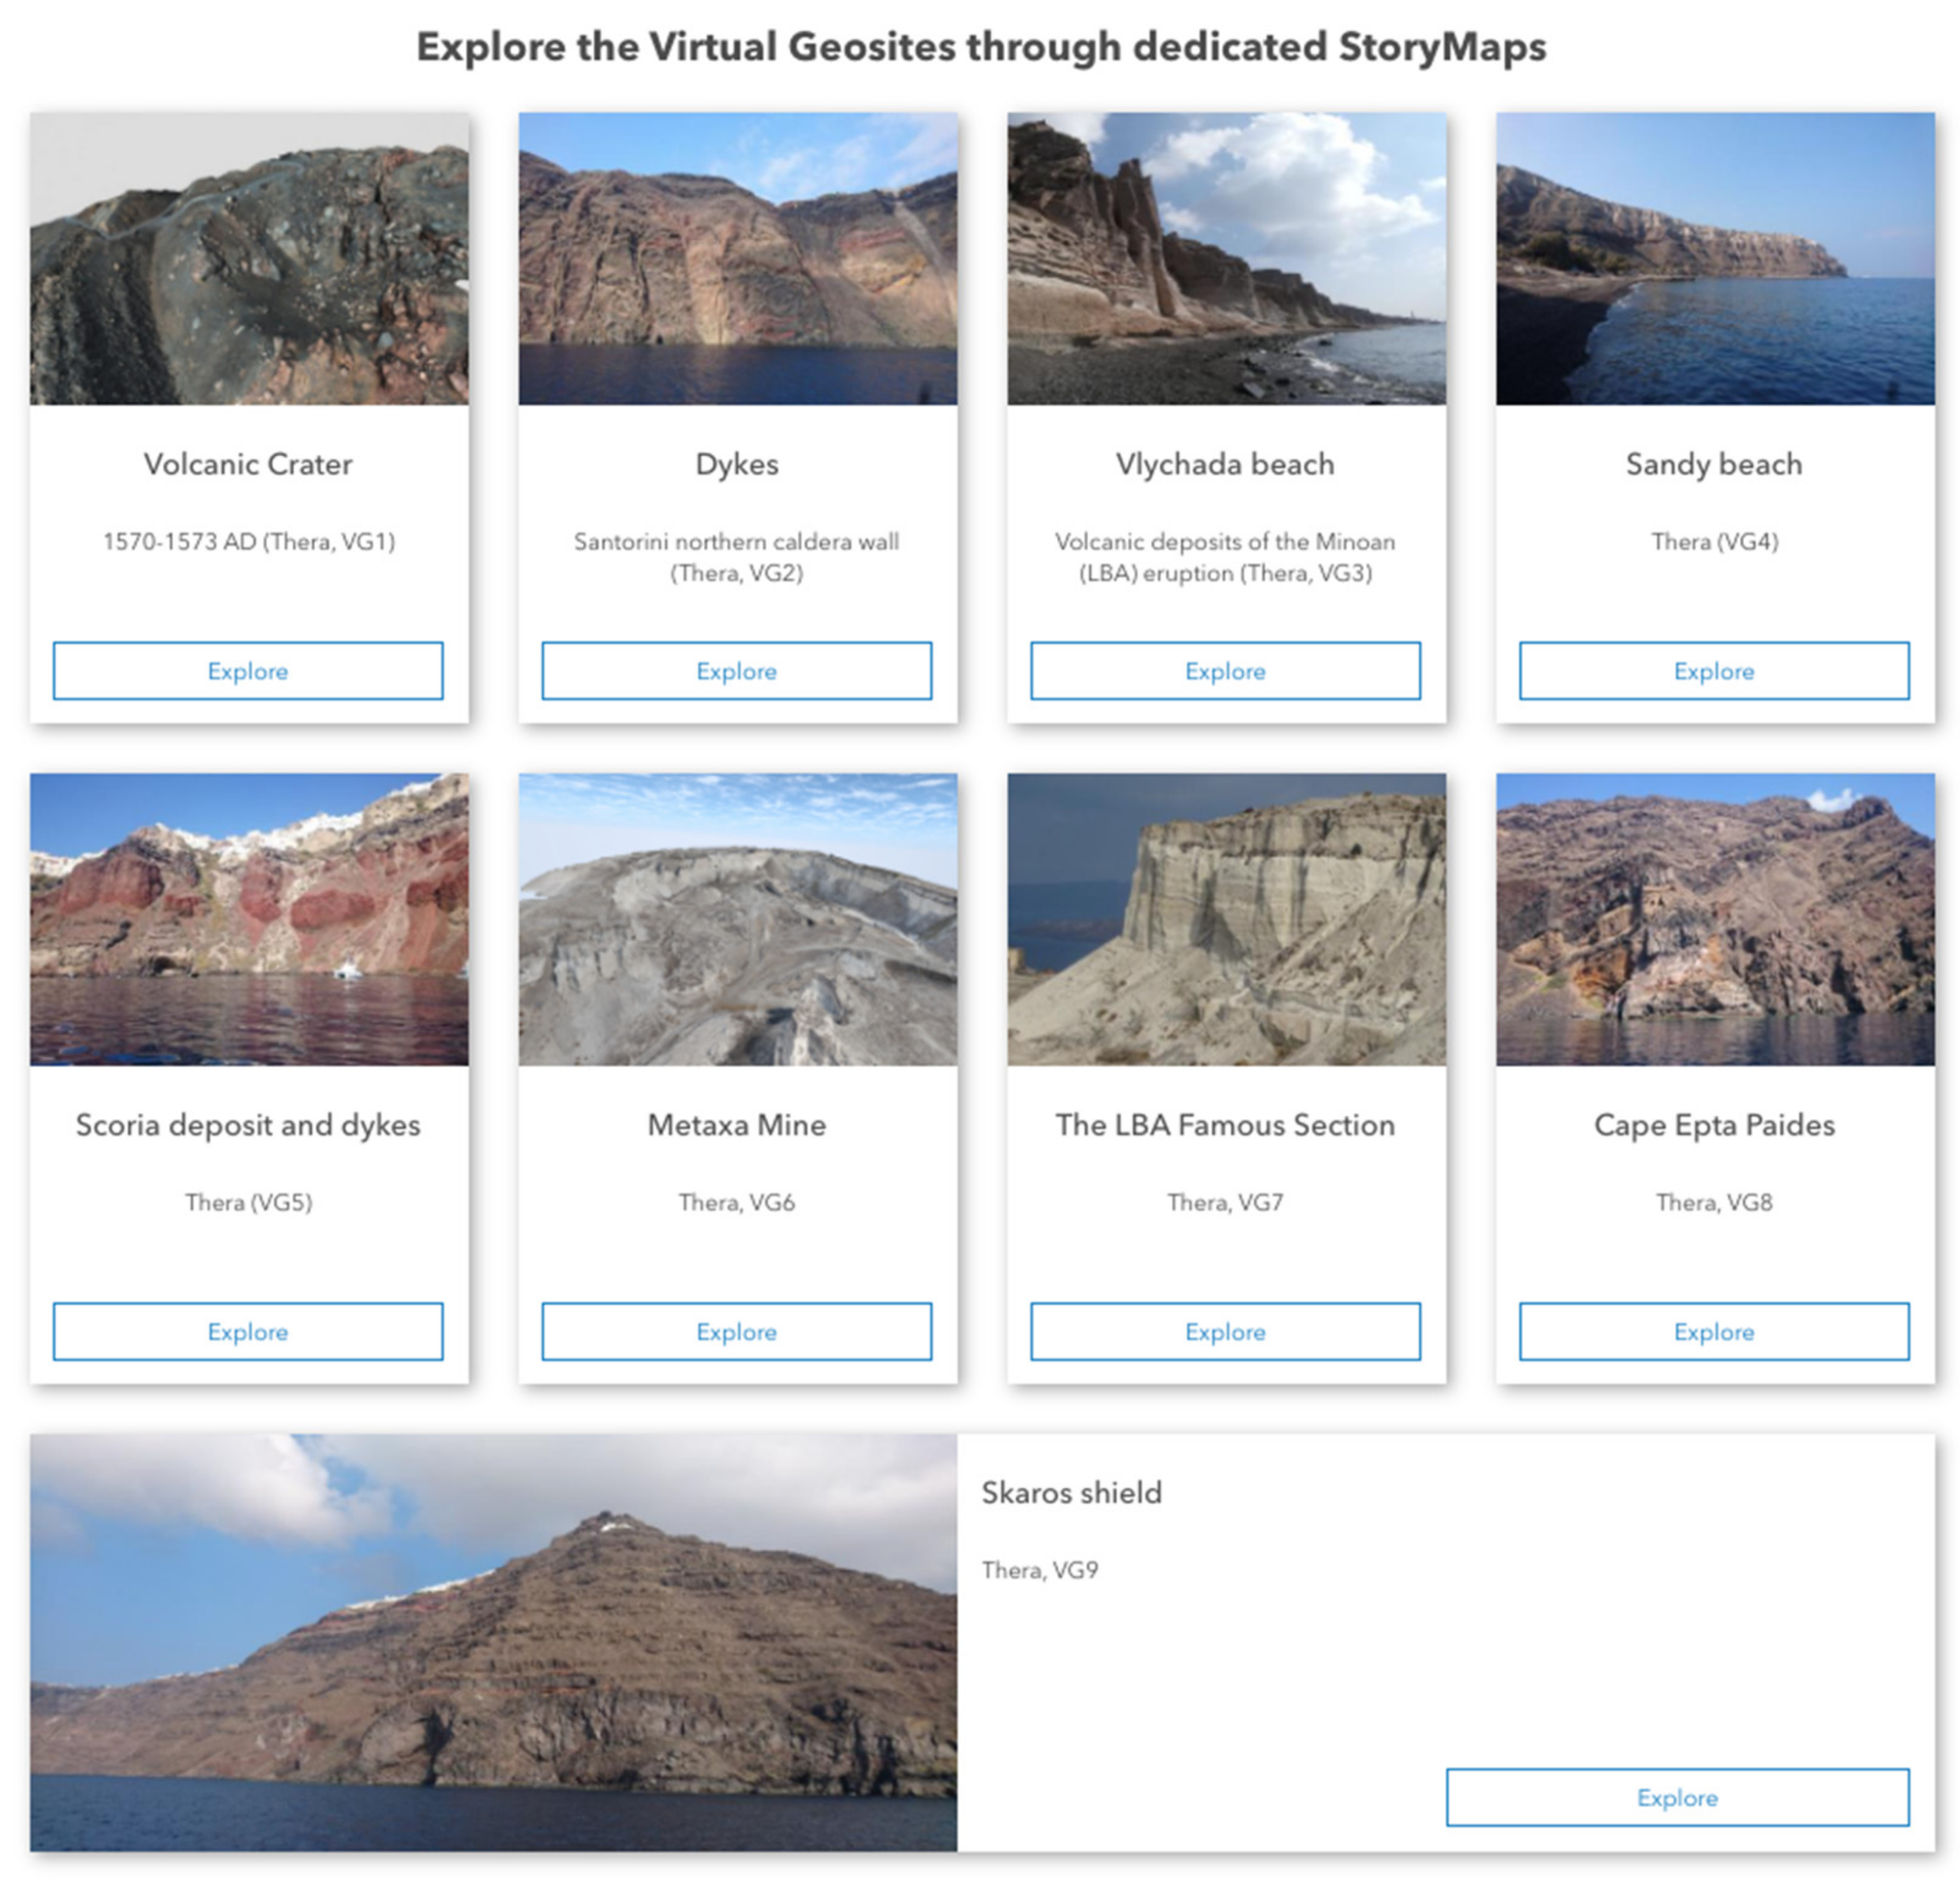
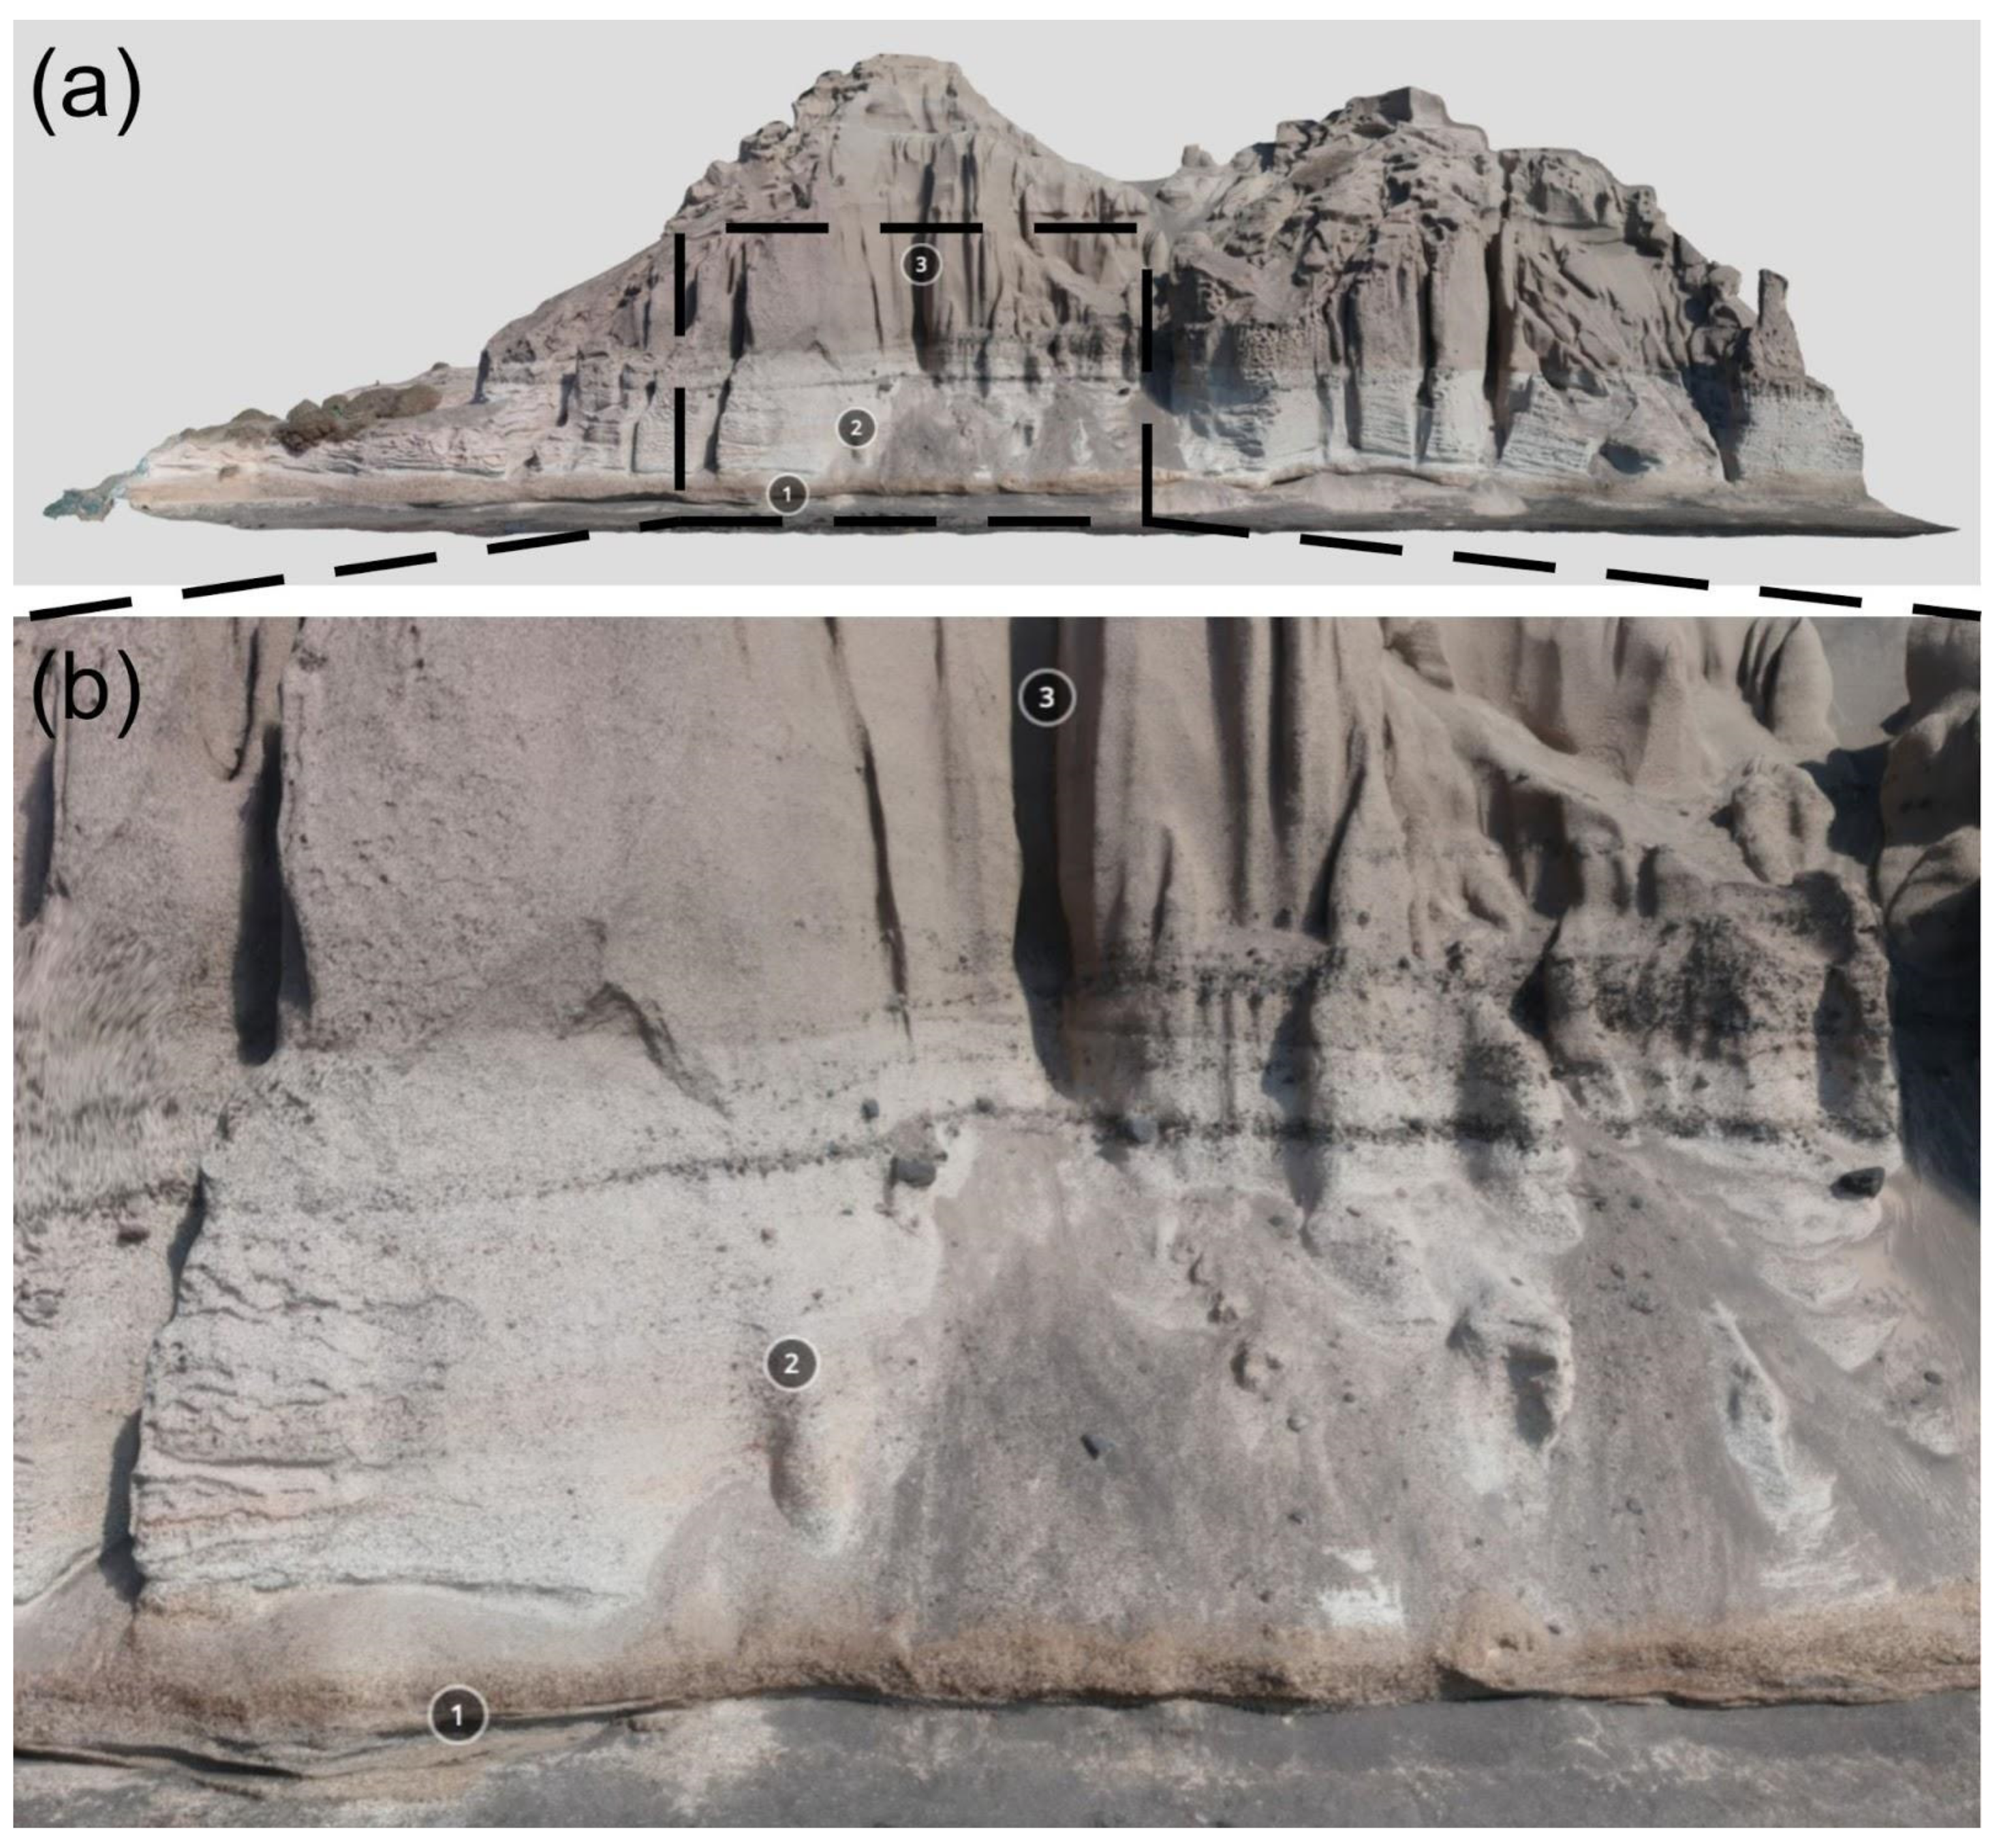
5.1. 1570–1573 AD Volcanic Crater

The Kameni islands (Nea and Palea Kameni) foredate the Minoan caldera. This most destructive collapse (3.6 ka) shaped the island into its current form, and the Kamenis can be characterized as the subaerial deposits of a recent submarine shield [60]. They are located in the centre of the flooded Santorini caldera and are at 470 m above sea level, covering an area of 21 km2 [73]. During the last decade, data taken from bathymetric imagery techniques revealed several submarine flows (pillow lavas), enabling an assessment of a broader area, including the actual morphology and final volume that totals 4.85 ± 0.7 km3 [83].
The magmatic and morphological evolution of the Kameni islands was determined by nine effusive and explosive eruptions, dated from 197 BCE to 1950 [45], which led to the outpouring of dacitic flows that formed domes, craters, levees, layering, folding, and rafty and blocky lavas [49,52]. Moreover, historical eruptions with ash plumes and ballistic ejecta took place [45]. Virtual Geosite 1 (VG1) shows a 3D model of the 1570–1573 AD volcanic crater of Mikra Kameni island, which became connected with Nea Kameni during the 1925–1928 eruption. Mikra Kameni is situated in the NE corner of Nea Kameni (Figure 7). It was extruded during Surtseyan activity that produced ashfall and block fallout deposits and the buildup of a small dacitic lava dome [84]. The latter has an elliptical and elongated shape (102.52 × 95.33 m) and strikes in a N 5° E direction, with a depth of 31.43 m. As suggested by [71], its elongation is consistent with the line connecting the collapsed points of the crater’s rims (pinmark 1), suggesting a possible N 5° E striking magma-feeding fracture. No fumaroles have yet been detected, so there are no signs of recent activity. The summit area is marked by abrupt slopes and the rocks are dacitic in composition with different textures, e.g., compact and scoriaceous (pinmark 3). An open tectonic fracture trends NE–SW (pinmark 2), striking parallel to the inferred magma-feeding fracture.

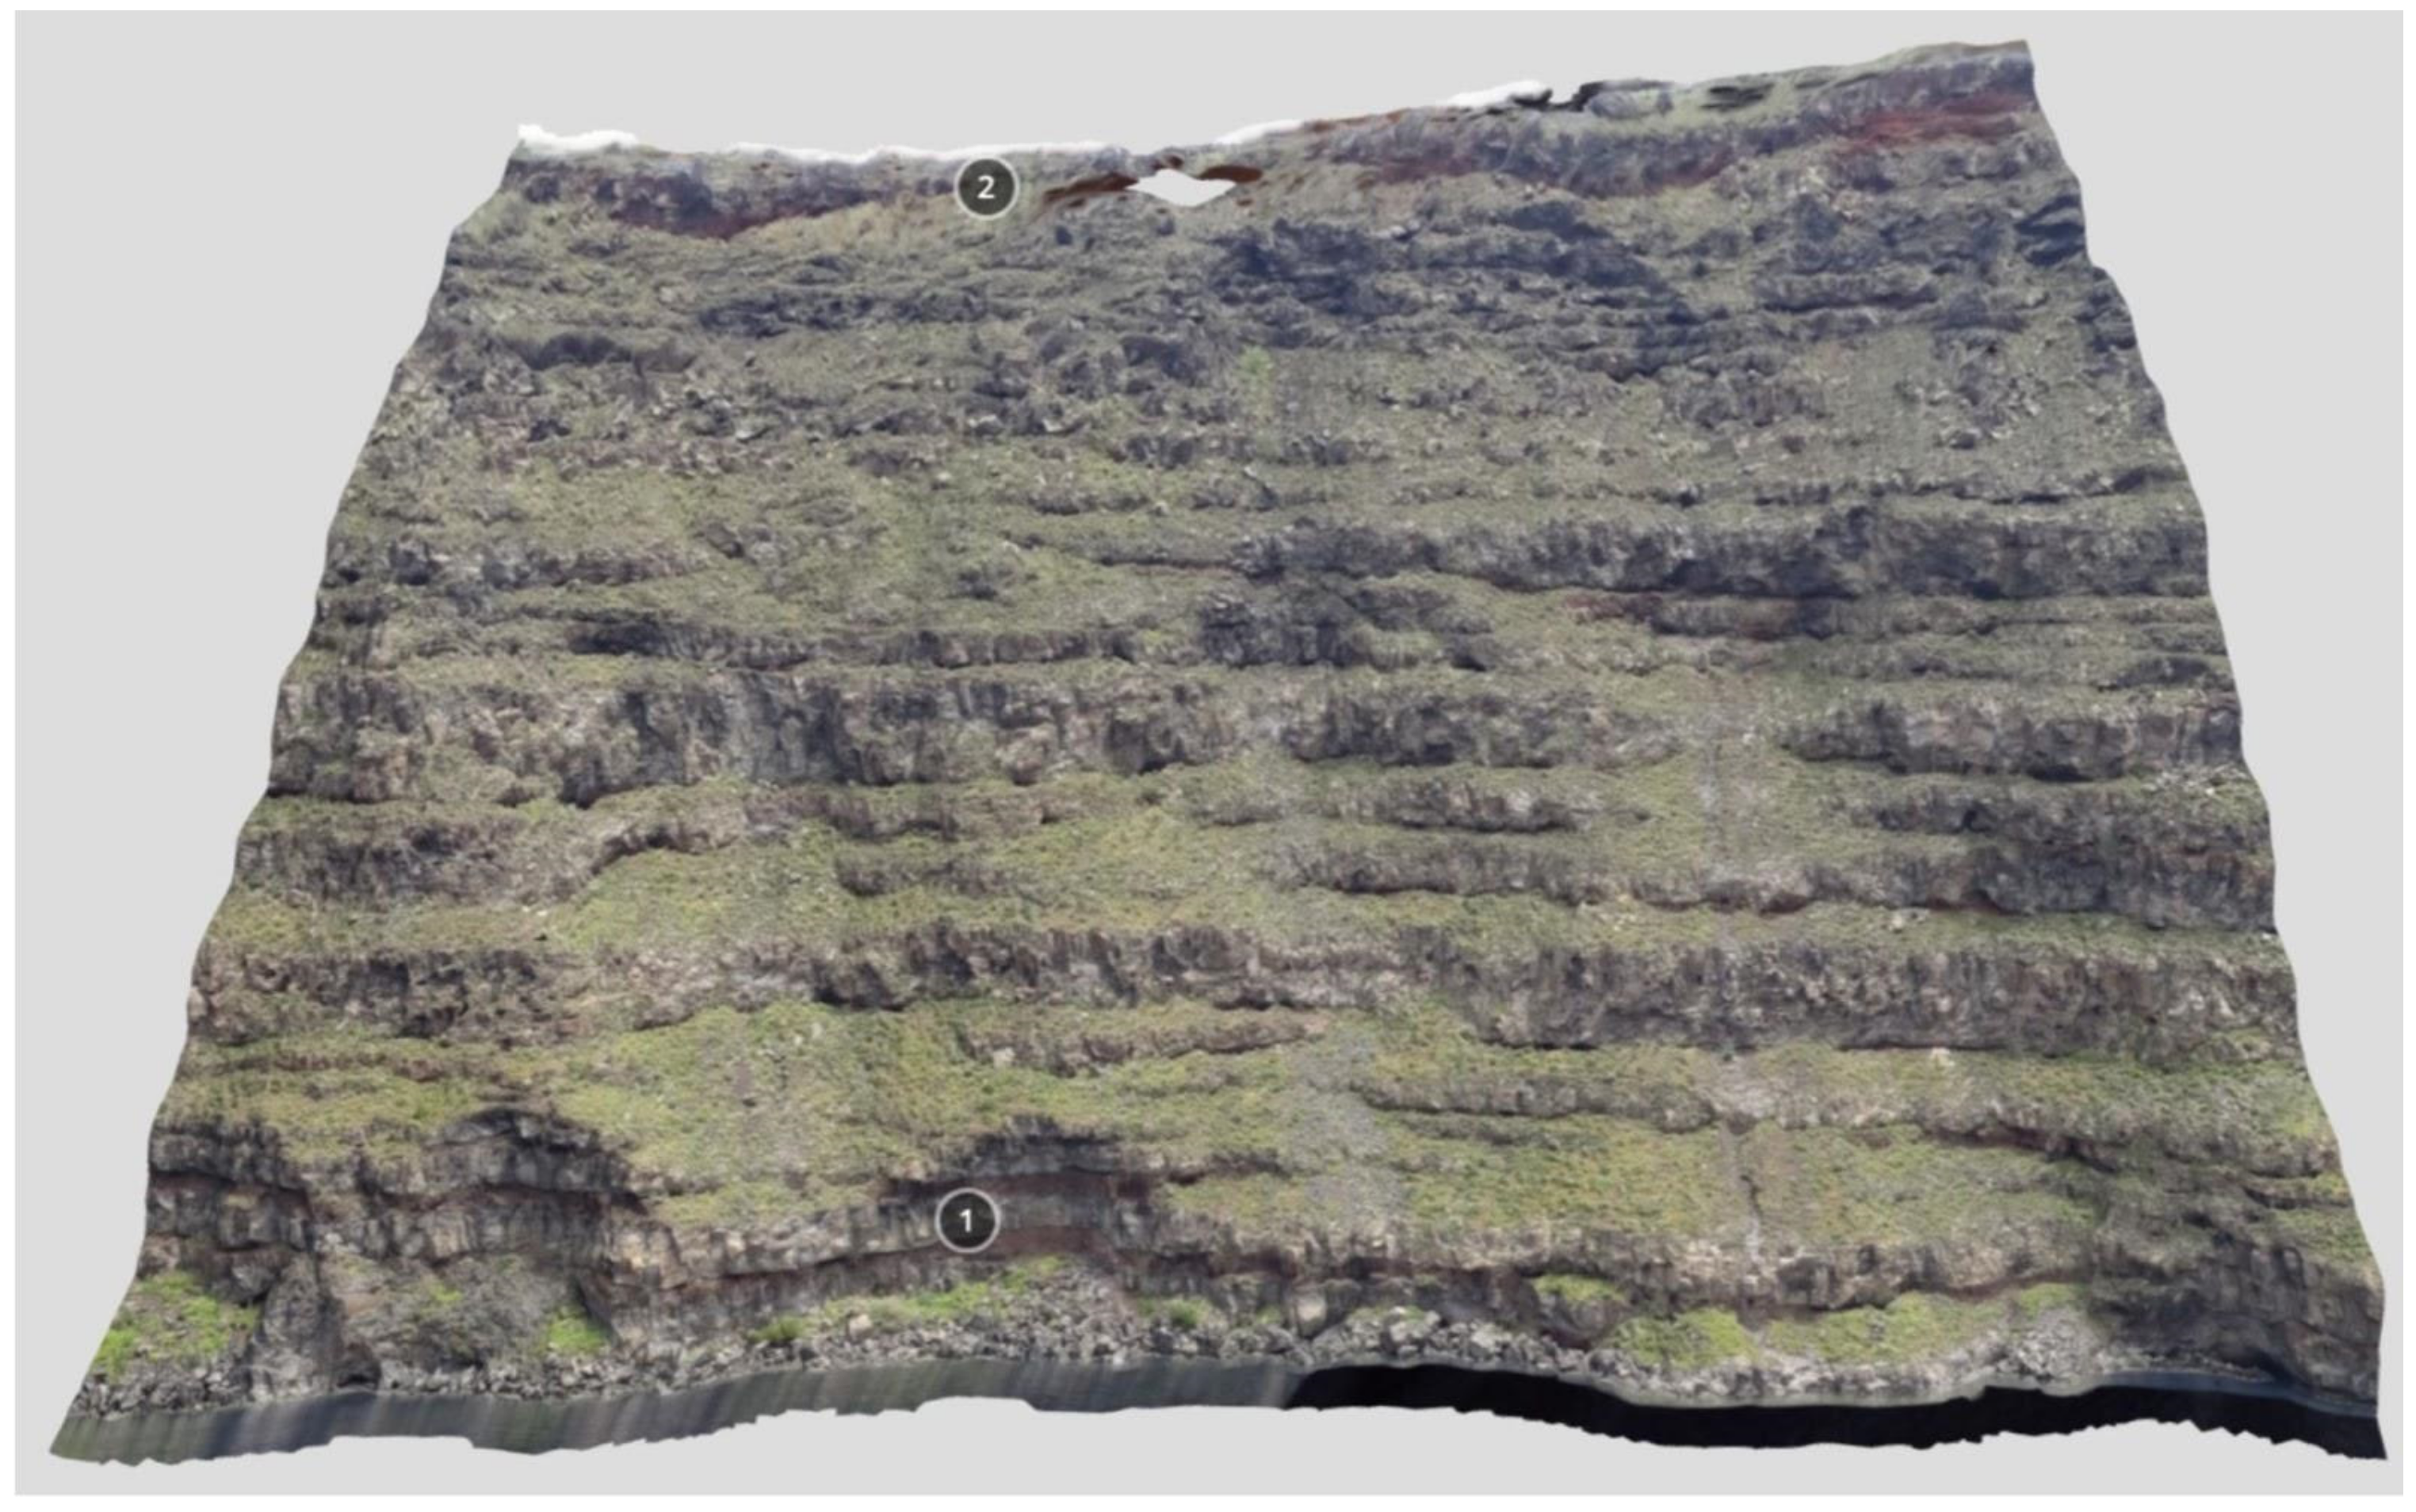
5.2. Dikes on Santorini’s Northern Caldera Cliff

A well-exposed local dike swarm is visible on the northern caldera cliffs and represents the volcanic activity in the area during the time span 530–522 ka [43,55,56]. In detail, five main volcanic phases can be recognized: (i) the Peristeria volcanic activity (530–530 ka), (ii) the Simandiri shield (172 ka), (iii) the Megalo and Kokkino Vouno cinder cones (125–180 ka), (iv) the Skaros shield (70–54 ka), and the Therasia dome complex (54–22 ka). These phases formed a succession that consists mainly of breccia, hyaloclastite, tuff, lava flows, and scoria deposits. Moreover, the host rock is dissected by normal and strike-slip faults [43,56].
Virtual Geosite 2 (VG2) encompasses an area of 730 × 300 m in the NE section of the cliffs (view towards the NE, Figure 8a) of the northern caldera wall, where an active fault zone (pinmark 1, Figure 8b) is observed [85], along with other inactive faults (pinmark 2, Figure 8b) into which dikes are preferentially deflected [56].
In detail, the model shows a panorama of the northern caldera cliff, cut by several subvertical dikes (extensional magma-filled fractures) (pinmark 3, Figure 8b). The one to the east (right) strikes about NE–SW (pinmark 4, Figure 8c) while a silicic, 8 m-thick dike (left) lies between the fault zones (pinmark 5, Figure 8b). The dikes are found to follow different pathways while they were emplaced on the caldera wall, as a consequence of the differences in material properties of the crustal segments through which magma propagated (highly heterogeneous and anisotropic). The contrasting stiffness and variable thickness of the layers, the mechanical properties of the pre-existing fractures (e.g., faults), and the geometrical parameters of the host rock can deviate a dike’s path towards the surface, resulting in deflected, arrested, or feeder dikes [55,56].

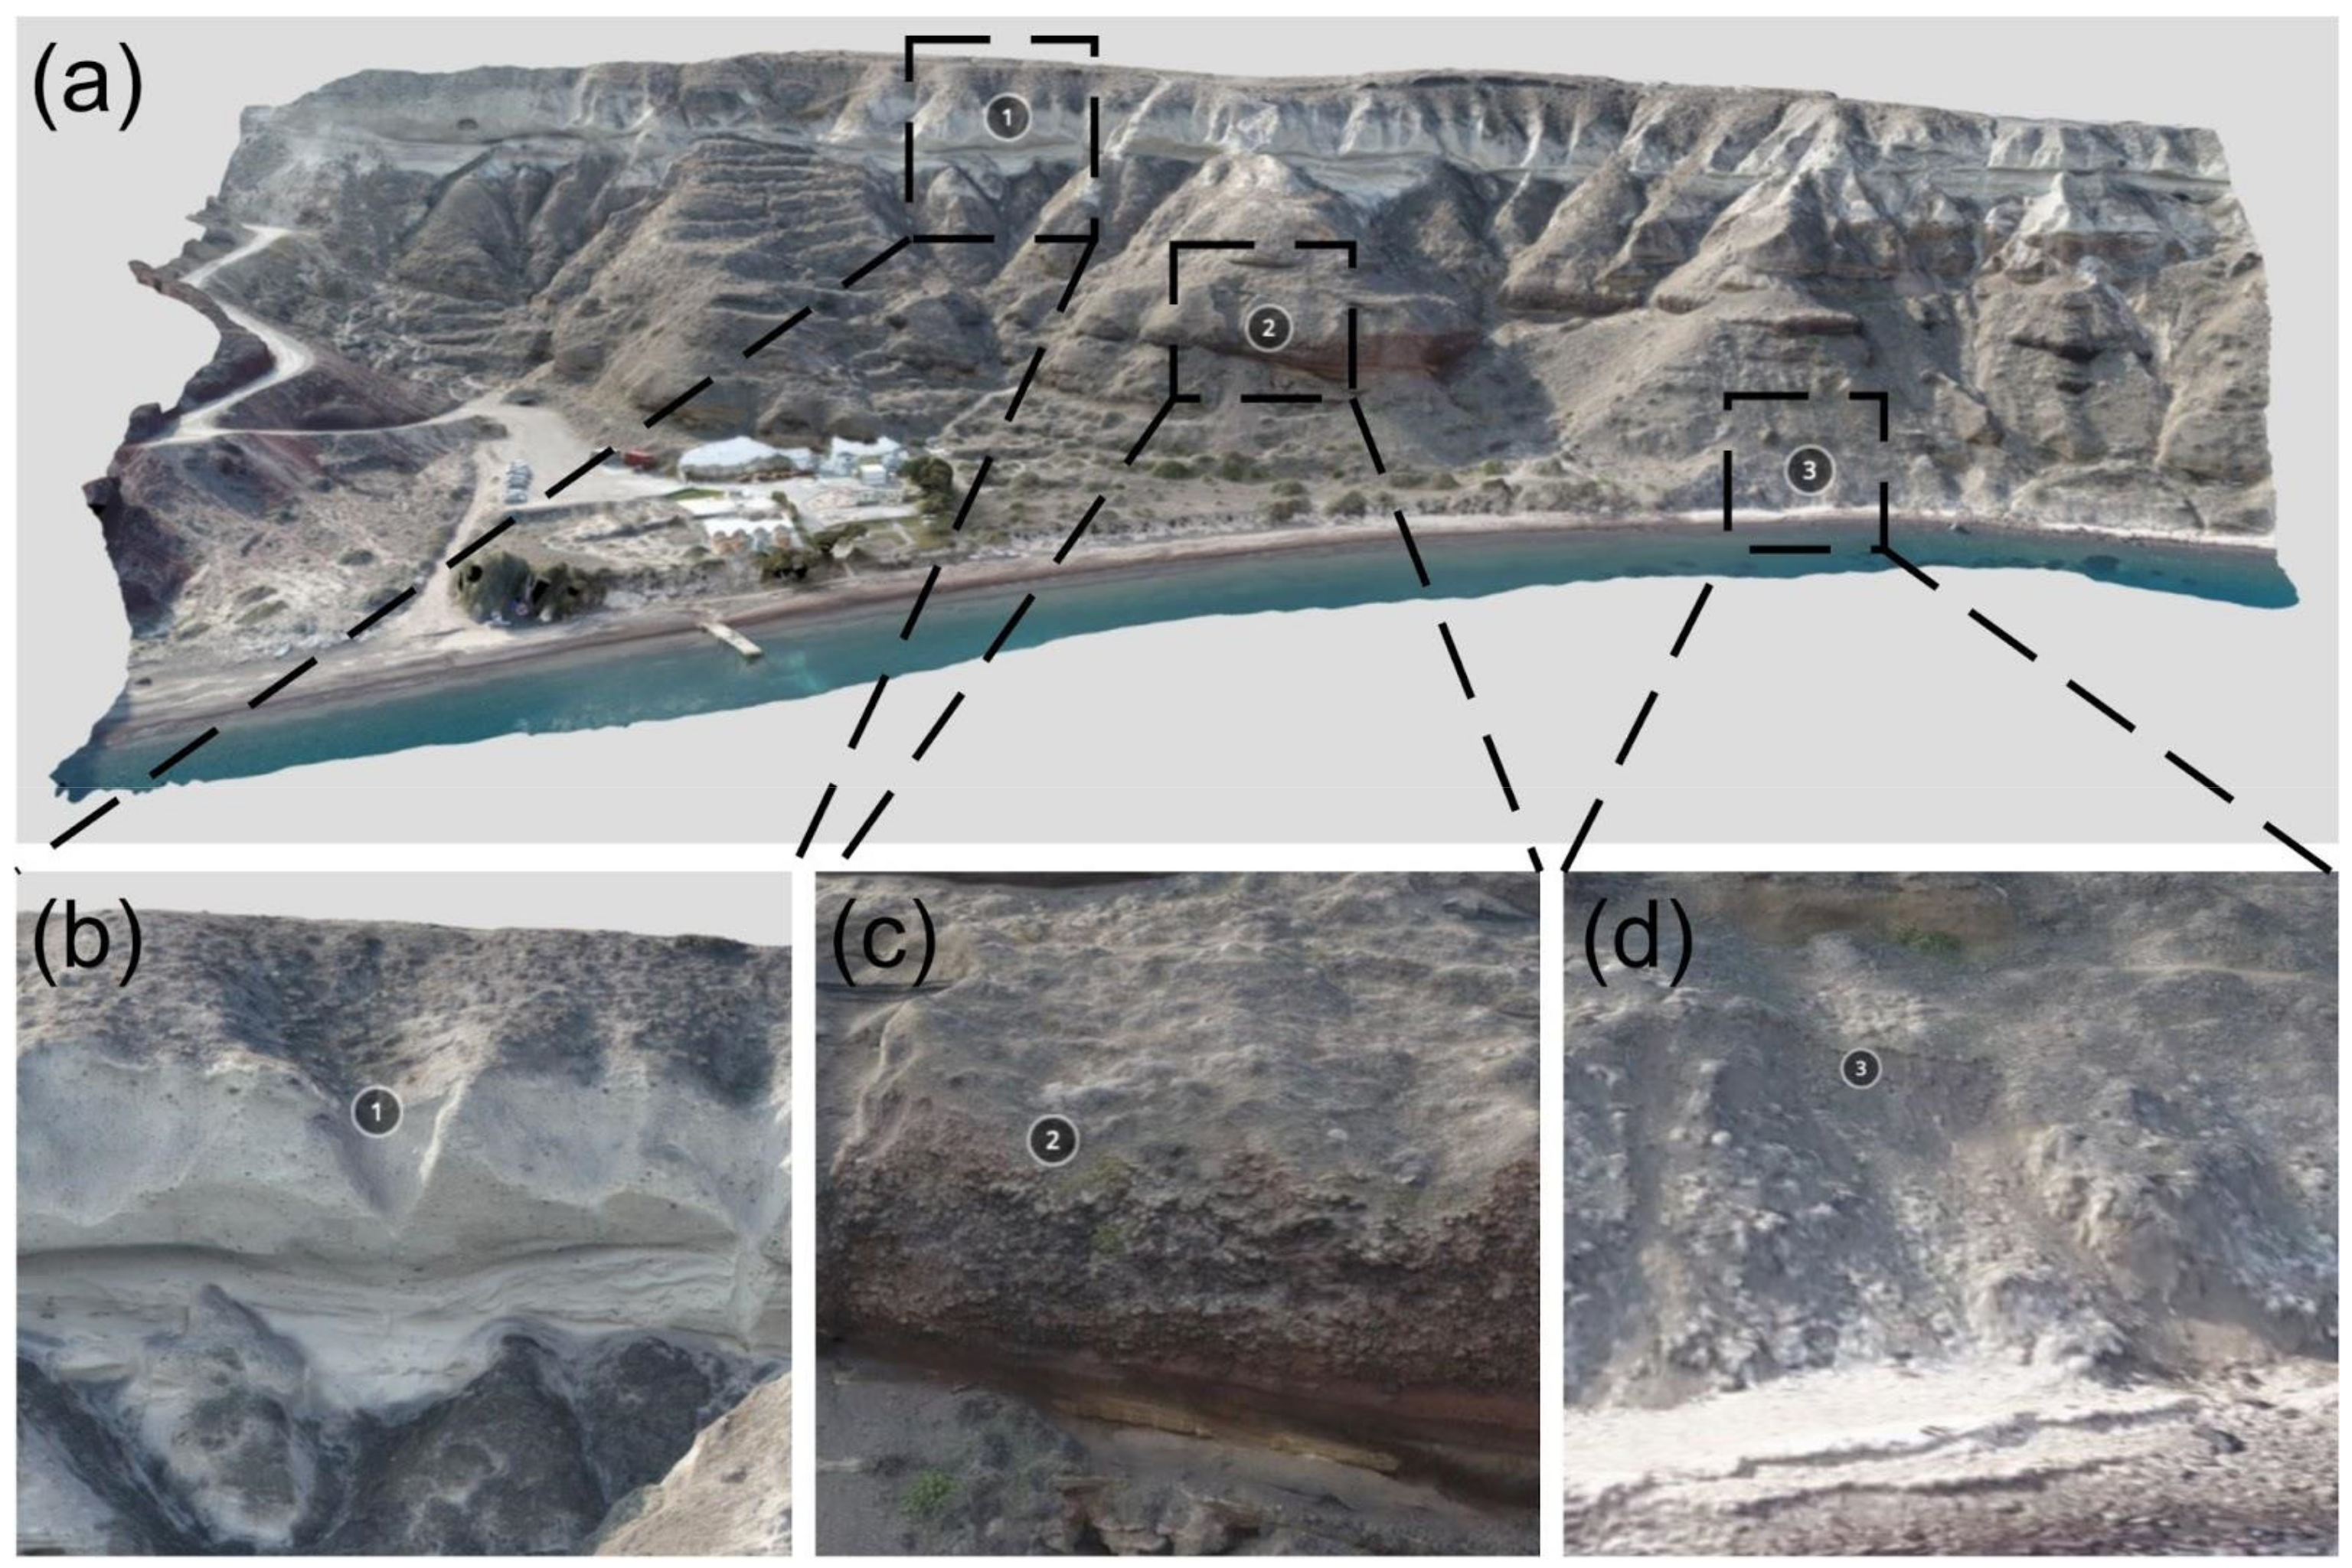
5.3. Vlychada Beach: Minoan (LBA) Deposits

The geosite of Vlychada beach is located along the southern coastline of Santorini, and it is originated from the famous Late Bronze Age (LBA) eruption [73] (Figure 9a). The LBA eruption markedly influenced the decline of the Minoan civilization in the Aegean Sea and Crete; thus, it represents an emblematic event during the archaeological era [60,86]. The eruption discharged between 30 and 80 km3 DRE [87] of rhyodacitic magma, mainly in the form of ignimbrite deposits [66]. Volcanic products from the Minoan P2 to P4 phases can be found along the coast (Figure 9a,b). Pyroclastic surge deposits represent a small portion of phase P2 (at the bottom) (pinmark 1). Phase P3, the coarse-grained phreatomagmatic ignimbrite, can be found in the middle (pinmark 2) [60]. Phase P4, which stands at the top, led to the deposition of the so-called tan ignimbrite [60] (pinmark 3). Virtual Geosite 3 (VG3) extends across an area of 125 × 55 m, with a maximum height of 38 m. It is possible to notice the contact and morphology of the three phases (2–4) mentioned above.

5.4. Sandy Beach

Virtual Geosite 4 (VG4) is a 3D model of the sandy beach located between Cape Aspronisi and Cape Loumavari in the southern part of the main volcanic island. The model extends across an area of 420 × 250 m, with a height of 91 m. The outcrop comprises the cinder cones of the Akrotiri peninsula with welded pyroclastic deposits and lava flows to the east. To the west are found the Cape Riva tuffs (rhyodacitic pumice) in the upper part (pinmark 1Figure 10a), a part of upper scoria 2 (US2) (pyroclastic deposits) in the middle part (pinmark 2Figure 10b), and the middle tuffs (andesitic to dacitic pyroclastic deposits) close to the beach (pinmark 3Figure 10c); all are volcanic products of the second explosive cycle [43,88].

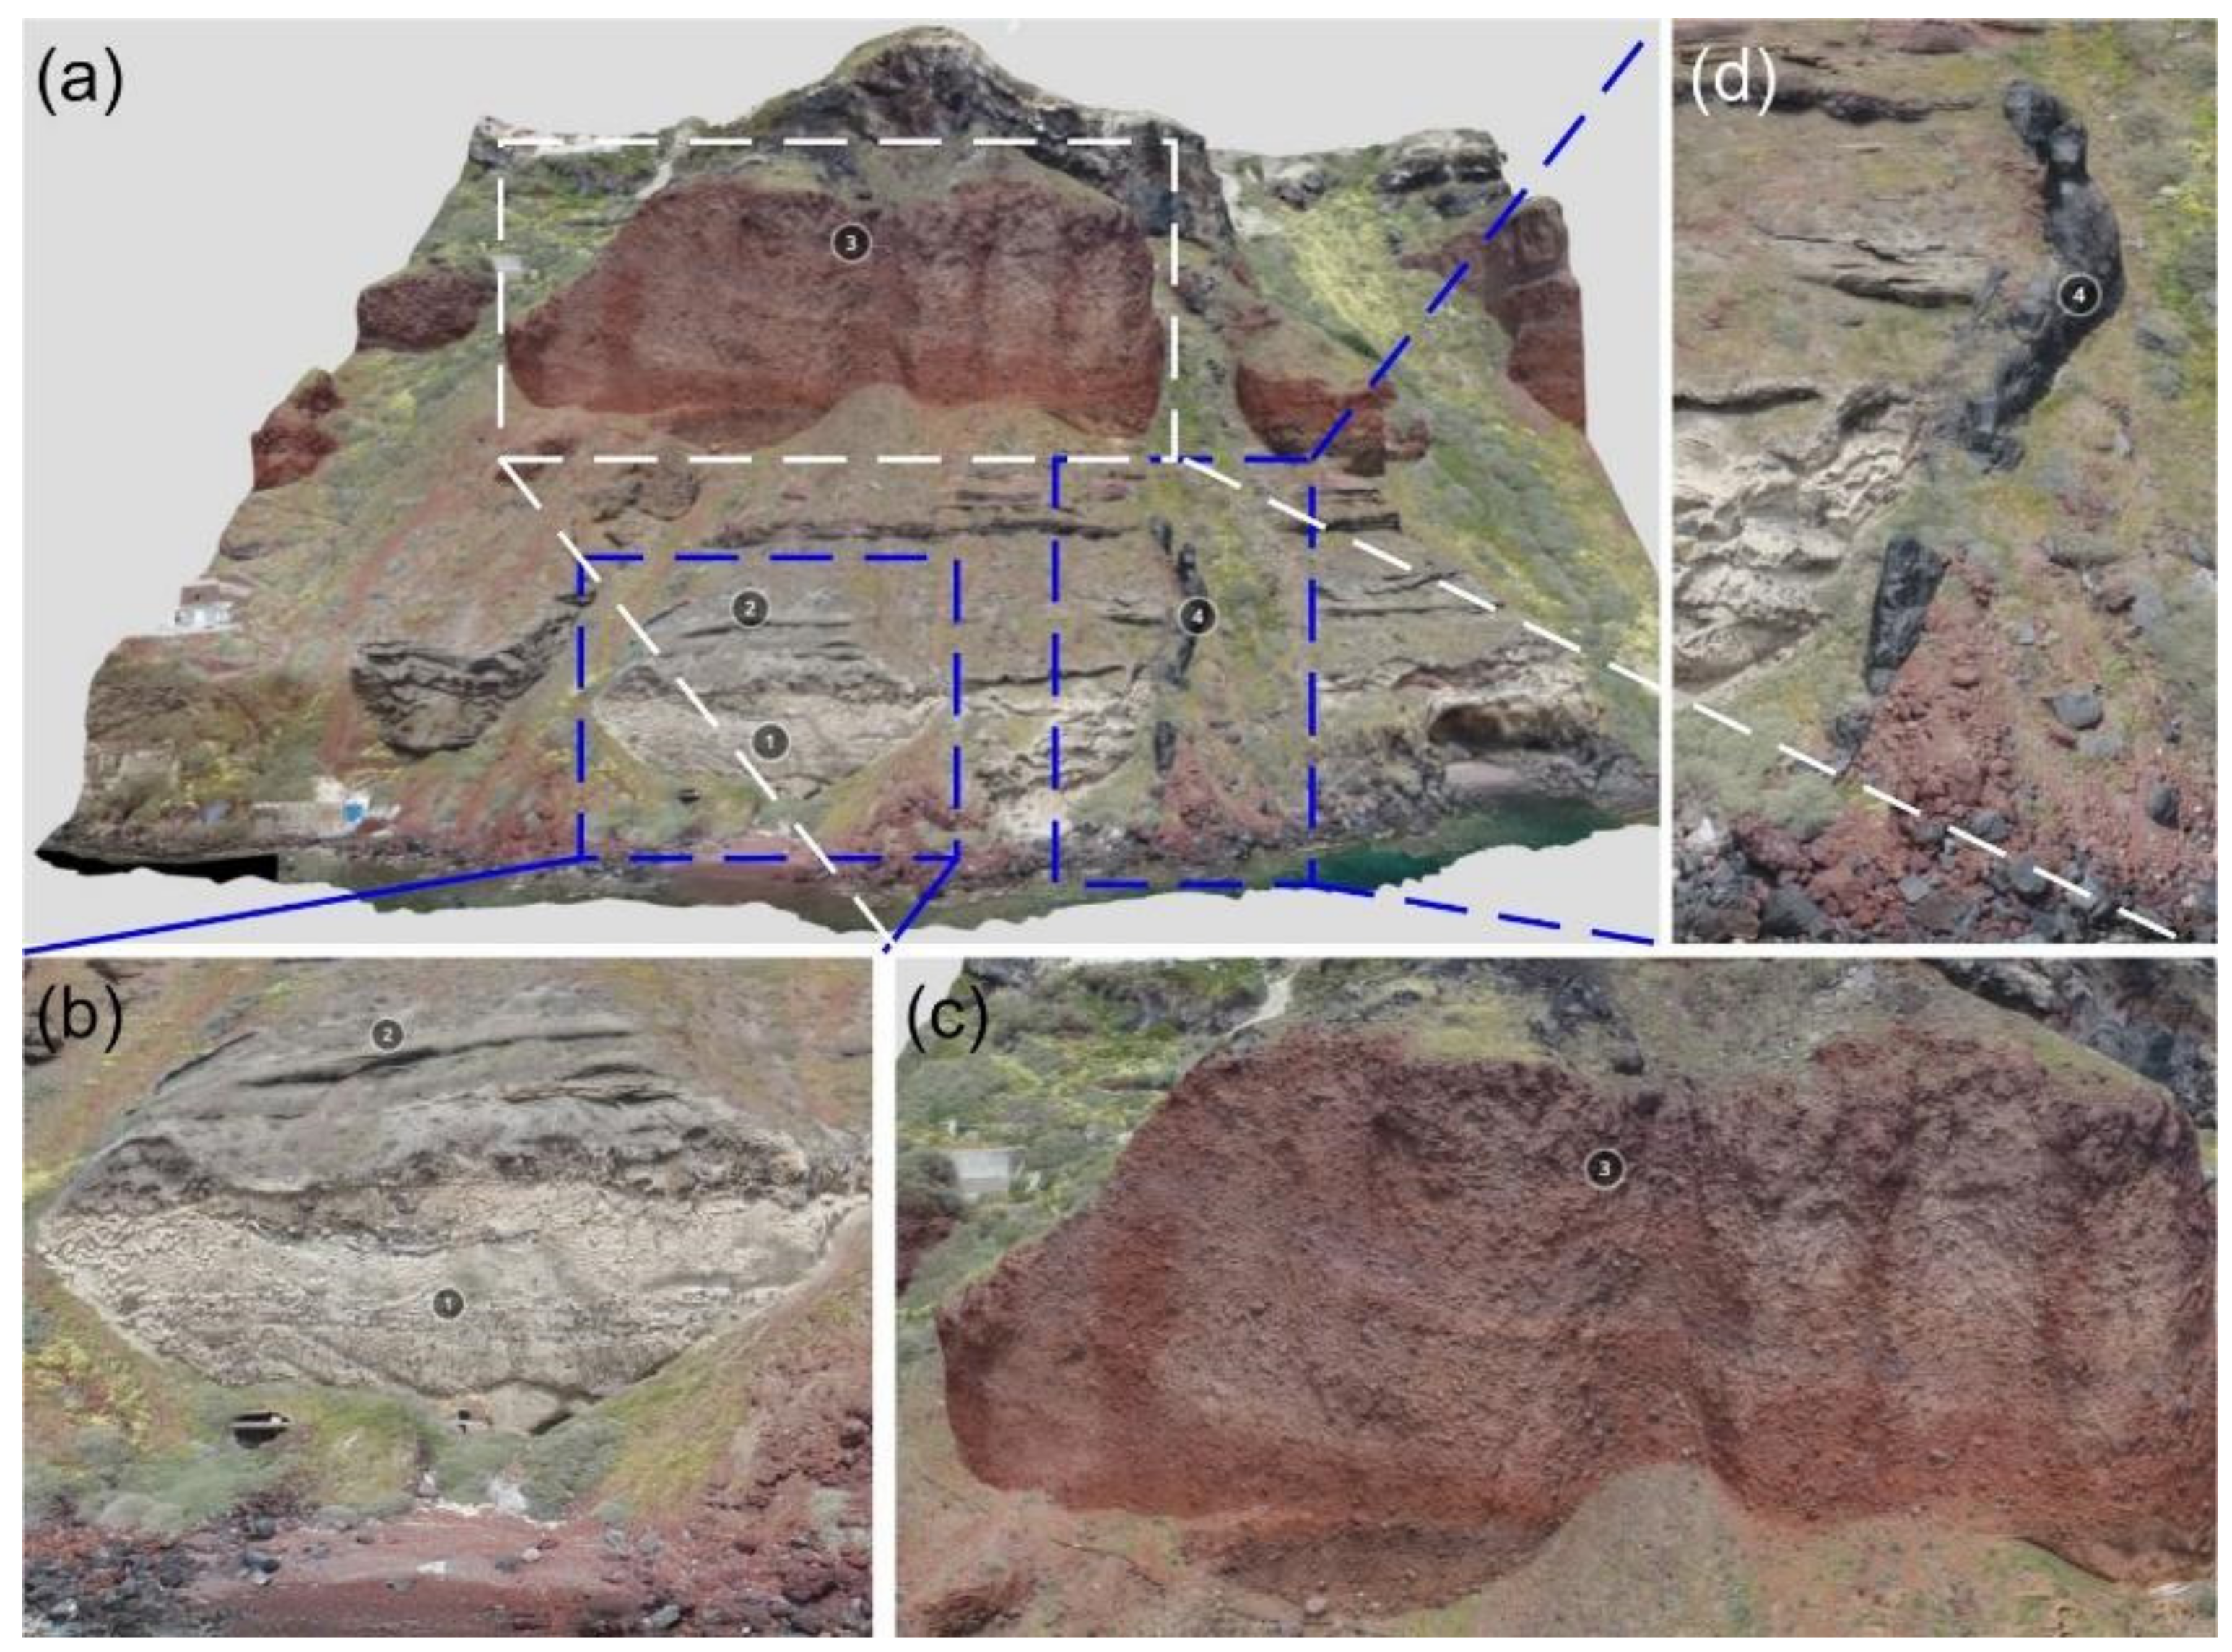
5.5. Scoria Deposit and Dikes
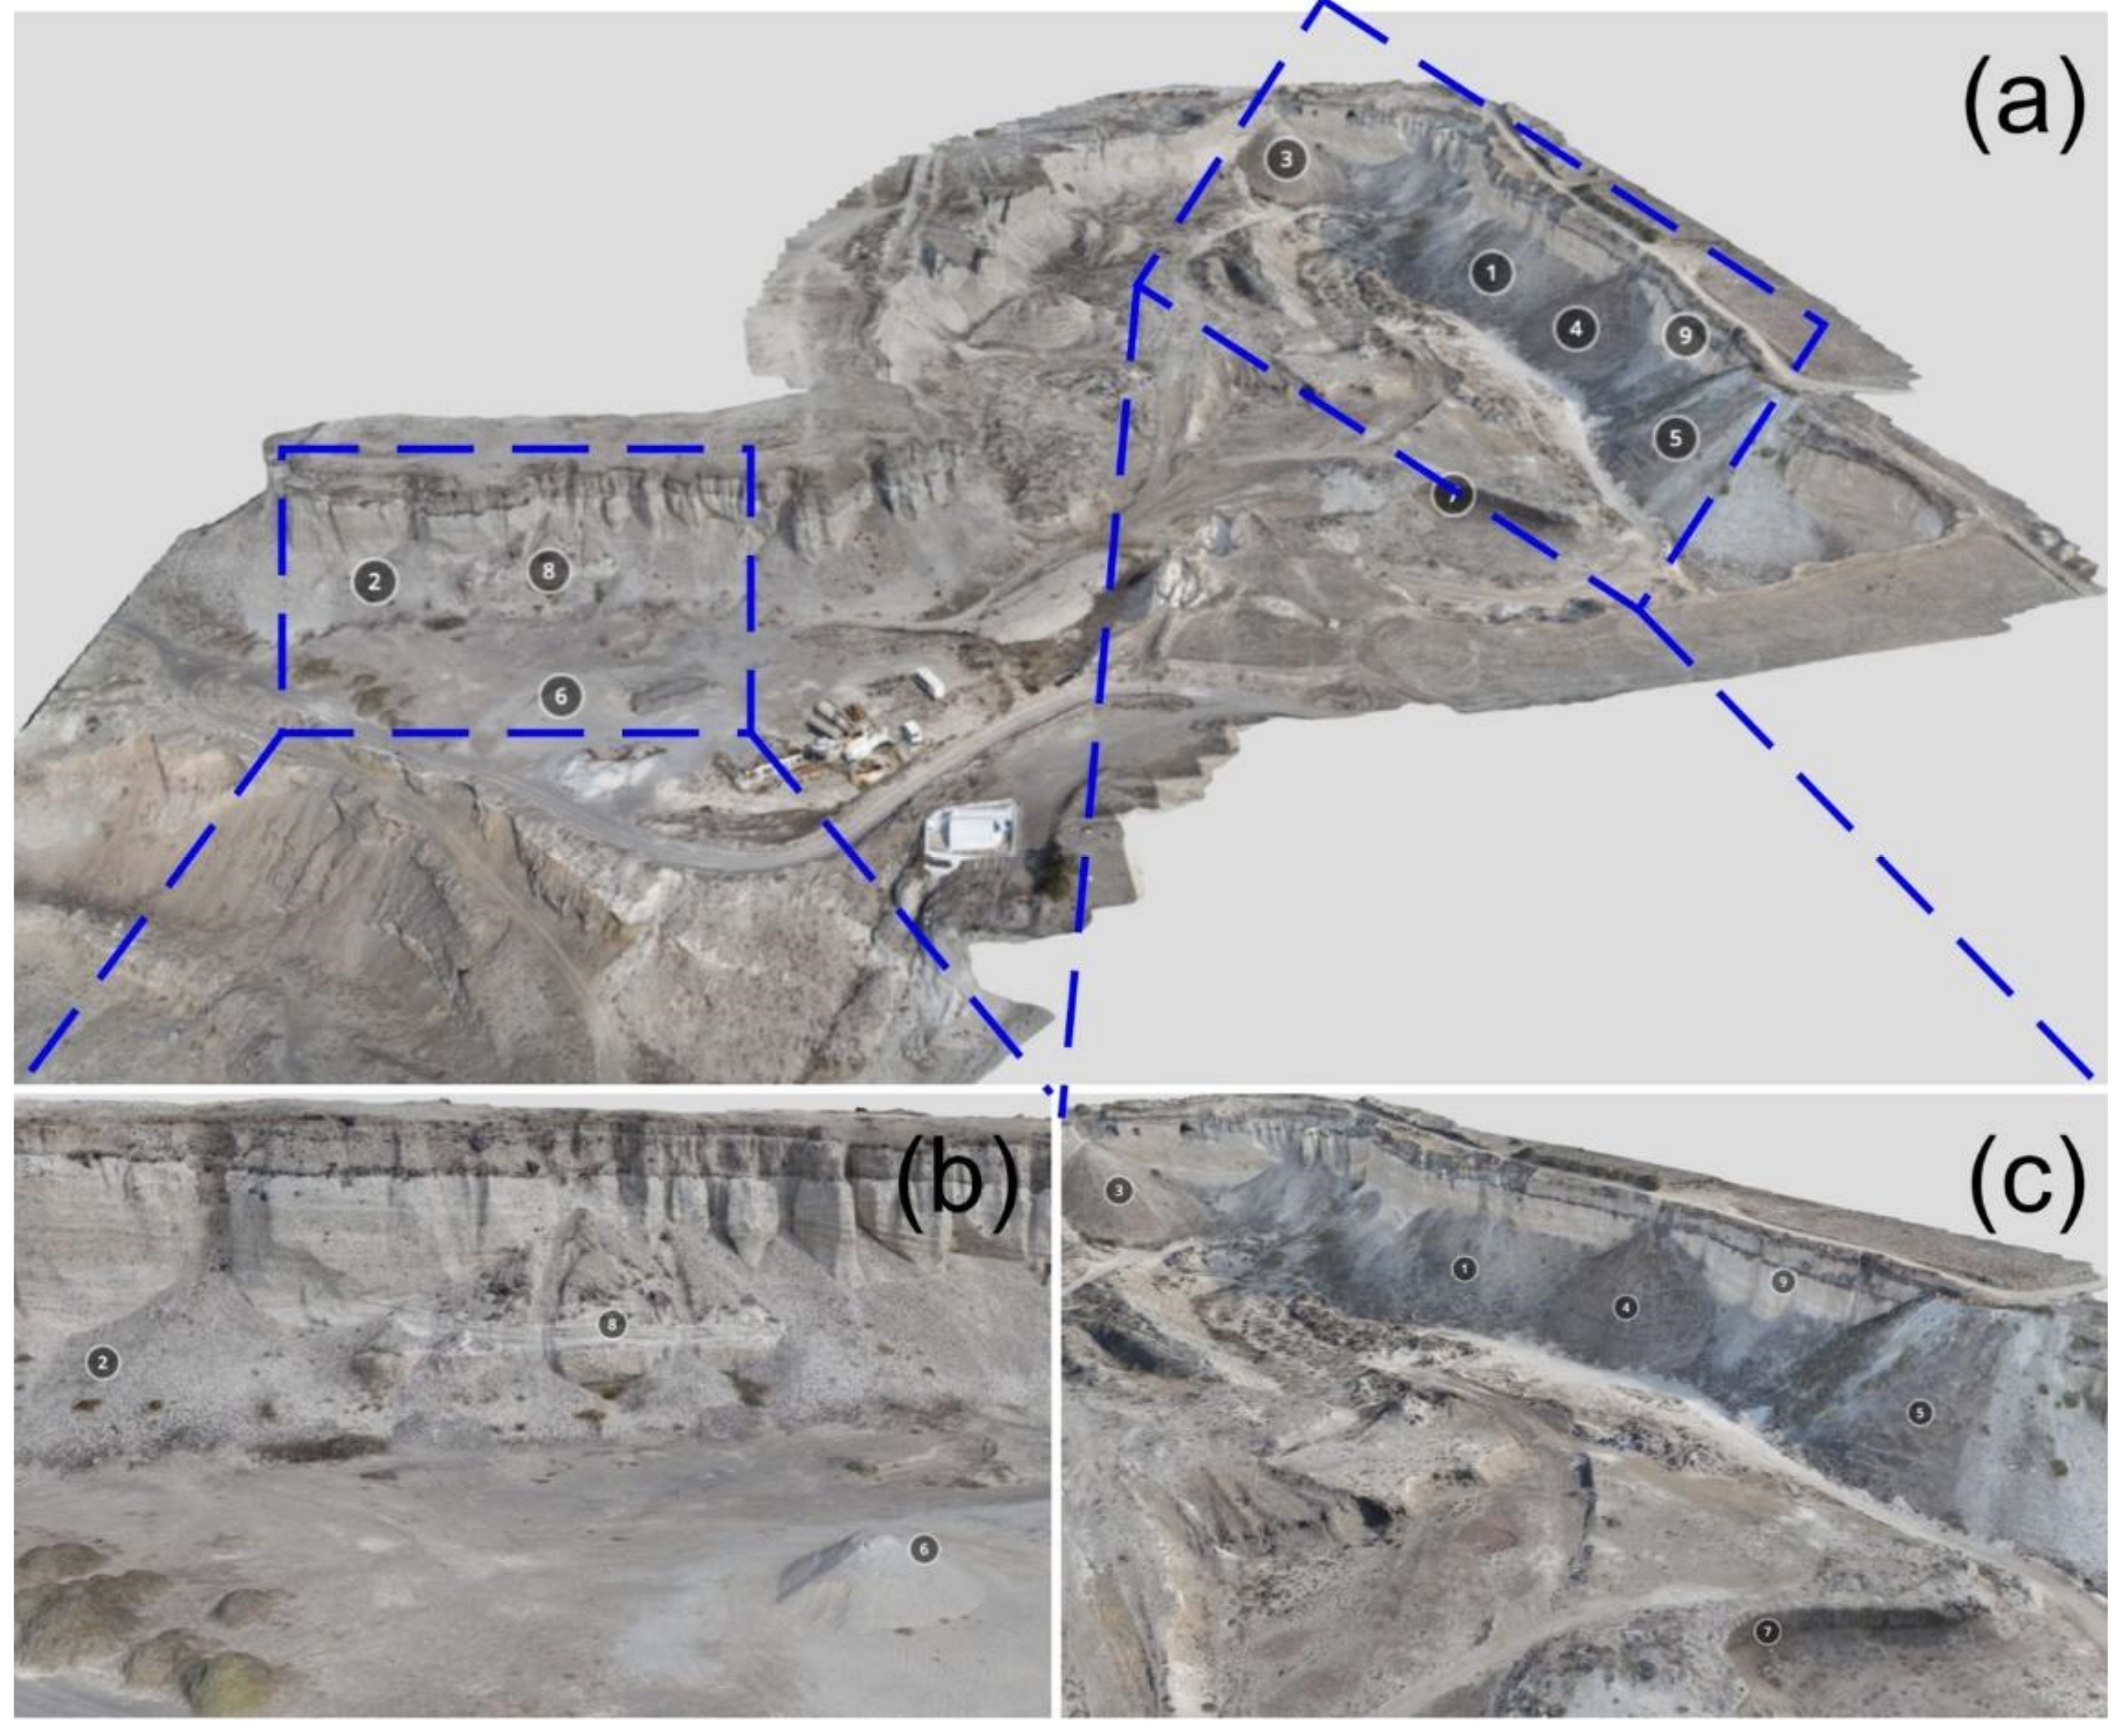
Virtual Geosite 5 (VG5) is located in the Oia village and shows a section of the northern caldera cliff. The 3D model covers an area of 185 × 160 m and a height of 95 m (Figure 11a). The view shows a cliff section, which comprises pyroclastic deposits at the bottom (pinmark 1, Figure 11b) and the middle parts (pinmark 2, Figure 11b). At the top lies US2, dominated by red agglomerate and subordinate lithic breccias laid down by scoria flows [57,89] (pinmark 3, Figure 11c). A vertical basaltic andesitic magma-filled fracture can be observed, emplaced on the caldera wall (pinmark 4, Figure 11d). Combined volcanotectonic and petrological studies have shown that the dike was likely arrested and did not feed any volcanic activity at the surface [55].

5.6. Metaxa Mine

Metaxa Mine (or Mavromatis Mine) lies close to Megalochori village in the central part of the island. The owner of the mine “HERMES” SA, Anastasios Mavromatis, began pumice mining activity in 1973–1974, which lasted until 1984. Currently, it is a well-known volcanological geosite (Figure 12a) that exposes the products of the Minoan eruption. It also can be regarded as an industrial heritage site. In the mine, the outcrops form distinct morphologies of vertical cliffs, debris-flow deposits (pinmarks 1, 2Figure 12a–c), and anthropogenic interventions (pinmarks 3, 4, 5Figure 12a,c). In contrast, across the floor there are numerous tiny hills of excavated materials (pinmarks 6, 7Figure 12a–c). Five distinct phases of the eruption can be seen at the entrance of the mine across a length of 150 m at the so-called Late Bronze Age (LBA) famous section (pinmark 8Figure 12a,b) [73]; elsewhere in the mine, only Phase 2 (pinmark 9Figure 12a,c) and Phase 4 can be recognized [54].

5.7. The Late Bronze Age Famous Section

Virtual Geosite 7 (VR7) represents, in 3D, the volcanic products of the pre-Minoan (pinmark 1) and Minoan phases. In detail, from the bottom to the top, the following can be observed: P0 phase, the lapilli fallout of the precursor LBA eruption (pinmark 2), and P1, the reverse-graded pumice fallout (pinmark 3). P2 is subdivided into P2a, fine-grained accretionary lapilli (pinmark 4) and P2b, pyroclastic surge deposits (pinmark 5). Finally, P4, the fine-grained, nonwelded ignimbrite (pinmark 6) covers the area on top (Figure 13) [43].

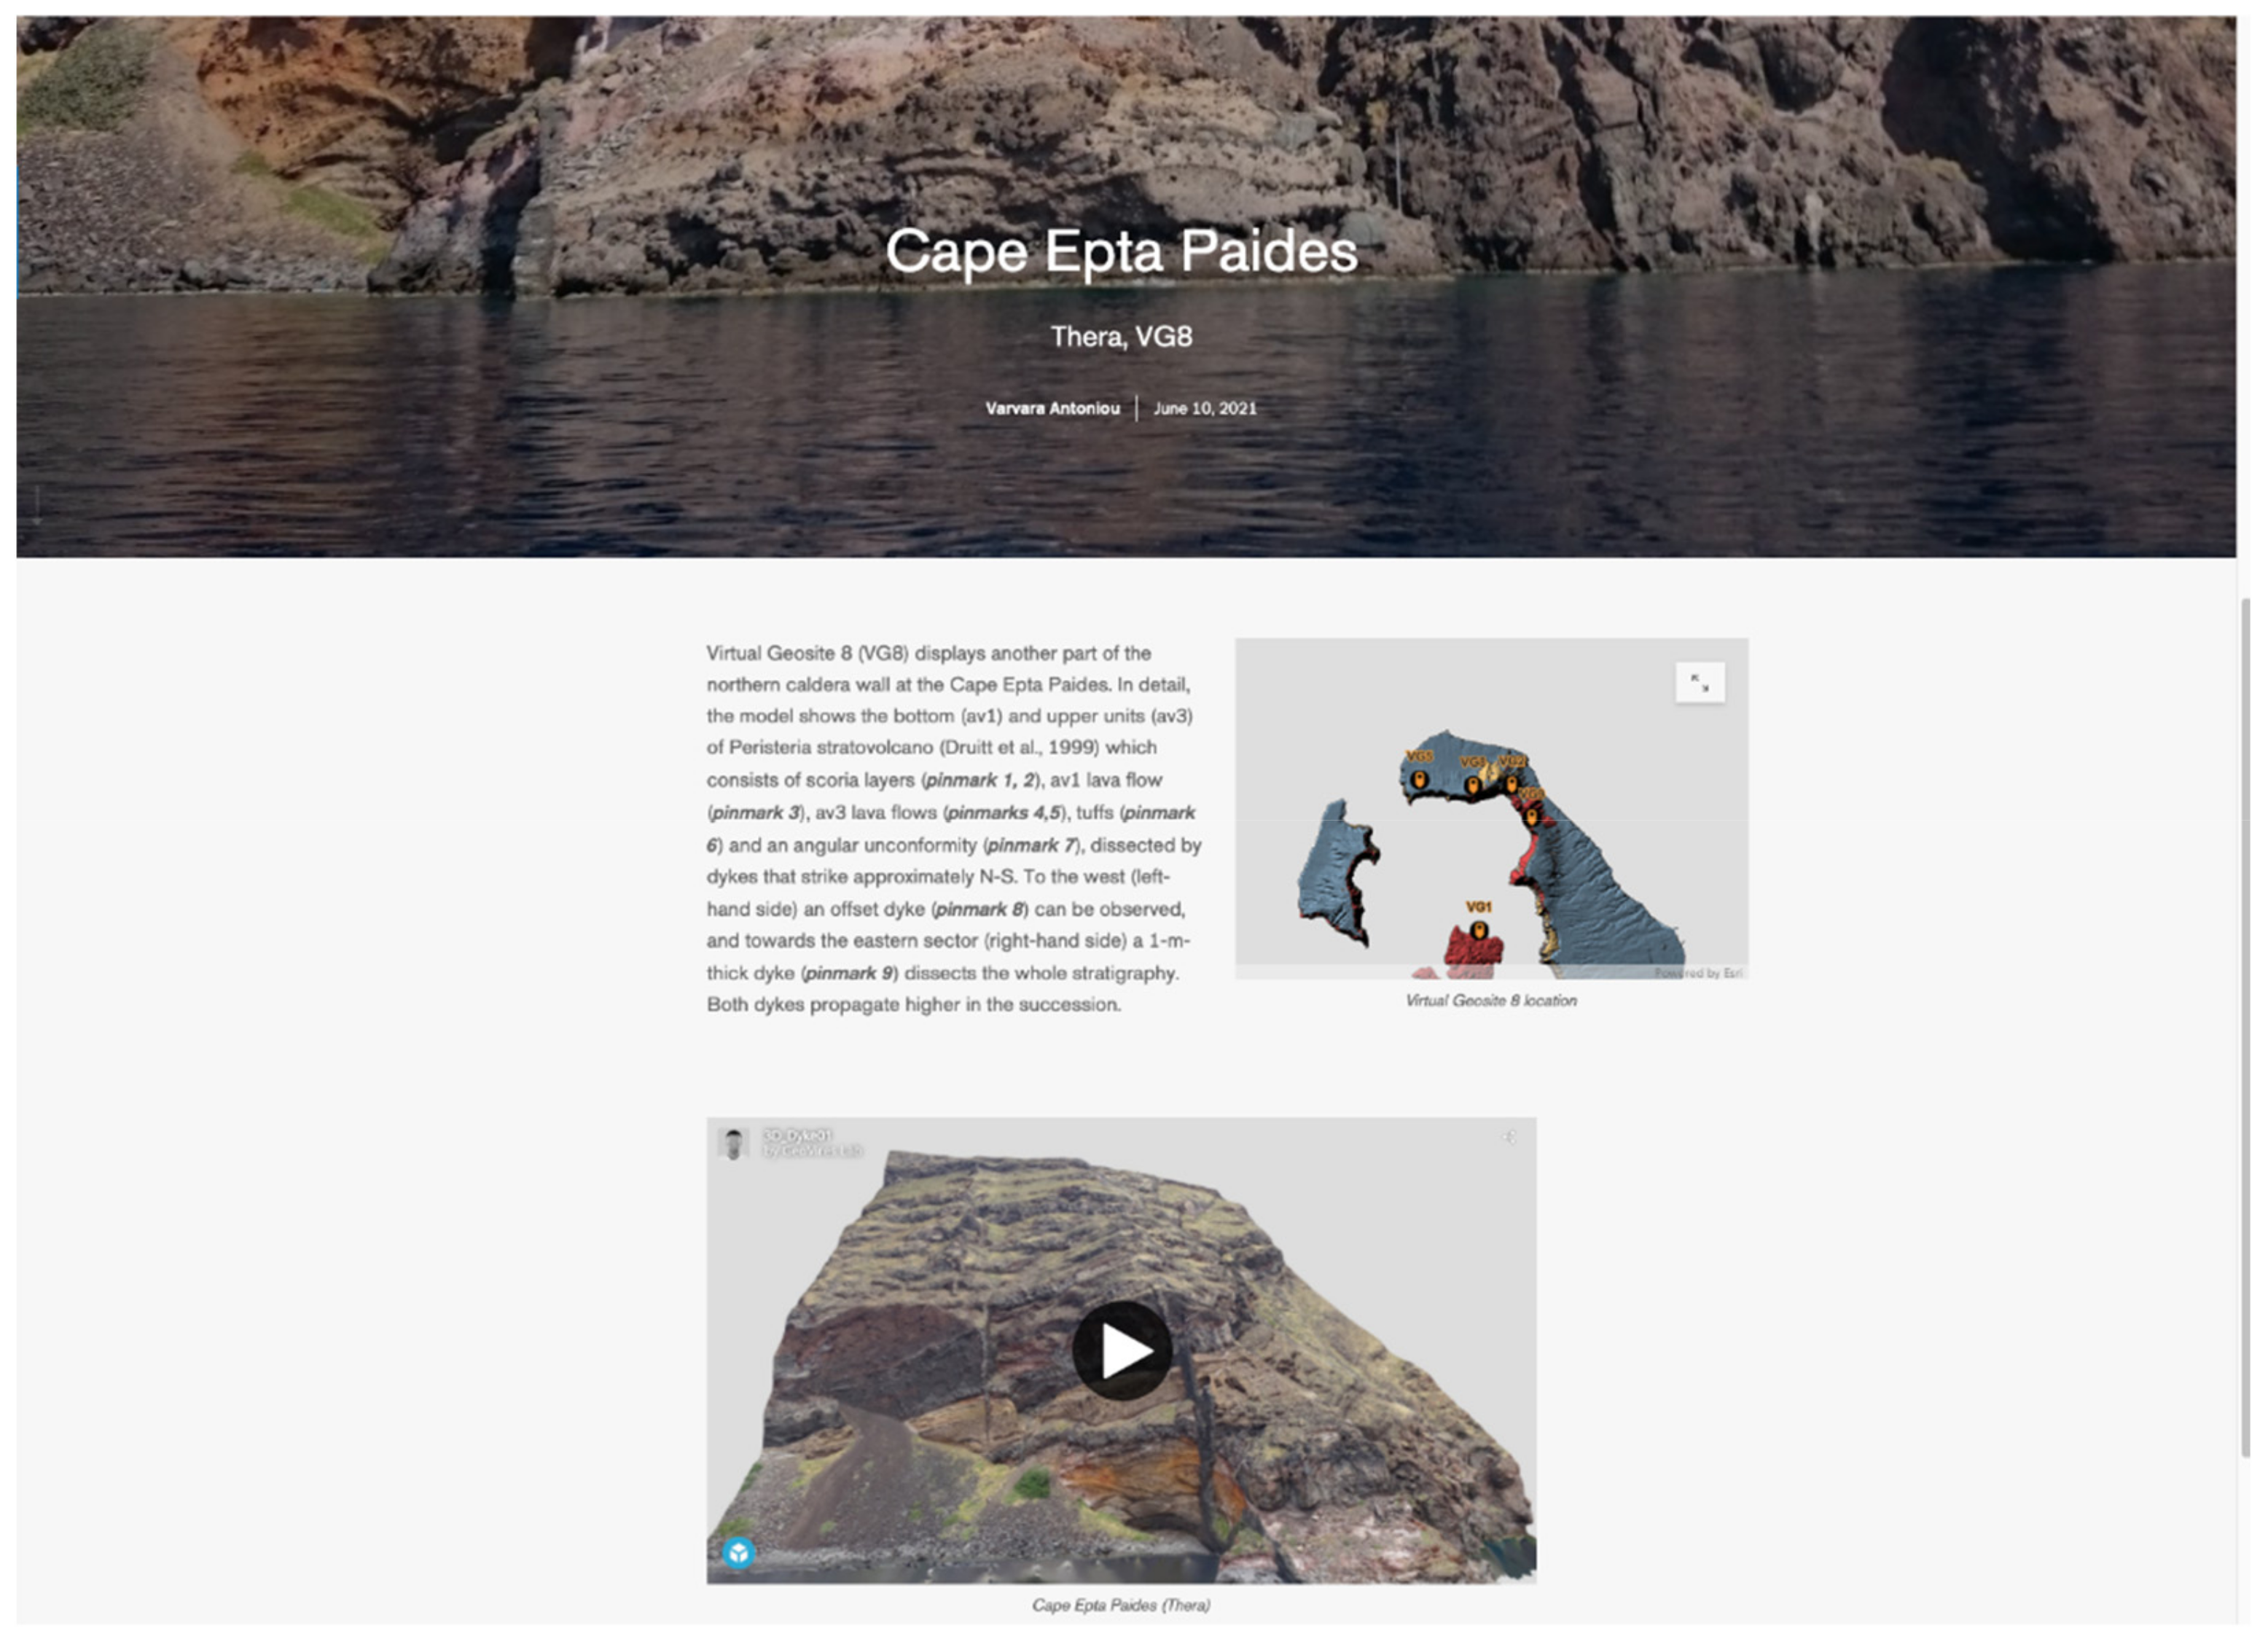
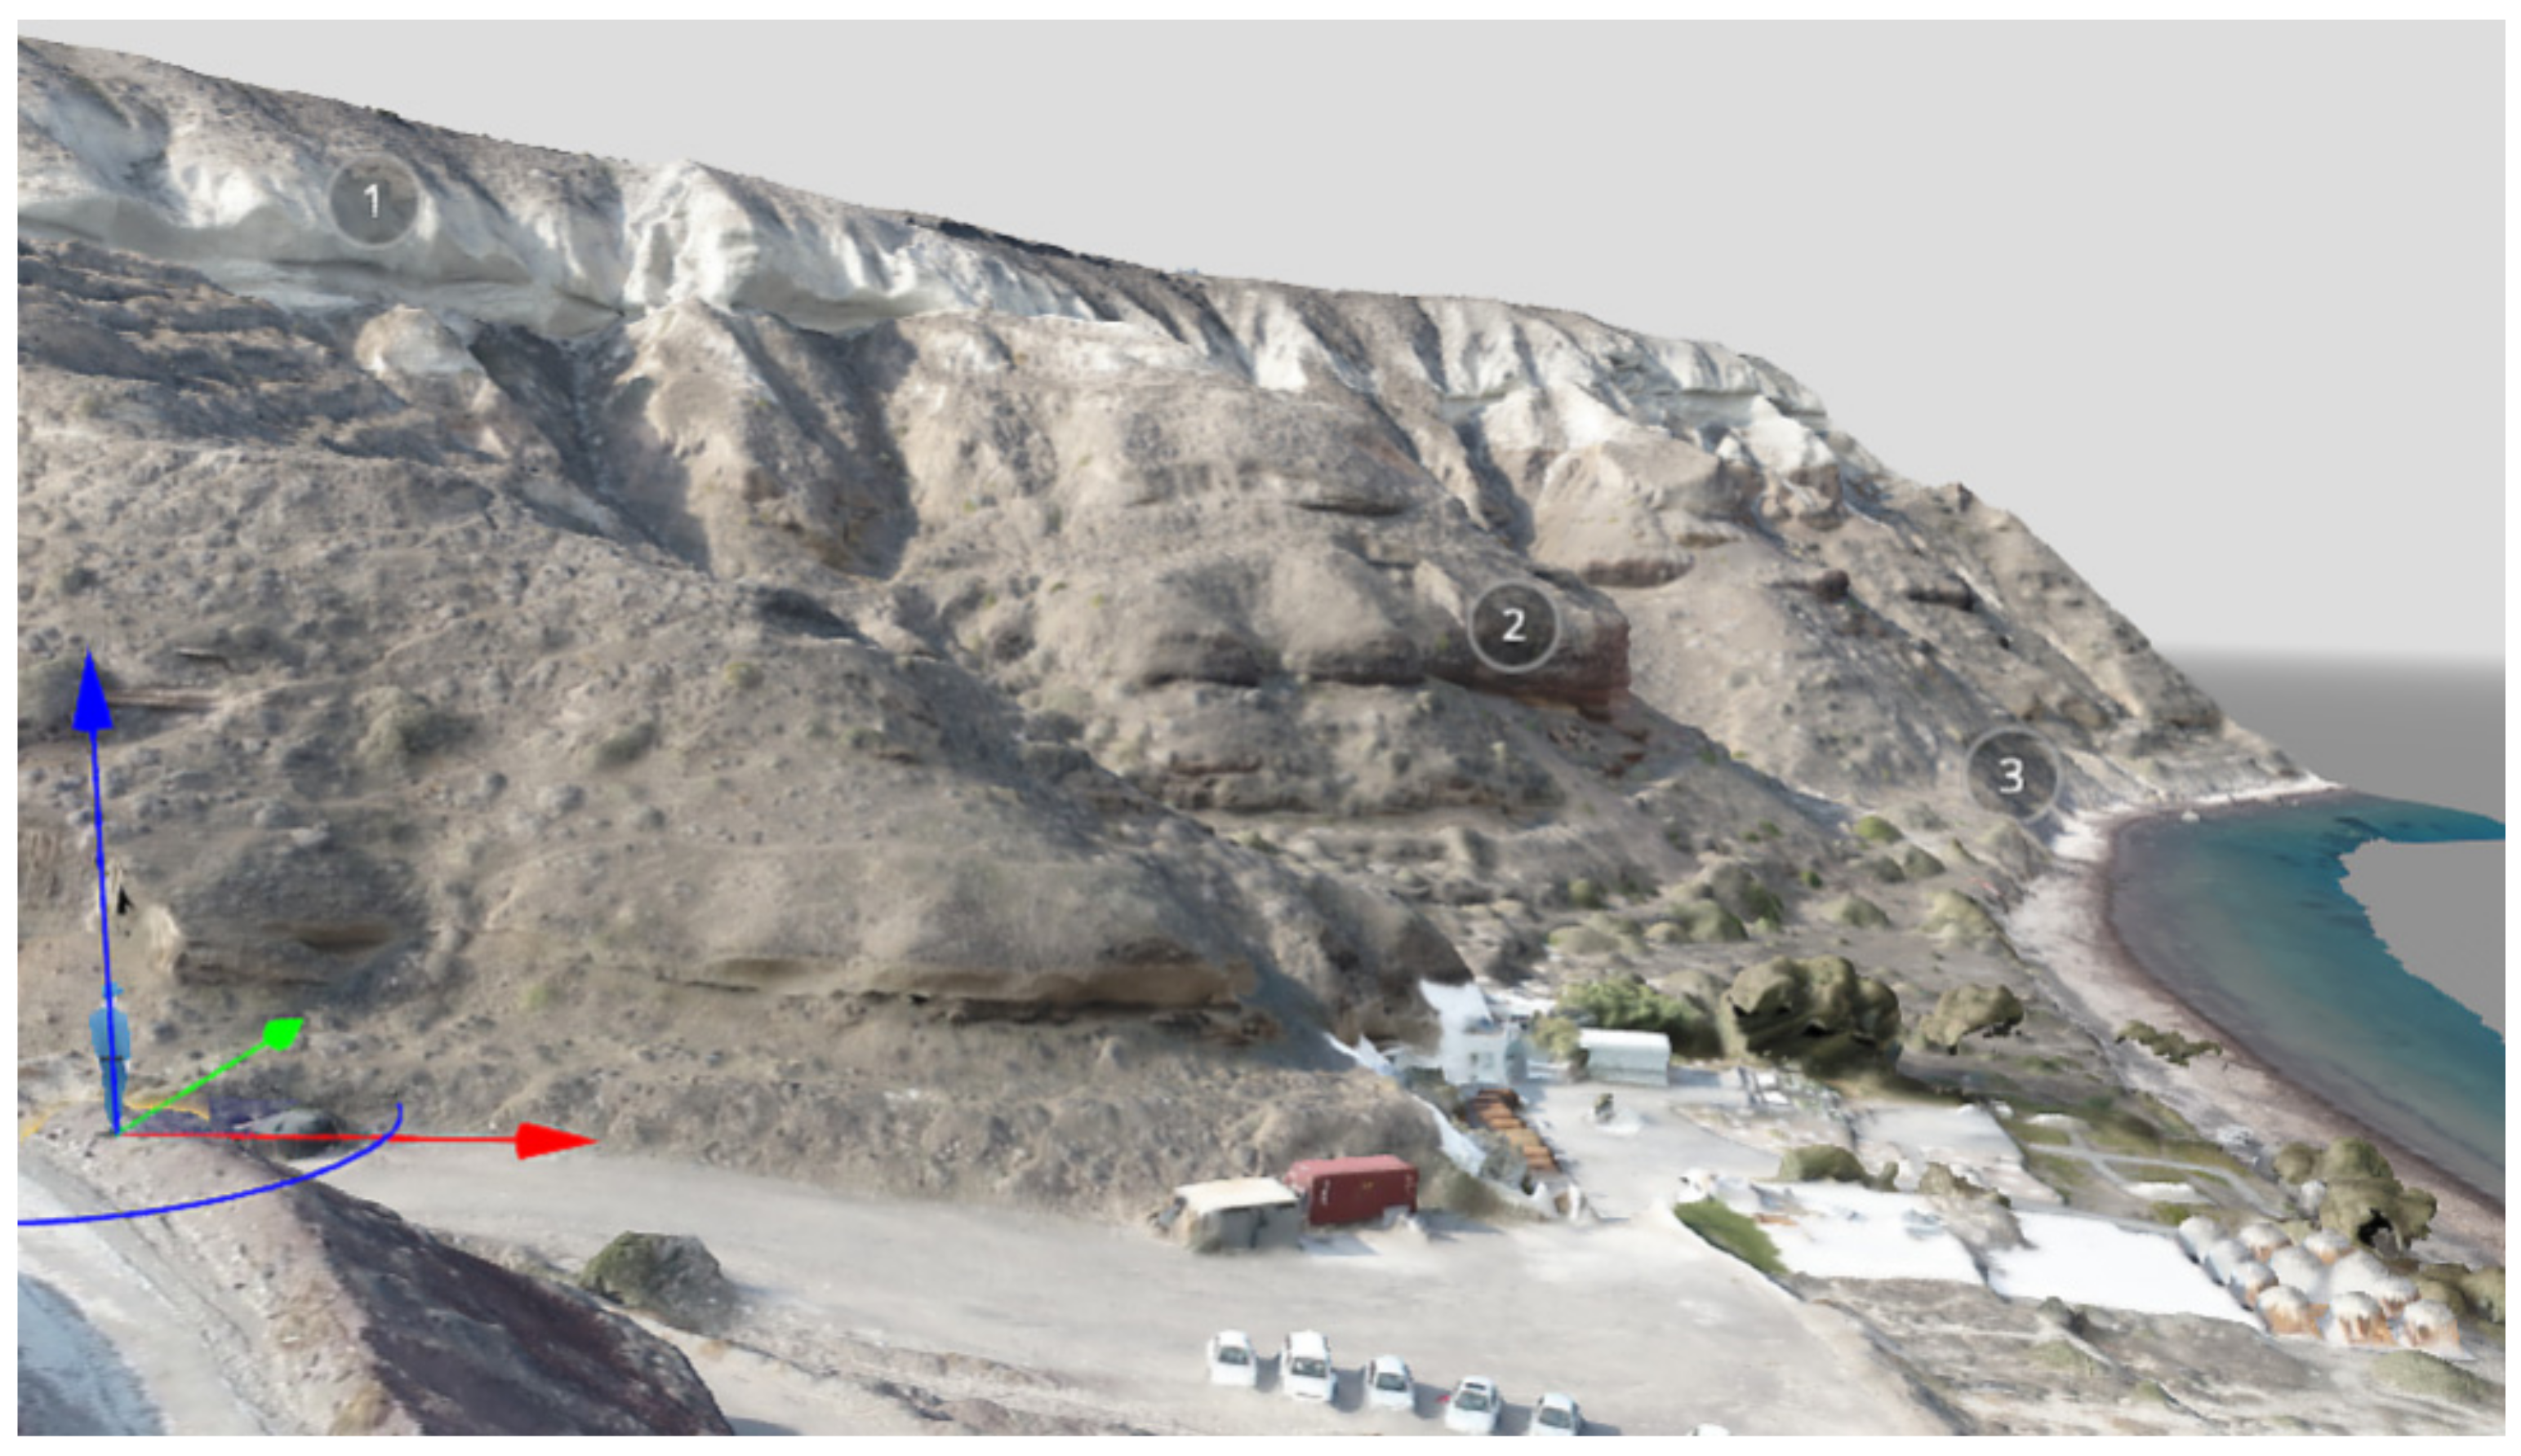
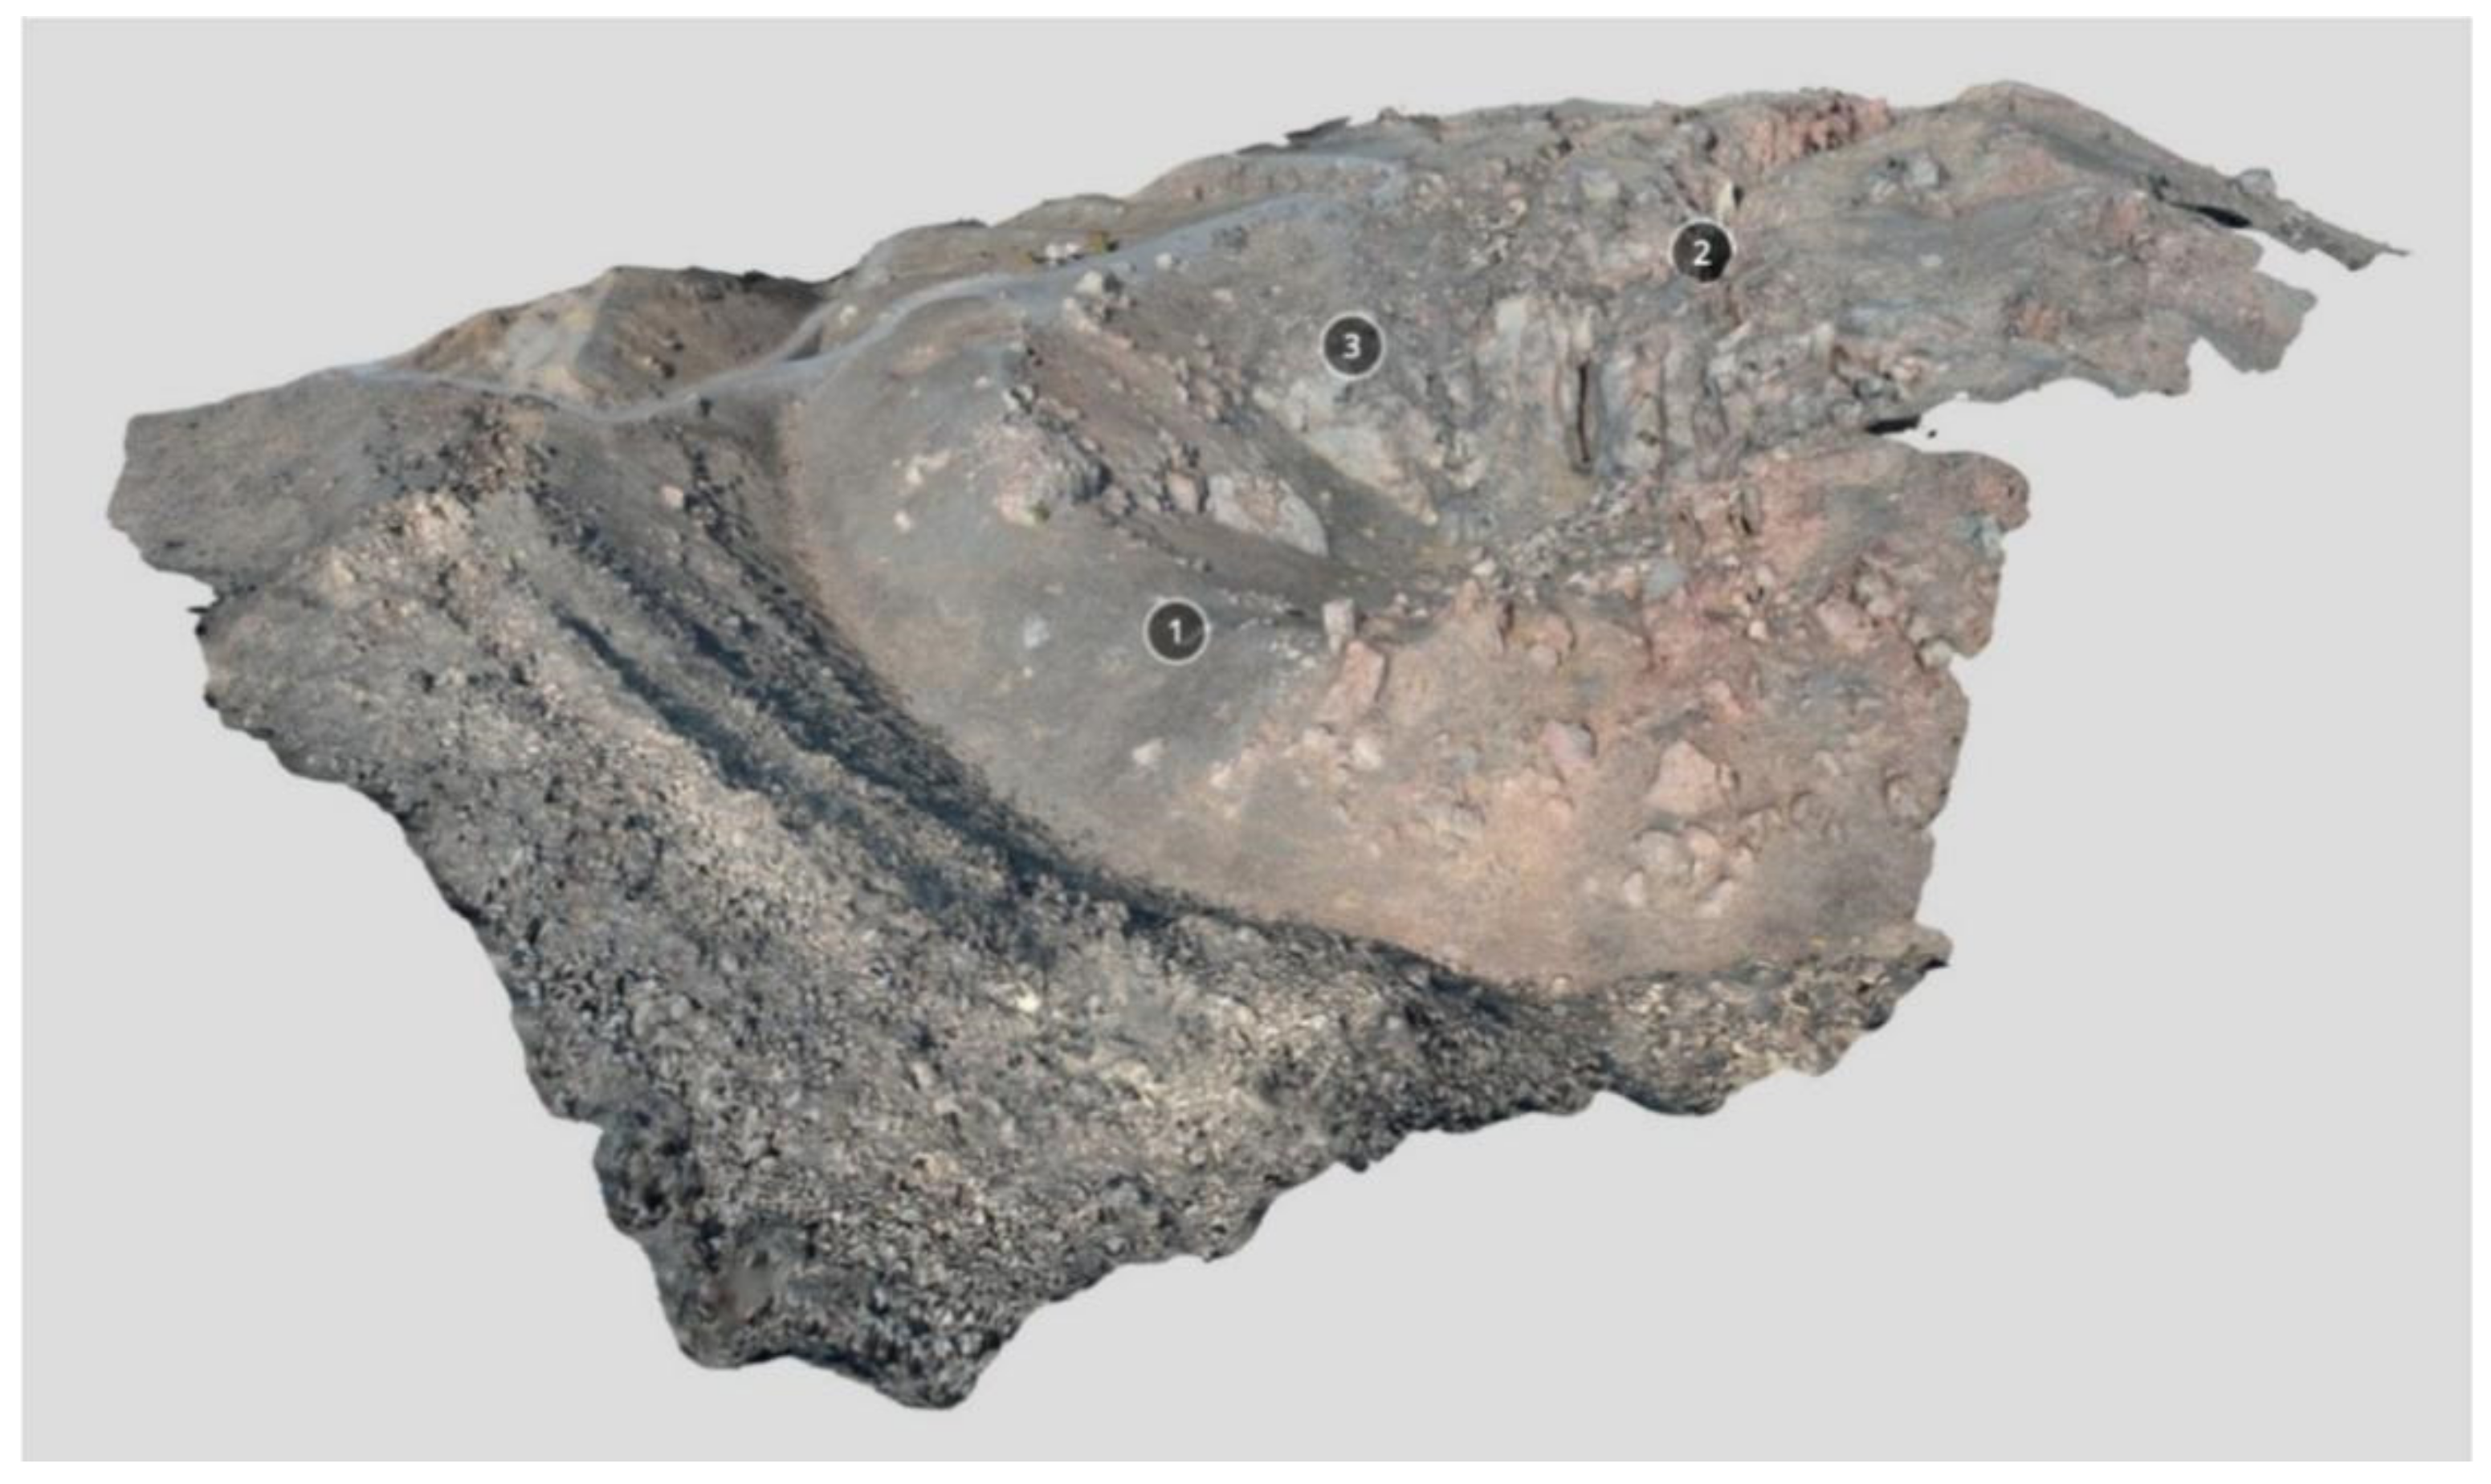
5.8. Cape Epta Paides

Virtual Geosite 8 (VG8) displays another part of the northern caldera wall at the Cape Epta Paides (Figure 14). In detail, the model shows the bottom (av1) and upper units (av3) of the Peristeria stratovolcano [43], which consists of scoria layers (pinmark 1, 2), av1 lava flow (pinmark 3), av3 lava flows (pinmarks 4, 5), tuffs (pinmark 6), and an angular unconformity (pinmark 7), dissected by dikes that strike approximately N–S. To the west (left side) an offset dike (pinmark 8) can be observed, and towards the eastern sector (right side) a 1 m-thick dike (pinmark 9) dissects the whole stratigraphy. Both dikes propagate higher in the succession.

5.9. Skaros Shield

Virtual Geosite 9 (VG9) shows a section of the caldera cliffs between the Oia and Imerovigli villages (Figure 15). The outcrop exhibits the thinly bedded deposits of the Skaros shield (70–54 ka), which are mainly composed of andesitic and basaltic lava flows (pinmark 1). Atop lies the Minoan tuff unit (pinmark 2) that covered the island during the Minoan eruption [43].

6. Qualitative Assessment of the Selected Virtual Geosites (VGs)

All the VGs described in this work represent the volcanic environment because they were produced in a still active volcanic complex. All are aerially well-defined outcrops and landforms, making it easy to define their overall value. Their relevance may be regarded as global because they belong to a volcanic complex that produced a world-renowned eruption that altered the course of ancient history. All the selected VGs are fully representative of several volcanic processes and eruptive phases, which can be observed elsewhere in the world, but here are particularly easy to access and can be found reasonably close to each other within a relatively limited area. All the VGs considered representing currently inactive processes, although the Santorini complex is far from being extinct, as attested by the presence and activity of the Kameni islands described above. Regarding their representativeness, all nine VGs are fully representative of a number of volcanic processes.
Concerning the second criterion that constitutes the scientific value, i.e., rarity, out of the nine VGs, three may be considered very uncommon: first, VG3, represented by Vlychada beach volcanic deposits of the Minoan (LBA) eruption. Here, three out of the four phases of this gigantic eruption can be observed in stunning detail. Second, VG6, represented by Metaxa Mine, a world-renowned volcanological geosite; third, VG7, located within VG6, i.e., the Late Bronze Age (LBA) famous section, bearing evidence of the wide gamut of volcanic phases that characterized the giant Minoan eruption. The third criterion that composes the scientific value is the level of scientific knowledge about a geosite. In this case, details of seven geosites, VG1 to VG7, are described in international scientific papers, VG3 and VG7 being the most represented in the scientific literature.
Concerning the so-called “additional values” used to assess geosites, two can be identified: economic and educational. Concerning the first, it can be assessed for VG6, Metaxa Mine, which is representative not only of the geological heritage of the island, but of the industrial one, a site that was long exploited for economic purposes. Regarding the educational value, we wish to point out that all of the VGs selected can be used to clearly explain a wide gamut of processes that are typical of the volcanic environment, including subvolcanic bodies such as dikes, which play a key role in feeding magma to the surface. Moreover, it is worth noting that our approach is aimed at targeting a large number of different-aged end-users, using two strategies: first, all VGs are made accessible on the internet and are navigable through all classical devices, including mobile phones and tablets; second, they are made available on a user-friendly, WebGIS platform.

7. Conclusions

We described an approach devoted to making volcanic features available to the scientific community and the lay public, based on a new, cutting-edge methodology for sharing virtual geosites (VGs). This is a major tool for popularizing and explaining geological features and processes; by using the methodology described above, viewers can remotely navigate across the outcrops as if they were directly working in the field. To show the broad applicability of this approach, we chose nine VGs belonging to the island of Santorini, a world-renowned, active volcanic complex in the Aegean Sea, Greece. The VGs selected belong to the category of volcanic features, among which particularly important, for our case study, are the volcanic successions derived from a gigantic eruption (the Minoan eruption) that shaped the course of history in the Mediterranean region. We accurately and extensively described the nine VGs in a “virtual geotour mode” and made them available online, in such a way as to allow access to the readers and based on our descriptions, to gain a better knowledge of volcanic features and processes. Moreover, we briefly assessed the nine VGs and highlighted their major scientific and educational value. Finally, we showed the use of a WebGIS platform, which represents an added value compared with previous research in this field, to make our VGs available and accessible to the viewers. The platform enables viewers to observe overall the VG aerial distribution and arrangement in the field. We hope our work represents a model for the future, which will lead to similar efforts devoted to popularizing Earth science and making geoheritage contents accessible online to both scientists and the lay public.

Author Contributions

F.P.M. focused on the introduction and geoheritage sections, and the conclusions; V.A. and K.D. wrote the geological background section and the description of the VGs. V.A. designed and created the WebGIS platform. F.L.B. directed the drone-based image collection campaign in the field, and focused on virtual outcrop preparation. P.N. collaborated in the description of the VGs and WebGIS platform; L.F. collaborated with F.L.B. in the drone-based image collection campaign; O.K. and O.V. both collaborated in describing the VGs and webGIS platform. All authors have read and agreed to the published version of the manuscript.

Funding

This research received no external funding.

Institutional Review Board Statement

Not applicable.

Informed Consent Statement

Not applicable.

Data Availability Statement

No new data were created or analyzed in this study. Data sharing is not applicable to this article.

Acknowledgments

This study was conducted in the framework of the International Lithosphere Program-Task Force II and it is also an outcome of (i) Project MIUR---Dipartimenti di Eccellenza 2018--2022 and (ii) GeoVires, the Virtual Reality Lab for Earth Sciences, Department of Earth and Environmental Sciences, University of Milan Bicocca, Italy (Available online: https://geovires.unimib.it/ (accessed on 11 February 2021)). Finally, Agisoft Metashape is acknowledged for photogrammetric data processing. The authors would like to acknowledge the “RESEARCH-CREATE-INNOVATE” of the “Competitiveness, Entrepreneurship and Innovation (EPANEK),” NSRF 2014–2020, R.G. 15336 (Research project: VIRTUALDiver) for the Department of Geology and Geoenvironment. Also, National and Kapodistrian University of Athens is acknowledge for providing an educational license for Esri ArcGIS Hub.

Conflicts of Interest

The authors declare no conflict of interest.

References

  1. Krokos, M.; Bonali, F.L.; Vitello, F.; Varvara, A.; Becciani, U.; Russo, E.; Marchese, F.; Fallati, L.; Nomikou, P.; Kearl, M.; et al. Workflows for virtual reality visualisation and navigation scenarios in earth sciences. In Proceedings of the 5th International Conference on Geographical Information Systems Theory, Applications and Management, Heraklion, Greece, 3–5 May 2019; pp. 297–304. [Google Scholar]
  2. Tibaldi, A.; Bonali, F.L.; Vitello, F.; Delage, E.; Nomikou, P.; Antoniou, V.; Becciani, U.; Van Wyk de Vries, B.; Krokos, M.; Whitworth, M. Real world–based immersive Virtual Reality for research, teaching and communication in volcanology. Bull. Volcanol. 2020, 82, 1–12. [Google Scholar] [CrossRef]
  3. Edler, D.; Keil, J.; Wiedenlübbert, T.; Sossna, M.; Kühne, O.; Dickmann, F. Immersive VR Experience of Redeveloped Post-Industrial Sites: The Example of “Zeche Holland” in Bochum-Wattenscheid. J. Cartogr. Geogr. Inf. 2019, 69, 267–284. [Google Scholar] [CrossRef] [Green Version]
  4. Lütjens, M.; Kersten, T.; Dorschel, B.; Tschirschwitz, F. Virtual Reality in Cartography: Immersive 3D Visualization of the Arctic Clyde Inlet (Canada) Using Digital Elevation Models and Bathymetric Data. Multimodal Technol. Interact. 2019, 3, 9. [Google Scholar] [CrossRef] [Green Version]
  5. Pasquaré Mariotto, F.; Bonali, F.L. Virtual Geosites as Innovative Tools for Geoheritage Popularization: A Case Study from Eastern Iceland. Geosciences 2021, 11, 149. [Google Scholar] [CrossRef]
  6. Trinks, I.; Clegg, P.; McCaffrey, K.; Jones, R.; Hobbs, R.; Holdsworth, B.; Holliman, N.; Imber, J.; Waggott, S.; Wilson, R. Mapping and analysing virtual outcrops. Visual Geosci. 2005, 10, 13–19. [Google Scholar] [CrossRef]
  7. Pasquaré Mariotto, F.; Bonali, F.L.; Venturini, C. Iceland, an open-air museum for geoheritage and Earth science communication purposes. Resources 2020, 9, 14. [Google Scholar] [CrossRef] [Green Version]
  8. Chang, S.C.; Hsu, T.C.; Jong, M.S.Y. Integration of the peer assessment approach with a virtual reality design system for learning earth science. Comput. Educ. 2020, 146, 103758. [Google Scholar] [CrossRef]
  9. Eberhard, R. Pattern and Process: Towards a Regional Approach to National Estate Assessment of Geodiversity; Technical Series No. 2; Eberhard, R., Ed.; Australian Heritage Commission and Environment Forest Taskforce: Canberra, Australia; Environment Australia: Canberra, Australia, 1997. [Google Scholar]
  10. Brocx, M.; Semeniuk, V. Geoheritage and geoconservation history, definition, scope and scale. J. R. Soc. West. Aust. 2007, 90, 53–87. [Google Scholar]
  11. Asrat, A.; Demissie, M.; Mogessie, A. Geoheritage conservation in Ethiopia: The case of the Simien mountains. Quaest. Geogr. 2012, 31, 7–23. [Google Scholar] [CrossRef] [Green Version]
  12. Fassoulas, C.; Mouriki, D.; Dimitriou-Nikolakis, P.; Iliopoulos, G. Quantitative assessment of geotopes as an effective tool for geoheritage management. Geoheritage 2012, 4, 177–193. [Google Scholar] [CrossRef]
  13. Wimbledon, W.A.P.; Smith-Meyer, S. Geoheritage in Europe and Its Conservation; Wimbledon, W.A.P., Smith-Meyer, S., Eds.; ProGEO: Oslo, Norway, 2012; p. 405. [Google Scholar]
  14. Bruno, D.E.; Crowley, B.E.; Gutak, J.M.; Moroni, A.; Nazarenko, O.V.; Oheim, K.B.; Ruban, D.A.; Tiess, G.; Zorina, S.O. Paleogeography as geological heritage: Developing geosite classification. Earth Sci. Rev. 2014, 138, 300–312. [Google Scholar] [CrossRef]
  15. Brilha, J. Inventory and quantitative assessment of geosites and geodiversity sites: A review. Geoheritage 2016, 8, 119–134. [Google Scholar] [CrossRef] [Green Version]
  16. Reynard, E. Geosite. In Encyclopedia of Geomorphology; Goudie, A.S., Ed.; Routledge: London, UK, 2004. [Google Scholar]
  17. Crofts, R.; Gordon, J.E. Geoconservation in protected areas. In Protected Area Governance and Management; Worboys, G.L., Lockwood, M., Kothari, A., Feary, S., Pulsford, I., Eds.; ANU Press: Canberra, Australia, 2015; pp. 531–568. [Google Scholar]
  18. Ruban, D.A.; Kuo, I. Essentials of geological heritage site (geosite) management: A conceptual assessment of interests and conflicts. Nat. Nascosta 2010, 41, 16–31. [Google Scholar]
  19. Zorina, S.O.; Silantiev, V.V. Geosites, classification of. In Encyclopedia of Mineral and Energy Policy; Springer: Berlin/Heidelberg, Germany, 2014. [Google Scholar]
  20. Lima, F.; Brilha, J.; Salamuni, E. Inventorying geological heritage in large territories: A methodological proposal applied to Brazil. Geoheritage 2010, 2, 91–99. [Google Scholar] [CrossRef] [Green Version]
  21. Reynard, E.; Fontana, G.; Kozlik, L.; Scapozza, C. A method for assessing “scientific” and “additional values” of geomorphosites. Geogr. Helv. 2007, 62, 148–158. [Google Scholar] [CrossRef]
  22. Coratza, P.; Giusti, C. Methodological proposal for the assessment of the scientific quality of geomorphosites. II Quaternario 2005, 18, 307–313. [Google Scholar]
  23. Coratza, P.; Panizza, M. (Eds.) Geomorphology and Cultural Heritage. In Memorie Descrittive Della Carta Geologica d’Italia; ISPRA: Rome, Italy, 2009; p. 87. [Google Scholar]
  24. Druitt, T.H.; Francaviglia, V. Caldera formation on Santorini and the physiography of the islands in the late Bronze Age. Bull. Volcanol. 1992, 54, 484–493. [Google Scholar] [CrossRef]
  25. Dragićević, S. The potential of web-based GIS. J. Geogr. Syst. 2004, 6, 79–81. [Google Scholar] [CrossRef]
  26. Mango, J.; Çolak, E.; Li, X. Web-based GIS for managing and promoting tourism in sub-Saharan Africa. Curr. Issues Tour. 2021, 24, 211–227. [Google Scholar] [CrossRef]
  27. Panagiotopoulou, M.; Somarakis, G.; Stratigea, A. Smartening up Participatory Cultural Tourism Planning in Historical City Centers. J. Urban Technol. 2020, 27, 3–26. [Google Scholar] [CrossRef]
  28. Antoniou, V.; Nomikou, P.; Papaspyropoulos, K.; Karatzaferis, O.; Vlasopoulos, O.; Stentoumis Ch Kalisperakis, I. A journey to Salamis Island (Greece) using a GIS tailored interactive story map application. In Proceedings of the 7th International Conference on Geographical Information Systems Theory, Applications and Management, Online streaming, Prague, Czech Republic, 23–25 April 2021; pp. 262–269. [Google Scholar] [CrossRef]
  29. Kiss, E.; Zichar, M.; Fazekas, I.; Karancsi, G.; Balla, D. Categorization and geovisualization of climate change strategies using an open-access WebGIS tool. InfoCommun. J. 2020, 12, 32–37. [Google Scholar] [CrossRef]
  30. Balla, D.; Zichar, M.; Tóth, R.; Kiss, E.; Karancsi, G.; Mester, T. Geovisualization Techniques of Spatial Environmental Data Using Different Visualization Tools. Appl. Sci. 2020, 10, 6701. [Google Scholar] [CrossRef]
  31. Poux, F.; Valembois, Q.; Mattes, C.; Kobbelt, L.; Billen, R. Initial User-Centered Design of a Virtual Reality Heritage System: Applications for Digital Tourism. Remote Sens. 2020, 12, 2583. [Google Scholar] [CrossRef]
  32. Jung, K.; Nguyen, V.; Piscarac, D.; Yoo, S. Meet the Virtual Jeju Dol Harubang—The Mixed VR/AR Application for Cultural Immersion in Korea’s Main Heritage. ISPRS Int. J. Geo-Inf. 2020, 9, 367. [Google Scholar] [CrossRef]
  33. Jude, O.C.; Ukekwe, C. Tourism and virtual reality (VR) in developing nations. Afr. J. Hosp. Tour. Leis. 2020, 9, 1–16. [Google Scholar]
  34. Shakirova, N.; Al Said, N.; Konyushenko, S. The Use of Virtual Reality in Geo-Education. Int. J. Emerg. Technol. Learn. 2020, 15, 59–70. [Google Scholar] [CrossRef]
  35. Le Pichon, X.; Angelier, J. The Hellenic arc and trench system: A key to the neotectonic evolution of the eastern Mediterranean area. Tectonophysics 1979, 60, 1–42. [Google Scholar] [CrossRef]
  36. Papazachos, B.C. Active Tectonics in the Aegean and Surrounding Area; Kluwer Academic Publishers: Dordrecht, The Netherlands, 1988; pp. 301–331. [Google Scholar]
  37. Jolivet, L.; Faccenna, C.; Huet, B.; Labrousse, L.; Le Pourhiet, L.; Lacombe, O.; Lecomte, E.; Burov, E.; Denèle, Y.; Brun, J.-P.; et al. Aegean tectonics: Strain localisation, slab tearing and trench retreat. Tectonophysics 2013, 597, 1–33. [Google Scholar] [CrossRef] [Green Version]
  38. Hübscher, C.; Ruhnau, M.; Nomikou, P. Volcano-tectonic evolution of the polygenetic Kolumbo submarine volcano/Santorini (Aegean Sea). J. Volcanol. Geotherm. Res. 2015, 291, 101–111. [Google Scholar] [CrossRef]
  39. Francalanci, L.; Zellmer, G.F. Magma Genesis at the South Aegean Volcanic Arc. Elements 2019, 15, 165–170. [Google Scholar] [CrossRef]
  40. Royden, L. The tectonic expression of slab pull at continental convergent boundaries. Tectonics 1993, 12, 303–325. [Google Scholar] [CrossRef]
  41. Hooft, E.E.; Nomikou, P.; Toomey, D.R.; Lampridou, D.; Getz, C.; Christopoulou, M.; O’Hara, D.; Arnoux, G.M.; Bodmer, M.; Gray, M.; et al. Backarc tectonism, volcanism, and mass wasting shape seafloor morphology in the Santorini-Christiana-Amorgos region of the Hellenic Volcanic Arc. Tectonophysics 2017, 712, 396–414. [Google Scholar] [CrossRef]
  42. Nomikou, P.; Hübscher, C.; Carey, S. The Christiana–Santorini–Kolumbo Volcanic Field. Elem. Int. Mag. Mineral. Geochem. Petrol. 2019, 15, 171–176. [Google Scholar] [CrossRef]
  43. Druitt, T.H.; Edwards, L.; Mellors, R.M.; Pyle, D.M.; Sparks, R.S.J.; Lanphere, M.; Davis, M.; Barriero, B. Santorini Volcano. Geol. Soc. Mem. 1999, 19, 165. [Google Scholar]
  44. Papadimitriou, P.; Kapetanidis, V.; Karakonstantis, A.; Kaviris, G.; Voulgaris, N.; Makropoulos, K. The Santorini Volcanic Complex: A detailed multi-parameter seismological approach with emphasis on the 2011–2012 unrest period. J. Geodyn. 2015, 85, 32–57. [Google Scholar] [CrossRef]
  45. Reck, H. Santorin: Das Werdegang eines Inselvulckans und sein Ausbruch 1925–1928, Ergebnisse einer Deutsch-Griechischen Arbeitgemeintschaft; Dietrich Reimer Andrews und Steiner: Berlin, Germany, 1936; Volume 3. [Google Scholar]
  46. Newman, A.V.; Stiros, S.; Feng, L.; Psimoulis, P.; Moschas, F.; Saltogianni, V.; Jiang, Y.; Papazachos, C.; Panagiotopoulos, D.; Karagianni, E. Recent geodetic unrest at Santorini Caldera, Greece, Geophys. Res. Lett. 2012, 39. [Google Scholar] [CrossRef]
  47. Browning, J.; Drymoni, K.; Gudmundsson, A. Forecasting magma-chamber rupture at Santorini volcano, Greece. Sci. Rep. 2015, 5, 1–8. [Google Scholar] [CrossRef] [Green Version]
  48. Heiken, G.; McCoy, F. Caldera Development During the Minoan Eruption, Thira, Cyclades, Greece. J. Geophys. Res. 1984, 89, 8441–8462. [Google Scholar] [CrossRef] [Green Version]
  49. Pyle, D.M.; Elliott, J.R. Quantitative morphology, recent evolution, and future activity of the Kameni Islands volcano, Santorini, Greece. Geosphere 2006, 2, 253–268. [Google Scholar] [CrossRef]
  50. Nomikou, P.; Papanikolaou, D.; Alexandri, M.; Sakellariou, D.; Rousakis, G. Submarine volcanoes along the Aegean volcanic arc. Tectonophysics 2013, 597, 123–146. [Google Scholar] [CrossRef]
  51. Carey, S.; Nomikou, P.; Croff Bell, K.; Ballard, D. Exploration of the Santorini volcanic group, southern Aegean Sea. Oceanography 2013, 26, 44–49. [Google Scholar]
  52. Drymoni, K.; Magganas, A.; Pomonis, P. Santorini Volcano’s 20th Century Eruptions: A Combined Petrogenetical, Volcanological, Sociological and Environmental Study. In Proceedings of the 2014 EGU General Assembly, Vienna, Austria, 27 April–2 May 2014. abstract EGU2014-8405. [Google Scholar]
  53. Drymoni, K.; Browning, J.; Gudmundsson, A. Dyke-arrest scenarios in extensional regimes: Insights from field observations and numerical models, Santorini Greece. J. Volcanol. Geothem. Res. 2020, 396, 106854. [Google Scholar]
  54. Antoniou, V.; Bonali, F.L.; Nomikou, P.; Tibaldi, A.; Melissinos, P.; Pasquaré Mariotto, F.; Whitworth, M. Integrating Virtual Reality and GIS Tools for Geological Mapping, Data Collection and Analysis: An Example from the Metaxa Mine, Santorini (Greece). Appl. Sci. 2020, 10, 8317. [Google Scholar] [CrossRef]
  55. Drymoni, K. Dyke Propagation Paths: The Movement of Magma from the Source to the Surface. Ph.D. Thesis, Royal Holloway University of London, London, UK, 2020. [Google Scholar]
  56. Drymoni, K.; Browning, J.; Gudmundsson, A. Volcanotectonic interactions between inclined sheets, dykes, and faults at the Santorini Volcano, Greece. J. Volcanol. Geotherm. Res. 2021, 416, 107294. [Google Scholar] [CrossRef]
  57. Druitt, T.H.; Davies, M.A. Geological map of the Santorini Islands, Aegean Sea, Greece. Scale 1:20,000. In Santorini Volcano, Memoir of the Geological Society of London; Druitt, T.H., Edwards, L., Davies, M., Lanphere, M.A., Mellors, R., Pyle, D., Sparks, R.S.J., Barreiro, B., Eds.; Geological Society of London: London, UK, 1999; Volume 19, p. 176. [Google Scholar]
  58. Fabbro, G.N.; Druitt, T.H.; Scaillet, S. Evolution of the crustal magma plumbing system during the build-up to the 22-ka caldera-forming eruption of Santorini (Greece). Bull. Volcanol. 2013, 75, 1–22. [Google Scholar] [CrossRef] [Green Version]
  59. Sparks, R.J.S.; Wilson, C.J.N. The Minoan deposits: A review of their characteristics and interpretation. In Thera and the Aegean World III; Hardy, D.A., Ed.; Thera Foundation: London, UK, 1990; Volume 2, pp. 89–99. [Google Scholar]
  60. Druitt, T.H. New insights into the initiation and venting of the Bronze-Age eruption of Santorini (Greece), from component analysis. Bull. Volcanol. 2014, 76, 1–21. [Google Scholar] [CrossRef]
  61. Cadoux, A.; Scaillet, B.; Bekki, S.; Oppenheimer, C.; Druitt, T.H. Stratospheric ozone destruction by the Bronze-Age Minoan eruption (Santorini volcano, Greece). Sci. Rep. 2015, 5, 1–12. [Google Scholar] [CrossRef] [Green Version]
  62. Sigurdsson, H.; Carey, S.; Devine, J.D. Mass, dynamics and environmental effects of the Minoan eruption of Santorini volcano. In Thera and the Aegean World III; Hardy, D., Keller, J., Galanopoulos, V.P., Flemming, N.C., Druitt, T.H., Eds.; Thera Foundation: London, UK, 1990; Volume 2, pp. 100–112. [Google Scholar]
  63. McCoy, F.; Heiken, G. Tsunami generated by the Late Bronze Age eruption of Thera (Santorini), Greece. Pure Appl. Geophys. 2000, 157, 1227–1256. [Google Scholar] [CrossRef]
  64. McClelland, E.; Thomas, R. A palaeomagnetic study of Minoan age tephra from Thera. In Thera and the Aegean World III; Hardy, D.A., Ed.; Thera Foundation: London, UK, 1990; Volume 2, pp. 129–138. [Google Scholar]
  65. Pfeiffer, T. Vent development during the Minoan eruption (1640 BC) of Santorini, Greece, as suggested by ballistic blocks. J. Volcanol. Geotherm. Res. 2001, 106, 229–242. [Google Scholar] [CrossRef]
  66. Sigurdsson, H.; Carey, S.; Alexandri, G.; Vougioukalakis, G.; Croff, K.; Roman, C.; Sakellariou, D.; Anagnostou, C.; Rousakis, G.; Ioakim, C.; et al. Marine investigations of Greece’s Santorini volcanic field. EOS Trans. Am. Geophys. Union 2006, 87, 342. [Google Scholar] [CrossRef] [Green Version]
  67. Bonali, F.L.; Tibaldi, A.; Marchese, F.; Fallati, L.; Russo, E.; Corselli, C.; Savini, A. UAV-based surveying in volcano-tectonics: An example from the Iceland rift. J. Struct. Geol. 2019, 121, 46–64. [Google Scholar] [CrossRef]
  68. Bonali, F.L.; Tibaldi, A.; Corti, N.; Fallati, L.; Russo, E. Reconstruction of Late Pleistocene-Holocene Deformation through Massive Data Collection at Krafla Rift (NE Iceland) Owing to Drone-Based Structure-from-Motion Photogrammetry. Appl. Sci. 2020, 10, 6759. [Google Scholar] [CrossRef]
  69. Stal, C.; Bourgeois, J.; De Maeyer, P.; De Mulder, G.; De Wulf, A.; Goossens, R.; Hendrickx, M.; Nuttens, T.; Stichelbaut, B. Test case on the quality analysis of structure from motion in airborne applications. In Proceedings of the 32nd EARSeL Symposium: Advances in Geosciences, Mykonos, Greece, 21–24 May 2012; p. 11. [Google Scholar]
  70. Westoby, M.J.; Brasington, J.; Glasser, N.F.; Hambrey, M.J.; Reynolds, J.M. Structure-from-Motion’photogrammetry: A low-cost, effective tool for geoscience applications. Geomorphology 2012, 179, 300–314. [Google Scholar] [CrossRef] [Green Version]
  71. Bonali, F.L.; Antoniou, V.; Vlasopoulos, O.; Tibaldi, A.; Nomikou, P. Selfie Drones for 3D Modelling, Geological Mapping and Data Collection: Key Examples from Santorini Volcanic Complex, Greece. In Proceedings of the 6th International Conference on Geographical Information Systems Theory, Applications and Management (GISTAM 2020), Prague, Czech Republic, 7–9 May 2020; pp. 119–128. [Google Scholar]
  72. Tibaldi, A.; Corti, N.; De Beni, E.; Bonali, F.L.; Falsaperla, S.; Langer, H.; Fallati, L. Mapping and evaluating kinematics and the stress and strain field at active faults and fissures: A comparison between field and drone data at the NE rift, Mt Etna (Italy). Solid Earth 2021, 12, 801–816. [Google Scholar] [CrossRef]
  73. Antoniou, V.; Nomikou, P.; Pavlina, B.; Pantelia, S.; Bonali, F.L.; Lemonia, R.; Andreas, M. The story map for Metaxa mine (Santorini, Greece): A unique site where history and volcanology meet each other. In Proceedings of the 5th International Conference on Geographical Information Systems Theory, Applications and Management (GISTAM 2019), Heraklion, Greece, 3–5 May 2019; pp. 3–5. [Google Scholar]
  74. Antoniou, V.; Ragia, L.; Nomikou, P.; Bardouli, P.; Lampridou, D.; Ioannou, T.; Kalisperakis, I.; Stentoumis, C. Creating a Story Map Using Geographic Information Systems to Explore Geomorphology and History of Methana Peninsula. ISPRS Int. J. Geo-Inf. 2018, 7, 484. [Google Scholar] [CrossRef] [Green Version]
  75. Antoniou, V.; Nomikou, P.; Panousis, D.; Zafeirakopoulou, E. Nisyros Volcanic Island: A Geosite through a Tailored GIS Story. Geosciences 2021, 11, 132. [Google Scholar] [CrossRef]
  76. Burns, J.H.R.; Delparte, D. Comparison of commercial structure-from-motion photogrammety software used for underwater three-dimensional modeling of coral reef environments. Int. Arch. Photogramm. Remote Sens. Spat. Inf. Sci. 2017, 42, 127. [Google Scholar] [CrossRef] [Green Version]
  77. James, M.R.; Robson, S. Straightforward reconstruction of 3D surfaces and topography with a camera: Accuracy and geoscience application. J. Geophys. Res. Earth Surf. 2012, 117, doi. [Google Scholar] [CrossRef] [Green Version]
  78. James, M.R.; Robson, S.; Smith, M.W. 3-D uncertainty-based topographic change detection with structure-from-motion photogrammetry: Precision maps for ground control and directly georeferenced surveys. Earth Surf. Process. Landf. 2017, 42, 1769–1788. [Google Scholar] [CrossRef]
  79. Miyahara, K.; Okada, Y. COLLADA-based File Format Supporting Various Attributes of Realistic Objects for VR Applications. In Proceedings of the 2009 International Conference on Complex, Intelligent and Software Intensive Systems, Fukuoka, Japan, 16–19 March 2009; pp. 971–976. [Google Scholar]
  80. Gerloni, I.G.; Carchiolo, V.; Vitello, F.R.; Sciacca, E.; Becciani, U.; Costa, A.; Tibaldi, A. Immersive virtual reality for earth sciences. In Proceedings of the 2018 Federated Conference on Computer Science and Information Systems (FedCSIS), Poznań, Poland, 9–12 September 2018; 2018; pp. 527–534. [Google Scholar]
  81. Cawood, A.J.; Bond, C.E. eRocK: An online, open-access repository of virtual outcrops and geological samples in 3D. In Proceedings of the EGU General Assembly Conference Abstracts, Vienna, Austria, 8–13 April 2018; p. 18248. [Google Scholar]
  82. Choi, D.H.; Dailey-Hebert, A.; Estes, J.S. Emerging Tools and Applications of Virtual Reality in Education; Choi, D.H., Dailey-Hebert, A., Estes, J.S., Eds.; Information Science Reference: Hershey, PA, USA, 2016. [Google Scholar]
  83. Nomikou, P.; Parks, M.Μ.; Papanikolaou, D.; Pyle, D.Μ.; Mather, T.A.; Carey, S.; Watts, A.Β.; Paulatto, M.; Kalnins, M.; Livanos, I.; et al. The emergence and growth of a submarine volcano: The Kameni islands, Santorini (Greece). GeoResJ 2014, 1, 1–2. [Google Scholar] [CrossRef] [Green Version]
  84. Watts, A.B.; Nomikou, P.; Moore, J.D.P.; Parks, M.M.; Alexandri, M. Historical bathymetric charts and the evolution of Santorini submarine volcano, Greece. Geochem. Geophys. Geosystems 2015, 16, 847. [Google Scholar] [CrossRef] [Green Version]
  85. Dimitriadis, I.; Karagianni, E.; Panagiotopoulos, D.G.; Papazachos, C.; Hatzidimitriou, P.; Bohnhoff, M.; Rische, M.; Meier, T. Seismicity and active tectonics at Coloumbo Reef (Aegean Sea, Greece): Monitoring an active volcano at Santorini Volcanic Center using a temporary seismic network. Tectonophysics 2009, 465, 136–149. [Google Scholar] [CrossRef] [Green Version]
  86. Manning, S.W.; Ramsey, C.B.; Kutschera, W.; Higham, T.; Kromer, B.; Steier, P.; Wild, E.M. Chronology for the Aegean Late Bronze Age 1700–1400 B.C. Science 2006, 312, 565–569. [Google Scholar] [CrossRef] [PubMed] [Green Version]
  87. Johnston, E.N.; Sparks, R.S.J.; Nomikou, P.; Livanos, I.; Carey, S.; Phillips, J.C.; Sigurdsson, H. Stratigraphic relations of Santorini’s intracaldera fill and implications for the rate of post-caldera volcanism. J. Geol. Soc. 2015, 172, 323–335. [Google Scholar] [CrossRef]
  88. Bond, A.; Sparks, R.S.J. The Minoan eruption of Santorini, Greece. J. Geol. Soc. 1976, 132, 1–16. [Google Scholar] [CrossRef]
  89. Druitt, T.H.; Mellors, R.M.; Pyle, D.M.; Sparks, R.S.J. Explosive Volcanism on Santorini, Greece; Geological Magazine; Cambridge University Press: Cambridge, UK, 1989; Volume 126, pp. 95–126. [Google Scholar]
Figure 1. (a) Panorama of the northern caldera wall dike swarm showing the heterogeneous and anisotropic crustal segment composed of lava flows and pyroclastic materials. The latter are dissected by 91 dike segments. (b) View of Athinios Port with details of the pyroclastic successions derived from the two main eruptive phases, the Minoan and middle pumice layers, which formed the characteristic landforms and erosional surfaces; caldera walls are ~400 m high and extend underneath the water level, to a depth of 390 m (photo courtesy: Agust Gudmundsson). (c) Simplified geological map of Santorini (modified from [43]) showing the stratigraphy, main volcano–tectonic lineaments, and location of the virtual geosites (VG1–VG9) presented here. Ko-VT: Kolumbo volcanotectonic line, Ka-VT: Kameni volcanotectonic line, CSK: (Christiana–Santorini–Kolumbo rift zone).
Applsci 11 05466 g001
Figure 2. Screenshot showing part of the hub created for Santorini’s virtual geosites. An interactive 2D morphological webmap outlines the location of the VGs. The users can select a location to obtain more information.
Applsci 11 05466 g002
Figure 3. Screenshot showing the part of the hub dedicated to the volcanic history of the island. The users can tilt and rotate the 3D interactive map to view the scene from different points of view.
Applsci 11 05466 g003
Figure 4. Screenshot showing the part of the hub where the users can access each VG. Using each button, the viewers can access, inside the hub, a dedicated StoryMap application, where descriptive text and the 3D model can be found.
Applsci 11 05466 g004
Figure 5. Representative screenshot of the StoryMap that corresponds to the Cape Epta Paides virtual geosite. Users can return to the main page by using the “Virtual Geosites” button in the upper-left side.
Applsci 11 05466 g005
Figure 6. Example of an annotated 3-D model, in which the viewer’s starting point and height are shown, as well as the direction of observation.
Applsci 11 05466 g006
Figure 7. Three-dimensional model of the 1570–1573 AD volcanic crater on Nea Kameni volcano (view towards the northeast) (pinmarks 1–3).
Applsci 11 05466 g007
Figure 8. (a) A 3D model of the NE corner of the northern caldera wall (view towards the northeast). The cliff is 190 m high. (b) A closer look of the left part of the outcrop where dikes are emplaced in the caldera wall, with some showing deflection into the fault zones. (c) A 3D view of a dike that dissects the caldera wall.
Applsci 11 05466 g008
Figure 9. (a) A 3D model panorama view along Vlychada beach (view towards the north) and (b) a closer look at the Minoan eruption phases and morphological features (pinmarks 1–3).
Applsci 11 05466 g009
Figure 10. (a) A panorama of the sandy beach 3D model (view towards the south). A closer look at (b) the Cape Riva tuffs, (c) the US2 deposit dominated by grey scoria flow, and (d) the middle tuffs.
Applsci 11 05466 g010
Figure 11. (a) A northern caldera wall outcrop close to the Oia village. (b) A closer look of the contact between the rhyodacitic pyroclastic deposits and the less evolved ones (andesitic to dacitic), (c) a view towards the north of the US2 deposit, and (d) a basaltic andesitic dike with a variable dip that dissects the products of the second explosive phase.
Applsci 11 05466 g011
Figure 12. (a) A view of the Metaxa Mine (view to the north), (b) detail of the area where the Minoan products crop out, representing all the phases of the Minoan eruption, (c) detail of the area where debris flows deposits and anthropogenic interventions mostly occur.
Applsci 11 05466 g012
Figure 13. (a) A view of Metaxa Mine (view to the south), (b) a closer look at the pre-Minoan (pinmark 1) and post-Minoan (2–4) units, (c) a closer look at the Minoan surge deposits and the nonwelded ignimbrite.
Applsci 11 05466 g013
Figure 14. Panorama of the Cape Epta Paides 3D model.
Applsci 11 05466 g014
Figure 15. Panorama of the Skaros shield 3D model. The outcrop has an elevation of 240 m.
Applsci 11 05466 g015
Table 1. Summary of the relevant details for the nine VGs, including the number of pictures collected, the number of GCPs used for referencing and scaling, and the final texture resolution.
Virtual GeositeNr. of PicturesNr. of GCPsTexture Resolution (cm/pix)
VG1123141
VG292944
VG349342
VG435044
VG530044
VG66736342
VG7150041
VG83606
VG93506
Publisher’s Note: MDPI stays neutral with regard to jurisdictional claims in published maps and institutional affiliations.

