Article

Characterization of PM10-Bound Polycyclic Aromatic Hydrocarbons and Associated Carcinogenic Risk in Bangkok, Thailand

by
Amornphat Tadsanaprasittipol
1,2,
Pinthong Tonrub
1,
Iain J. Beverland
2 and
Robert M. Kalin
2,*
1
Environmental Quality and Laboratory Division, Pollution Control Department, Bangkok 10400, Thailand
2
Department of Civil and Environmental Engineering, University of Strathclyde, Glasgow G1 1XJ, UK
*
Author to whom correspondence should be addressed.
Appl. Sci. 2021, 11(10), 4501; https://doi.org/10.3390/app11104501
Submission received: 30 April 2021 / Revised: 10 May 2021 / Accepted: 10 May 2021 / Published: 14 May 2021

Abstract

:
Concentrations of ambient particulate-bound polycyclic aromatic hydrocarbons (pPAHs) were measured in PM10 samples collected at roadside, industrial and urban background sites in Bangkok between May 2013 and May 2014. The annual average PM10 concentrations were not significantly different between the roadside (56.4 ± 27.3 µg m−3) and industrial (51.0 ± 31.1 µg m−3) sites. The lowest annual mean PM10 was observed at the urban background site (39.8 ± 22.2 µg m−3). Seasonal variations of pPAHs were observed at the three sampling sites. The total pPAHs ranged between 1.09 and 13.10 ng m−3 (mean 4.85 ± 2.51 ng m−3), 1.49 and 9.39 ng m−3 (mean 3.84 ± 2.01 ng m−3) and 0.77 and 5.20 ng m−3 (mean 2.28 ± 1.16 ng m−3) at the roadside, industrial and urban background sites, respectively. The observed annual average benzo[a]pyrene concentrations were 0.47 ± 0.39 ng m−3, 0.35 ± 0.27 ng m−3 and 0.24 ± 0.19 ng m−3 at the roadside, industrial and urban background sites. Long-term carcinogenic health risk of inhalation exposure expressed as the toxicity equivalent to benzo[a]pyrene concentrations were calculated as 0.83, 0.72 and 0.39 ng m−3 at the industrial, roadside and urban background sites, respectively. The composition of pPAHs plays an important role in the carcinogenicity of a PAHs mixture.

1. Introduction

Bangkok, the capital city of Thailand with 10.7 million people [1], has been facing prolonged air quality challenges, including challenges resulting from annual average particulate matter (PM10) concentrations that exceed the WHO recommended guideline of 20 µg m−3. In 2011, the daily mean concentrations of PM10 in Bangkok ranged between 10.0 and 189.0 µg m−3 at roadside sites and 7.4 and 131.5 µg m−3 in background areas, with 2.7% and 0.2% of daily mean PM10 concentrations at these sites exceeding the Thailand National Ambient Air Quality Standard (NAAQS) of 120 µg m−3 [2]. This may represent a significant public health risk in relation to the WHO recommended guideline for a 24-h mean PM10 of 50 µg m−3 [3]. High ambient concentrations of PM10 increase the potential for adverse health effects caused by toxic contaminants, particularly carcinogenic and mutagenic polycyclic aromatic hydrocarbons (PAHs). PAHs emitted from both natural (e.g., forest fires) and anthropogenic (e.g., fossil fuel combustion) sources are mostly bound to airborne particles (pPAHs) [4]. Carcinogenic pPAHs are mostly high-molecular-weight low-volatility compounds dominantly adsorbed onto particles [5]. pPAHs of health concern owing to their carcinogenic and teratogenic properties include: fluorene [FLU], phenanthrene [PHE], anthracene [ANT], fluoranthene [FLT], pyrene [PRY], benzopyrene [BP], benzo[a]pyrene [BaP], dibenz[a,h]anthracene [DBA], benz[a]anthracene [BaA], benzo[b]fluoranthene [BbF], benzo[k]fluoranthene [BkF], chrysene [CHR], and indeno [1,2,3-cd]pyrene [IP] [6].
Studies on adverse health effects of pPAHs have been conducted in many countries [4,7,8,9,10,11]. The carcinogenic effect of exposure to atmospheric pPAHs resulted in the development of tumors in the pharynx and larynx of exposed hamsters [12]. DNA damage in Chinese hamster lung fibroblasts was associated with high-molecular-weight PAHs [13]. pPAHs pose a human health risk concern as they are distributed in the respirable particle size range; thus, exposure by inhalation is unavoidable [14,15]. The European Commission (EC) currently uses benzo[a]pyrene as a marker for carcinogenic PAHs in ambient air and set a target value of 1 ng m−3 [16], whereas the UK adopted a more stringent standard for an annual average concentration of benzo[a]pyrene of 0.25 ng m−3 [17].
Published studies on pPAHs have evaluated the health risk according to toxicity with reference to benzo[a]pyrene [18,19,20]. The lifetime lung cancer risk is estimated to reflect the potential health effects resulting from exposure to atmospheric PAHs. The estimation of lung cancer risk caused by PAHs can be evaluated from exposure concentrations of individual PAHs and their carcinogenic potency. Carcinogenic risk assessment can be undertaken using benzo[a]pyrene as a surrogate for carcinogenic PAHs or by combining the toxicity of individual PAHs according to benzo[a]pyrene toxicity equivalent factors [18,21].
Long-term exposure to high PM10 and PM10-bound PAHs may pose a significant health risk, particularly in urban areas of the Bangkok Metropolitan Administration (BMA). Although ambient PM10 has been regulated in Thailand, systematic pPAH measurement has not previously been undertaken. Published studies on the exposure of carcinogenic PAHs focused on highly polluted areas, and groups of exposed people and occupations, emphasize the need to manage these pollutants because of their significant health risk [20,22]. PM10 in ambient air is regulated under the Thailand NAAQS that specifies ambient PM10 concentrations of 120 and 50 µg m−3 for 24-h and annual averages [2]. Research on pPAHs from archived PM2.5 filters has shown that high-molecular-weight PAHs composed of five- and six-ring molecules can be reliably quantified; however, the more volatile three- and four-ring PAHs can be lost during storage at room temperature [23,24]. Therefore, archived filter samples are a useful source of information on exposure to carcinogenic pPAHs in the BMA.
In this study, 125 archived weekly samples collected for PM10 mass analysis from three sites (roadside, background, and industrial) were preserved and analyzed for the US EPA’s 16 priority PAHs. The objectives of our study were to:
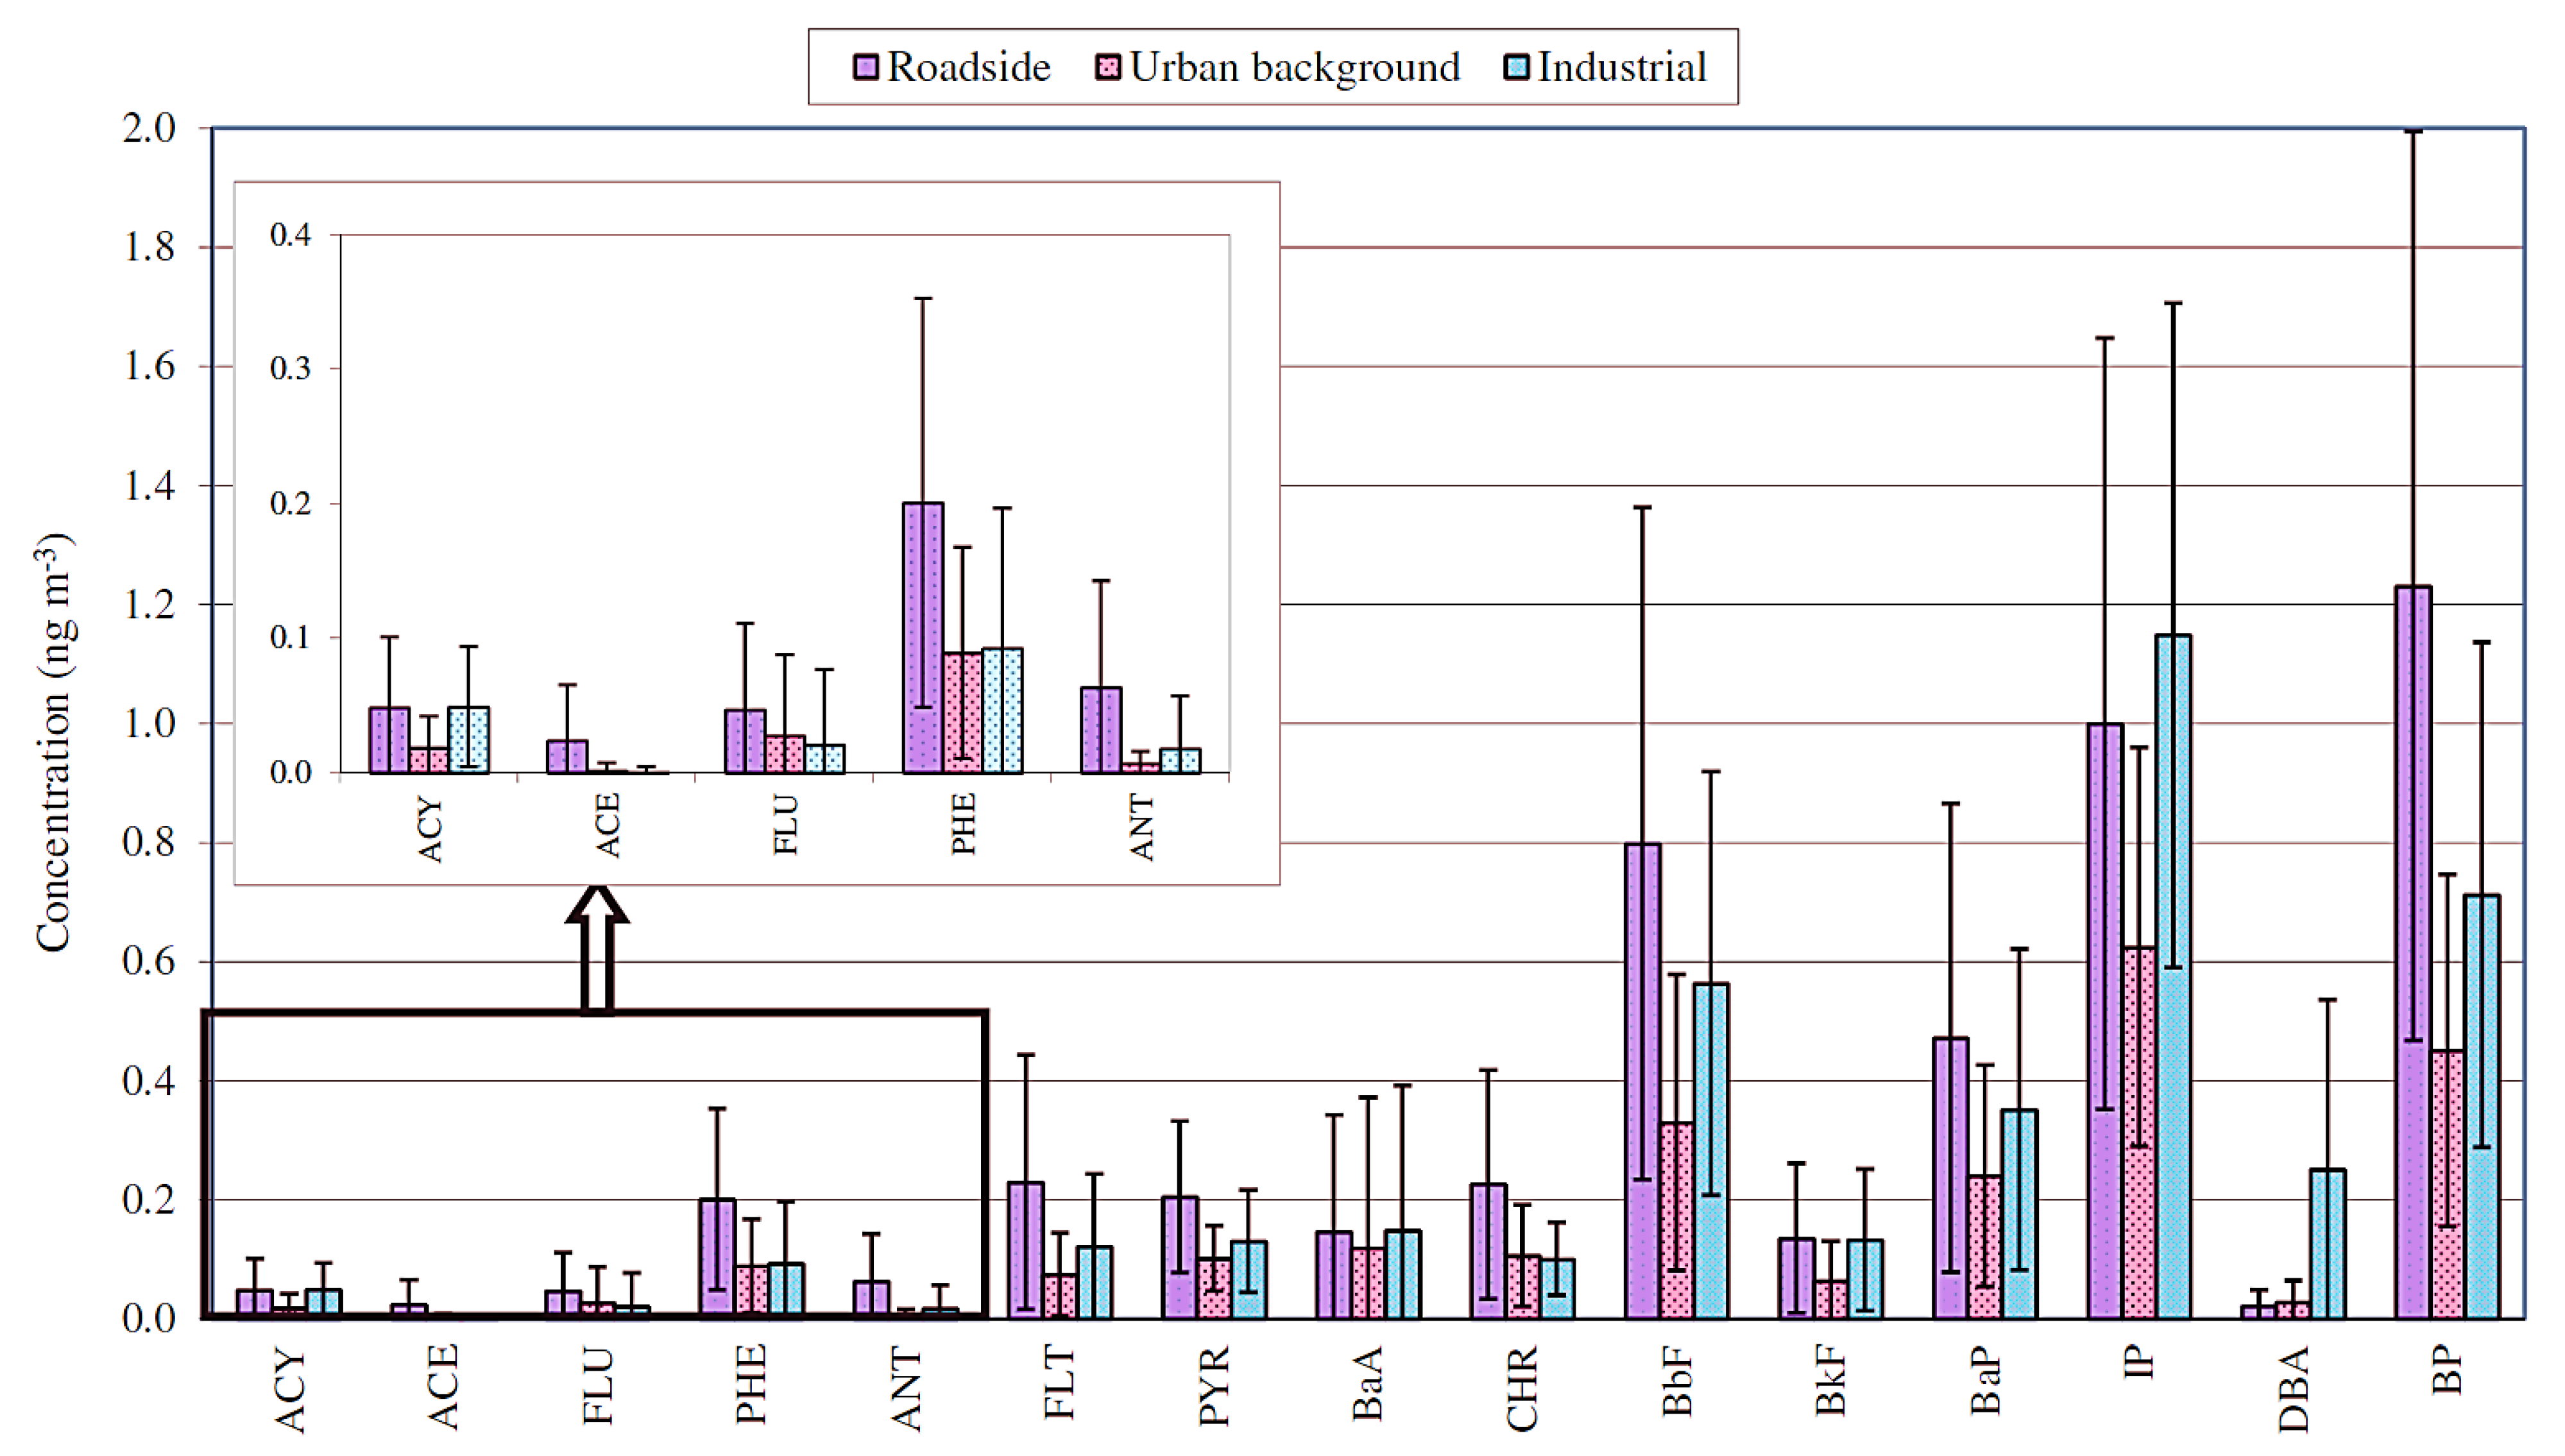
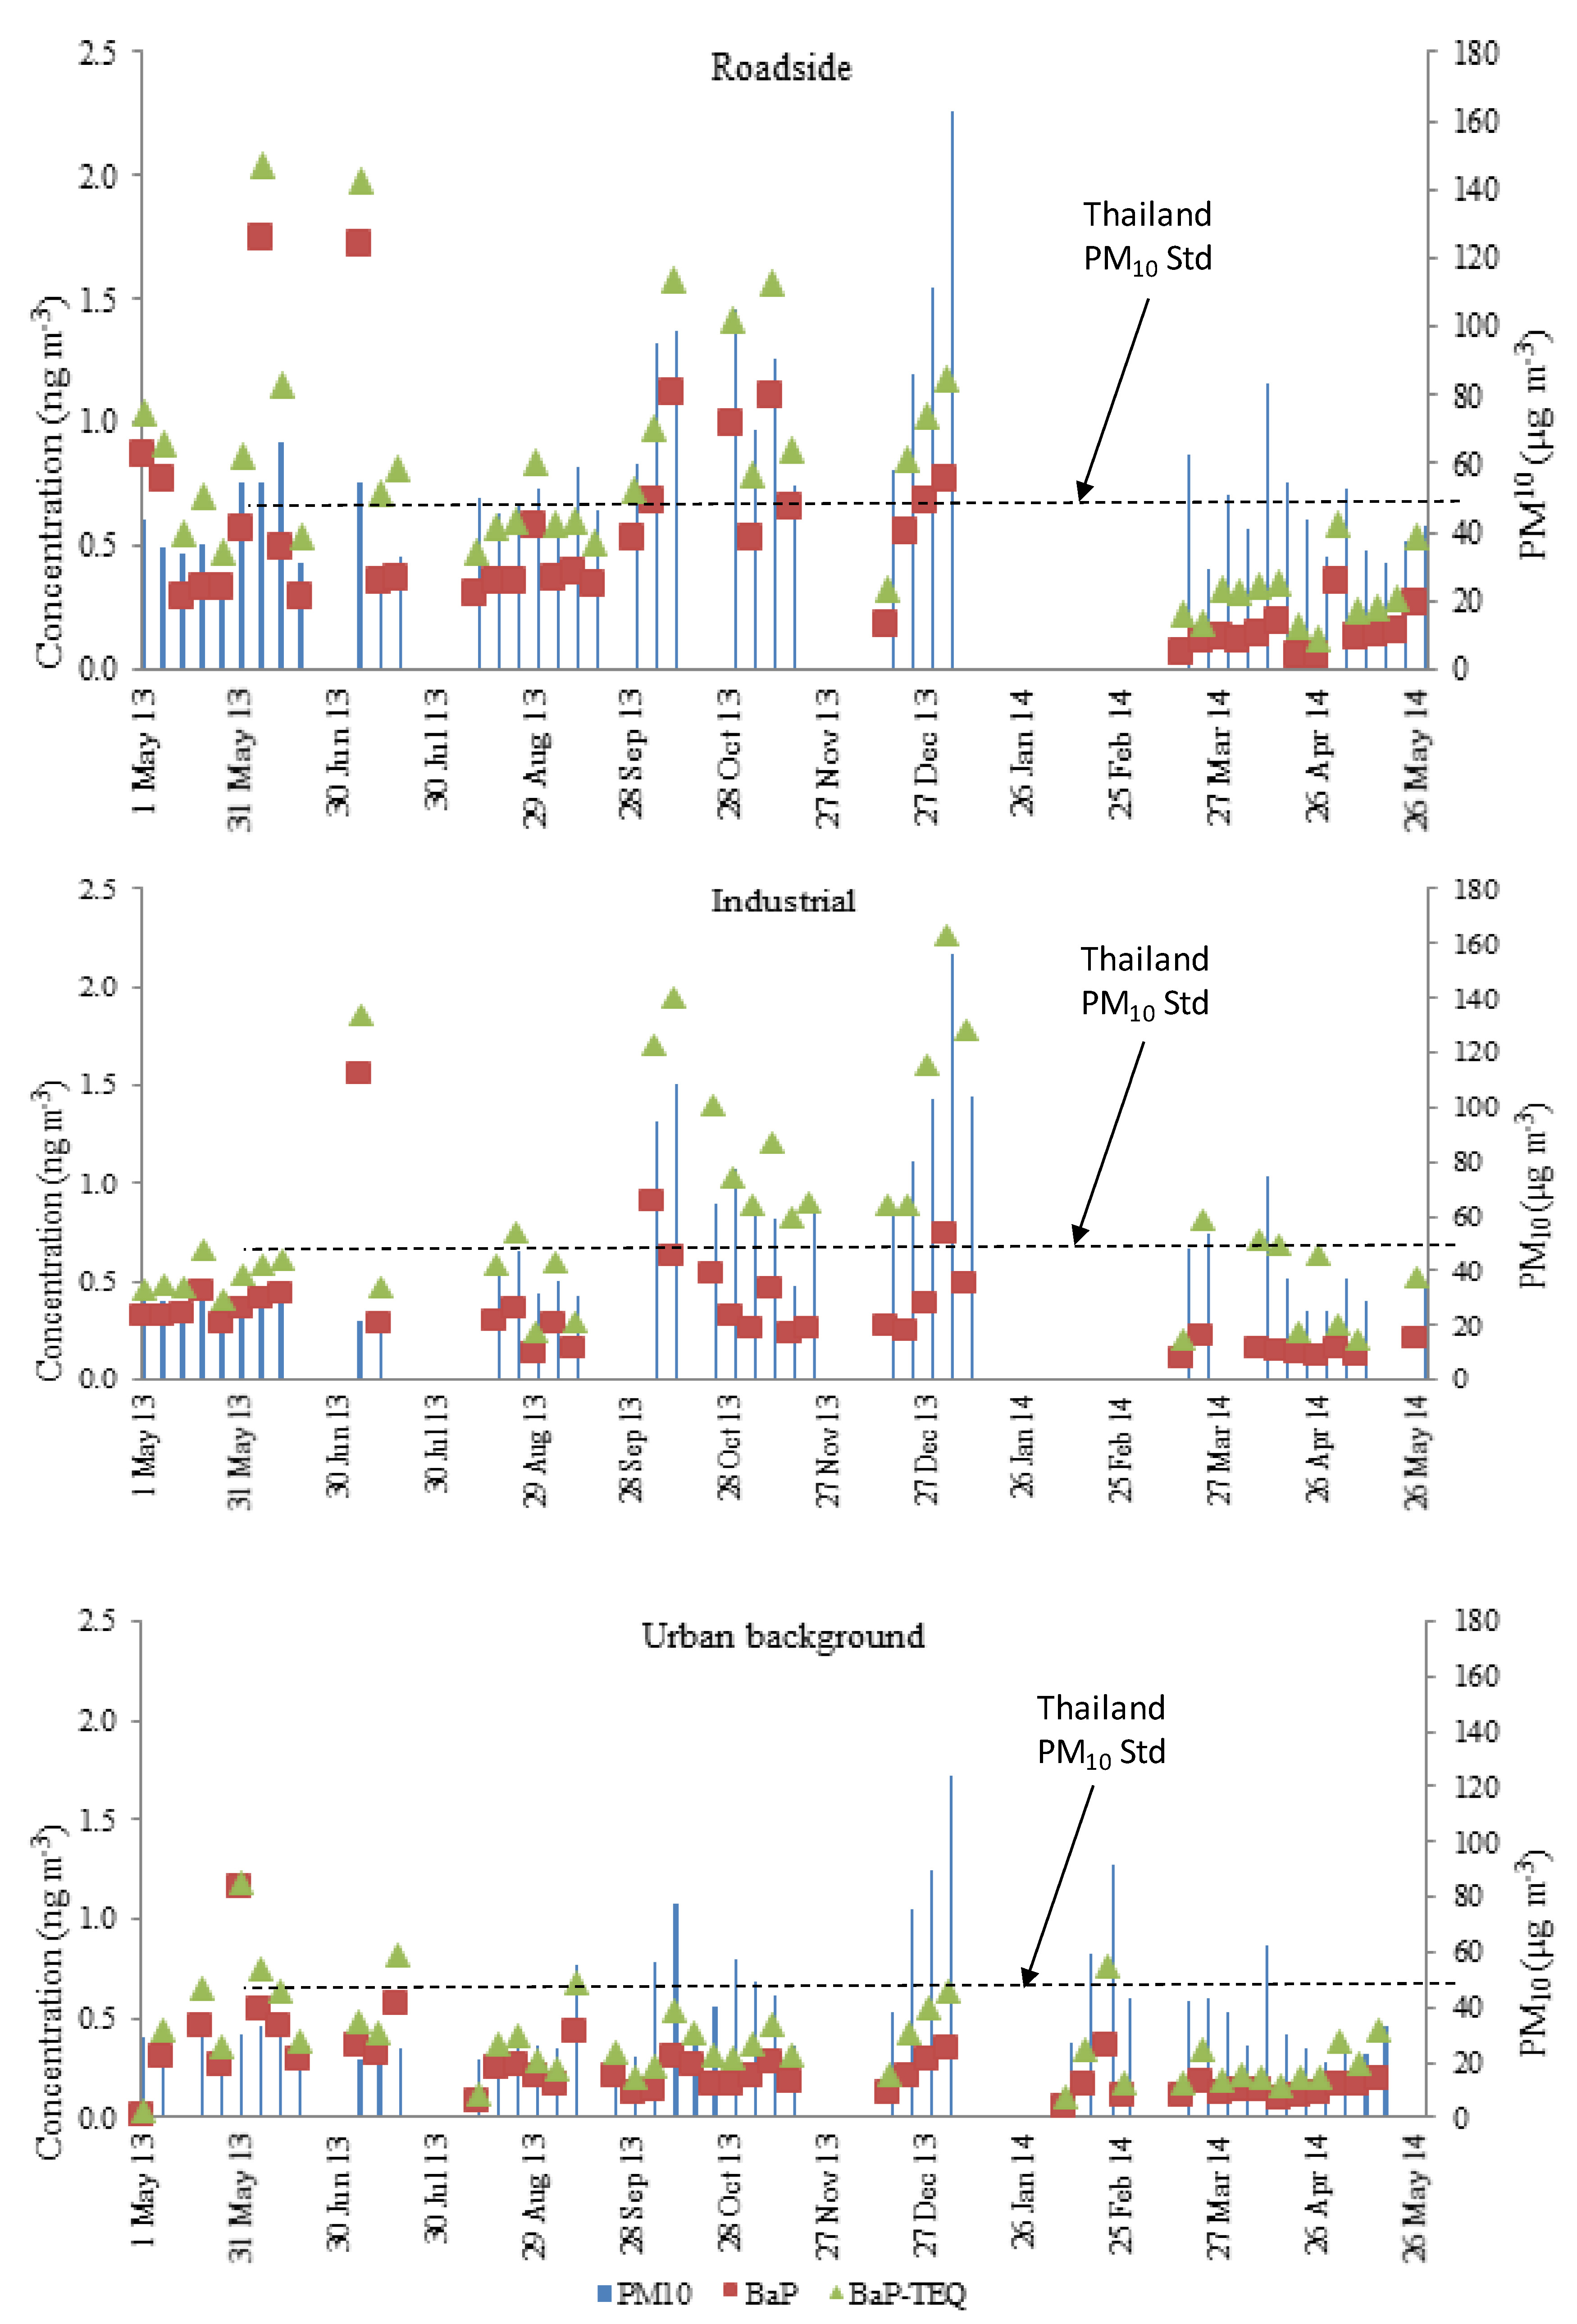
  • Compare the relative magnitudes of PM10, pPAHs and related toxic equivalent concentrations at the roadside, background and industrial locations.
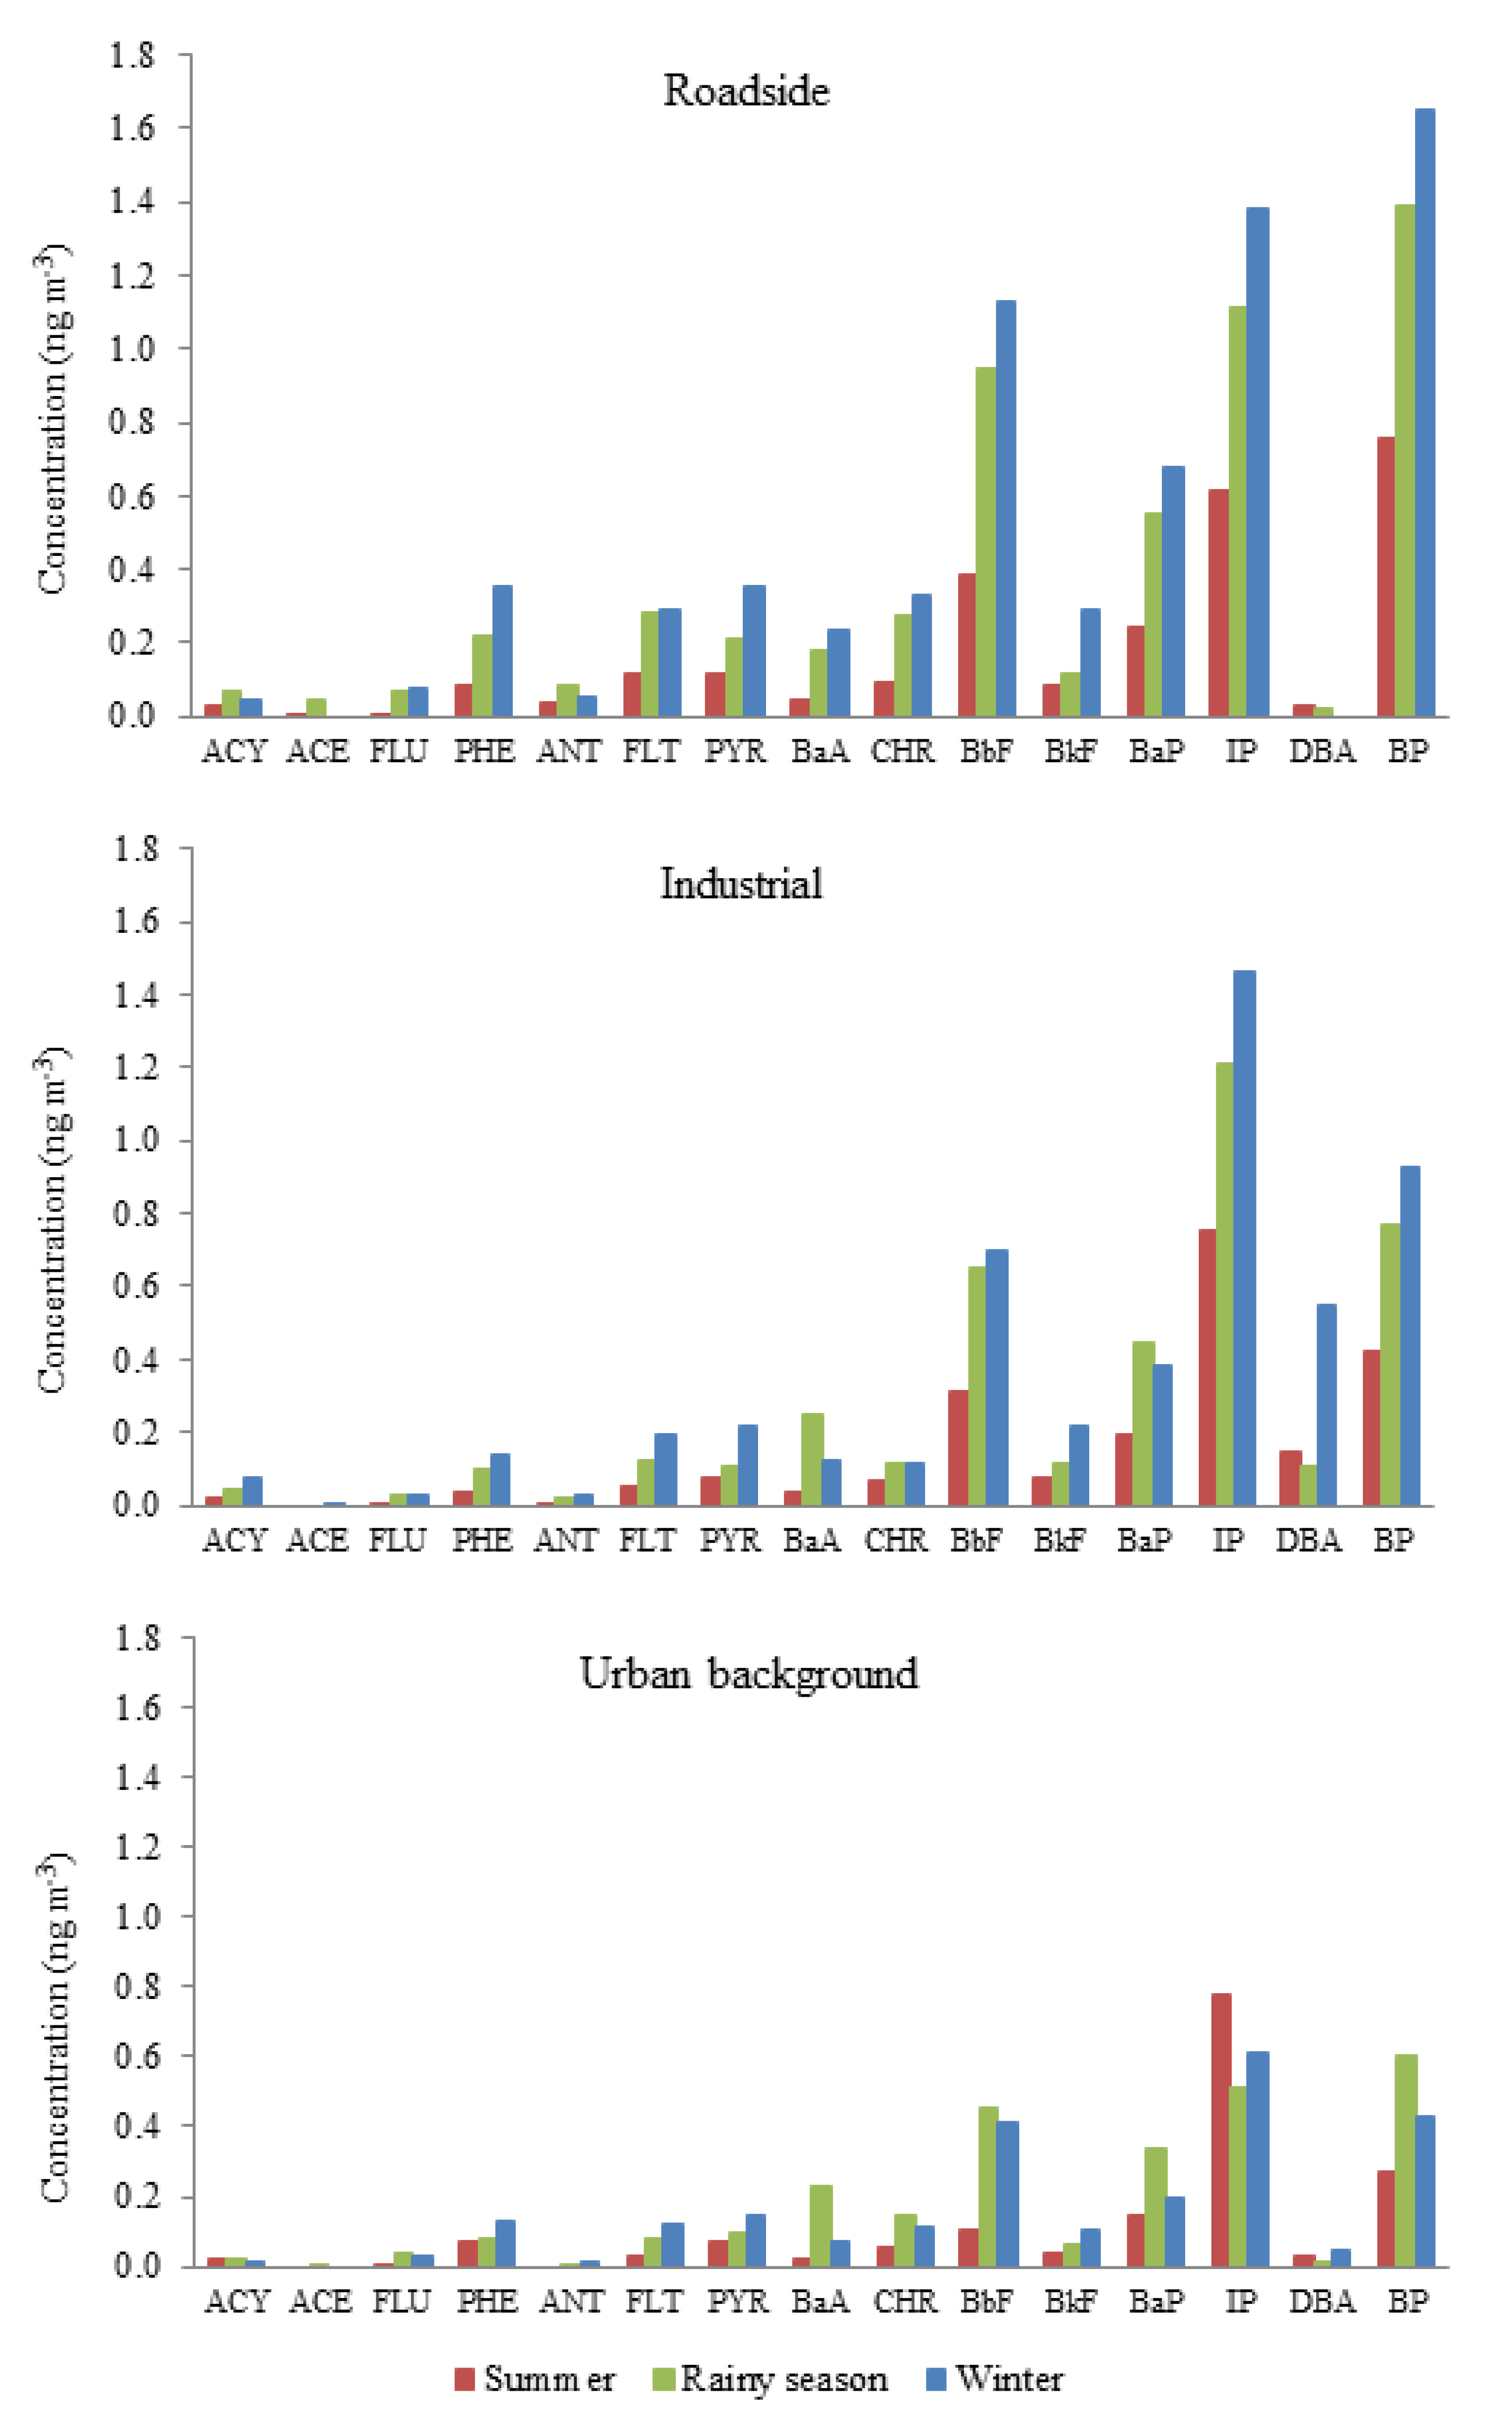
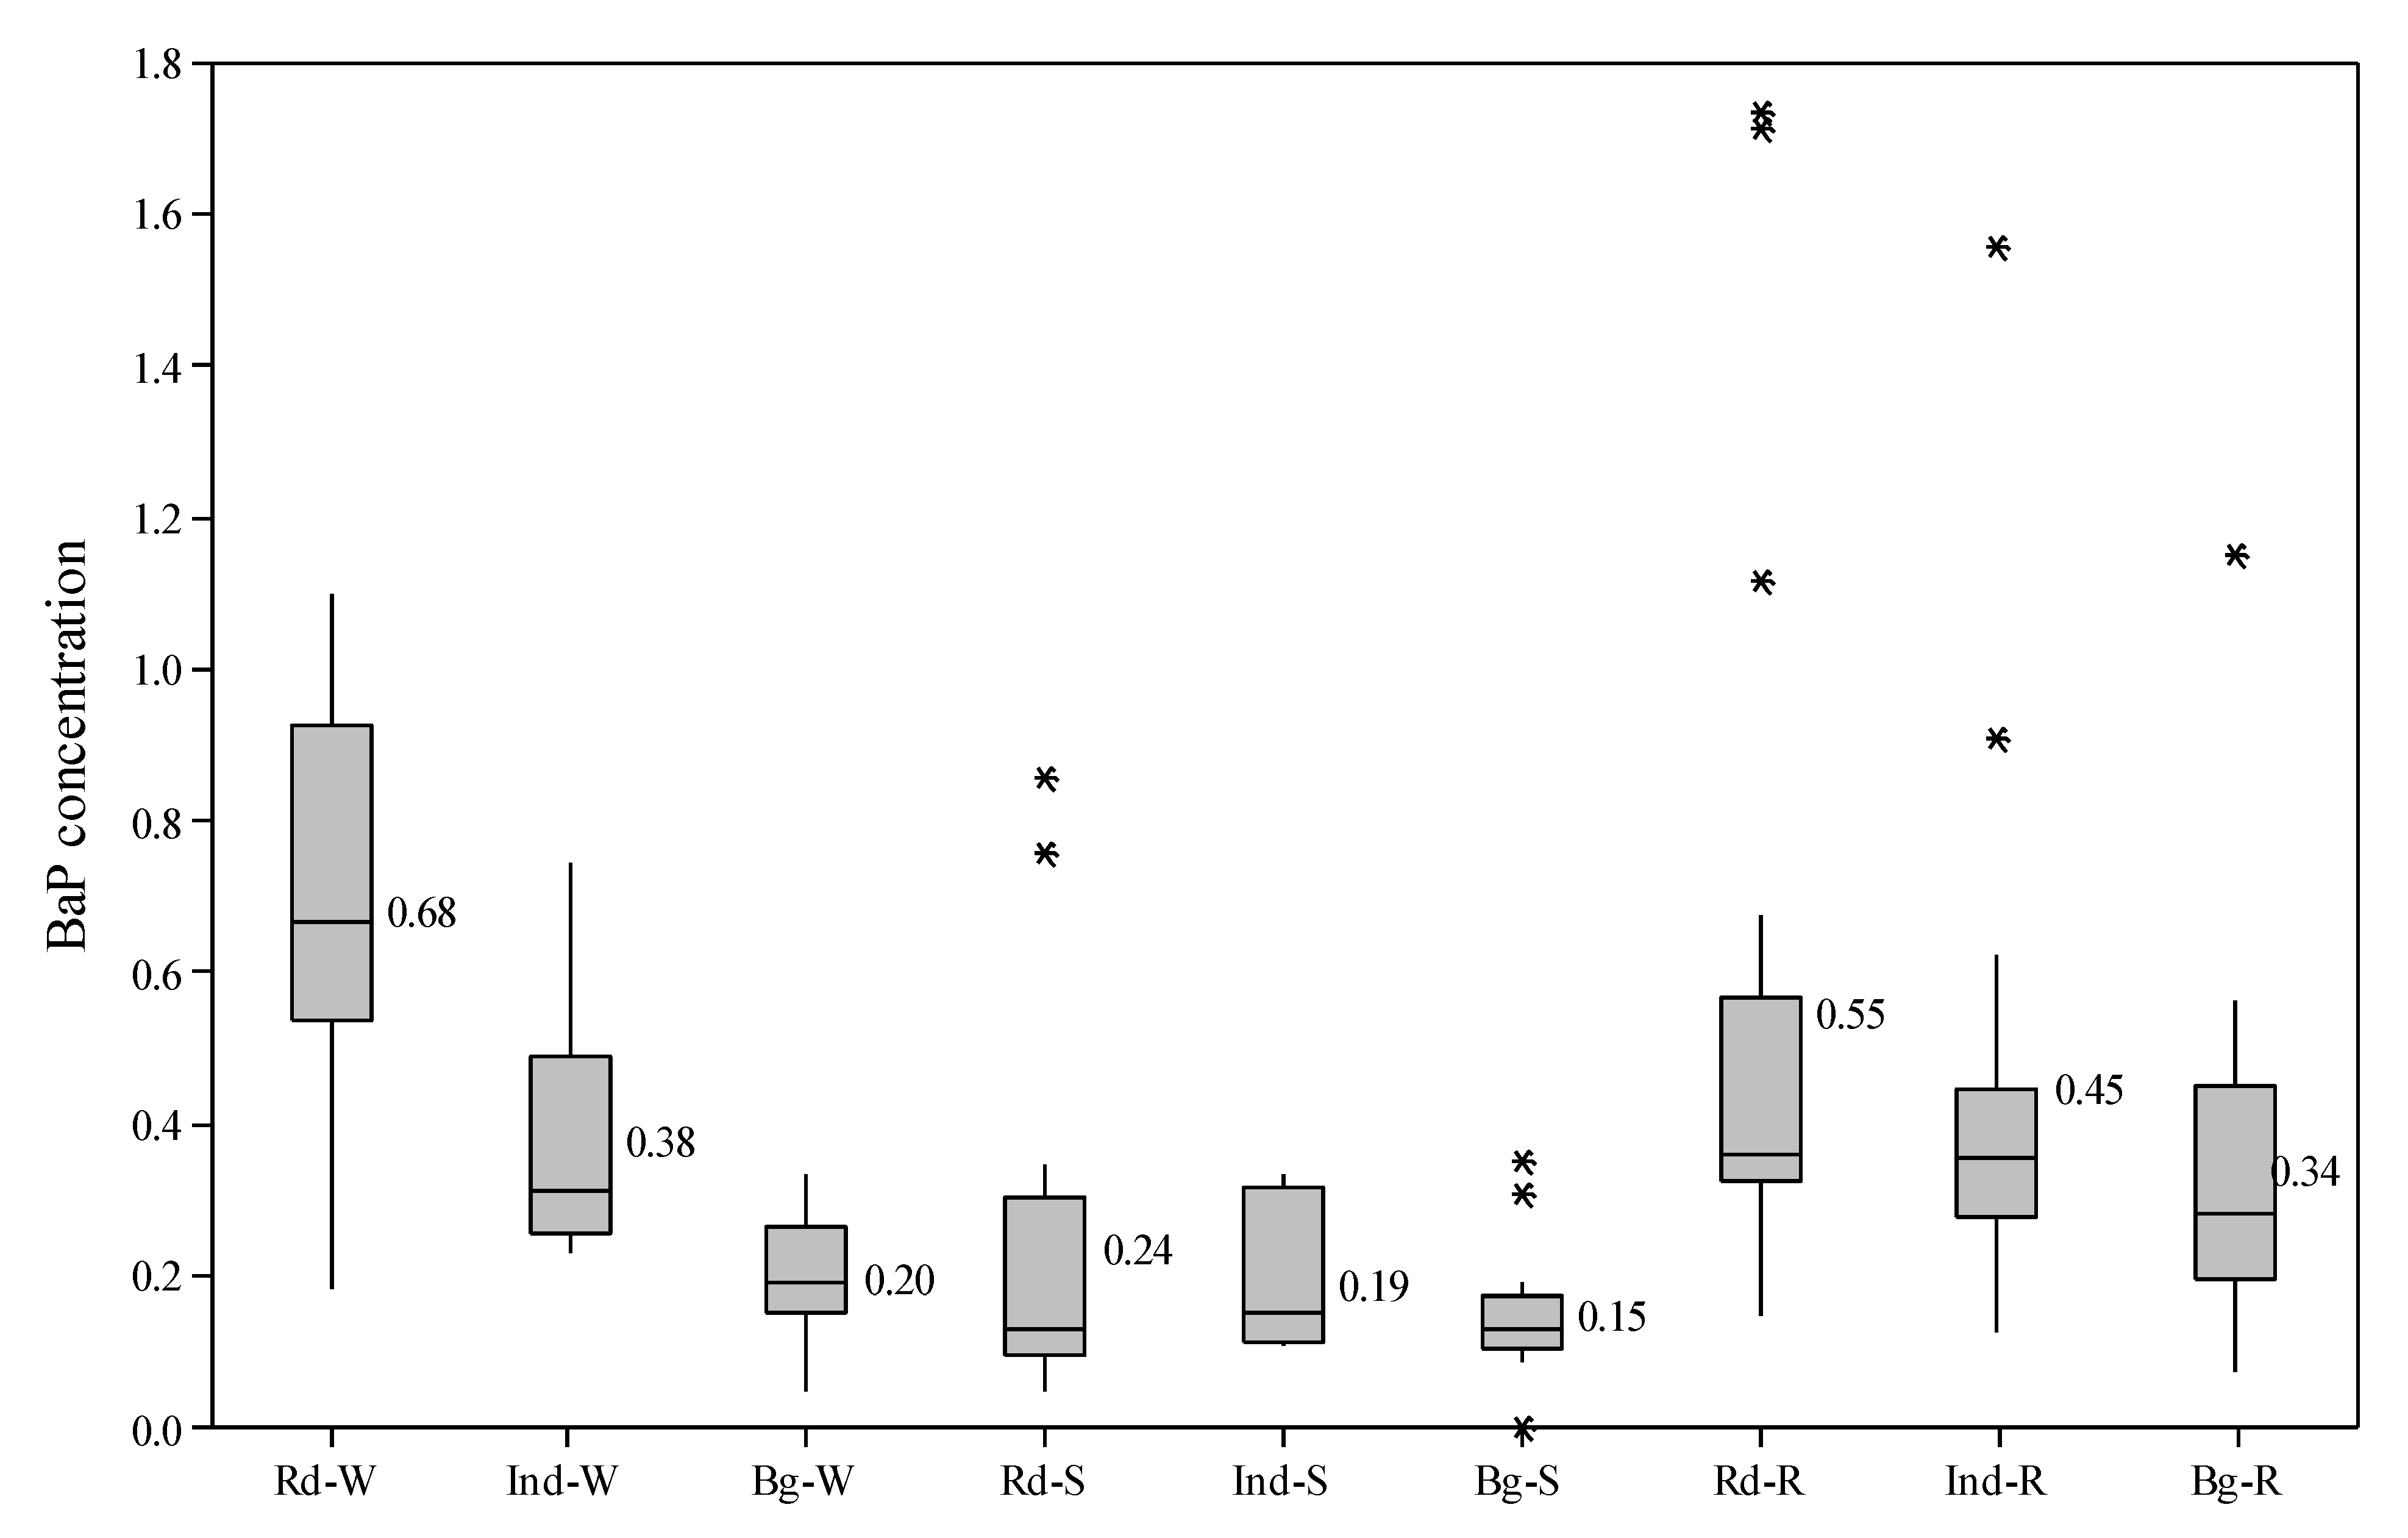
  • Examine seasonal effects of concentrations of the above metrics at the three sites.
  • Estimate the lung cancer risk of inhalation exposure from specific pPAHs [25].

2. Materials and Methods
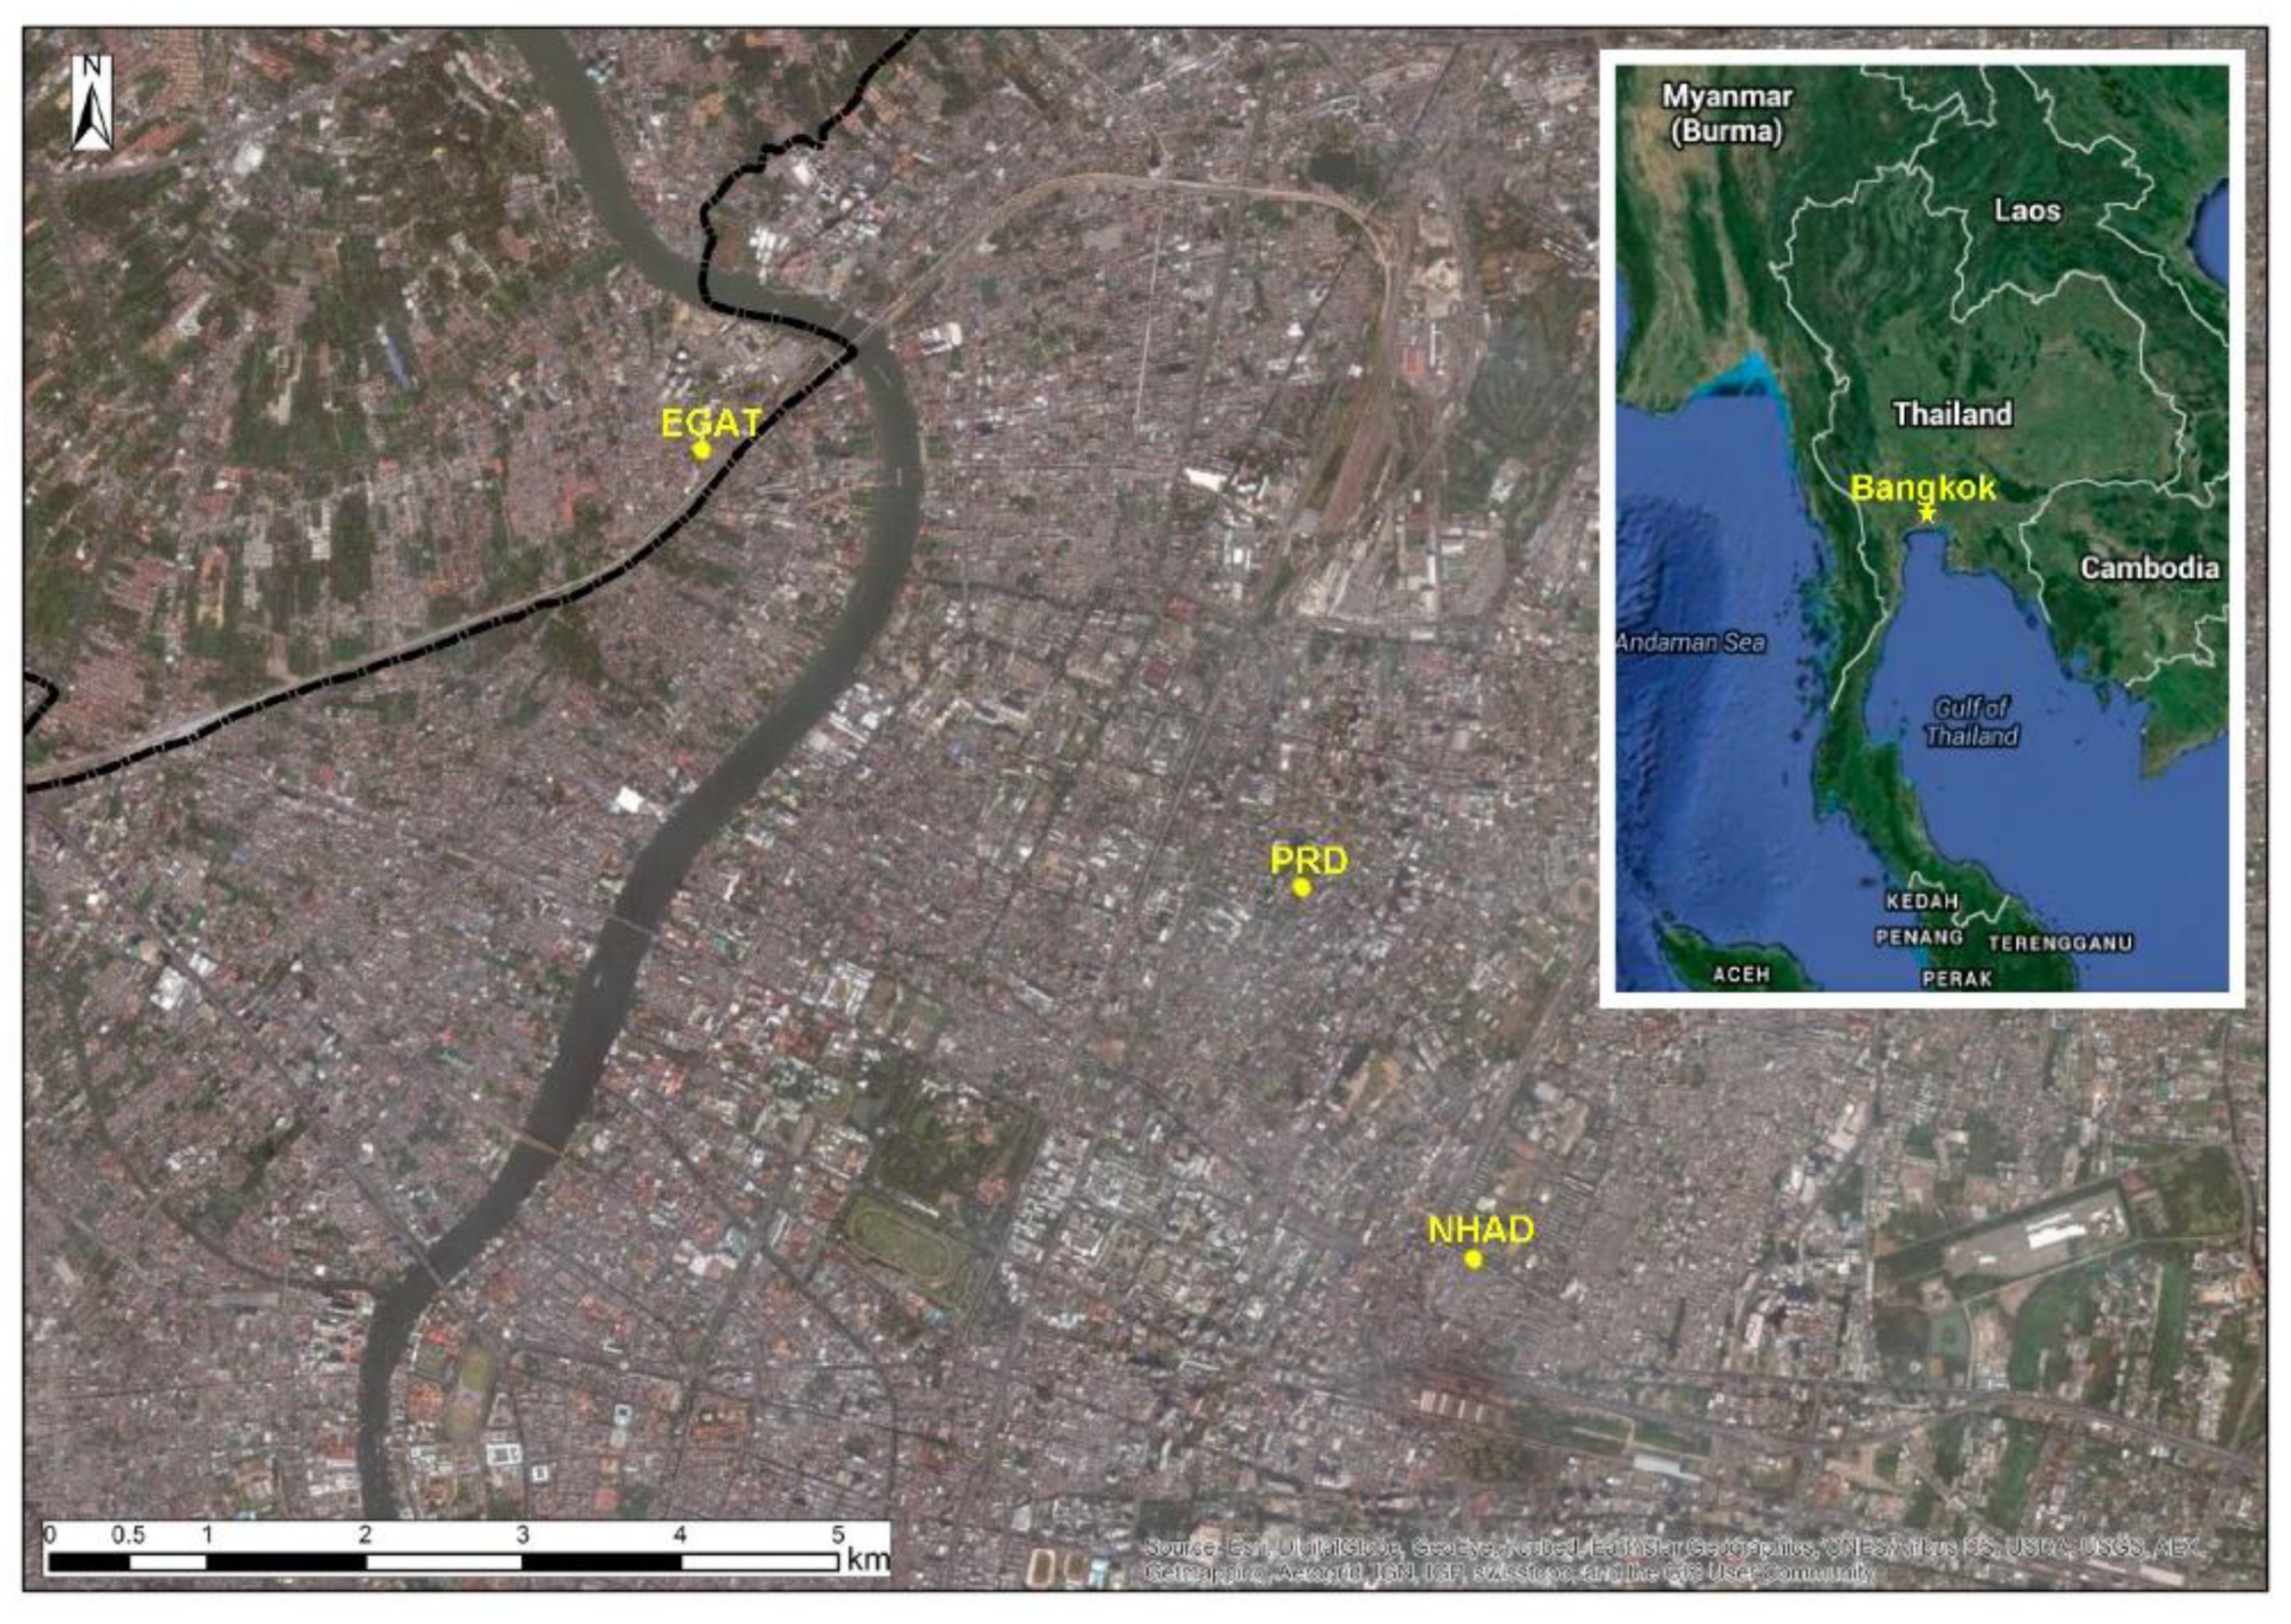
2.1. Sampling Sites

PM10 samples were collected at three sampling sites in the BMA (Table 1). Sampling sites representing roadside, urban background and industrial environments were located at the National Housing Authority Dindaeng (NHAD), the Public Relations Department (PRD) and the Electricity-Generating Authority of Thailand-Nonthaburi (EGAT), respectively (Figure 1). Sites were classified according to major emission sources existing in the immediate vicinity. Air samples were collected at a flow rate between 1.1 and 1.7 m3 min−1 for 24 h. PM10 samples were collected onto a quartz fiber filter (Whatman QMA, 20.3 × 25.4 cm) using a high-volume air sampler equipped with a PM10 inlet (Graseby GMW high-volume air sampler, Andersen Instruments, Inc., Smyrna, GA, USA). A 24-h integrated PM10 sample was collected from each site every six days from May 2013 to May 2014. Samples were analyzed for particulate matter mass concentrations and then wrapped in aluminum foil and stored at −20 °C until transportation to the University of Strathclyde (Glasgow, UK), where filters were preserved at −80 °C until extraction and analysis.

2.2. PAH Extraction

Samples were extracted using an accelerated solvent extraction ASE350 system (Dionex, Ltd., Camberley, UK). A total of 30 µL of surrogate PAHs solution containing 500 µg mL−1 of naphthalene-d8, fluorene-d10 and pyrene-d10 was spiked onto filter prior to the extraction to determine the extraction efficiency. All ASE packing agents were baked at 450 °C for 8 h before use. Silica gel was deactivated with 10% w/w deionized water. A filter sample was cut into small pieces and packed into the extraction cell with approximately 3 g of silica gel and 3 g of anhydrous sodium sulphate as in-cell cleanup agents while the remaining cell volume was filled with pelletized diatomaceous earth. Samples were extracted in three cycles with a solvent mixture of toluene-hexane, volume ratio 4:1. The ASE extraction temperature was at 110 °C with 6 min static time and 1500 psi pressure. Extracts were dried with anhydrous sodium sulphate and then evaporated without further purification under vacuum using a Büchi Syncore® Analyst (Buchi, Ltd., Newmarket, UK). The final volume of each sample was adjusted to 1.5 mL with toluene and spiked with 30 µL of 1000 µg mL−1 internal standard solution (acenaphthene-d10, phenanthrene-d10, chrysene-d12) prior to the GC-MS analysis. The 16 US EPA priority PAHs were quantified by a quadrupole gas chromatograph-mass spectrometer (Thermo Scientific, Inc.).

2.3. PAH Analysis

A Thermo Scientific Trace Ultra GC equipped with a TriPlus auto sampler and a Zebron ZB-Semi Volatile capillary column (30 m, 0.25 mm i.d., 0.25 µm film thickness) was used for PAH analysis. A total of 1 µL of sample was injected in a split mode (split ratio 10:1) at an inlet temperature of 280 °C. The initial temperature program was at 50 °C and held for 2 min and then ramped at 35 °C min−1 to 240 °C, ramped at 6 °C min−1 to 295 °C, ramped at 25 °C min−1 to 325 °C and then held for 0.50 min. The helium carrier gas flow rate was held constant at 1.4 mL min−1 throughout the run time. The solvent delay was set to 3.5 min. The transfer line and ion source temperatures were set at 325 °C and 230 °C, respectively. The quadrupole mass spectrometer (DSQ II) was set to quantify target compounds in selected ion monitoring (SIM) mode. Samples were analyzed in triplicates and regent blanks were analyzed (one for each batch of 10 samples) to determine analytical bias.

2.4. Statistical Analysis

Statistical analysis was performed using Microsoft ExcelTM 2010 Version 14.0 (Microsoft Corporation, Washington, DC, USA) and MinitabTM 16 Version 16.2.4 (Minitab Inc., Coventry, UK). Descriptive statistics, e.g., the mean, standard deviation, t-test, etc., were calculated using data analysis features of Microsoft ExcelTM software.

2.5. Determination of Exposure Concentration (EC)

Annual mean concentrations of individual PAHs were measured at the three sampling sites representing the roadside, urban background and industrial environment in the BMA. Integrated 24-h PAHs in PM10 filters were quantified in 43 samples from the roadside site, 46 samples from the urban background site and 37 samples from the industrial site. Annual mean concentrations of FLU, PHE, ANT, FLT, PYR, BaA, CHR, BbF, BkF, BaP, DBA, IP and BP were multiplied by corresponding TEFs to estimate the concentration equivalent to BaP (BaP-TEQ). BaP-TEFs were considered as per Larsen and Larsen (1998). The total sum BaP-TEQ of 13 PAHs represents the contaminant concentration in air (CA) at each site, which is then converted to the exposure concentration of the population. CA and EC were calculated from the following equations. Carcinogenic risks were calculated using age-specific factors given in Table 2.
CA = 0.0005 * FLU + 0.0005 * PHE + 0.0005 * ANT + 0.05 * FLT
+ 0.001 * PYR + 0.005 * BaA + 0.03 * CHR + 0.1 * BbF + 0.05 * BkF
+ 1 * BaP + 1.1 * DBA + 0.1 * IP + 0.02 * BP
EC = (CA × ET × EF × ED)/AT
where:
  • CA = contaminant concentration in air as BaP-TEQ concentration (ng m−3)
  • EC = exposure concentration (ng m−3)

2.6. Estimation of Incremental Lifetime Cancer Risk (ILCR)

Exposure concentration to PAHs via inhalation of PM10 for each receptor can be estimated as a time-weighted average concentration from the annual mean pPAHs concentrations represented by BaP-TEQ concentration. The carcinogenicity of PAHs is characterized by the inhalation unit risk (IUR) or cancer slope factor (CSF) of BaP. Idealized residents and workers were selected for the long-term exposure assessment. The resident group was subdivided by age to reflect the difference in receptor exposure parameters, i.e., body weight (BW), inhalation rate (IR), exposure duration (ED), exposure time (ET), and exposure frequency (EF). EC is used to calculate the lifetime average daily dose (LADD) for receptors at the roadside, urban background and industrial sites over a lifespan of 70 years (AT). The incremental lifetime cancer risk (ILCR) to PM10-bound exposure is the product of LADD [26] and the cancer slope factor of BaP. The daily dose was not considered when calculating the risk characterized by IUR.
BaP is determined to cause cancer by a mutagenic mode of action and likely to represent a higher risk during early-life exposure. Thus, age-dependent adjustment factors (ADAF) are applied to both CSF and IUR [26,27]. The age specific adjustment is recommended for three time periods, as follows:
-
ADAF = 10 during 0 to 2 years of life;
-
ADAF = 3 during 2 to 16 years of life; and
-
ADAF = 1 from 16 to 70 years.
Using the lifetime exposure of 70 years, ADAFs were applied on the BaP inhalation slope factor value of 3.9 (mg kg−1 day−1)−1 and IUR value of 0.0011 (µg m−3)−1 [28]. Carcinogenic risks can be estimate according to the following equations:
ILCR = LADD × CSFAdj-–70
Risk = EC × IUR Adj–70

3. Results and Discussion

3.1. PM10-Bound PAH Profiles

The results for the annual mean PM10 in this study found no statistical difference between the roadside and industrial sites. The lowest annual mean PM10 was found at the urban background site. The mean PM10 concentrations were 56.44 ± 27.3 µg m−3 at the roadside site, 50.69 ± 31.1 µg m−3 at the industrial site and 39.80 ± 22.2 µg m−3 at the urban background site. The total pPAHs ranged from 1.09 to 13.10 ng m−3, 1.49 to 9.39 ng m−3 and 0.77 to 5.20 ng m−3 at the roadside, industrial and urban background sites, respectively. The annual and seasonal concentrations of individual PAHs are provided in the Supplementary Information (Table S1).
Among 15 PAHs measured, PHE was the most abundant low-molecular-weight three-ring PAHs found at all sampling sites while ACE was the least abundant of all pPAHs. Concentrations of three-ring PAHs were likely to be underestimated due to their volatility and likely to partition into the gas phase. The analysis of 16 PAHs in PM10 samples in Malaysia showed that PHE and ANT were the only three-ring PAHs detected in the particulate phase [29]. PM10-bound PAHs were mostly in the range from four- to six-ring PAHs with higher molecular weights. The most abundant pPAHs were BP, IP and BbF, while BaP ranked fourth in all sampling sites (Supplementary Information). A previous study in Bangkok observed higher PAHs annual mean; however, their rankings were similar, implying that compositions of roadside PAHs have not significantly changed in the past 10 years in [30].
Annual mean concentrations of all PAHs except IP and DBA were highest at the roadside site as a result of vehicular emissions. IP and DBA mean concentrations were highest at the industrial site, indicating source-specific emissions (Figure 2). The lowest pPAH concentrations were found at the urban background site where there were no prominent sources. Traffic emissions were the main contributors of pPAHs and the most-abundant PAHs were IP, BP, BbF and BaP, which is consistent with studies previously conducted in the BMA [30,31]. Results from previous studies have also shown high concentrations of benzo[e]pyrene and coronene at roadside sites. BP, coronene and PHE were markers for motor vehicle emissions [32]. In this study, BP and PHE concentrations were significantly higher at the roadside than other sites affirming traffic emissions. Annual mean concentrations of 15 PAHs (standard deviation) measured at the roadside, urban background and industrial sites are illustrated in Figure 2.
Annual mean BaP concentrations at the roadside, industrial and urban background sites were 0.47± 0.39 ng m−3, 0.35 ± 0.27 ng m−3 and 0.24 ± 0.19 ng m−3, respectively. Although PM10 concentrations found at the roadside and industrial areas were significantly higher than the WHO-recommended guideline annual mean of 20 µg m−3, annual mean concentrations of BaP were found below the EC limit value of 1 ng m−3. Daily concentrations of BaP were generally within EC and UK limits, with a few daily excursions above guideline values (Supplementary Information). PM10 and BaP concentrations measured in different cities (Supplementary Information) were compared with BaP concentrations in this study, and it was found that the results were lower than the previous study in Bangkok [20,30] and that levels of PM10 in this study were comparable to those measured in Malaysia with slightly higher BaP concentrations in the BMA [29].
The mean concentrations of 15 pPAHs are shown in Figure 3 under different weather conditions. Most PAH concentrations at roadside and industrial sites were highest in the winter and lowest in the summer, similar to the study in Delhi [33]. PM10 concentrations were highest in the winter at all sites, suggesting higher emissions in the winter than in other seasons. While PM10 concentrations were not significantly different in the summer and rainy season, the mean concentrations of most PAHs were noticeably lower in the summer, except for IP at the urban background site and DBA at the roadside and industrial sites. Most pPAH concentrations in the winter and rainy season at the roadside and industrial sites were higher than summer concentrations. At the background site, some pPAHs including BaA, BaP and BP were found at higher concentrations in the rainy season than in the winter.
BP, IP, BbF and BaP were the most abundant pPAHs at all sampling sites. The previous study found that IP and BP were the highest pPAHs in Bangkok ambient PM10 from November 1999 to November 2000 [30]. BaP concentrations were the fourth highest among 15 PAHs concentrations measured but appeared to be significantly lower than the top three PAHs. In this study, BP, IP, BbF and BaP appeared in the same order; however, they were at significantly lower concentration ranges, despite similar annual average PM10 concentrations. The annual mean BaP concentrations in 2000 were found at 4 to 5 ng m−3 at roadside sites. The results of roadside PAH concentrations pointed to a significant reduction of traffic-related pPAHs over the past decade.
The time series variability of daily PM10 concentrations evaluated for BaP and carcinogenic PAHs (seven PAHs: BaA, CHR, BbF, BkF, BaP, IP and DBA) showed no major insight and are provided to the reader within the Supplementary Information (Figure S2a–c). Though variable, there is a general increasing trend of PM10 concentrations that began during the dry season in November 2013 and reached the highest concentration in January 2014 at all study sites. Total PAH concentrations were highest in the rainy season at the roadside and urban background sites, and in the winter at the industrial site. The total PAH and PM10 concentrations exhibited similar variation patterns throughout the measurement, indicating consistent emission sources. In contrast, daily PM10 and PAH concentrations were inconsistent at the roadside and urban background sites, which implied that they originated from various emission sources.
Seasonal mean BaP concentrations were compared at three sampling sites during summer (mid-February to mid-May), rainy season (mid-May to mid-October) and winter (mid-October to mid-February), as shown in Figure 4. The dominant wind direction and the relationship between PM10 and PAHs for each season can be found in the Supplementary Information (Figures S2–S4). The mean BaP concentrations at the roadside site were significantly higher in the winter (0.68 ± 0.28 ng m−3) and rainy season (0.55 ± 0.44 ng m−3) than other sites. Seasonal variations of BaP showed the highest mean concentration at the roadside site in winter at 0.68 ± 0.28 ng m−3 together with the highest mean PM10 concentration of 92.03 ± 35.27 µg m−3. Seasonal mean BaP concentrations were lowest in the summer and no significant difference was found among summer mean concentrations at all sites.
At the roadside site, the mean BaP concentration was significantly lower in the hot and humid conditions of summer (0.24 ± 0.25 ng m−3, p = 0.015) than in other seasons. At the industrial site, the mean BaP concentration was significantly lower in the summer (0.19 ± 0.09 ng m−3, p = 0.047) than in the rainy season (0.45 ± 0.36 ng m−3). At the urban background site, the mean BaP concentration was significantly lower in summer (0.15 ± 0.09 ng m−3, p = 0.005) than in the rainy season (0.34 ± 0.24 ng m−3). Higher temperatures and available solar radiation could favor the loss of PAHs from photochemical reactions, resulting in the lowest mean BaP concentrations in the summer. The mean BaP concentrations in the rainy season and winter were not significantly different at all sampling sites. The highest BaP concentrations were observed in the rainy season at all sites, while the highest PM10 concentrations occurred in the winter. This implied that sources of BaP were particles distributed in a smaller size range than 10 µm.

3.2. Carcinogenicity of PM10-Bound PAHs

Toxicity equivalency factors (TEF) of 13 PAHs proposed by Larsen and Larsen (1998) [21] were selected for the calculation of BaP-TEQ concentrations of pPAHs. Annual mean concentrations of 13 PAHs and total BaP-TEQ concentrations are summarized in the Supplementary Information (Table S3). While the total PAH and BaP concentrations were highest at the roadside site, the highest BaP-TEQ concentration was found at the industrial site, emphasizing the importance of PAH compositions. DBA possessing a higher TEF than BaP plays an important role in the total carcinogenicity of pPAHs at the industrial site. Therefore, speciation of PAHs is essential in evaluating the carcinogenic risk posed by exposure to particulate-bound PAHs.
The total BaP-TEQ concentrations were determined to be 0.83, 0.72 and 0.39 ng m−3 at the industrial, roadside and urban background sites, respectively. A previous study estimating BaP-TEF using Nisbet and LaGoy (1992) [34] proposed that the TEF in both gas and particulate phases of traffic PAHs in Thailand was at 3.73 ng m−3 [35]. Our study showed that pPAH concentrations at the roadside site were lower than previously reported from 1999 to 2000 [30,31]. Levels of BaP-TEQ in the BMA measured from 2013 to 2014 were comparable with BaP-TEQ in the metropolitan area of Curitiba, Brazil, which ranged between 0.45 and 0.69 ng m−3 [36]. The Froehner et al. (2011) [36] study reported estimated lung cancer risks between 8.16 × 10⁻⁹ to 1.38 × 10⁻⁸ using the CSF value of 3.14 kg mg−1 d−1.
Time series plots of BaP, BaP-TEQ and PM10 at three sites are shown in Figure 5. BaP and BaP-TEQ concentrations appeared to fluctuate in a similar manner at both the roadside and urban background sites, with higher concentrations at the roadside site. The highest BaP-TEQ concentrations were found in the rainy season at the roadside and urban background sites. Although the highest BaP concentration was found in the rainy season at the industrial site, the highest BaP-TEQ concentration was observed in the winter, with the highest PM10 concentration. BaP-TEQ to BaP concentration ratios were 1.7, 1.8 and 2.6 at the urban background, roadside and industrial sites, respectively. The highest proportion of BaP-TEQ/BaP ratio was found to be 3.4 at the industrial site in winter.
Although BaP is the most studied PAHs in terms of carcinogenicity, previous studies showed different toxicity values, implying some discrepancy in the risk assessment [33,37]. It is shown that BaP is responsible for approximately 60% of pPAH carcinogenicity at the roadside and urban background sites in the BMA. The PAHs profile at the industrial site resulted in a higher contribution from DBA (33% of pPAH carcinogenicity) and lower contribution of BaP (42% of pPAH carcinogenicity). Therefore, the BaP toxic equivalent should be considered when evaluating human health risk posed by exposure to the ambient PAHs mixture.
Incremental lifetime cancer risks were calculated from exposure concentrations in three study areas to illustrate the carcinogenic risk associated with long-term pPAH exposure. Lifetime lung cancer risks estimated from IUR were slightly higher than those estimated from CSF (Table 3). ILCR of ambient PM10-bound PAH exposure calculated in resident adults ranging between 1.6 × 10⁻⁷ to 1.4 × 10⁻⁶ were within the 1/1,000,000 threshold. However, it is important to further investigate both the gas-phase and particulate-phase PAHs to assure that the risk level is acceptable.

4. Conclusions

High PM10 concentrations were observed at the roadside (56.4 ± 27.3 µg m−3) and industrial (51.0 ± 31.1 µg m−3) sites in the Bangkok Metropolitan Administration. PM10-bound PAHs were quantified, and the associated carcinogenic health risks were estimated. PM10 and pPAH measurements made over a one-year period indicated high concentrations of PAHs during dry and cool winter conditions. In contrast, PM10 and most pPAH concentrations were significantly lower in the hot and humid summer period than during other seasons. Seasonal variations of pPAHs result in higher average total carcinogenicity during the winter, possibly as a result of higher particulate concentrations and less photochemical degradation.
Carcinogenic four- to six-ring PAHs were major components of overall pPAH composition. BaP accounted for approximately 60% and 40% of total carcinogenicity at the roadside and urban background sites, respectively, and 40% of total carcinogenicity at the industrial site. The profile of relative concentrations of PAHs was markedly different at the industrial site, resulting in the highest average total carcinogenicity of 0.83 ng m−3 BaP-TEQ. The average total carcinogenicity was lowest at the urban background site (0.39 ng m−3 BaP-TEQ). The average BaP concentrations were below the published EC limit (1 ng m−3). The lifetime BaP-TEQ lung cancer risks estimated from concentrations at all sampling sites were 0.16 to 1.4 cancer cases per million people, with higher estimated health risks in roadside and industrial areas. Although concentrations of PM10-bound PAHs were within the published EC limit, PM10 concentrations were almost three times higher than the published WHO guideline. These observations provide quantitative exposure estimates to help inform future Thai national air pollution standards and policy, including potential for a reduction in carcinogenic health risks from exposure to pPAHs that could result from a reduction in PM10 pollution, particularly during the winter.

Supplementary Materials

The following are available online at https://www.mdpi.com/article/10.3390/app11104501/s1, Table S1: Meteorological parameters, seasonal and annual concentrations of PM10 (µg m−3) and PAHs (ng m−3). Table S2: Concentrations of PM10 (µg m−3) and BaP (ng m−3) in different countries. Table S3: Annual mean pPAHs concentrations, BaP-TEQ concentrations and percentage of BaP-TEQ concentrations. Figure S1: Daily mean concentrations of BaP (ng m−3) at the roadside, industrial and urban background sites compared with the EC (1 ng m−3) and UK (0.25 ng m−3) annual average guidelines. Figure S2: Dominant wind directions for each site in each of the 3 seasons. No statistical relationship between the wind patterns and the PAHs measured were found. Figure S3: Linear correlation plots between PM10 vs. total PAHs from whole year data. Figure S4. Seasonal correlation plots between PM10 and total PAHs concentrations in the wet season (R) and cool-dry season (W) at the three sampling sites. Figure S5a: Time series plot of daily mean PM10 (µg m−3) and PAHs (ng m−3) concentrations at the roadside site. (Missing data indicted sampling failures where PM10 filters were not collected.) Figure S5b: Time series plot of daily mean PM10 (µg m−3) and PAHs (ng m−3) concentrations at the industrial site. (Missing data indicted sampling failures where PM10 filters were not collected.) Figure S5c: Time series plot of daily mean PM10 (µg m−3) and PAHs (ng m−3) concentrations at the urban background site. (Missing data indicted sampling failures where PM10 filters were not collected). References [38,39,40,41,42,43] are cited in the supplementary materials.

Author Contributions

Conceptualization, A.T. and P.T.; methodology, A.T., P.T., R.M.K.; validation, A.T. and P.T.; formal analysis, A.T. resources, R.M.K.; writing—original draft preparation, A.T. and R.M.K.; writing—review and editing, A.T., P.T., I.J.B., R.M.K.; visualization, A.T.; supervision, R.M.K. and I.J.B. All authors have read and agreed to the published version of the manuscript.

Funding

This research was supported by the Royal Government of Thailand and the Pollution Control Department.

Data Availability Statement

Acknowledgments

The authors would like to acknowledge a grant by the Royal Thai Government and the Pollution Control Department for funding. We acknowledge staff of the PCD (P’Ple-Suteera, P’Jarin, Hnu, Aun, Min, Joyce and air sampling staff) for their extra effort in addition to their routine workload to assist with data collection and sample preservation. Technical support by staff in the Department of Civil and Environmental Engineering was greatly appreciated.

Conflicts of Interest

The authors declare no conflict of interest.

References

  1. Available online: https://worldpopulationreview.com/world-cities/bangkok-population (accessed on 29 April 2021).
  2. PCD. Air Quality and Noise Standards. 2004. Available online: http://www.pcd.go.th/info_serv/en_reg_std_airsnd01.html (accessed on 16 May 2016).
  3. WHO. WHO Air Quality Guidelines for Particulate Matter, Ozone, Nitrogen Dioxide and Sulfur Dioxide; World Health Organisation: Geneva, Switzerland, 2006. [Google Scholar]
  4. Kondwani, R.C.; Michael, O.R.; Amornphat, T.; Laura, A.M.; Robert, M.K. Exploratory study of Polycyclic Aromatic Hydrocarbon (PAH) contributions to household air pollution arising from improved cookstove use in rural Malawi. Afr. J. Environ. Sci. Technol. 2019, 13, 36–51. [Google Scholar] [CrossRef]
  5. Callén, M.S.; de la Cruz, M.T.; López, J.M.; Mastral, A.M. PAH in airborne particulate matter. Carcinogenic character of PM10 samples and assessment of the energy generation impact. Fuel Process. Technol. 2011, 92, 176–182. [Google Scholar] [CrossRef]
  6. IARC. IARC Monographs on the Evaluation of Carcinogenic Risks to Humans; The International Agency for Research on Cancer: Lyon, France, 2010; Volume 92. [Google Scholar]
  7. Adonis, M.; Martínez, V.; Riquelme, R.; Ancic, P.; González, G.; Tapia, R.; Castro, M.; Lucas, D.; Berthou, F.; Gil, L. Susceptibility and exposure biomarkers in people exposed to PAHs from diesel exhaust. Toxicol. Lett. 2003, 144, 3–15. [Google Scholar] [CrossRef]
  8. Amador-Muñoz, O.; Villalobos-Pietrini, R.; Agapito-Nadales, M.C.; Munive-Colín, Z.; Hernández-Mena, L.; Sánchez-Sandoval, M.; Gómez-Arroyo, S.; Bravo-Cabrera, J.L.; Guzmán-Rincón, J. Solvent extracted organic matter and polycyclic aromatic hydrocarbons distributed in size-segregated airborne particles in a zone of México City: Seasonal behaviour and human exposure. Atmos. Environ. 2010, 44, 122–130. [Google Scholar] [CrossRef]
  9. Anastasopoulos, A.T.; Wheeler, A.J.; Karman, D.; Kulka, R.H. Intraurban concentrations, spatial variability and correlation of ambient polycyclic aromatic hydrocarbons (PAH) and PM2.5. Atmos. Environ. 2012, 59, 272–283. [Google Scholar] [CrossRef]
  10. Jung, K.H.; Yan, B.; Chillrud, S.N.; Perera, F.P.; Whyatt, R.; Camann, D.; Kinney, P.L.; Miller, R.L. Assessment of benzo(a)pyrene-equivalent carcinogenicity and mutagenicity of residential indoor versus outdoor polycyclic aromatic hydrocarbons exposing young children in New York City. Int. J. Environ. Res. Public Health 2010, 7, 1889–1900. [Google Scholar] [CrossRef]
  11. Ruchirawat, M.; Mahidol, C.; Tangjarukij, C.; Pui-Ock, S.; Jensen, O.; Kampeerawipakorn, O.; Tuntaviroon, J.; Aramphongphan, A.; Autrup, H. Exposure to genotoxins present in ambient air in Bangkok, Thailand—Particle associated polycyclic aromatic hydrocarbons and biomarkers. Sci. Total. Environ. 2002, 287, 121–132. [Google Scholar] [CrossRef]
  12. Thyssen, J.; Kimmerle, G.; Althoff, J.; Mohr, U. Inhalation Studies with Benzo[a]pyrene in Syrian Golden Hamsters23. J. Natl. Cancer Inst. 1981, 66, 575–577. [Google Scholar] [CrossRef]
  13. Teixeira, E.C.; Pra, D.; Idalgo, D.; Henriques, J.A.P.; Wiegand, F. DNA-damage effect of polycyclic aromatic hydrocarbons from urban area, evaluated in lung fibroblast cultures. Environ. Pollut. 2012, 162, 430–438. [Google Scholar] [CrossRef]
  14. Kongpran, J.; Kliengchuay, W.; Niampradit, S.; Sahanavin, N.; Siriratruengsuk, W.; Tantrakarnapa, K. The Health Risks of Airborne Polycyclic Aromatic Hydrocarbons (PAHs): Upper North Thailand. GeoHealth 2021, 5, e2020GH000352. [Google Scholar] [CrossRef]
  15. Thepnuan, D.; Chantara, S. Characterization of PM2.5–bound Polycyclic Aromatic Hydrocarbons in Chiang Mai, Thailand during Biomass Open Burning Period of 2016. Appl. Environ. Res. 2020, 42, 11–24. [Google Scholar] [CrossRef]
  16. EC. Directive 2004/107/EC of the European Parliament and of the Council of 15 December 2004 relating to arsenic, cadmium, mercury, nickel and polycyclic aromatic hydrocarbons in ambient air. Off. J. Eur. Communities 2004, L23/3, 8. [Google Scholar]
  17. DEFRA. The Air Quality Strategy for England, Scotland, Wales and Northern Ireland; The Stationery Office: London, UK, 2007; Volume 2. [Google Scholar]
  18. Wickramasinghe, A.; Karunaratne, D.; Sivakanesan, R. PM10-bound polycyclic aromatic hydrocarbons: Biological indicators, lung cancer risk of realistic receptors and ‘source-exposure-effect relationship’ under different source scenarios. Chemosphere 2012, 87, 1381–1387. [Google Scholar] [CrossRef] [PubMed]
  19. Callén, M.S.; Lopez, J.M.; Mastral, A.M. Influence of natural and anthropogenic sources on PM10 air concentrations in Spain. Air Pollut. XIX 2011, 1, 149–160. [Google Scholar] [CrossRef] [Green Version]
  20. Norramit, P.; Cheevaporn, V.; Itoh, N.; Tanaka, K. Characterization and Carcinogenic Risk Assessment of Polycyclic Aromatic Hydrocarbons in the Respirable Fraction of Airborne Particles in the Bangkok Metropolitan Area. J. Health Sci. 2005, 51, 437–446. [Google Scholar] [CrossRef] [Green Version]
  21. Larsen, J.C.; Larsen, P.B. Chemical Carcinogens. In Issues in Environmental Science and Technology; Royal Society of Chemistry: London, UK, 1998; pp. 33–56. [Google Scholar]
  22. Ruchirawat, M.; Settachan, D.; Navasumrit, P.; Tuntawiroon, J.; Autrup, H. Assessment of potential cancer risk in children exposed to urban air pollution in Bangkok, Thailand. Toxicol. Lett. 2007, 168, 200–209. [Google Scholar] [CrossRef]
  23. Pleil, J.D.; Vette, A.F.; Rappaport, S.M. Assaying particle-bound polycyclic aromatic hydrocarbons from archived PM2.5 filters. J. Chromatogr. A 2004, 1033, 9–17. [Google Scholar] [CrossRef]
  24. Pollution Control Department. Thailand State of Pollution Report 2011. 2012. Available online: http://infofile.pcd.go.th/mgt/Report_Eng2554.pdf?CFID=21130752&CFTOKEN=76494286 (accessed on 4 September 2014).
  25. US EPA. Compendium Method TO-13A: Determination of Polycyclic Aromatic Hydrocarbons (PAHs) in Ambient Air Using Gas Chromatography/Mass Spectrometry (GC/MS) (EPA/625/R-96/010b); Office of Research and Development: Washington, DC, USA, 1999.
  26. US EPA. Exposure Factors Handbook 2011 Edition (Final); Environmental Protection Agency: Washington, DC, USA, 2011; (EPA/600/R-09/052F). Available online: https://cfpub.epa.gov/ncea/risk/recordisplay.cfm?deid=236252 (accessed on 10 June 2016).
  27. US EPA. Update of Standard Default Exposure Factors. 2014. Available online: https://www.epa.gov/risk/update-standard-default-exposure-factors (accessed on 10 June 2016).
  28. OEHHA. Technical Support Document for Cancer Potency Factors: Methodologies for derivation, listing of Available Values, and Adjustments to Allow for Early Life Stage Exposures; California Environmental Protection Agency: Sacramento, CA, USA, 2009; p. A-1, See Appendix A. [Google Scholar]
  29. Jamhari, A.A.; Sahani, M.; Latif, M.T.; Chan, K.M.; Tan, H.S.; Khan, F.; Tahir, N.M. Concentration and source identification of polycyclic aromatic hydrocarbons (PAHs) in PM10 of urban, industrial and semi-urban areas in Malaysia. Atmos. Environ. 2014, 86, 16–27. [Google Scholar] [CrossRef]
  30. Thongsanit, P.; Jinsart, W.; Hooper, B.; Hooper, M.; Limpaseni, W. Atmospheric Particulate Matter and Polycyclic Aromatic Hydrocarbons for PM10 and Size-Segregated Samples in Bangkok. J. Air Waste Manag. Assoc. 2003, 53, 1490–1498. [Google Scholar] [CrossRef] [Green Version]
  31. Kim Oanh, N.T.; Bætz Reutergårdh, L.; Dung, N.T.; Yu, M.-H.; Yao, W.-X.; Co, H.X. Polycyclic aromatic hydrocarbons in the airborne particulate matter at a location 40 km north of Bangkok, Thailand. Atmos. Environ. 2000, 34, 4557–4563. [Google Scholar] [CrossRef]
  32. Ravindra, K.; Sokhi, R.; Van Grieken, R. Atmospheric polycyclic aromatic hydrocarbons: Source attribution, emission factors and regulation. Atmos. Environ. 2008, 42, 2895–2921. [Google Scholar] [CrossRef] [Green Version]
  33. Jyethi, D.S.; Khillare, P.S.; Sarkar, S. Risk assessment of inhalation exposure to polycyclic aromatic hydrocarbons in school children. Environ. Sci. Pollut. Res. 2014, 21, 366–378. [Google Scholar] [CrossRef]
  34. Nisbet, I.C.; Lagoy, P.K. Toxic equivalency factors (TEFs) for polycyclic aromatic hydrocarbons (PAHs). Regul. Toxicol. Pharmacol. 1992, 16, 290–300. [Google Scholar] [CrossRef]
  35. Chang, K.-F.; Fang, G.-C.; Chen, J.-C.; Wu, Y.-S. Atmospheric polycyclic aromatic hydrocarbons (PAHs) in Asia: A review from 1999 to 2004. Environ. Pollut. 2006, 142, 388–396. [Google Scholar] [CrossRef] [PubMed]
  36. Froehner, S.; Maceno, M.; Machado, K.S. Predicting bioaccumulation of PAHs in the trophic chain in the estuary region of Paranagua, Brazil. Environ. Monit. Assess. 2010, 174, 135–145. [Google Scholar] [CrossRef] [PubMed]
  37. Heinrich, U.; Roller, M.; Pott, F. Estimation of a lifetime unit lung cancer risk for benzo(a)pyrene based on tumour rates in rats exposed to coal tar/pitch condensation aerosol. Toxicol. Lett. 1994, 72, 155–161. [Google Scholar] [CrossRef]
  38. Belis, C.; Cancelinha, J.; Duane, M.; Forcina, V.; Pedroni, V.; Passarella, R.; Tanet, G.; Douglas, K.; Piazzalunga, A.; Bolzacchini, E.; et al. Sources for PM air pollution in the Po Plain, Italy: I. Critical comparison of methods for estimating biomass burning contributions to benzo(a)pyrene. Atmos. Environ. 2011, 45, 7266–7275. [Google Scholar] [CrossRef]
  39. Callén, M.; López, J.; Iturmendi, A.; Mastral, A. Nature and sources of particle associated polycyclic aromatic hydrocarbons (PAH) in the atmospheric environment of an urban area. Environ. Pollut. 2013, 183, 166–174. [Google Scholar] [CrossRef] [Green Version]
  40. Chantara, S.; Sangchan, W. Sensitive analytical method for particle-bound polycyclic aromatic hydrocarbons: A case study in Chiang Mai, Thailand. Sci. Asia 2009, 35, 42–48. [Google Scholar] [CrossRef]
  41. Sienra, M.D.R.; Rosazza, N.G.; Préndez, M. Polycyclic aromatic hydrocarbons and their molecular diagnostic ratios in urban atmospheric respirable particulate matter. Atmos. Res. 2005, 75, 267–281. [Google Scholar] [CrossRef]
  42. Vasconcellos, P.C.; Souza, D.Z.; Ávila, S.G.; Araújo, M.P.; Naoto, E.; Nascimento, K.H.; Cavalcante, F.S.; Dos Santos, M.; Smichowski, P.; Behrentz, E. Comparative study of the atmospheric chemical composition of three South American cities. Atmos. Environ. 2011, 45, 5770–5777. [Google Scholar] [CrossRef]
  43. Vestenius, M.; Leppänen, S.; Anttila, P.; Kyllönen, K.; Hatakka, J.; Hellén, H.; Hyvärinen, A.P.; Hakola, H. Back-ground concentrations and source apportionment of polycyclic aromatic hydrocarbons in south-eastern Finland. Atmos. Environ. 2011, 45, 3391–3399. [Google Scholar] [CrossRef]
Figure 1. PM10 sampling sites in the Bangkok Metropolitan Administration at the roadside (NHAD), urban background (PRD) and industrial (EGAT) areas.
Applsci 11 04501 g001
Figure 2. Annual mean concentrations of 15 PAHs found at the roadside, urban background and industrial sites in the BMA from May 2013 to May 2014.
Applsci 11 04501 g002
Figure 3. Seasonal mean concentrations of individual PAHs at the roadside site, industrial site and urban background site respectively. Weather conditions were hot and humid in the summer, frequent rain in the rainy season and dry and cool in the winter.
Applsci 11 04501 g003
Figure 4. Boxplots comparing seasonal mean BaP concentration (ng m−3) at three sampling sites (Rd: roadside; Ind: industrial; Bg: urban background) in the winter (W), summer (S) and rainy season (R) [providing median (horizontal line), 25th to 75th percentile (box), data range (vertical line), and outliers (* points)].
Applsci 11 04501 g004
Figure 5. Time series data showing concentrations of PM10 (µg m−3), and BaP & BaP-TEQ (ng m−3) at the roadside, industrial and urban background sites in the BMA.
Applsci 11 04501 g005
Table 1. Sampling sites.
Site CategoryCoordinateLocation
(District, Province)
Sampling DurationNumber of Samples
RoadsideN 13°45′45.36″
E 100°33′1.44″
Dindaeng, Bangkok2 May 2013–27 May 201443
Urban-BackgroundN 13°46′59.16″
E 100°32′25.78″
Phaya Thai, Bangkok2 May 2013–15 May 201446
IndustrialN 13°48′25.92″
E 100°30′22.68″
Bang Kruai, Nonthaburi2 May 2013–27 May 201437
Table 2. Age-specific exposure factors for the assessment of lung cancer risk from long-term PM10-bound PAHs exposure related to body weight (BW) and total lifetime hours of exposure (AT).
ReceptorBW
(kg)
IR
(m3 d−1)
ET
(h d−1)
EF
(d y−1)
ED
(y)
AT
(h)
Resident (child)
1 to < 2 years11.4 a5.4 a24350217,520
2 to < 3 years13.8 a8.9 a24350326,280
3 to < 6 years18.6 a10.1 a24350652,560
6 to < 11 years31.8 a12.0 a243501196,360
11 to < 16 years56.8 a15.2 a2435016140,160
Adult (16 to 70 years)70 b16.0 a2435054473,040
Worker (16 to 70 years)70 b16.0 a825054473,040
a US EPA, 2011; b US EPA, 2014.
Table 3. Estimated incremental lifetime cancer risks of PM10-bound PAH exposure characterized by CSF and IUR at the roadside, industrial and urban background sites.
ReceptorLADDRisk Characterised by CSF aRisk Characterised by IUR b
RoadsideIndustrialUrban BGRoadsideIndustrialUrban BGRoadsideIndustrialUrban BG
Resident (child)
1 to <2 years9.4 × 10−91.1 × 10−85.0 × 10−91.0 × 10−81.2 × 10−85.6 × 10−92.2 × 10−72.5 × 10−71.2 × 10−7
2 to <3 years1.9 × 10−82.2 × 10−81.0 × 10−82.5 × 10−82.8 × 10−81.3 × 10−82.5 × 10−72.9 × 10−71.3 × 10−7
3 to <6 years3.2 × 10−83.7 × 10−81.7 × 10−85.8 × 10−86.6 × 10−83.1 × 10−83.5 × 10−74.0 × 10−71.9 × 10−7
6 to <11 years4.1 × 10−84.7 × 10−82.2 × 10−81.1 × 10−71.2 × 10−75.8 × 10−85.1 × 10−75.9 × 10−72.7 × 10−7
11 to <16 years4.2 × 10−84.8 × 10−82.3 × 10−81.5 × 10−71.7 × 10−77.9 × 10−86.8 × 10−77.7 × 10−73.6 × 10−7
Resident (adult)4.5 × 10−85.2 × 10−82.4 × 10−82.9 × 10−73.3 × 10−71.6 × 10−71.3 × 10−61.4 × 10−66.8 × 10⁻⁷
Worker1.3 × 10−81.5 × 10−87.2 × 10−98.7 × 10−81.0 × 10−74.7 × 10−83.0 × 10−73.4 × 10−71.6 × 10−7
a Cancer slope factor of BaP (3.9 per mg kg−1 day−1). b Inhalation slope factor of BaP (0.0011 per µg m−3).
Publisher’s Note: MDPI stays neutral with regard to jurisdictional claims in published maps and institutional affiliations.

