Article

Youth Adoption of Innovative Digital Marketing and Cross-Cultural Disparities

by
Nada Mallah Boustani
1,* and
Claude Chammaa
2
1
Faculty of Business and Administration, Saint Joseph University, Beirut 1104 2020, Lebanon
2
ESLSCA Business School Paris, 75019 Paris, France
*
Author to whom correspondence should be addressed.
Adm. Sci. 2023, 13(6), 151; https://doi.org/10.3390/admsci13060151
Submission received: 17 March 2023 / Revised: 26 May 2023 / Accepted: 30 May 2023 / Published: 6 June 2023

Abstract

:
This paper aims to explore Youth’s attitudes towards digital marketing utility perception and its effect on behavioral patterns in a cross-cultural perspective. The unified theory of acceptance and use of technology (UTAUT 2) model was adopted together with three new variables from the reasoned action theory and the 5S Internet marketing model to propose a theoretical model on Youth’s digital marketing adoption. A survey was conducted in Italy (N = 165) and Lebanon (N = 150), and PLS analysis was implemented for the empirical testing of the proposed research model. In the Italian sample, Hedonic motivation, social influence, facilitating conditions, and efficiency significantly predicted the behavioral intention of digital marketing which, in turn, was significantly related to use behavior. Subsequently, in the Lebanese sample, the subjective norms of hedonic motivation, social influence, experience and habit predicted behavioral intention, which was positively related with use behavior. The results led to the conclusion that national cultures still play an important role in affecting digital marketing adoption among younger generations, especially in less industrialized and technologically developed countries. Therefore, companies should keep this aspect in mind when innovating and developing digital marketing strategies targeting this generation.

1. Introduction

The youngest generational cohort now entering society and the labor market is known as Generation Y (born between 1982 and 2003), and its members are also referred to as Youth (Strauss and Howe 1991). This cohort is regarded as the savviest when it comes to adopting technical advancements such as digital marketing as it is an early user of new technology products and services (Kumar and Lim 2008). Digital marketing innovation is defined as the use of a novel or significantly enhanced marketing approaches that involve major changes in product design or packaging, product positioning, product promotion, or pricing (OECD and Eurostat 2005), and by marketing goods, services, information, and ideas via the Internet (Dumitriu et al. 2019). If a company wants to create value and remain competitive in the eyes of its customers, it must manage to fit between its competencies and consumer value. Digital technologies are becoming increasingly popular as effective instruments for conducting business operations, leading to heightened competition in various industries (Ziółkowska 2021).
Moreover, given that they were raised in a highly technological society and that it plays a significant role in their daily lives, technology is the factor that most distinguishes this group (Kumar and Lim 2008). Thus, businesses utilizing the Internet and innovative technologies to sell goods and services see Youth-generation customers as a lucrative rising market. However, when marketing to younger generations, businesses use mass marketing techniques under the presumption that their increased exposure to tendencies of globalization and internationalization has resulted in presumptively homogenous tastes, behaviors, and preferences. Although some research indicates a general convergence in value orientation among members of generation Y in many nations (Inglehart 2000), relatively few studies have examined generational attitudes toward digital marketing or internet marketing from a cross-cultural perspective (Isa and Wong 2015; Tan et al. 2013).
To fill this gap, this paper explores Youth’s attitudes towards digital marketing utility perception and its effect on behavioral patterns in a cross-cultural perspective. In particular, the authors selected variables from the unified theory of acceptance and use of technology (UTAUT 2) model (Venkatesh et al. 2012), the reasoned action theory (Ajzen and Fishbein 1980) and the 5S Internet marketing model (Stansfield 2006) to analyze Youth’s digital marketing adoption in Italy and Lebanon.
The two research questions addressed in this study were:
RQ1: What are the main factors influencing digital marketing utility perception among Youth?
RQ2: How do cultural and technological issues differently affect Youth’s digital marketing utility perception and adoption in Italy and Lebanon?
To explore these issues, the authors first developed the theoretical framework and identify possible factors contributing to adoption at the national level. The researchers then employed a cross-national survey to test the hypotheses on a sample of 315 individuals in two countries by applying a structural equation analysis. Finally, the authors discuss the results and derive conclusions for future research in the last sections of this manuscript.

2. Theoretical Framework

2.1. Youth and Cross-Cultural Differences

According to Inglehart’s (Inglehart 2000; Offer 1998) theory of intergenerational value change, there have been systematic changes in different generations’ values and motives that reflected technological and economic advances that have affected several cultures around the world. The scarcity hypothesis underlying the theory of intergenerational value change, in particular, assumes that generations who grew up during periods of socioeconomic and physical insecurity learned modernist survival values (e.g., economic determinism, rationality, materialism, conformity, and respect for authority) that are typical of the Baby Boomer generation in industrialized countries, whereas those who grew up during periods of socioeconomic security learned postmodernist values (Offer 1998).
Additional research is required to explore the attitudes and behaviors of Baby Boomers to gain a deeper understanding of how to effectively engage these customers on social media platforms (Nunan and Di Domenico 2019). Younger generations in prosperous and industrialized postmodern countries exhibited higher levels of post materialism (Inglehart 2000), but they were also more affluent, self-sufficient, individualistic, brand loyal, and tolerant than members of other cohort groups (Hyllegard et al. 2010; Morton 2002). They are thought to be better educated as consumers; therefore, they use the Internet more often for product information search and purchase, and they are more suspicious of advertising and media. On the other hand, they are more hedonistic, emphasizing the ‘immediacy and quick gratification’ of the purchasing transaction, as well as appearance. Finally, they desire greater ‘connectedness’ with peers and influencers, and are more socially conscious than other consumer cohorts and are also more concerned for social causes (Loroz 2006).
As a result, when examining generational disparities, cultural variations must be considered. In this line, this study is conducted in two countries: Italy and Lebanon. What are the reasons behind the choice of these countries revealing some similarities and disparities on different influencing research levels? The Lebanese context is to be first considered as Lebanon, a small growing country of roughly five million people characterized by Western values because of French colonization during World War I, which resulted in an open, democratic, and liberal society until the onset of the Civil War from 1975 to 1990. This had a major political and economic influence on the country, and introduced fundamental structural problems, which, along with the Middle East’s overall very unstable economic climate, have resulted in ongoing political, social, and economic instability (Dirani 2006). The Italian context, on the other hand, first shows a difference due to the fact that Italy is a European high-income country with a population of over 60 million people and the third-largest national economy in the Eurozone and the eighth largest economy by nominal GDP in the world. It has experienced continuous freedom and peace since World War II and has been characterized by economic growth and industrialization, despite the recent economic recession.
According to the dimensions of Hofstede’s cultural factor model (Hofstede 1980, 1991), Lebanon is a collectivistic society in which people are integrated into strong and cohesive in-groups, where people are more willing to sacrifice their personal goals for group goals, and where social norms play a significant role in guiding individual behavior (Ho et al. 2017). These societies also have a large power distance, which shows the extent of social acceptance of power asymmetry. Italy, on the other hand, is an individualistic country where strong links exist exclusively with familiar persons, but in collectivistic societies strong ties exist within a more widespread community. Furthermore, Italy ranks high in uncertainty avoidance, indicating that formality and low risk are chosen over confusing situations and adaptability. Both countries were determined to be masculine, with considerable inequalities in social roles between men and women. Although some academics have recently disputed Hofstede’s dimensions (Schmitz and Weber 2014), these discrepancies will be used as an indicatory level to validate some of the dimensions in our analysis.
In addition to these historical, political, cultural, and economic differences, the two countries’ scores related to information and communication technologies and ICT access are, respectively, 70.8 and 76.2 in Italy, and 43.2 and 64.5 in Lebanon, showing that infrastructure is generally poor in Lebanon but the use of technology is not so limited (WIPO et al. 2015). On the other hand, Italy shows a score of 28.82 percent of students browsing the Internet for schoolwork at least once per week, and a score of approximately 98 per cent of students with at least one computer at home (OECD 2016).
Nevertheless, although the youth generations in these two countries has been influenced by some similar trends (e.g., technology, Internet, and globalizations), the researchers may expect that socio-economic conditions during their pre-adult stage (childhood and adolescence) together with different infrastructural situations may have resulted in different generational preferences and values toward digital marketing.

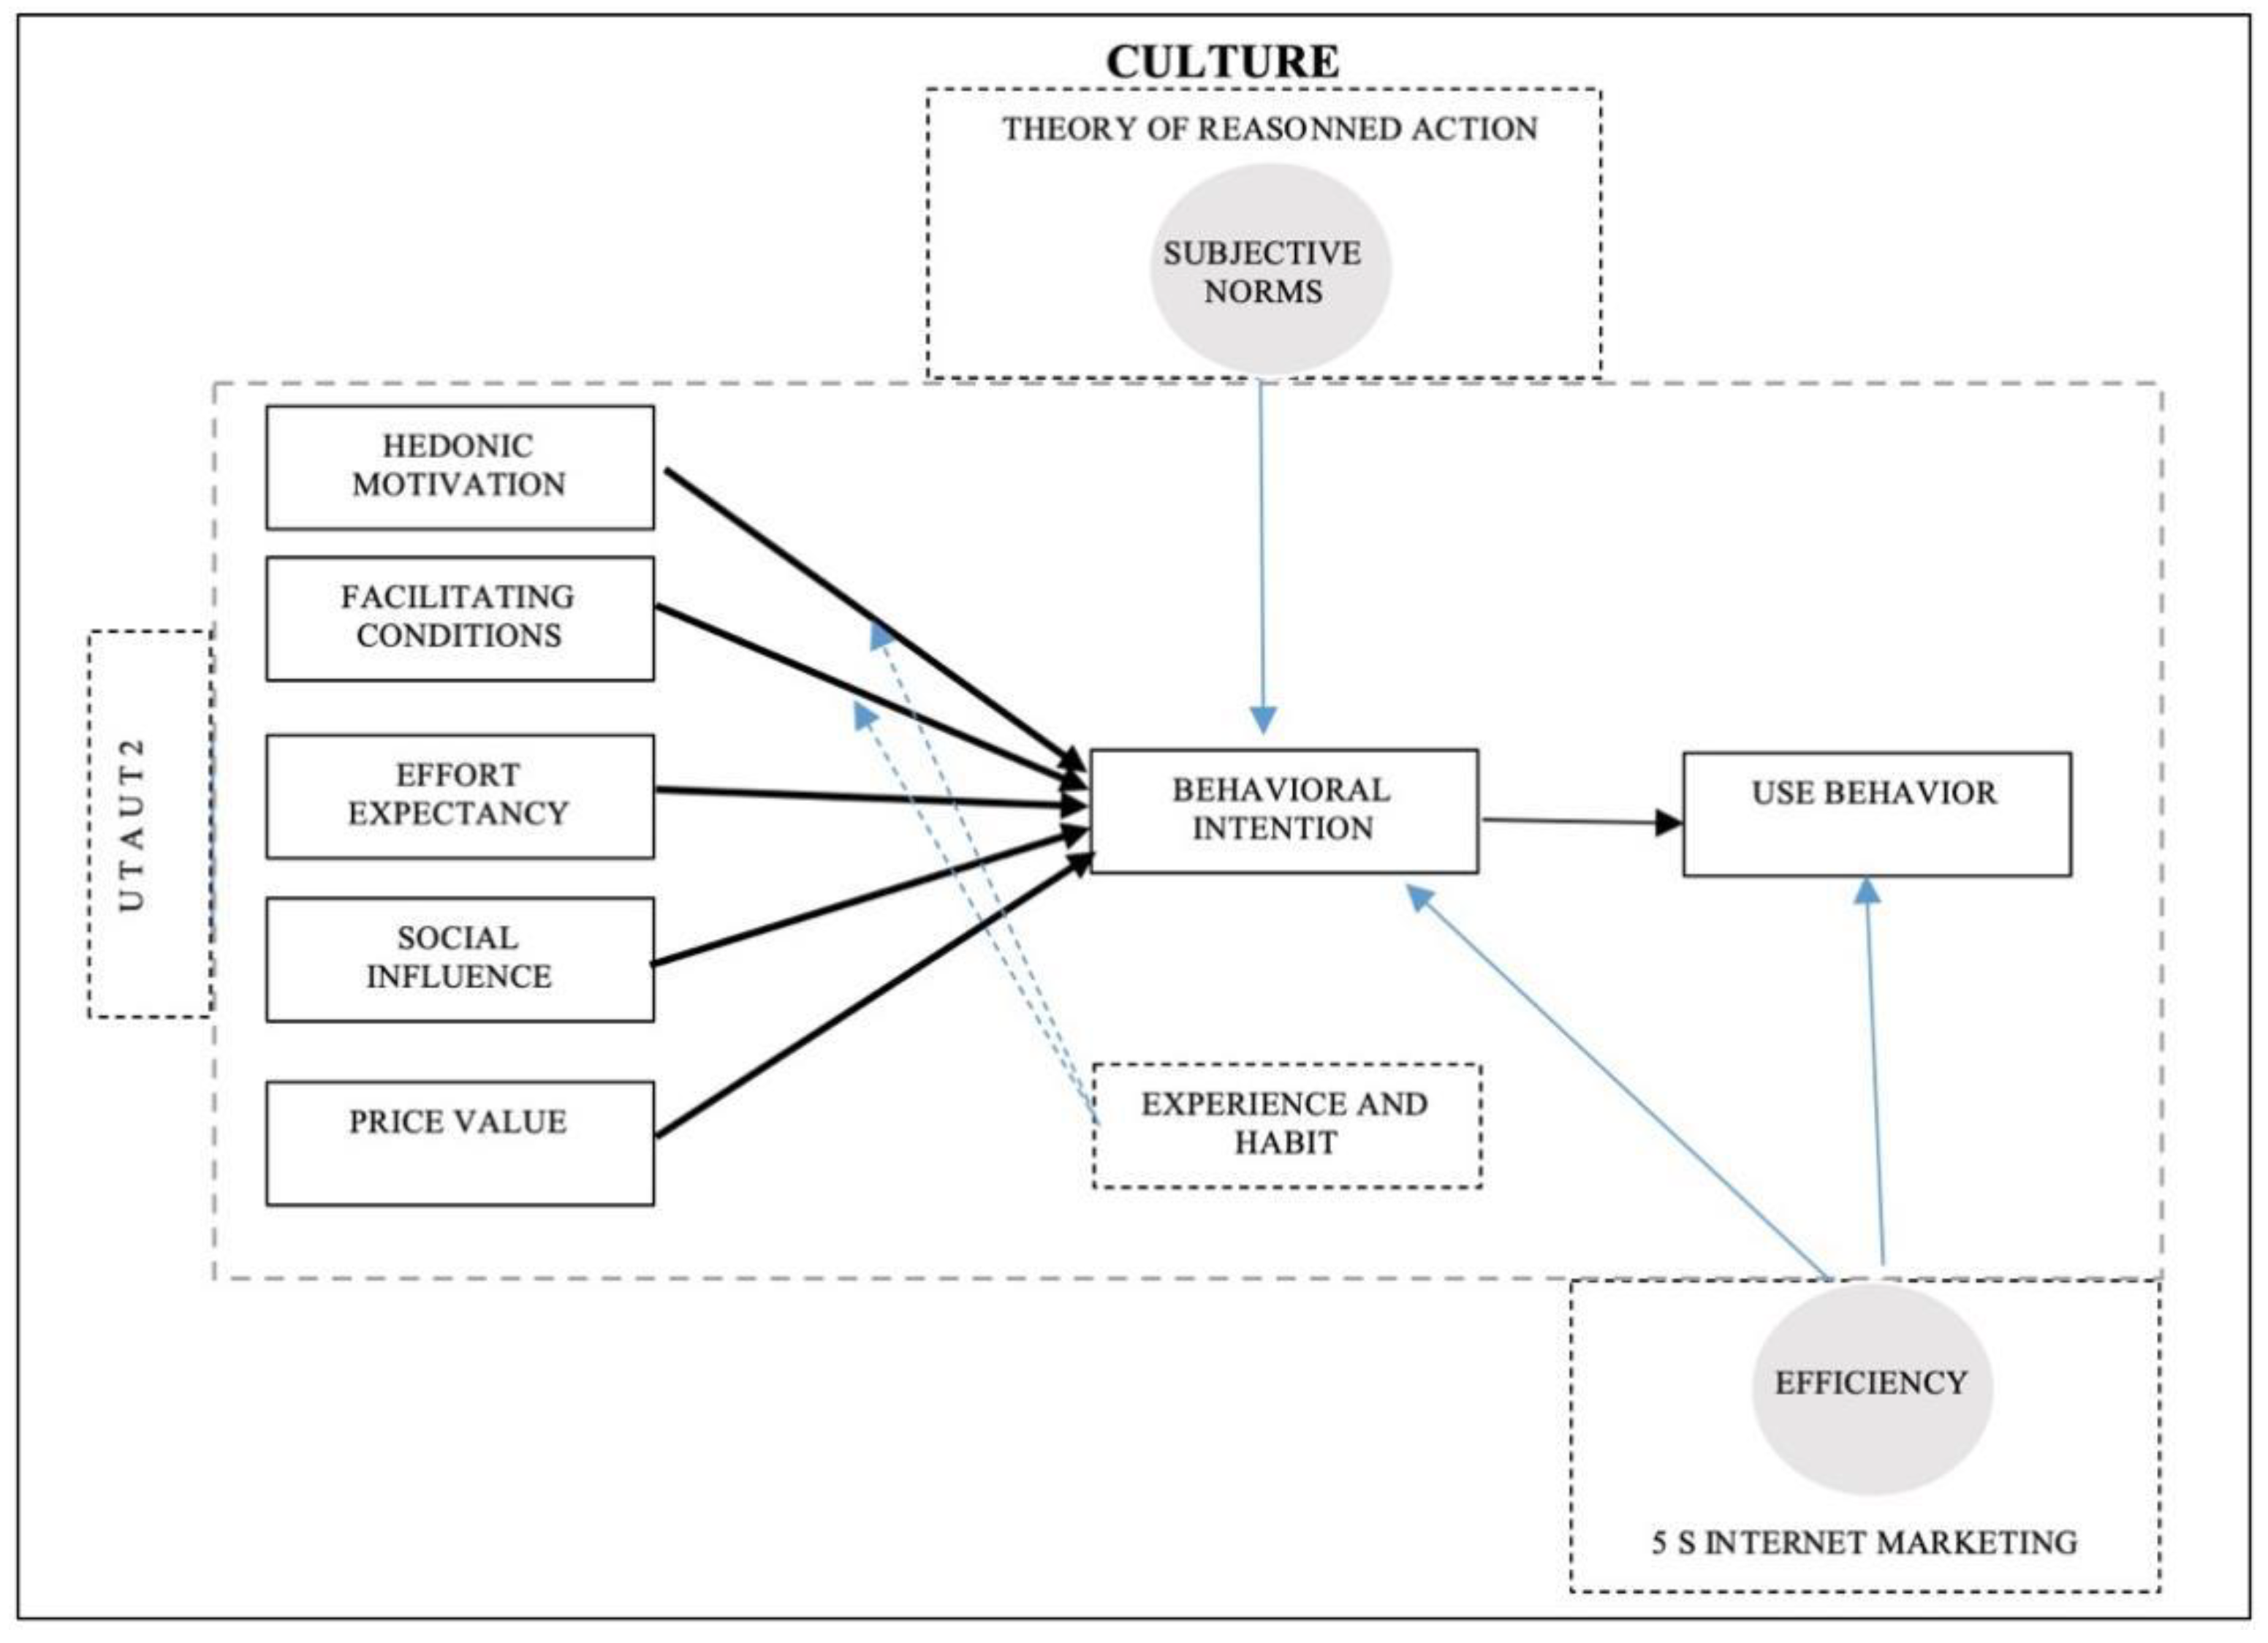
2.2. Digital Marketing Utility Perception among Youth According to the UTAUT 2 Model

Figure 1 depicts the theoretical framework of this research, which includes the subjective norm variables to investigate the cultural differences and similarities between the two Youth generations under study, as well as the efficiency of digital internet adoption added to UTAUT 2 variables, which led to continuous behavior among the Youth generation. This framework outlines the key research issue that this study attempted to solve, as well as a literature gap in this field.

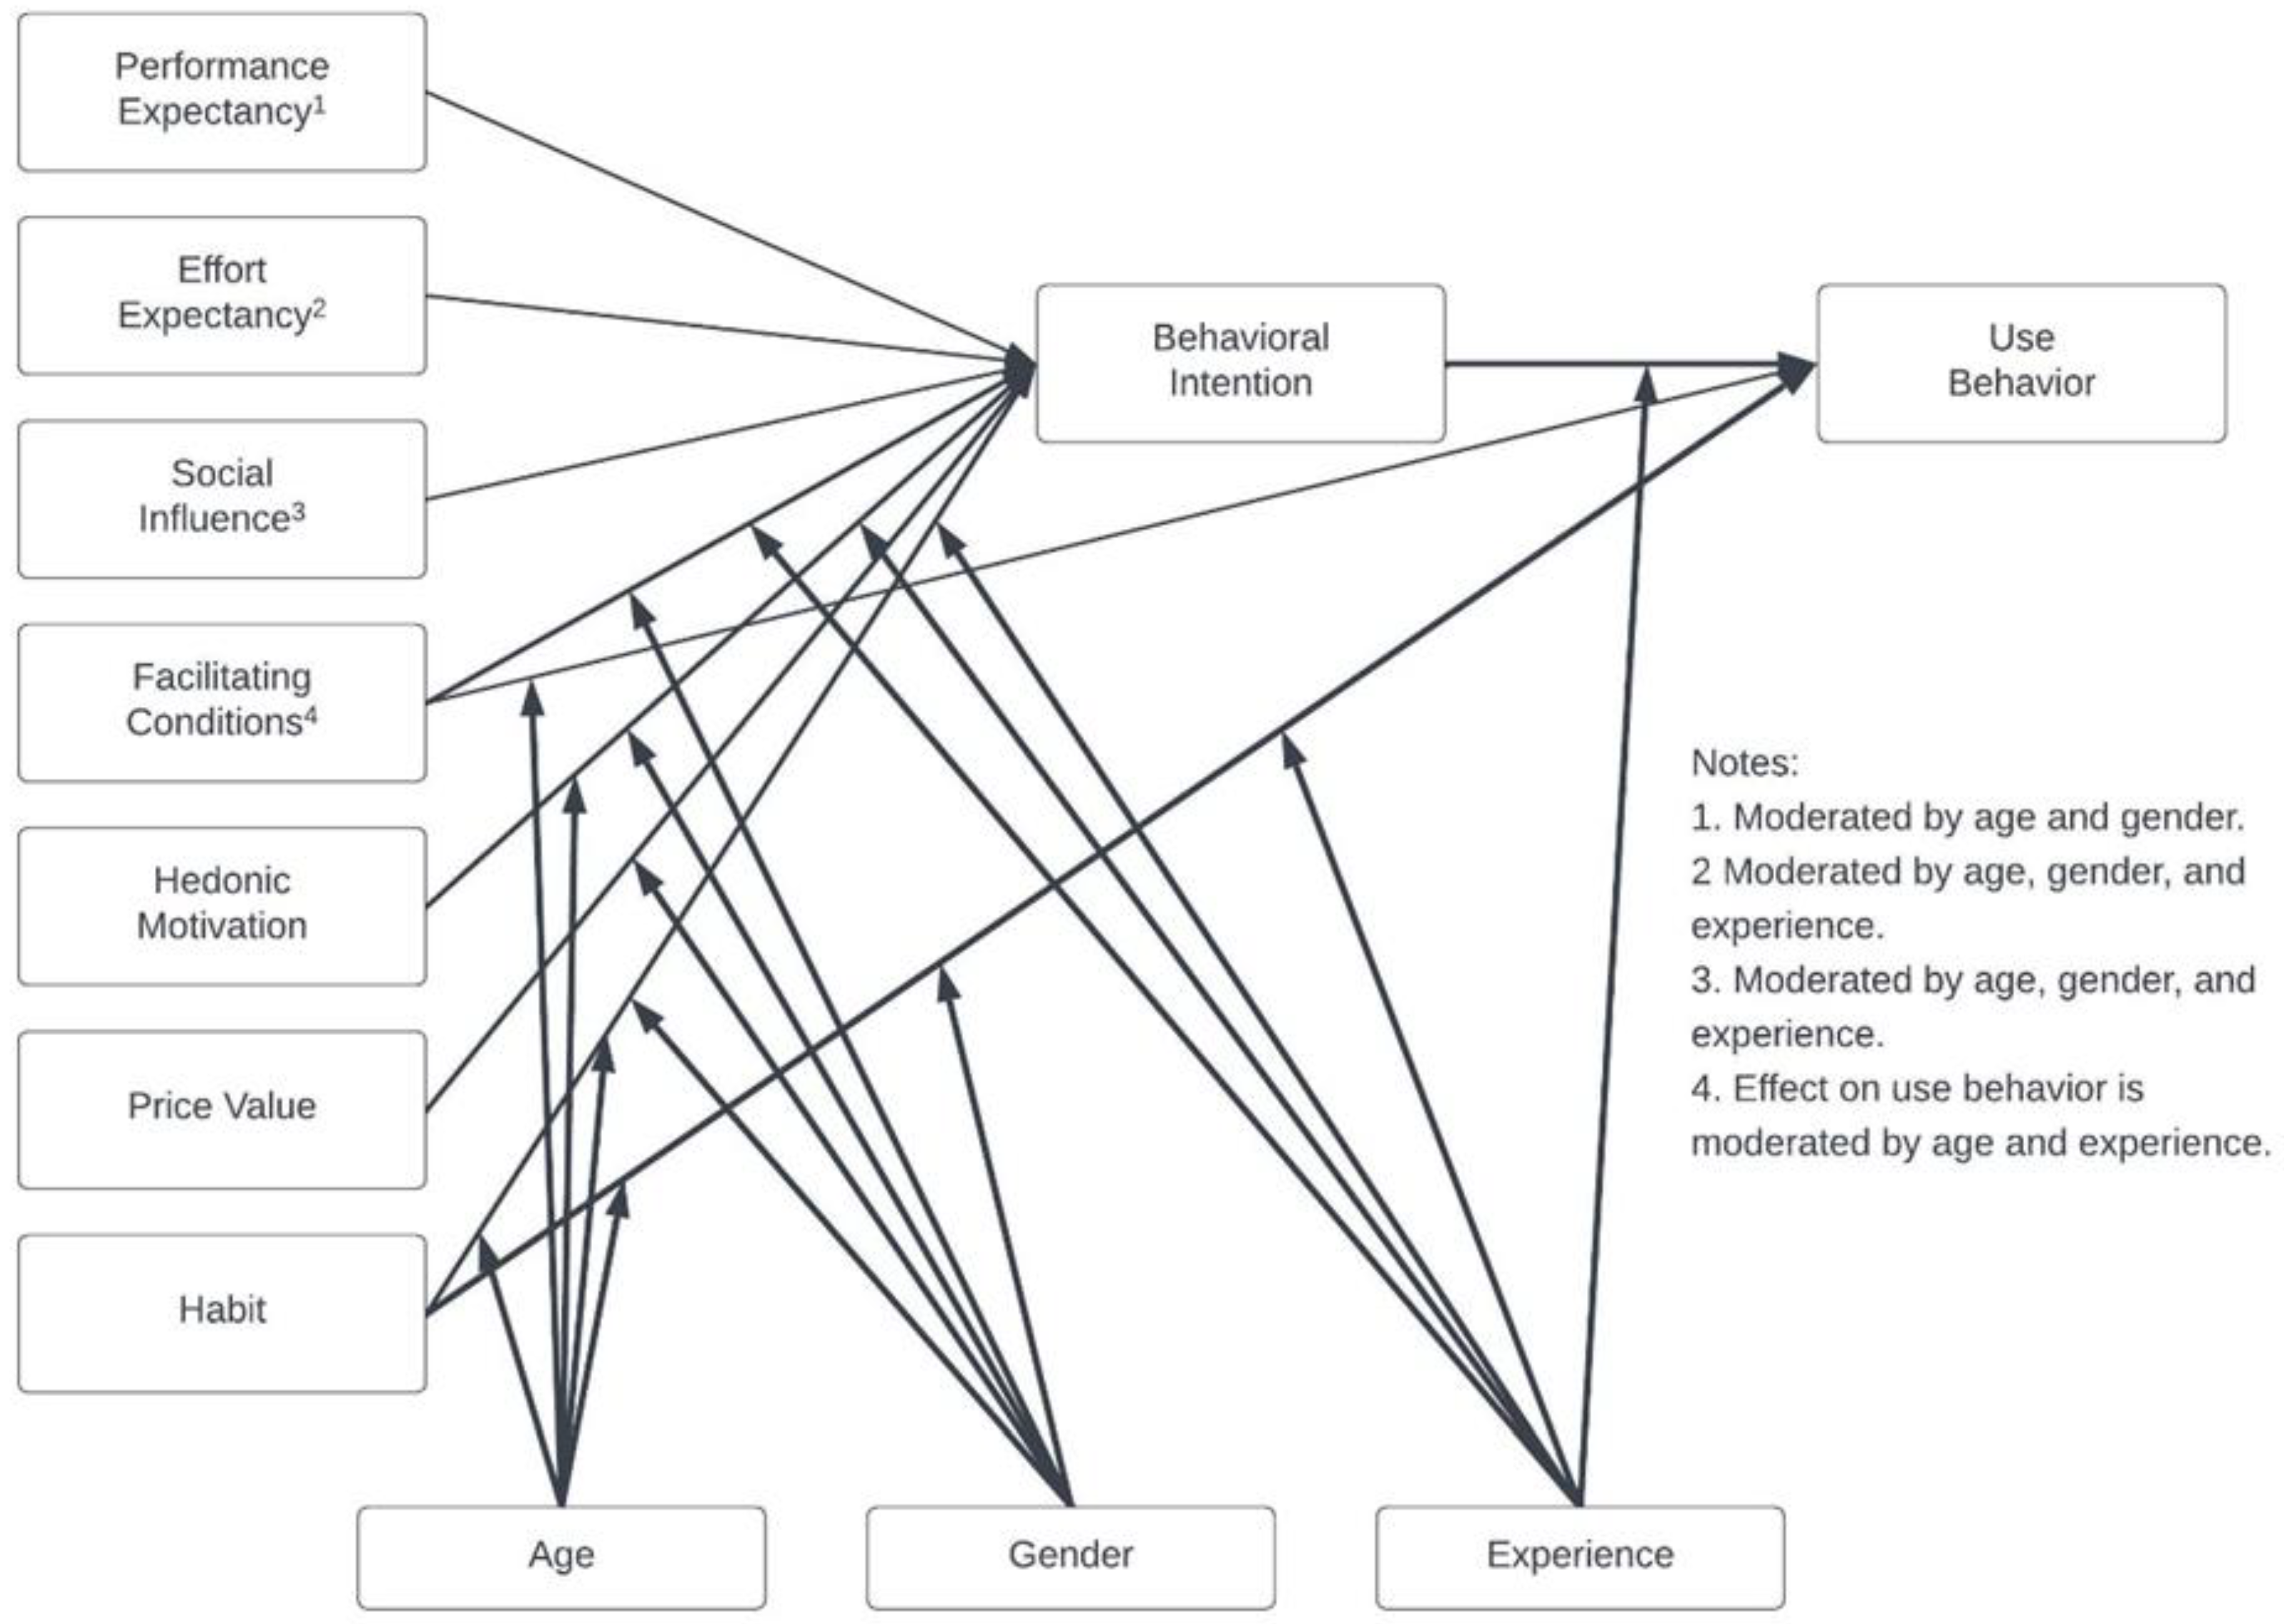
2.2.1. Unified Theory of Acceptance and Use of Technology UTAUT2

UTAUT 2 was developed to explain technology acceptance and use (Venkatesh et al. 2012). It consists of an extension of the Technology Acceptance Model (TAM) and UTAUT theory with some external predictor variables. The main objective of this model is to pay particular attention to the consumer use context. Initially, the UTAUT was developed to explain employee technology acceptance and use, such as the context of consumer technologies, which is a multibillion-dollar industry given the number of technological devices, applications, and services targeted at consumers. Therefore, Venkatesh et al. (2012) adjusted their previous theory by adding different predictors such as hedonic motivation (Van der Heijden 2004; Holbrook and Hirschman 1982; Nysveen et al. 2005; Brown and Venkatesh 2005); the effect of cost on consumer behavior (Brown et al. 2006; Dodds et al. 1991); the role of behavioral intention; and, finally the frequent use of technology introduced as a habit (Kim et al. 2005; Limayem et al. 2007; Venkatesh and Davis 2000; Venkatesh et al. 2003). Prior research has employed UTAUT (unified theory of acceptance and use of technology) as a framework to identify the factors that influence consumers’ behavioral intention to adopt and use new IT technologies (Chao 2019; Liu and Tao 2022). The extended form of the UTAUT model is shown in Figure 2.

2.2.2. Hedonic Motivation

Hedonic motivation is described as the pleasure derived from using a technology, and it plays a significant role in influencing technology acceptability and utilization (Brown and Venkatesh 2005; Van der Heijden 2004; Thong et al. 2006; Shaw and Sergueeva 2019). Similarly to the consumer environment (Brown et al. 2006; Childers et al. 2002), hedonism, pleasure, and enjoyment are immensely significant values for members of the Millennial generation, particularly those raised in post-modern civilizations (Loroz 2006; Offer 1998). According to Mckinsey Company (2019), brands and retailers are moving quickly to deliver more seamless omnichannel shopping experiences, but shoppers are moving even quicker. Some studies of UTAUT2 stated that hedonic motivation has a significant influence on consumers’ behavioral intention to use mobile banking (Baptista and Oliveira 2016).
Moreover, in countries which are still in the early stages of internet marketing adoption, internet marketing tools may be used at a fundamental level or users may not derive so much fun or pleasure from them since they have not reached a mature stage of adoption.
H1. 
Hedonic motivation a has significant relationship with behavioral intention among members of the Millennial generation if they live in post-modern countries (Italy) compared to those living in non-post-modern countries (Lebanon).
H2. 
Behavioral intention among members of the Millennial generation has a significant relationship with the use of digital marketing if they live in post-modern countries (Italy) compared to those living in non-post-modern countries (Lebanon).

2.2.3. Social Influence

Venkatesh et al. (2003) defined social influence as the degree to which an individual perceives the importance of others’ beliefs that he or she should use the new system (Wilson et al. 2021). Previous studies have revealed that human relationships such as family members, friends, coworkers, or teachers have a beneficial effect on the propensity to use online marketing (Boustani et al. 2022; Kim and Tran 2013). However, because behavioral goals change with age and interactions with social partners are more salient for older people (Carstensen 1992), previous research has found that social influence is not a significant antecedent of the intention to use internet marketing for younger generations (Isa and Wong 2015) because they are more experienced with it and less likely to consider social influence as relevant. As a result, we may expect social influence to have no effect on Youth’s assessment of digital marketing utility, and hence their intention to utilize it, because they are more experienced than previous generations and less influenced by social dynamics. However, in countries characterized by high collectivism, where relevant others’ opinions about using new technological systems may be very influential (Blaise et al. 2018), Youth may be more likely to positively evaluate and adopt internet marketing utility if important others are also positively oriented toward digital marketing (Baudier et al. 2018).
H3. 
Social influence has a significant relationship with behavioral intention among members of the Millennial generation if they live in collectivistic countries (Lebanon) compared to individualistic countries (Italy).

2.2.4. Facilitating Condition

The degree to which an individual believes that an organizational and technological infrastructure exists to facilitate system use is referred to as the facilitating condition (Venkatesh et al. 2003). For example, the prediction of tablet use intentions can be facilitated by leveraging facilitating conditions, as suggested by Magsamen-Conrad et al. (2015), and these conditions can directly impact the adoption of technology according to Oliveira et al. (2014). Technical issues, such as a good user interface and related ease of access, navigation, and searching; effective instruction; and other facilitating conditions, such as expenses and resources, or prior knowledge, are examples of facilitating conditions. They have been found not only to boost digital marketing usage (Fang and Salvendy 2003; Yang 2010), but also to have a direct influence on internet marketing behavioral intention (Ajzen 2011; Taylor and Todd 1995). Notwithstanding the fact that younger generations have more experience and prior knowledge than older generations, we feel that facilitating conditions are a prerequisite for digital marketing adoption. We propose that facilitating conditions are especially critical for countries with a high level of uncertainty avoidance, specifically those that are uncomfortable with ambiguous situations and feel threatened by uncertain or unknown scenarios (Hofstede 1980). Uncertainty avoidance is associated with low-risk-taking cultures, and multiple studies have demonstrated that uncertainty avoidance has a negative impact on IT usage (Taylor and Todd 1995). Users who like to avoid ambiguity are thus less likely to adopt new systems if they believe the technical infrastructure is not outstanding in terms of user interface (Fang and Salvendy 2003) or the quality of the online material delivered is poor (Taylor and Todd 1995).
H4. 
Facilitating conditions have a significant relationship with behavioral intention among members of the Millennial generation if they live in countries high on uncertainty avoidance (Italy) compared to those scoring low on uncertainty avoidance (Lebanon).

2.2.5. Effort Expectancy

The amount of effort required by the individual to use the system is referred to as effort expectation (Venkatesh et al. 2003) It shows the degree to which a technology is simple to use in the individual’s opinion (Subramani 2013) and is influenced by previous experience with new systems in terms of modifying their opinions and adoption intentions (Latif et al. 2011). For customers who shop online, ease of use is critical (Teo et al. 2015). Effort expectancy is also related to a new system’s adoption level, and people in the early stages of internet marketing usage typically believe that greater work is necessary (Szajna 1996). Therefore, due to the higher internet marketing diffusion in Italy compared to Lebanon, where Youth are still in the early stages of internet marketing use, we argue that those who have experienced internet marketing for more time expect to exert less effort compared to those who have not yet developed enough experience with the new system (Khong et al. 2013).
H5. 
Effort expectancy has a significant relationship with behavioral intention among members of the Millennial generation if they live in countries with higher digital marketing experience (Italy) compared to those scoring low on digital marketing experience (Lebanon).

2.2.6. Price Value

The price value may have a considerable impact on consumers’ technology use. In marketing research, the monetary price is combined with the quality of items or services to determine the customer’s perceived worth of products (Zeithaml 1988). Venkatesh et al. (2003) define price value as “consumers’ cognitive trade-off between the perceived benefits of the applications and the monetary cost of using them” (Dodds et al. 1991). When the benefits of adopting a technology are judged to be larger than the monetary cost, the price value is positive, and such a price value has a positive impact on intention (Venkatesh et al. 2003). Luxury consumption has distinct motivations in collectivist and individualist civilizations (Hofstede 1980). In particular, for collectivistic cultures the symbolic meanings of luxury items are extremely important, but they are more pragmatic than individualistic societies when purchasing products for private consumption.
H6. 
Price value has a significant relationship with behavioral intention among members of the Millennial generation if they live in collectivistic countries (Lebanon) compared to individualistic countries (Italy).

2.2.7. Experience and Habit

Two related constructs were added to the literature, namely, experience and habit. The first construct reflects an opportunity to use the technology and is operationalized time spent on the use of technology by an individual (one month later and three months later) (Kim et al. 2005). In addition, habit has been defined as the extent to which people tend to perform behaviors automatically because of learning (Limayem et al. 2007) or automaticity (Kim et al. 2005). Zhang et al. (2018) stated that the use of smartphones over several years will lead to habitual behavior.
H7. 
Experience and habit have a significant relationship with behavioral intention (Ramírez-Correa et al. 2019) among members of Generation Y if they live in collectivistic countries (Lebanon) compared to individualistic countries (Italy).

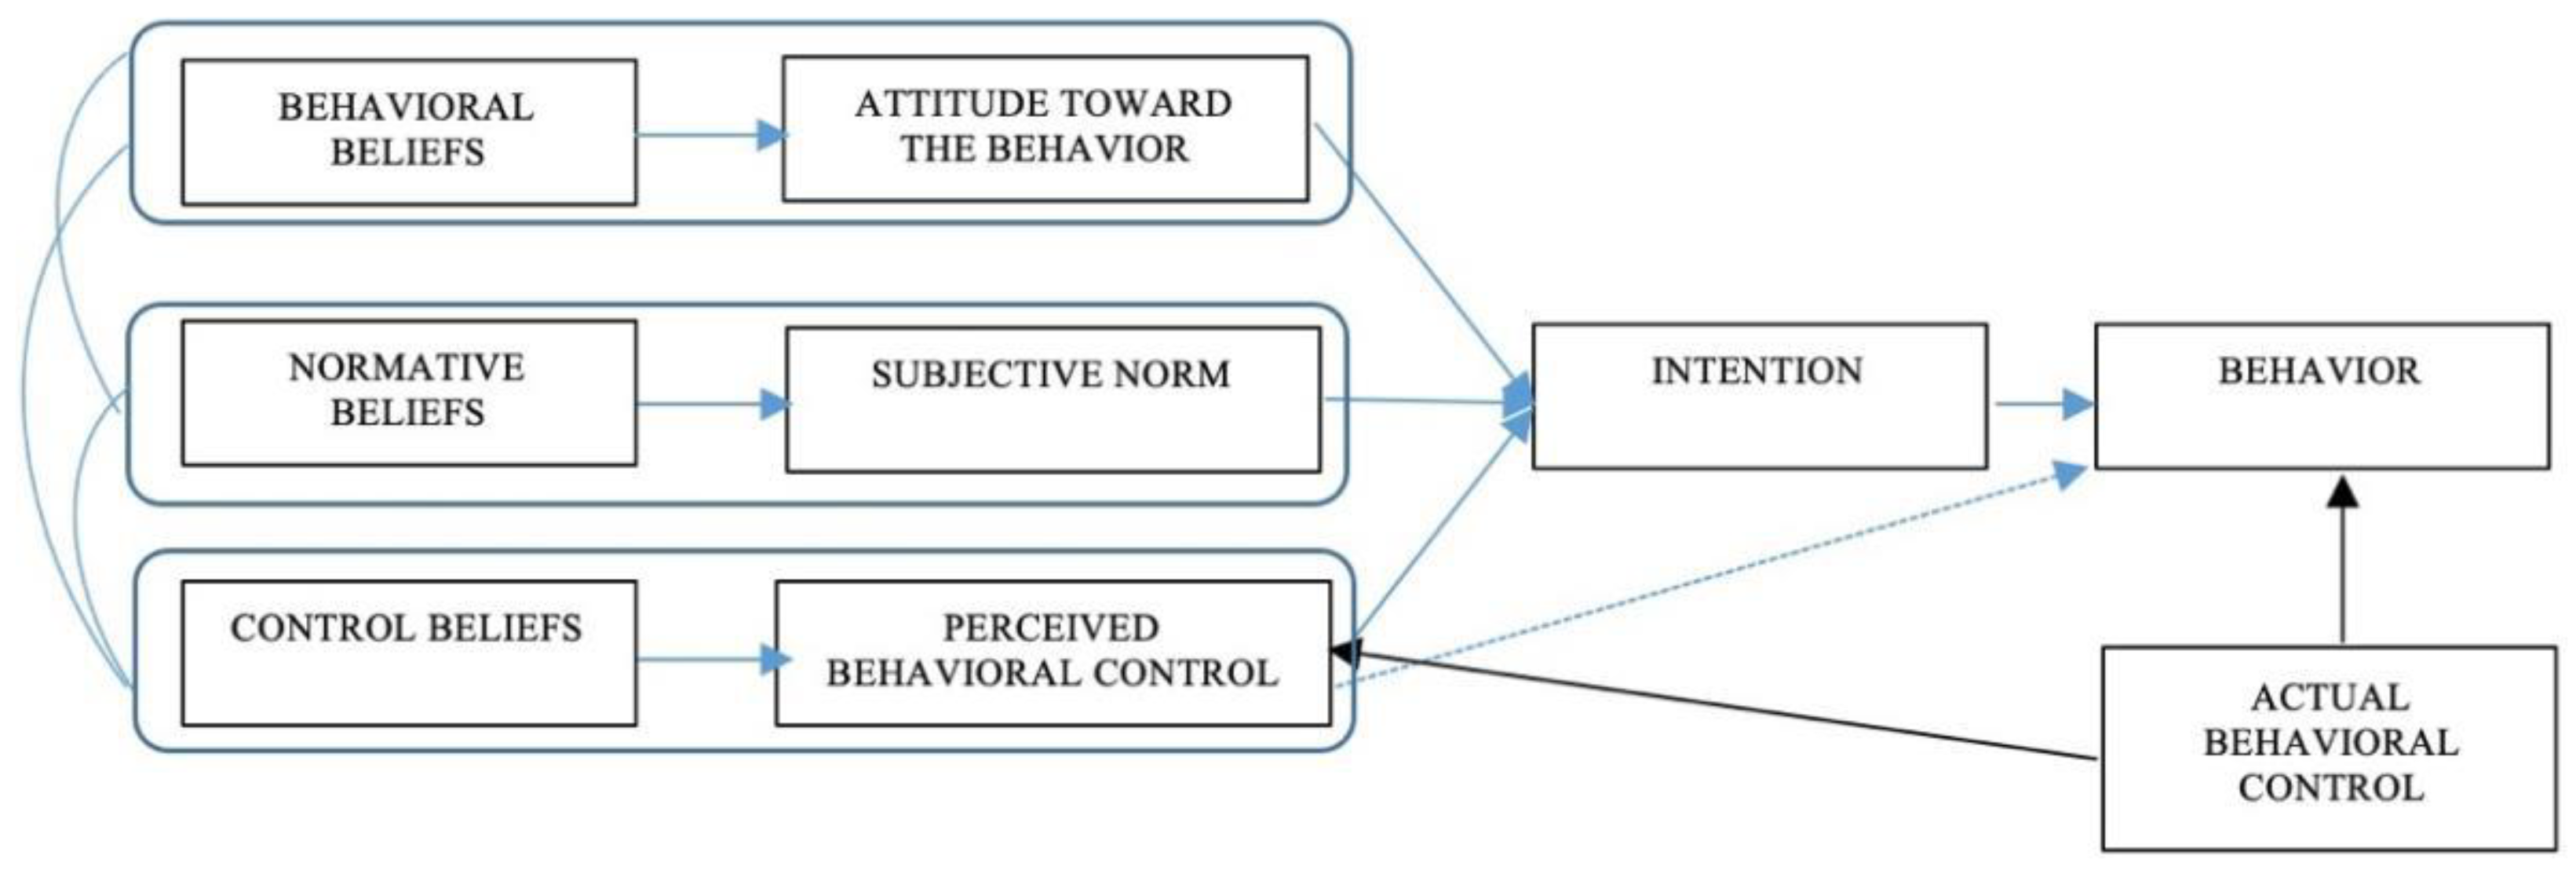
2.3. Digital Marketing Utility Perception among Youth According to the Theory of Reasoned Action

As stated by Ajzen (2011), the purposes of the theory of reasoned action are related to predicting and understanding motivational influences on behavior that are not under the individual’s volitional control, to identify how and where to target strategies for changing behavior, and to explain virtually any human behavior.
Indeed, this theory suggests that the individual’s intention to perform a behavior is a combination of an attitude toward performing the behavior and a subjective norm. Subjective norms are the first “additional variable” we introduced to the UTAUT2 model, as detailed in Figure 3.

Subjective Norms

New consumer behavior is a trend in and of itself. Using a computer or smartphone to buy things, check emails, and interact with friends and family is the world’s most time-consuming trend. Globalization and information systems have incorporated various trends in each consumer’s reality that may help him at every stage of his life.
Trend is defined by Vejlgaard (2008) as a process of change that can be viewed from a variety of angles. Kotler et al. (2001), on the other hand, have described trends as sets of occurrences defined by a specific force and endurance. One of the ten most important trends provided by the American business JWT is “all word is a game”, which incorporates behavior focused on ultra-contemporary technologies, notably computer games, which shape certain behaviors in both the virtual and real worlds. This is especially true for younger generations living in more technologically advanced and industrialized societies where using the Internet for product-information search and deliberate purchasing is becoming the norm.
H8. 
Subjective norms have a significant relationship with behavioral intention among members of the Millennial generation if they live in technologically developed and industrialized countries (Italy) compared to those living in less technologically developed and industrialized countries (Lebanon).

2.4. Digital Marketing Utility Perception among Youth According to the 5S of Internet Marketing Model

As supposed by Stansfield (2006), digital marketing aims to communicate or promote a product, service, image, or skill in the hope of carrying a certain value or benefit to the intended audience by using e-channels and e-technologies. In order for digital marketing to be successful, five objectives should be met; namely, sell, speak, serve, save and sizzle. We added the “Save” dimension in our model (we labeled it “efficiency” which means to ‘Save costs of service, sales transactions, and administration, print and post. Can you reduce transaction costs and therefore either make online sales more profitable or use cost savings to enable you to cut prices, which in turn could enable you to generate greater market share?’). Saving costs of services means undeniably offering better pricing to digital marketing clients. This benefit generated 10 percent more sales with the same communication budget and increased web self-service to 40% of all service enquiries and reduced overall cost-to-serve by 10%.
H9. 
Efficiency has a significant relationship with behavioral intention among members of the Millennial generation if they live in technologically developed and industrialized countries (Italy) compared to those living in less technologically developed and industrialized countries (Lebanon).

3. Methodology

The design of the method adopted has 2 (a. two different countries; b. urban context, i.e., Milano or Beirut) × 2 (Youth; gender) dimensions.
To answer the research question, the authors conducted quantitative research mainly in universities in Lebanon and Italy. The questionnaire was administered with both online and offline paper surveys. The convenience sampling was chosen since respondents were students enrolled in business schools in the mentioned countries.
A survey consisting of five scale constructs was developed. The scales were adapted from prior studies and minor changes were made to ensure that the used constructs are valid within the context of this study. A five-point Likert scale ranging from 1 = strongly disagree to 5 = strongly agree was used.
A total of 350 questionnaires were sent by email to a dataset of students that acquired a business education in a very well-known higher education university in Lebanon and in Italy. The choice of this sample was done just as in several previous works tackling Youth intention among business graduates (Anjum et al. 2019; Luc 2018). Of all the sent questionnaires, 317 surveys were included in the sample after removing unengaged respondents and questionnaires with missing values.
To make sure that the sample size used satisfied the needed requirement, Soper (2019) software was adopted. Using 5 latent constructs and 24 items, with 0.8 statistical power and a significance level of 5 percent, the required sample size for the model was 145 observations. Thus, the sample used, which consisted of 317 respondents, met the requirements for sampling adequacy. The non-response or missing answers were adjusted by imputation by assigning the characteristic of interest to the non-respondents based on the similarity of the variables available for respondents.
The questionnaire was conducted on 165 students in Italy (male: 19, female: 146) and 150 students in Lebanon (male: 36, female: 114). The final sample size was 317. All the respondents in Lebanon and in Italy were holders of a bachelor’s degree in business administration and aged 21 years and above.
In sampling and data analysis, two types of questions were selected:
  • Multiple choice questions: Demographic questions.
  • Interval question: Items to be rated on a five-point Likert scale ranging from 1 (strongly disagree) to 5 (strongly agree) were adopted.
Structural equation modeling (SEM) is a second-generation multivariate data analysis method that is often used in marketing research because it can test theoretically supported linear and additive causal models (Chin et al. 2003; Haenlein and Kaplan 2004). “There are two sub models in a structural equation model; the inner model specifies the relationships between the independent and dependent latent variables, whereas the outer model specifies the relationships between the latent variables and their observed indicators” (Isa and Wong 2015).
This study used structural equation modeling (SEM) to test the relations between the factors of the proposed conceptual model (Hair et al. 2016). IBM SPSS 20 and IBM Amos 23 statistical packages were used to perform the analysis.
The normality of the data was initially checked. All the values for skewness and kurtosis fell within −2 and +2; therefore, normality was not an issue (Byrne 2010). Moreover, multicollinearity was also checked, and the variance inflation factors (VIF) for all the factors were below the cutoff value of 5 (Hair et al. 2011); hence, multicollinearity was not a problem.
In addition, data were screened to check for the existence of a possible common method bias. The reliability and validity of all constructs used were tested by conducting exploratory factor analysis (EFA) and confirmatory factor analysis (CFA).

4. Results and Findings

The first step of the modeling was to run the model as it was presented in the literature review with no adjustments. All data were analyzed in one model (Italy and Lebanon). This initial model showed the relationship between some independent and dependent variables without giving the separate effects of variables according to each country. This situation led us to dividing data by country and running two different models to better understand the impact of predictor variables on the dependent ones. Therefore, there were no moderating effects between experience and habit, hedonic motivation, and facilitating conditions constructs.

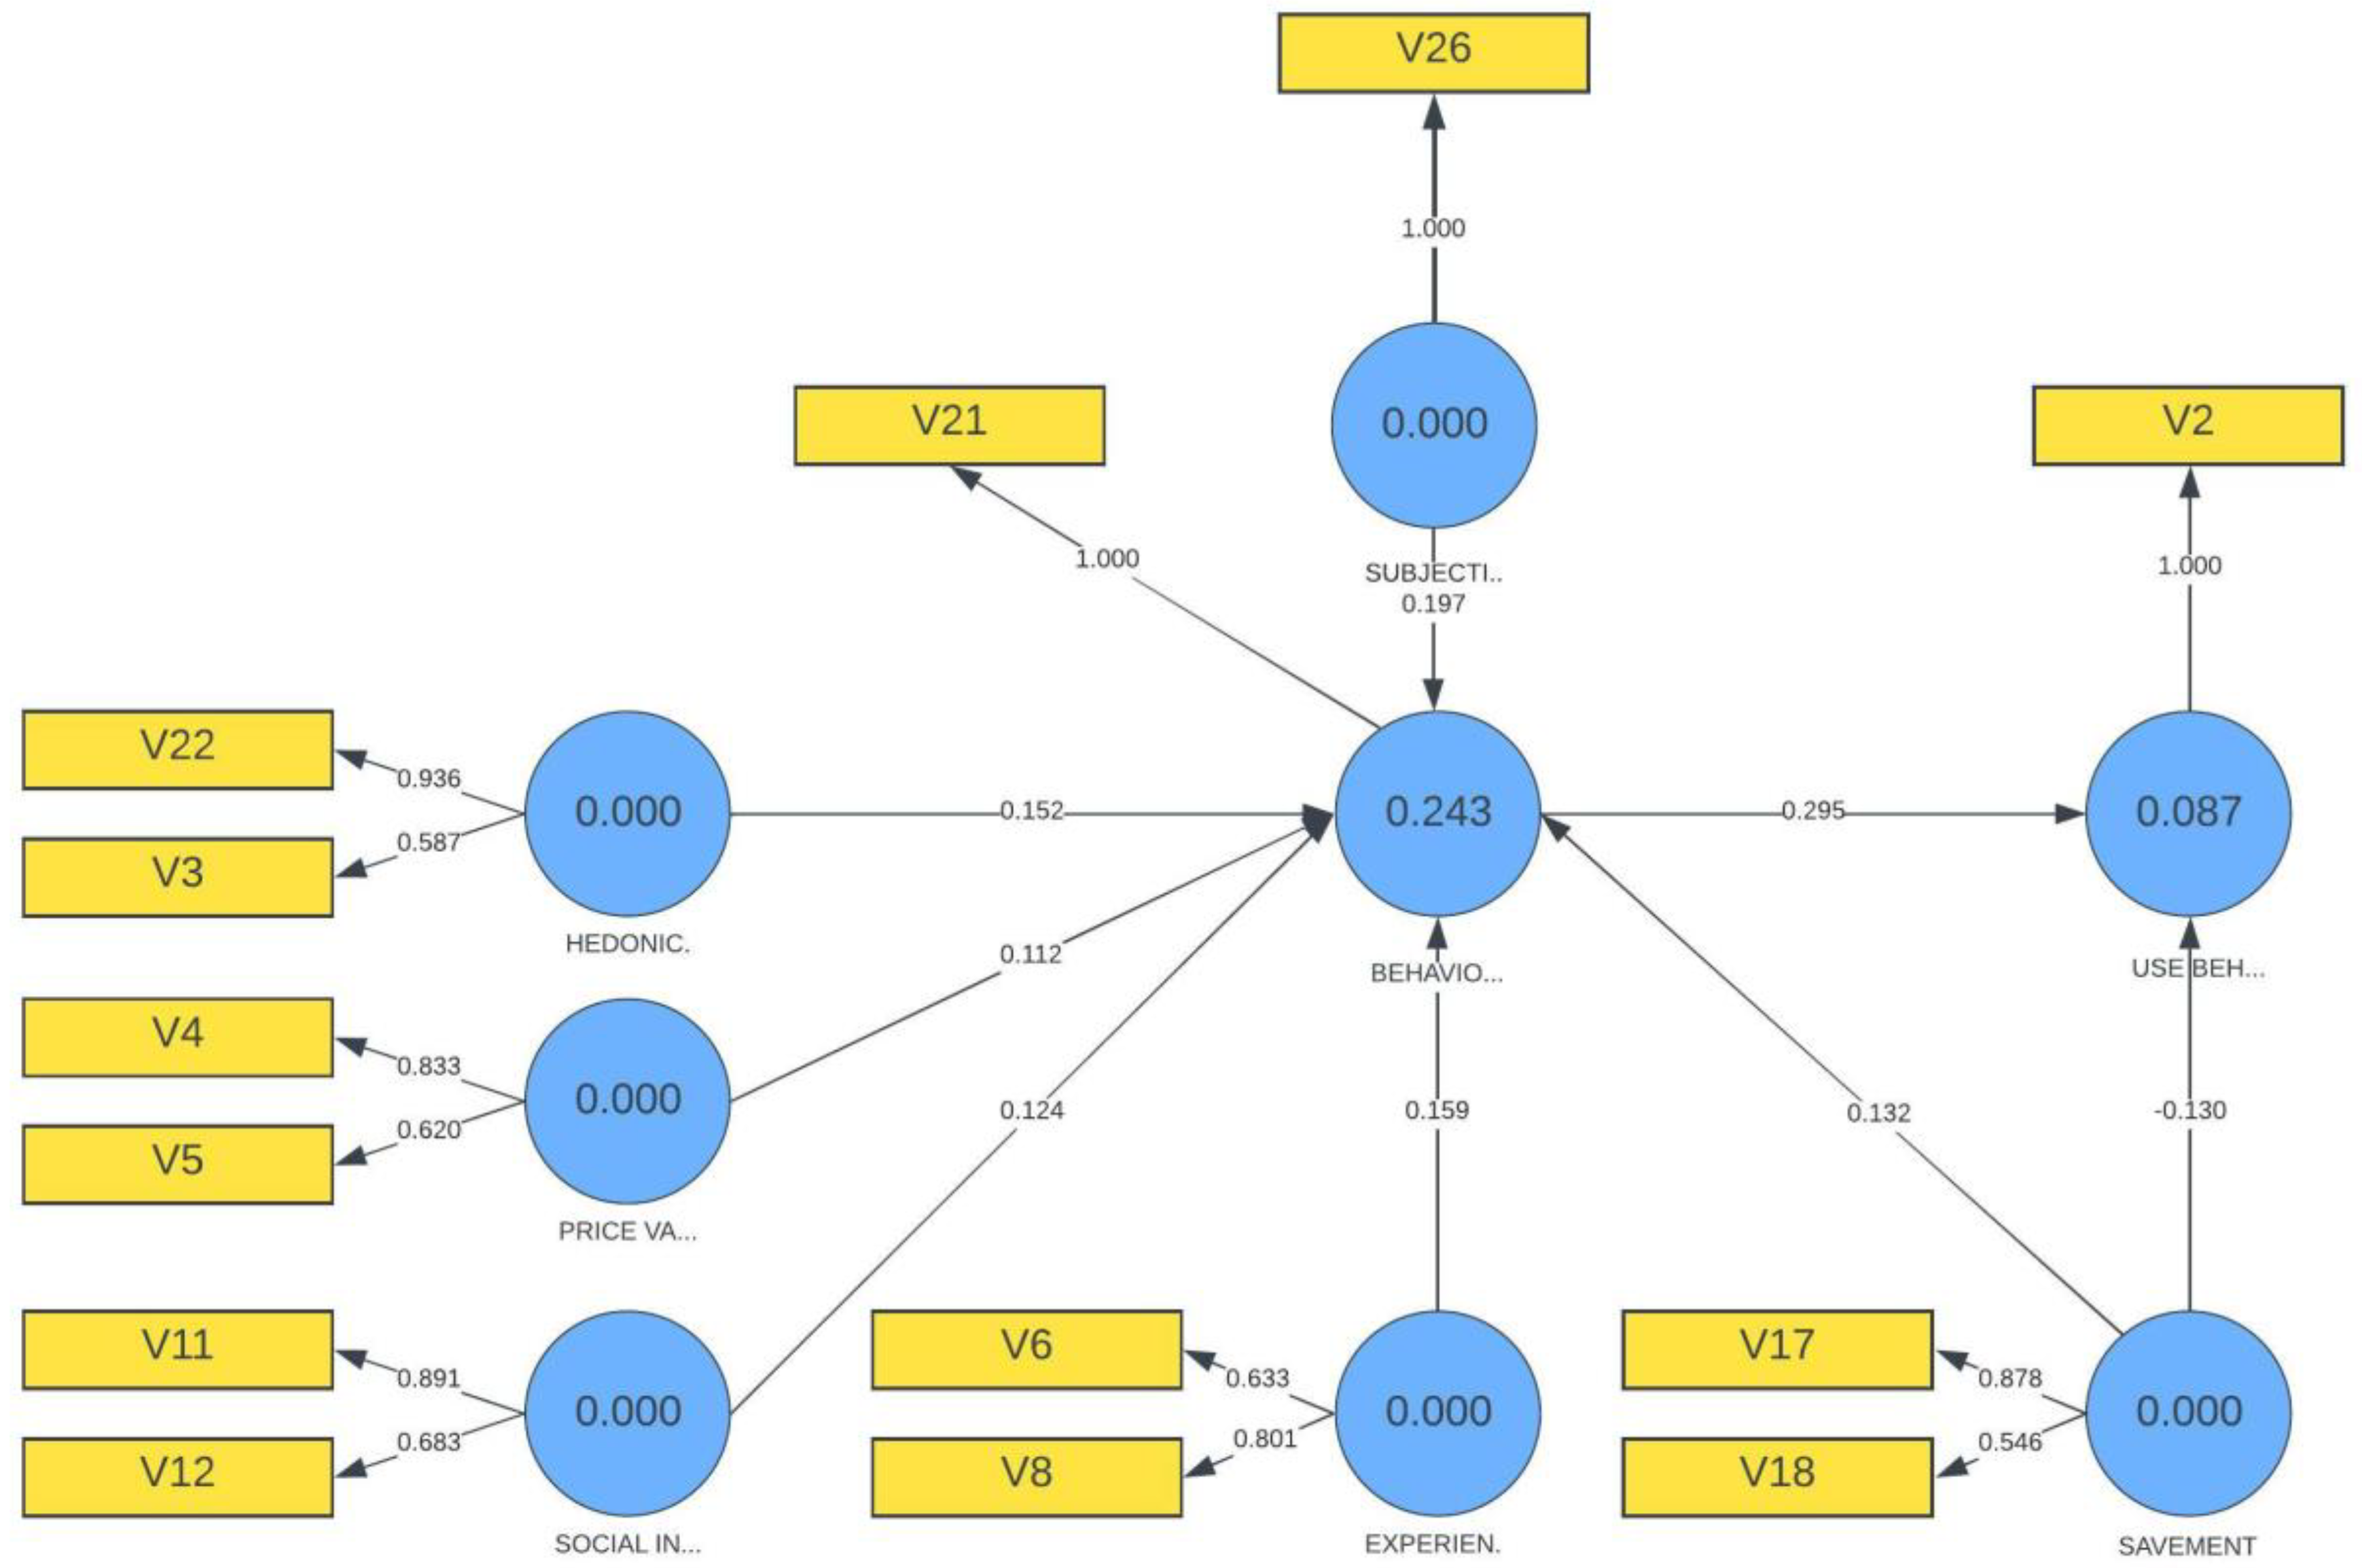
4.1. The Lebanese Model

As the PLS model was running, it showed that not all of the variables had a direct relationship with each other.
Figure 4 shows the following observations:
  • Target endogenous variable variance: The coefficient of determination, R, is 0.243 for the behavioral intention endogenous latent variable—the standardized path coefficient should be larger than 0.1. This means that the latent independent variables (hedonic motivation, price value, social influence, experience and habit, efficiency, and subjective norms) moderately explain 24.3 percent of the variance in behavioral intention. Moreover, the behavioral intention variable explains 8.7 percent of the variance in use behavior (which is a dependent variable).
  • Inner model path coefficient sizes and significance: The inner model suggests that price value, hedonic motivation and social influence have approximately the same effect on behavioral intention (0.152, 0.112, and 0.124, respectively).
  • Indicator Reliability: All indicators are greater than 0.4; therefore, we can conclude that the indicators are reliable. Results show that Lebanese people consider that pleasure resulting from the use of technology has an impact on its use (V22 = 0.936; V3 = 0.587) and that price value has an impact on their use of digital marketing (V4 = 0.883; V5 = 0.620). Both indicators are higher than 0.4 which means that they are reliable. From the results, we can also see that people would use digital marketing because they are socially influenced. With loadings of 0.891 and 0.683 (V11 and V12, respectively) the model shows that most of the Lebanese people are highly influenced by persons who are important to them and who influence their behavior by using technology. The model also reveals that loadings of the experience and habit variable are significant (V6 = 0.633 and V8 = 0.801) in addition to the efficiency variable (V17 = 0.878; V18 = 0.546).
  • Internal Consistency Reliability: In line with prior literature, the authors have checked for a “Composite Reliability greater than 0.6” as a measure of internal consistency reliability (Bagozzi and Yi 1988).
See Table 1 below.
Internal consistency reliability is demonstrated in the table above among all reflective latent variables.
  • Convergent Validity: Each latent variable’s average variance extracted (AVE) is evaluated with a convergent validity check. From the table below, it is found that all the AVE values, except the effect of social influence, are greater than the acceptable threshold of 0.5, so convergent validity is confirmed.
See Table 2 below.
  • Bootstrapping: “SmartPLS can generate T-statistics for significance testing of both the inner and outer model, using a procedure called bootstrapping. In this procedure, many subsamples are taken from the original sample with replacement to give bootstrap standard errors, which in turn gives approximate T-values for significance.” (Gye-Soo 2016). Using a two-tailed t-test with a significance level of 5%, the path coefficient will be significant if the T-statistic is larger than 1.96. (The critical t-value is 1.65 for a significance level of 10%, and 2.58 for a significance level of 1%, all two-tailed.)
See Table 3 below.
In our model, the T-statistics of some of the variables (dependent and independent variables) are larger than 1.96 (shown in the Table 3 above). However, other variables are below this score. These indicators will assess the validity of the hypothesis in the results section of this paper.

4.2. The Italian Model

As in the Lebanese model, the Italian model showed lot of variables that did not have a direct effect on the dependent variables. These variables were removed from the causal model, which presents only the retained variables.
Figure 5 shows the following observations:
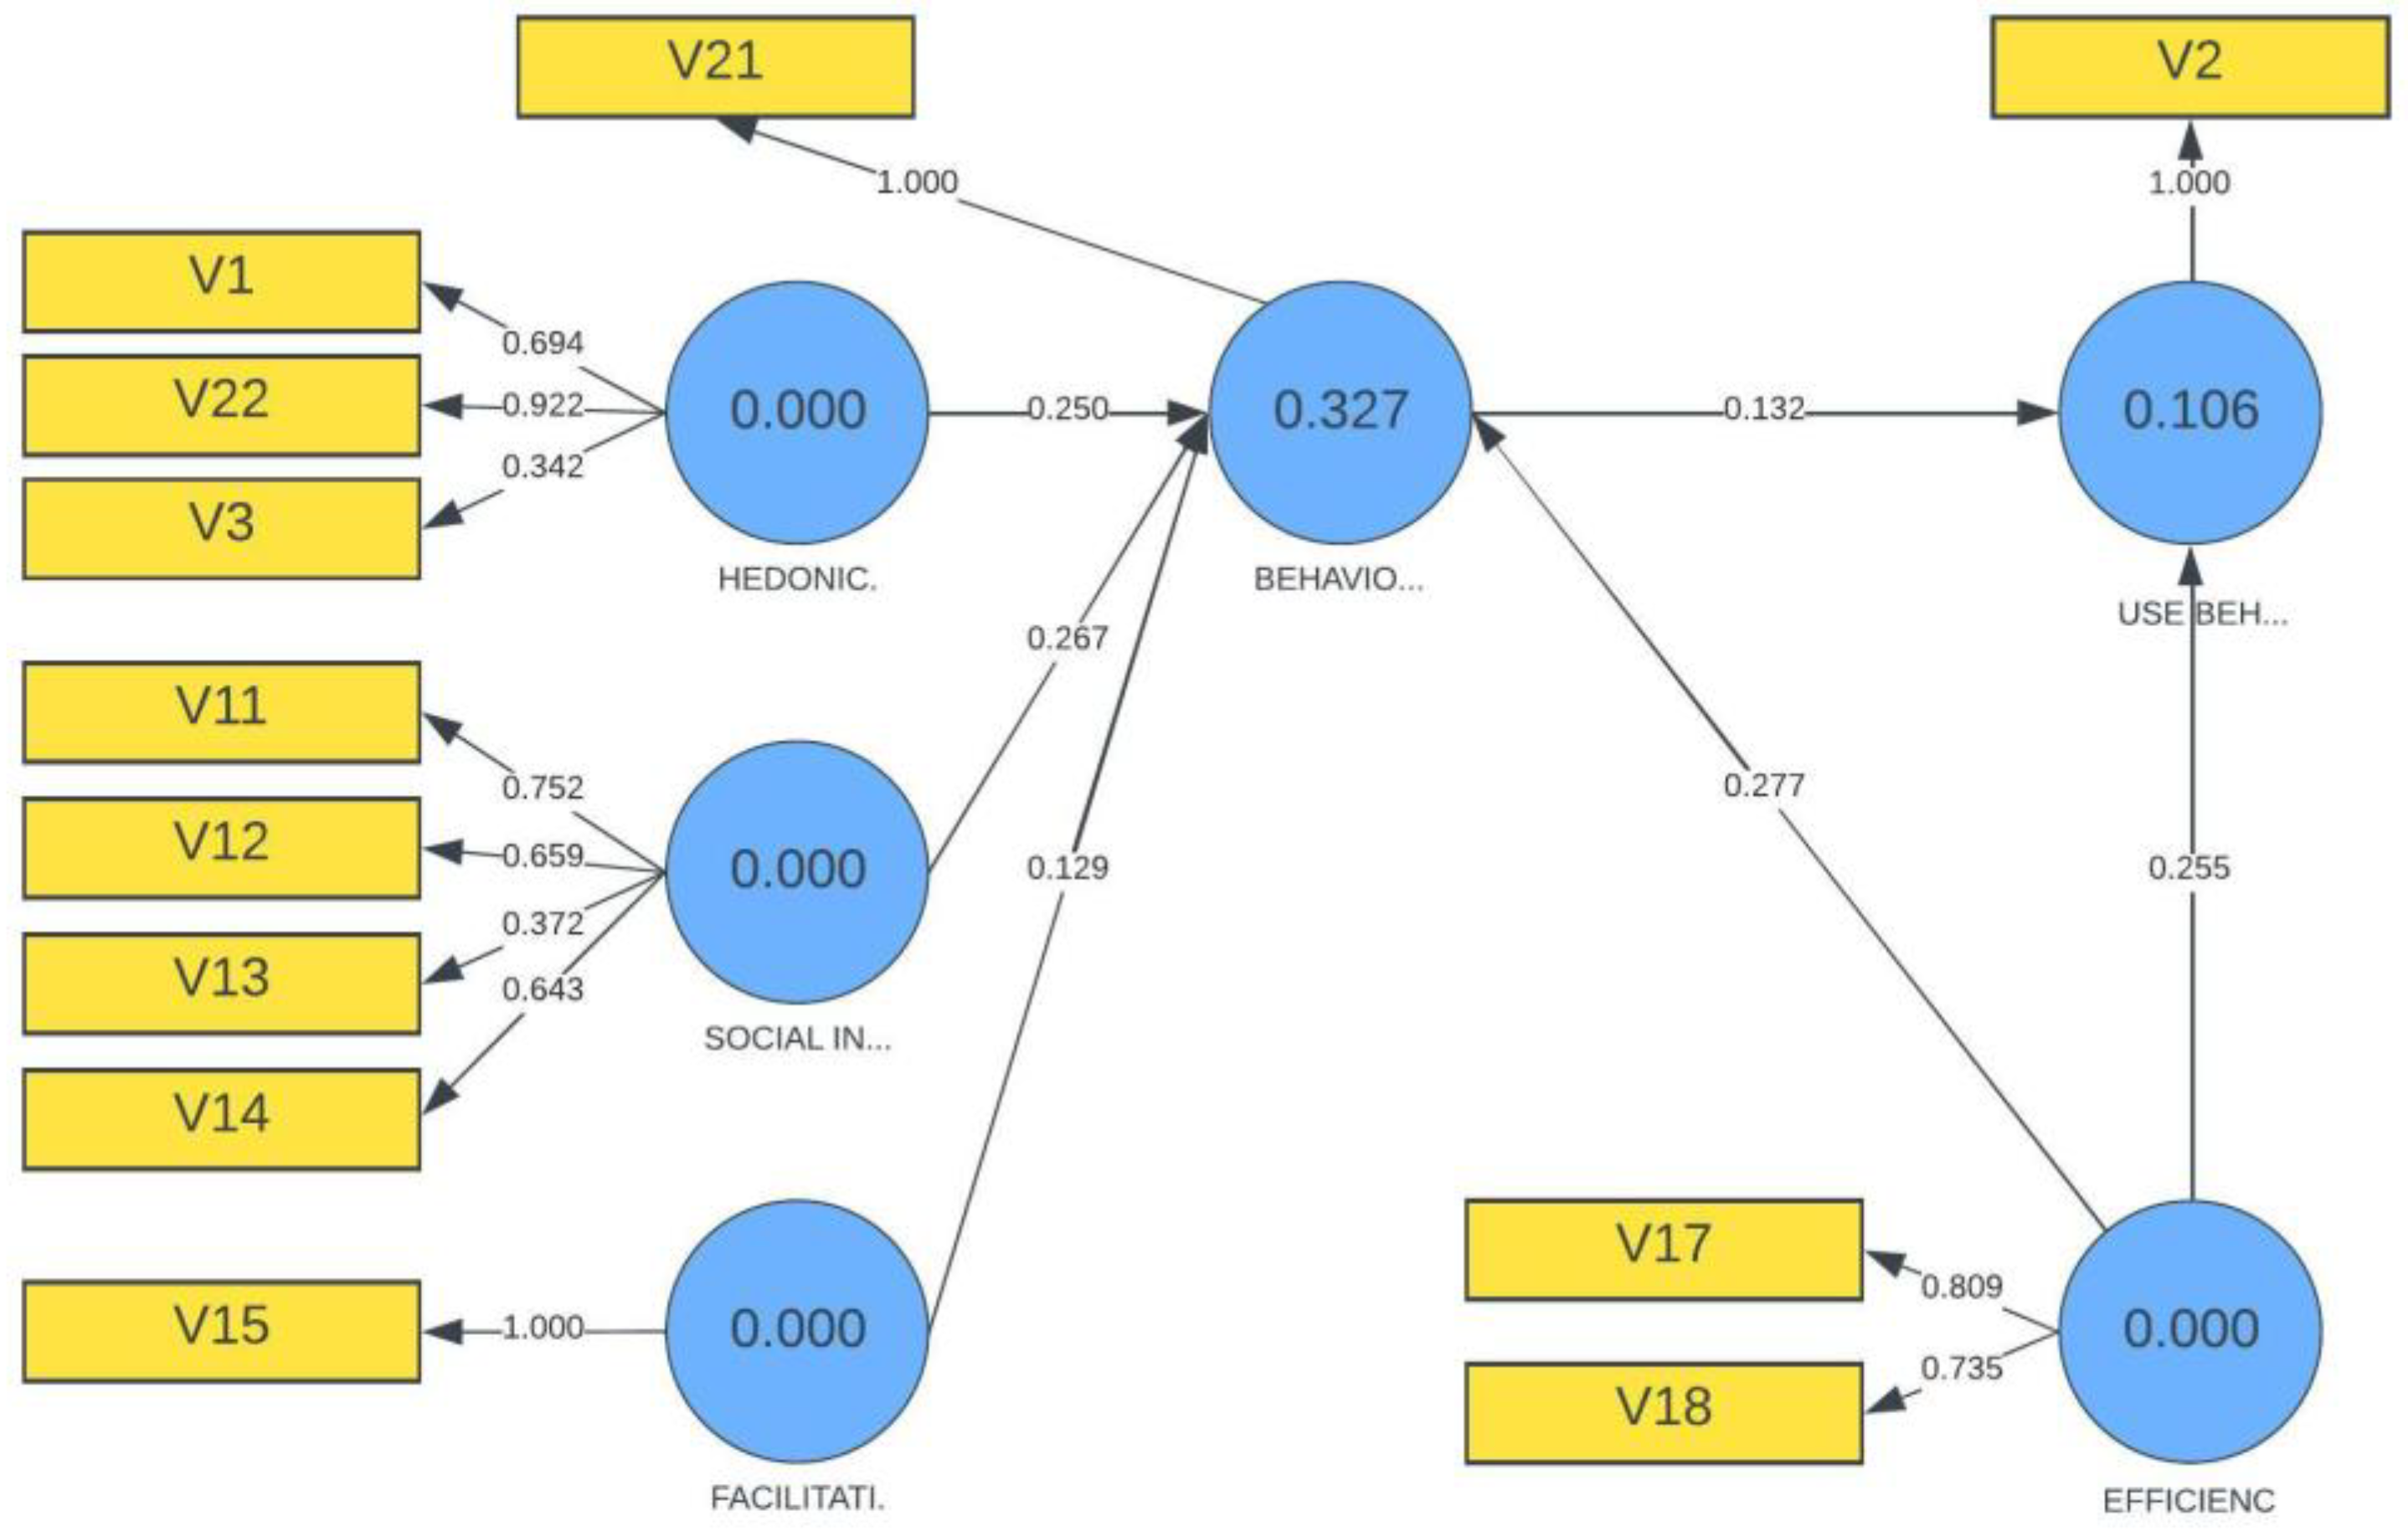
  • Composite reliability: Looking at the coefficients of determination, the latent variables (hedonic motivation, social influence, facilitating conditions and efficiency) explain 32.7 % of behavioral intention (R2 = 0.327). On the other hand, behavioral intention and efficiency moderately explain only 10.6% of the variance in use behavior (R2 = 0.106). This suggests that there might be other factors that would explain its usage. The hypothesized path relationships between hedonic motivation, social influence, facilitating conditions, efficiency, and behavioral intention are statistically significant (0.250, 0.267, 0.129, and 0.277, respectively). Hence, an inspection of the inner model’s path coefficient suggests that efficiency has the strongest effect on behavioral intention (0.277). Thus, we can conclude that: hedonic motivation, social influence, facilitating conditions and efficiency are strong predictors of behavioral intention which is a strong predictor of the use behavior.
  • Indicator Reliability: As shown in our model, indicators for hedonic motivation, social influence, facilitating conditions and efficiency (with V3 = 0.342 and V13 = 0.372) are all greater than 0.4. Therefore, we can conclude that most of the indicators are reliable.
  • Internal Consistency Reliability (see Table 4): In line with prior literature, the authors have checked for a “Composite Reliability greater than 0.6” as a measure of internal consistency reliability (R.P. Bagozzi and Yi 1988). Internal consistency reliability is demonstrated among all reflective latent variables, as shown in Table 4.
  • Each latent variable’s average variance extracted (AVE) is evaluated with a convergent validity check (see Table 5). From it is found that all the AVE values, except for hedonic motivation and social influence, are greater than the acceptable threshold of 0.5; so, convergent validity is confirmed.
  • Bootstrapping:
See Table 4 below.
Table 4. Composite Reliability.
Composite Reliability
BEHAVIORAL INTENTION1.000000
EFFICIENCY0.747642
FACILITATING CONDITIONS1.000000
HEDONIC MOTIVATION0.711993
SOCIAL INFLUENCE0.706164
USE BEHAVIOR1.000000
See Table 5 below.
Table 5. Ave.
Table 5. Ave.
Ave
BEHAVIORAL INTENTION1.000000
EFFICIENCY0.597547
FACILITATING CONDITIONS1.000000
HEDONIC MOTIVATION0.483022
SOCIAL INFLUENCE0.387841
USE BEHAVIOR1.000000
The T statistics test results are reported in Table 6 below, the T-statistics of some of the variables (dependent and independent variables) are larger than 1.96 (shown in the Table 6). However, other variables are below this score. These indicators will assess the validity of the hypothesis in the results section of this paper.

5. Results

According to the initial models (without the modification or deletion of variables), the following table summarizes the results; some hypotheses for Italian or for Lebanese Youth were fully supported, others were partially supported, and other hypotheses were rejected. See Table 7 below.
H1. 
Hedonic motivation has a significant relationship with behavioral intention among the Youth generation if they live in post-modern countries (Italy) compared to those living in non-post-modern countries (Lebanon).
For Lebanon, H1 hedonic motivation has a significant relationship with behavioral intention among the Youth generation if they live in Lebanon. Inner model path coefficient = 0.152, Bootstrapping = 2.251.
For Italy, H1B hedonic motivation has a significant relationship with behavioral intention among members of the Millennial generation if they live in Lebanon. Inner model path coefficient = 0.250, Bootstrapping = 3.789.
We may conclude that for the significance of hedonic motivation and its relationship to behavioral intention, we reject the null hypothesis and favor a relationship with behavioral intention among young people residing in Italy or Lebanon.
H2. 
Behavioral intention among youth has a significant relationship with use behavior if they live in post-modern countries (Italy) compared to those living in non-post-modern countries (Lebanon).
For Lebanon, H2 behavioral intention has a significant relationship with the use behavior among members of the Millennial generation if they live in countries scoring low on uncertainty avoidance. Since the inner model path coefficient is equal to 0.295 and Bootstrapping = 4.217, this hypothesis is fully supported
For Italy, H2B behavioral intention has a significant relationship with use behavior among members of Youth if they live in countries scoring high on uncertainty avoidance. Since the inner model path coefficient is equal to 0.132 and Bootstrapping = 2.139, this hypothesis is fully supported
We may conclude that behavioral intention has a substantial association with young people’s digital marketing usage behavior in both nations with high or low uncertainty avoidance scores, and we reject the null hypothesis.
H3. 
Social influence has a significant relationship with behavioral intention among Youth if they live in collectivistic countries (Lebanon) compared to individualistic countries (Italy).
For Lebanon, H3 social influence has a significant relationship with behavioral intention among Youth if they live in countries scoring low on digital marketing experience (Lebanon). Inner model path coefficient = 0.124, Bootstrapping = 2.131.
For Italy, H3 social influence has a significant relationship with behavioral intention among Youth if they live in countries with higher digital marketing experience (Italy). Inner model path coefficient = 0.267, Bootstrapping = 4.231.
We may conclude that social influence has a significant relationship with behavioral intention among Youth regardless of whether they live in individualistic or collectivistic countries; hence, we reject the null hypothesis.
H4. 
Facilitating conditions have a significant relationship with behavioral intention among Youth if they live in countries high in uncertainty avoidance (Italy) compared to those scoring low on uncertainty avoidance (Lebanon).
For Lebanon, H4 facilitating conditions have significant relationship with behavioral intention among Youth if they live in countries scoring low on digital marketing experience (Lebanon). Inner model path coefficient = 0.038 < 0.1.
For Italy, H4 facilitating conditions have a significant relationship with behavioral intention among the Youth generation if they live in countries with higher digital marketing experience (Italy). Inner model path coefficient = 0.129, Bootstrapping = 2.026.
The results for the facilitating conditions variable are partially supported because this variable has a significant relationship with behavioral intention among Youth in countries with high uncertainty avoidance (Italy), but not in countries with low uncertainty avoidance (Lebanon).
H5. 
Effort expectancy has a significant relationship with behavioral intention among Youth if they live in countries with higher digital marketing experience (Italy) compared to those scoring low on digital marketing experience (Lebanon).
For Lebanon, H5 effort expectancy has a significant relationship with behavioral intention among youth if they live in less technologically developed and industrialized countries (Lebanon). The inner model path coefficient = 0.09 < 0.1 is rejected and we retain the null hypothesis.
For Italy, H5 effort expectancy has a significant relationship with behavioral intention among Youth if they live in technologically developed and industrialized countries (Italy). The inner model path coefficient = −0.028 < 0.1 is rejected and we retain the null hypothesis.
We may conclude that the effort expectancy variable has not been significantly associated with behavioral intention among the Youth generation if they dwelled in nations with higher digital marketing experience (Italy) compared to those with less digital marketing experience (Lebanon).
H6. 
Price value has a significant relationship with behavioral intention among Youth if they live in collectivistic countries (Lebanon) compared to individualistic countries (Italy).
For Lebanon, H6 price value has a significant relationship with behavioral intention among Youth if they live in non-post-modern countries (Lebanon). Inner model path coefficient = 0.112, Bootstrapping = 1.686, and the hypothesis is rejected
For Italy, H6 price value has a significant relationship with behavioral intention among Youth if they live in post-modern countries (Italy). Inner model path coefficient = 0.040 < 0.1, and hypothesis is rejected
We may conclude that price value has no significant relationship with behavioral intention among young people living in collectivistic nations (Lebanon) versus individualistic countries (Italy), and we are confident to uphold the null hypothesis.
H7. 
Subjective norms have a significant relationship with behavioral intention among Youth if they live in technologically developed and industrialized countries (Italy) compared to those living in less technologically developed and industrialized countries (Lebanon).
For Lebanon, H7 subjective norms have a significant relationship with behavioral intention among youth if they live in non-post-modern countries (Lebanon). Inner model path coefficient = 0.197, Bootstrapping = 2.806, Conclusion = Supported, and we can reject the null hypothesis.
For Italy, H7 subjective norms have a significant relationship with behavioral intention among Youth if they live in post-modern countries (Italy). Inner model path coefficient = 0.089 < 0.1, and we may retain the null hypothesis.
We can conclude that subjective norms have no significant relationship with behavioral intention among Youth in technologically developed and industrialized countries (Italy); however, they have a significant relationship when compared to those in less technologically developed and industrialized countries (Lebanon); so, the results are partially supported.
H8. 
Experience and habit have a significant relationship with behavioral intention among youth if they live in technologically developed and industrialized countries (Italy) compared to those living in less technologically developed and industrialized countries (Lebanon).
For Lebanon, H8 experience and habit have a significant relationship with behavioral intention among youth if they live in non-post-modern countries (Lebanon). Inner model path coefficient = 0.159, Bootstrapping = 2.747, the hypothesis is supported, and we reject the null hypothesis
For Italy, H8 experience and habit have a significant relationship with behavioral intention among youth if they live in post-modern countries (Italy). Inner model path coefficient = 0.008 < 0.1.
We can conclude that experience and habit have no significant relationship with behavioral intention among Youth in technologically developed and industrialized countries (Italy); however, this variable has a significant relationship when compared to those living in less technologically developed and industrialized countries (Lebanon); thus, the results are partially supported.
H9. 
Efficiency has a significant relationship with behavioral intention among Youth if they live in technologically developed and industrialized countries (Italy) compared to those living in less technologically developed and industrialized countries (Lebanon).
For Lebanon, H9 efficiency has a significant relationship with behavioral intention among Youth if they live in non-post-modern countries (Lebanon). Inner model path coefficient = 0.132, Bootstrapping = 1.874, and we can reject this hypothesis and retain the null hypothesis.
For Italy, H9 efficiency has a significant relationship with behavioral intention among Youth if they live in post-modern countries (Italy). Inner model path coefficient = 0.277, Bootstrapping = 6.055, the results are supported, and we can confidently reject the null hypothesis.
We can conclude that efficiency has a significant relationship with Youth behavioral intentions if they live in technologically developed and industrialized countries (Italy); however, when compared to those living in less technologically developed and industrialized countries (Lebanon), efficiency has no significant relationship with Youth behavioral intentions; thus, this hypothesis is partially supported.
H10. 
Efficiency has a significant relationship with use behavior among Youth if they live in technologically developed and industrialized countries (Italy) compared to those living in less technologically developed and industrialized countries (Lebanon).
For Lebanon, H10 efficiency has a significant relationship with use behavior among Youth if they live in non-post-modern countries (Lebanon). Inner model path coefficient = −0.130, Bootstrapping = 2.276, and we reject the null hypothesis.
For Italy, H10 efficiency has a significant relationship with use behavior among Youth if they live in post-modern countries (Italy). Inner model path coefficient = 0.255, Bootstrapping = 4.512, hypothesis is supported, and we reject the null hypothesis.
We may conclude that the efficiency variable has a substantial relationship with usage behavior among young people who live in technologically developed and industrialized nations (Italy) compared to those who live in less technologically developed and industrialized countries (Lebanon).

6. Discussion

According to cross-cultural psychology theories and empirical research, culture has an impact on various aspects of human behavior, including attitudes, motivations, needs, and responses to social media (Sheldon et al. 2017). This study recognizes key factors that are relevant to understanding the impact of cross-cultural characteristics on Youth consumers’ behavioral intentions (Al Haderi and Aziz 2015) and use of digital marketing and analyzes the relationships among these factors (as shown in Figure 6).
The findings highlight two different deductions. The first one demonstrates that culture does not affect the effect of three independent variables as mentioned in the literature (UTAUT2); Lebanese and Italian Youth’s digital marketing behavioral intentions are mostly affected by their ability to enjoy the interaction with technology devices (these results do not support the specific findings of previous research, particularly the study conducted by Basr and Daud (2020)). In fact, they enjoy a certain degree of fun in using technology and social media for digital marketing purposes, and, hence, this is an important driver in considering them as beneficial. Further, they also use it because their family, friends, and co-workers encourage them to do so (Hidvégi and Kelemen-Erdős 2016). Therefore, if hedonic motivation and social influence increase, they will be more likely to consider digital marketing as useful and, consequently, adopt it (Cabrera-Sánchez et al. 2021). Thus, according to the 5S Internet marketing model, the use of certain technologies makes it more efficient, which is the case in both cultures. Some aspects of the models are unified regardless of culture. Unexpectedly, the cost and price of virtual products and processes does not influence Youth’s behavioral intention to use digital marketing.
The second deduction shows that there are some divergent aspects that might affect Youth’s behavior depending on the culture of the country they are living in. For instance, Italian Youth are influenced by more technological rather than culturally driven features. In particular, they are influenced by digital marketing system characteristics (facilitating conditions). Lebanese Youth use and appreciate digital marketing because it is becoming quite common to use and many companies are adopting those systems (subjective norms). They are correspondingly affected by experience and habit, which can lead them to using digital marketing in a progressive way in their lives.
Therefore, if hedonic motivation, social influence, experience and habit, subjective norm, and efficiency increase, they will be more likely to consider digital marketing as useful and, consequently, adopt it.
According to the results, in terms of cultural explanations, it seems that the main factor influencing digital marketing utility perception among Lebanese Youth is collectivism (Hofstede 1980). Indeed, young Lebanese people are not influenced by price or value related issues but, on the opposite, are mainly influenced by important others’ opinions and beliefs, and by the symbolic meanings of goods. Furthermore, they have a pragmatic approach, therefore businesses that wish to address this audience using digital marketing tools should, for example, explicitly make efforts in terms of innovation and avoid categorizing goods ranges.
Furthermore, Italian Youth, which have grown in an individualistic country with a developed infrastructural level, are more influenced by technological aspects and their own previous experience with technology than by others’ opinions. Among this generational group, utility perception and attitudes toward digital marketing are encouraged by very well-designed digital marketing systems that reduce effort expectancy and increase facilitating conditions in terms of commercial and technological infrastructures. Despite effort expectancy having a significant influence on behavioral intention (Schmitz et al. 2022), the study indicates that culture does not play a role in the association between behavioral intention and effort expectancy for the Millennial generation. They expect high technological quality when interacting with digital marketing tools and good service in terms of purchasing process since they are used to it. Indeed, they are conscious that digital marketing is a growing trend and have already changed their consumer behaviors in a technologically driven way. Therefore, Italian Youth are more influenced by their own experience with those systems and should derive fun and gratification from a tool to continue to use it. This is typical of people living in post-modern societies (Inglehart and Baker 2000; Offer 1998) and may suggest that companies should adopt gamification of digital marketing strategies to boost Italian youth engagement and loyalty. Surprisingly, despite Italian people usually being influenced by trends and modernity, trend is not a significant variable. This may be because it is not a trend itself that determines technological acceptance in the Italian culture, but it is more important to consider the social opinion of that trend. Otherwise, an alternative explanation could be that digital marketing is not perceived as a real trend, probably due to the early implementation of technological tools in Italy.

7. Conclusions and Limitations

First, through our research we have identified several key factors that influence the perception of digital marketing utility among Youth.
As the convenience of digital marketing is a key factor, Youth value time and the ability to make purchases quickly and easily. In addition, the perceived value and quality of products and services offered through digital marketing channels play a significant role in shaping Youth’s perceptions of digital marketing utility. The fact that Youth enjoy interacting with technological devices can be seen as a positive factor because digital marketing often relies on technology to deliver messages, content, and promotions to consumers, and Youth are receptive to these messages when delivered through technological devices (hedonic motivation). Youth also trust the recommendations and feedback of their peers and social media influencers more than traditional marketing messages (social influence).
Second, if it is true that technological infrastructure is essential to improve and facilitate the use of technology, especially when the infrastructural level is poor, the motivation toward technology may be led by other—more cultural—drivers. Therefore, despite the internationalization of digital marketing and the general trend toward more post-modern values and a general convergence in value orientation among members of the Millennial generation in different countries (Inglehart and Baker 2000; Offer 1998), national cultures still play an important role in affecting digital marketing behaviors, especially in less industrialized countries (Boustani and Sayegh 2023).
Third, these findings will assist policymakers in Lebanon in raising knowledge of the key determinants of digital marketing adoption and usage activity among young people, allowing them to make better decisions. The use of digital technologies should be promoted to increase its intentions among Lebanese students, especially as the digital business sector is regarded as a new pillar that might help alleviate Lebanon’s serious economic crisis. With a dearth of job possibilities and high levels of unemployment, young people with digital skills can start their own businesses and become productive entrepreneurs.
In conclusion, digital marketing utility perception among Youth is influenced by a complex interplay of convenience, perceived value and quality, social influences, efficiency, facilitating conditions, and experience. Moreover, Cueto et al. (2022) identified challenges to digital entrepreneurship and the availability of high-quality internet infrastructure which can hinder the usage of digital marketing for Lebanese youth facing these challenges.
There are certain limitations to this work that could lead to a new path of investigation. It would be fascinating to increase the sample size and add alumni from various schools in order to repeat the findings and check for differences. Finally, because the sample size is confined to business students in Lebanon and Italy, the findings of this study cannot be generalized. Clearly, this study has several limitations given the relatively small sample size that can impact the generalizability of our study’s findings, the convenience sampling, the resource limitation, and the time constraint. Furthermore, the use of university students as a sample is questionable (Bello et al. 2009).
However, our suggestion is that the next studies should be conducted on a bigger scale of a population by using stratified or cluster sampling. Finally, a different research design can be used by exploring the Millennial generation’s attitude toward digital marketing in developing countries to understand how companies may target this growing consumer group more efficiently.

Author Contributions

Conceptualization, N.M.B. and C.C.; methodology, N.M.B.; software, C.C.; validation, N.M.B. and C.C.; formal analysis, N.M.B.; investigation, C.C.; resources, N.M.B.; data curation, C.C.; writing—original draft preparation, C.C. and N.M.B.; writing—review and editing, N.M.B.; visualization, N.M.B.; supervision, N.M.B.; project administration, C.C.; funding acquisition, N.M.B. All authors have read and agreed to the published version of the manuscript.

Funding

This research received no external funding.

Institutional Review Board Statement

The study was conducted in accordance with the Declaration of Helsinki.

Informed Consent Statement

Informed consent was obtained from all subjects involved in the study.

Data Availability Statement

Data are available from the corresponding author upon request.

Conflicts of Interest

The authors declare no conflict of interest.

References

  1. Ajzen, Icek. 2011. Behavioral interventions: Design and evaluation guided by theory of planned behavior. In Social Psychology and Evaluation. New York: Guilford Press, pp. 72–101. [Google Scholar]
  2. Ajzen, Icek, and Martin Fishbein. 1980. Understanding Attitudes and Predicting Social Behavior. Englewood Cliffs: Prentice Hall. [Google Scholar]
  3. Al Haderi, Sami Mohamed, and Azelin Binti Aziz. 2015. The effect of social characteristic in the acceptance and continue usage for information technology in the public sector. International Journal of Business and Social Science 6: 186–92. [Google Scholar]
  4. Anjum, Temoor, Sara Ravan Ramzani, and Nida Nazar. 2019. Antecedents of entrepreneurial intentions: A study of business students from universities of Pakistan. International Journal of Business and Psychology 13: 72–88. [Google Scholar]
  5. Bagozzi, Richard P., and Youjae Yi. 1988. On the evaluation of structural equation models. Journal of the Academy of Marketing Science 16: 74–94. [Google Scholar] [CrossRef]
  6. Baptista, Gonçalo, and Tiago Oliveira. 2016. A weight and a meta-analysis on mobile banking acceptance research. Computers in Human Behavior 63: 480–89. [Google Scholar] [CrossRef]
  7. Basr, Syahirah Syuhada Sohibul, and Ku Amir Ku Daud. 2020. The Impact of Purchasing Behaviour towards Digital Marketing in Kangar, Perlis. International Journal of Business and Management 4: 62–69. [Google Scholar]
  8. Baudier, Patricia, Chantal Ammi, and Matthieu Deboeuf-Rouchon. 2018. Smart home: Highly-educated students’ acceptance. Technological Forecasting and Social Change 153: 119355. [Google Scholar] [CrossRef]
  9. Bello, Daniel, Kwok Leung, Lee Radebaugh, Rosalie L. Tung, and Arjen van Witteloostuijn. 2009. From the Editors: Student samples in international business research. Journal of International Business Studies 40: 361–64. [Google Scholar] [CrossRef] [Green Version]
  10. Blaise, Robert, Michael Halloran, and Marc Muchnick. 2018. Mobile Commerce Competitive Advantage: A Quantitative Study of Variables that Predict M-Commerce Purchase Intentions. Journal of Internet Commerce 17: 96–114. [Google Scholar] [CrossRef]
  11. Boustani, Nada Mallah, and May Merhej Sayegh. 2023. The Impact of Social Commercial Platforms on Entrepreneurship in a Developing Country. In Smart Technologies for Organizations. Lecture Notes in Information Systems and Organisation. Edited by Cinzia Dal Zotto, Afshin Omidi and Georges Aoun. Cham: Springer, vol. 60, pp. 89–106. [Google Scholar] [CrossRef]
  12. Boustani, Nada Mallah, May Merhej Sayegh, and Zaher Boustany. 2022. Attitude towards Online Shopping during Pandemics: Do Gender, Social Factors and Platform Quality Matter? Journal of Risk and Financial Management 15: 474. [Google Scholar] [CrossRef]
  13. Brown, Susan A., and Viswanath Venkatesh. 2005. Model of Adoption of Technology in Households: A Baseline Model Test and Extension Incorporating Household Life Cycle. Mis Quarterly 29: 399. [Google Scholar] [CrossRef]
  14. Brown, Susan A., Viswanath Venkatesh, and Hillol Bala. 2006. Household Technology Use: Integrating Household Life Cycle and the Model of Adoption of Technology in Households. The Information Society 22: 205–18. [Google Scholar] [CrossRef]
  15. Byrne, Barbara M. 2010. Structural Equation Modeling with AMOS: Basic Concepts, Applications, and Programming, 2nd ed. New York: Taylor and Francis Group. [Google Scholar]
  16. Cabrera-Sánchez, Juan-Pedro, Ángel F. Villarejo-Ramos, Francisco Liébana-Cabanillas, and Aijaz A. Shaikh. 2021. Identifying relevant segments of AI applications adopters—Expanding the UTAUT2′s variables. Telematics and Informatics 58: 101529. [Google Scholar] [CrossRef]
  17. Carstensen, Laura L. 1992. Social and emotional patterns in adulthood: Support for socioemotional selectivity theory. Psychology and Aging 7: 331–38. [Google Scholar] [CrossRef] [PubMed]
  18. Chao, Cheng-Min. 2019. Factors determining the behavioral intention to use mobile learning: An application and extension of the UTAUT model. Frontiers in Psychology 10: 1652. [Google Scholar] [CrossRef] [PubMed] [Green Version]
  19. Childers, Terry L., Christopher L. Carr, Joann Peck, and Stephen Carson. 2002. Hedonic and utilitarian motivations for online retail shopping behavior. Journal of Retailing 77: 511–35. [Google Scholar] [CrossRef]
  20. Chin, Wynne W., Barbara L. Marcolin, and Peter R. Newsted. 2003. A Partial Least Squares Latent Variable Modeling Approach for Measuring Interaction Effects: Results from a Monte Carlo Simulation Study and an Electronic-Mail Emotion/Adoption Study. Information Systems Research 14: 127–219. [Google Scholar] [CrossRef] [Green Version]
  21. Cueto, Lavinia Javier, April Faith Deleon Frisnedi, Reynaldo Baculio Collera, Kenneth Ian Talosig Batac, and Casper Boongaling Agaton. 2022. Digital Innovations in MSMEs during Economic Disruptions: Experiences and Challenges of Young Entrepreneurs. Administrative Sciences 12: 8. [Google Scholar] [CrossRef]
  22. Dirani, Khalil. 2006. Exploring socio-cultural factors that influence HRD practices in Lebanon. Human Resource Development International 9: 85–98. [Google Scholar] [CrossRef]
  23. Dodds, William B., Kent B. Monroe, and Dhruv Grewal. 1991. Effects of Price, Brand, and Store Information on Buyers’ Product Evaluations. Journal of Marketing Research 28: 307–19. [Google Scholar] [CrossRef]
  24. Dumitriu, Dan, Gheorghe Militaru, Dana Corina Deselnicu, Andrei Niculescu, and Mirona Ana-Maria Popescu. 2019. A Perspective Over Modern SMEs: Managing Brand Equity, Growth and Sustainability Through Digital Marketing Tools and Techniques. Sustainability 11: 2111. [Google Scholar] [CrossRef] [Green Version]
  25. Fang, Xiaowen, and Gavriel Salvendy. 2003. Customer-centered rules for design of e-commerce Web sites. Communications of the ACM 46: 332–36. [Google Scholar] [CrossRef]
  26. Gye-Soo, Kim. 2016. Partial Least Squares Structural Equation Modeling (PLS-SEM): An application in Customer Satisfaction Research. International Journal of u- and e- Service, Science and Technology 9: 61–68. [Google Scholar] [CrossRef]
  27. Haenlein, Michael, and Andreas M. Kaplan. 2004. A Beginner’s Guide to Partial Least Squares Analysis. Understanding Statistics 3: 283–97. [Google Scholar] [CrossRef]
  28. Hair, Joe F., Marko Sarstedt, Christian M. Ringle, and Jeannette A. Mena. 2011. An assessment of the use of partial least squares structural equation modeling in marketing research. Journal of the Academy of Marketing Science 40: 414–33. [Google Scholar] [CrossRef]
  29. Hair, Joseph F., Jr., G. Tomas M. Hult, Christian M. Ringle, and Marko Sarstedt. 2016. A Primer on Partial Least Squares Structural Equation Modeling. Thousand Oaks: Sage Publications. [Google Scholar]
  30. Hidvégi, Anna, and Anikó Kelemen-Erdős. 2016. Assessing the online purchasing decisions of Generation Z. Paper presented at the FIKUSZ Symposium for Young Researchers, Óbuda University Keleti Károly Faculty of Economics, Budapest, Hungary, November 25; p. 173. [Google Scholar]
  31. Ho, Shuyuan Mary, Mónica Ocasio-Velázquez, and Cheryl Booth. 2017. Trust or consequences? Causal effects of perceived risk and subjective norms on cloud technology adoption. Computers & Security 70: 581–95. [Google Scholar] [CrossRef]
  32. Hofstede, Geert. 1980. Individualism. In Culture’s Consequences: International Differences in Work-Related Values. University of Illinois at Urbana-Champaign’s Academy for Entrepreneurial Leadership Historical Research Reference in Entrepreneurship. Beverly Hills and London: Sage. [Google Scholar]
  33. Hofstede, Geert. 1991. Culture and Organizations: Software of the Mind. London: McGraw Hill. [Google Scholar]
  34. Holbrook, Morris B., and Elizabeth C. Hirschman. 1982. The Experiential Aspects of Consumption: Consumer Fantasies, Feelings, and Fun. Journal of Consumer Research 9: 132–40. [Google Scholar] [CrossRef] [Green Version]
  35. Hyllegard, Karen H., Ruoh-Nan Yan, Jennifer Paff Ogle, and Julianne Attmann. 2010. The influence of gender, social cause, charitable support, and message appeal on Gen Y’s responses to cause-related marketing. Journal of Marketing Management 27: 100–23. [Google Scholar] [CrossRef]
  36. Inglehart, Ronald. 2000. Globalization and Postmodern Values. The Washington Quarterly 23: 215–28. [Google Scholar] [CrossRef]
  37. Inglehart, Ronald, and Wayne E. Baker. 2000. Modernization, Cultural Change, and the Persistence of Traditional Values. American Sociological Review 65: 19–51. [Google Scholar] [CrossRef] [Green Version]
  38. Isa, Salmi Mohd, and Khang-Yeu Wong. 2015. Age differences in behavioral intention to use internet marketing: A comparative study between Malaysian and Taiwanese. International Journal of Business and Society 16. [Google Scholar] [CrossRef] [Green Version]
  39. Khong, Sei Zhen, Dragan Nešić, Ying Tan, and Chris Manzie. 2013. Unified frameworks for sampled-data extremum seeking control: Global optimisation and multi-unit systems. Automatica 49: 2720–33. [Google Scholar] [CrossRef]
  40. Kim, Sung S., Naresh K. Malhotra, and Sridhar Narasimhan. 2005. Research Note—Two Competing Perspectives on Automatic Use: A Theoretical and Empirical Comparison. Information Systems Research 16: 418–32. [Google Scholar] [CrossRef]
  41. Kim, Yong Seog, and Vinh Loc Tran. 2013. Assessing the ripple effects of online opinion leaders with trust and distrust metrics. Expert Systems with Applications 40: 3500–11. [Google Scholar] [CrossRef]
  42. Kotler, Philip, Gary Armstrong, John Saunders, and Veronica Wong. 2001. Marketing in a changing world. In Principles of Marketing. Hoboken: Prentice Hall, vol. 6, pp. 69–90. [Google Scholar]
  43. Kumar, Archana, and Heejin Lim. 2008. Age differences in mobile service perceptions: Comparison of Generation Y and baby boomers. Journal of Services Marketing 22: 568–77. [Google Scholar] [CrossRef]
  44. Latif, Ahmed Abdel, Keith Maskus, Ruth Okediji, Jerome Reichman, and Pedro Roffe. 2011. Overcoming the Impasse on Intellectual Property and Climate Change at the UNFCCC: A Way Forward. ICTSD Policy Brief 11: 1–9. Available online: http://ictsd.org/i/publications/120254/?view=document (accessed on 22 November 2022).
  45. Limayem, Moez, Sabine Gabriele Hirt, and Christy M. K. Cheung. 2007. How Habit Limits the Predictive Power of Intention: The Case of Information Systems Continuance. Mis Quarterly 31: 705–37. [Google Scholar] [CrossRef] [Green Version]
  46. Liu, Kaifeng, and Da Tao. 2022. The roles of trust, personalization, loss of privacy, and anthropomorphism in public acceptance of smart healthcare services. Computers in Human Behavior 127: 107026. [Google Scholar] [CrossRef]
  47. Loroz, Peggy Sue. 2006. The generation gap: A baby boomer vs. gen Y comparison of religiosity, consumer values, and advertising appeal effectiveness. ACR North American Advances 33: 308–09. [Google Scholar]
  48. Luc, Phan Tan. 2018. The Relationship between Perceived Access to Finance and Social Entrepreneurship Intentions among University Students in Vietnam. The Journal of Asian Finance, Economics and Business 5: 63–72. [Google Scholar] [CrossRef]
  49. Magsamen-Conrad, Kate, Shrinkhala Upadhyaya, Claire Youngnyo Joa, and John Dowd. 2015. Bridging the divide: Using UTAUT to predict multigenerational tablet adoption practices. Computers in Human Behavior 50: 186–96. [Google Scholar] [CrossRef] [Green Version]
  50. Mckinsey Company. 2019. Ready to Go ‘Where’: Getting Sharp on Apparel Omnichannel Excellence. Available online: https://www.mckinsey.com/industries/retail/our-insights/ready-to-where-getting-sharp-on-apparel-omnichannel-excellence (accessed on 22 November 2022).
  51. Morton, Linda P. 2002. Targeting Generation Y. Public Relations Quarterly 47: 46. [Google Scholar]
  52. Nunan, Daniel, and Marialaura Di Domenico. 2019. Older Consumers, Digital Marketing, and Public Policy: A Review and Research Agenda. Journal of Marketing & Public Policy 38: 469–83. [Google Scholar] [CrossRef] [Green Version]
  53. Nysveen, Herbjørn, Per E. Pedersen, Helge Thorbjørnsen, and Pierre Berthon. 2005. Mobilizing the Brand. Journal of Service Research 7: 257–76. [Google Scholar] [CrossRef]
  54. OECD and Eurostat. 2005. Oslo Manual 3rd Ed, Guidelines for Collecting and Interpreting Innovation Data. Paris: OECD. [Google Scholar]
  55. OECD. 2016. OECD Factbook 2015–2016. Available online: https://www.oecd-ilibrary.org/economics/oecd-factbook-2015-2016_factbook-2015-en (accessed on 22 November 2022).
  56. Offer, Avner. 1998. Book ReviewModernization and Postmodernization: Cultural, Economic, and Political Change in 43 Societies. American Journal of Sociology 104: 560–62. [Google Scholar] [CrossRef]
  57. Oliveira, Tiago, Miguel Faria, Manoj Abraham Thomas, and Aleš Popovič. 2014. Extending the understanding of mobile banking adoption: When UTAUT meets TTF and ITM. International Journal of Information Management 34: 689–703. [Google Scholar] [CrossRef]
  58. Ramírez-Correa, Patricio, Francisco Javier Rondán-Cataluña, Jorge Arenas-Gaitán, and Félix Martín-Velicia. 2019. Analysing the acceptation of online games in mobile devices: An application of UTAUT2. Journal of Retailing and Consumer Services 50: 85–93. [Google Scholar] [CrossRef]
  59. Schmitz, Anne, Ana M. Díaz-Martín, and Mª Jesús Yagüe Guillén. 2022. Modifying UTAUT2 for a cross-country comparison of telemedicine adoption. Computers in Human Behavior 130: 107183. [Google Scholar] [CrossRef]
  60. Schmitz, Lena, and Wiebke Weber. 2014. Are Hofstede’s dimensions valid? A test for measurement invariance of Uncertainty Avoidance 1. Interculture Journal 13: 11–26. [Google Scholar]
  61. Shaw, Norman, and Ksenia Sergueeva. 2019. The non-monetary benefits of mobile commerce: Extending UTAUT2 with perceived value. International Journal of Information Management 45: 44–55. [Google Scholar] [CrossRef]
  62. Sheldon, Pavica, Philipp A. Rauschnabel, Mary Grace Antony, and Sandra Car. 2017. A cross-cultural comparison of Croatian and American social network sites: Exploring cultural differences in motives for Instagram use. Computers in Human Behavior 75: 643–51. [Google Scholar] [CrossRef]
  63. Soper, Daniel. 2019. A-Priori Sample Size Calculator for Structural Equation Models [Software]. Available online: http://www.danielsoper.com/statcalc (accessed on 22 November 2022).
  64. Stansfield, Mark. 2006. eMarketing eXcellence: The Heart of eBusiness. Edited by Paul Russell Smith and Dave Chaffey. Oxford: Butterworth Heinemann. 360p, ISBN 0-7506-6359-6. [Google Scholar]
  65. Strauss, William, and Neil Howe. 1991. Generations: The History of America’s Future, 1584 to 2069. New York: William Morrow & Company. [Google Scholar]
  66. Subramani, Jambulingam. 2013. Generalized Modified Ratio Estimator for Estimation of Finite Population Mean. Journal of Modern Applied Statistical Methods 12: 121–55. [Google Scholar] [CrossRef] [Green Version]
  67. Szajna, Bernadette. 1996. Empirical Evaluation of the Revised Technology Acceptance Model. Management Science 42: 85–92. [Google Scholar] [CrossRef]
  68. Tan, Khong Sin, Siong-Choy Chong, and Binshan Lin. 2013. Intention to use internet marketing. Kybernetes 42: 888–905. [Google Scholar] [CrossRef] [Green Version]
  69. Taylor, Shirley, and Peter A. Todd. 1995. Understanding Information Technology Usage: A Test of Competing Models. Information Systems Research 6: 144–76. [Google Scholar] [CrossRef]
  70. Teo, Aik-Chuan, Garry Wei-Han Tan, Keng-Boon Ooi, Teck-Soon Hew, and King-Tak Yew Industrial Management & Data Systems. 2015. The effects of convenience and speed in m-payment. Industrial Management & Data Systems 115: 311–31. [Google Scholar]
  71. Thong, James Y. L., Se-Joon Hong, and Kar Yan Tam. 2006. The effects of post-adoption beliefs on the expectation-confirmation model for information technology continuance. International Journal of Human-Computer Studies 64: 799–810. [Google Scholar] [CrossRef]
  72. Van der Heijden, Hans. 2004. User Acceptance of Hedonic Information Systems. Mis Quarterly 28: 695. [Google Scholar] [CrossRef]
  73. Vejlgaard, Henrik. 2008. Anatomy of a Trend. New Epilogue A Continuing Story: The Future of Trends. New York: Mc Gill, pp. 193–202. [Google Scholar]
  74. Venkatesh, Viswanath, and Fred D. Davis. 2000. A Theoretical Extension of the Technology Acceptance Model: Four Longitudinal Field Studies. Management Science 46: 186–204. [Google Scholar] [CrossRef] [Green Version]
  75. Venkatesh, Viswanath, James Y. L. Thong, and Xin Xu. 2012. Consumer Acceptance and Use of Information Technology: Extending the Unified Theory of acceptance and use technology. MIS Quarterly 36: 157–58. [Google Scholar] [CrossRef] [Green Version]
  76. Venkatesh, Viswanath, Michael G. Morris, Gordon B. Davis, and Fred D. Davis. 2003. User Acceptance of Information Technology: Toward a Unified View. Mis Quarterly 27: 425. [Google Scholar] [CrossRef] [Green Version]
  77. Wilson, Claire, Tommy van Steen, Christabel Akinyode, Zara P. Brodie, and Graham G. Scott. 2021. To sext or not to sext. The role of social-cognitive processes in the decision to engage in sexting. Journal of Social and Personal Relationships 38: 1410–29. [Google Scholar] [CrossRef]
  78. WIPO, Cornell University, and INSEAD. 2015. The Global Innovation Index 2015: Effective Innovation Policies for Development. Geneva: WIPO. ISBN 978-2-9522210-8-5. [Google Scholar]
  79. Yang, Kiseol. 2010. Determinants of US consumer mobile shopping services adoption: Implications for designing mobile shopping services. Journal of Consumer Marketing 27: 262–70. [Google Scholar] [CrossRef]
  80. Zeithaml, Valarie A. 1988. Consumer Perceptions of Price, Quality, and Value: A Means-End Model and Synthesis of Evidence. Journal of Marketing 52: 2–22. [Google Scholar] [CrossRef]
  81. Zhang, Yali, Jun Sun, Zhaojun Yang, and Ying Wang. 2018. What Makes People Actually Embrace or Shun Mobile Payment: A Cross-Culture Study. Mobile Information Systems 2018: 7497545. [Google Scholar] [CrossRef]
  82. Ziółkowska, Marta Joanna. 2021. Digital Transformation and Marketing Activities in Small and Medium-Sized Enterprises. Sustainability 13: 2512. [Google Scholar] [CrossRef]
Figure 1. Theoretical framework.
Admsci 13 00151 g001
Figure 2. UTAUT model.
Admsci 13 00151 g002
Figure 3. Reasoned action Theory.
Admsci 13 00151 g003
Figure 4. Lebanese model.
Admsci 13 00151 g004
Figure 5. Italian model.
Admsci 13 00151 g005
Figure 6. Adapted Research Model.
Admsci 13 00151 g006
Table 1. Composite Reliability.
Composite Reliability
BEHAVIORAL INTENTION1.000000
EXPERIENCE AND HABITS0.682669
HEDONIC MOTIVATION0.748427
PRICE VALUE0.729484
EFFICIENCY0.685648
SOCIAL INFLUENCE0.770605
SUBJECTIVE NORMS1.000000
USE BEHAVIOR1.000000
Table 2. Convergent Validity.
Ave
BEHAVIORAL INTENTION1.000000
EXPERIENCE AND HABITS0.521620
HEDONIC MOTIVATION0.610173
PRICE VALUE0.581528
EFFICIENCY0.534883
SOCIAL INFLUENCE0.630848
SUBJECTIVE NORMS1.000000
USE BEHAVIOR1.000000
Table 3. Outer Loadings (T-Values).
T Statistics (|O/STERR|)
BEHAVIORAL INTENTION → USE BEHAVIOR4.217571
EFFICIENCY → BEHAVIORAL INTENTION1.874286
EFFICIENCY → USE BEHAVIOR2.276872
EXPERIENCE AND HABITS → BEHAVIORAL INTENTION2.747246
EXPERIENCE AND HABITS → USE BEHAVIOR2.093095
HEDONIC MOTIVATION → BEHAVIORAL INTENTION2.251012
HEDONIC MOTIVATION → USE BEHAVIOR1.742972
PRICE VALUE → BEHAVIORAL INTENTION1.686350
PRICE VALUE → USE BEHAVIOR1.568898
SOCIAL INFLUENCE → BEHAVIORAL INTENTION2.131464
SOCIAL INFLUENCE → USE BEHAVIOR1.807811
SUBJECTIVE NORMS → BEHAVIORAL INTENTION2.806635
SUBJECTIVE NORMS → USE BEHAVIOR2.260985
Table 6. Outer Loadings (T-Values).
T Statistics (|O/STERR|)
BEHAVIORAL INTENTION → USE BEHAVIOR2.139213
EFFICIENCY → BEHAVIORAL INTENTION6.055562
EFFICIENCY → USE BEHAVIOR4.512236
FACILITATING CONDITIONS → BEHAVIORAL INTENTION2.026173
FACILITATING CONDITIONS → USE BEHAVIOR1.393921
HEDONIC MOTIVATION → BEHAVIORAL INTENTION3.789128
HEDONIC MOTIVATION → USE BEHAVIOR2.018545
SOCIAL INFLUENCE → BEHAVIORAL INTENTION4.231743
SOCIAL INFLUENCE → USE BEHAVIOR1.699863
Table 7. Hypothesis Results Summary.
Findings
Inner Model Path Coefficient > 0.1
Bootstrapping > |1.96|
Findings
Inner Model Path Coefficient > 0.1
Bootstrapping > |1.96|
Hypothesis/CountryLebanonItaly
H1. Hedonic motivation has a significant relationship with behavioral intention among Youth.Inner model path coefficient = 0.152
Bootstrapping = 2.251
Conclusion = Supported
Inner model path coefficient = 0.250
Bootstrapping = 3.789
Conclusion = Supported
H2. Behavioral intention among Youth has a significant relationship with use behaviorInner model path coefficient = 0.295
Bootstrapping = 4.217
Conclusion = Supported
Inner model path coefficient = 0.132
Bootstrapping = 2.139
Conclusion = Supported
H3. Social influence has significant relationship with behavioral intention among Youth.Inner model path coefficient = 0.124
Bootstrapping = 2.131
Conclusion = Supported
Inner model path coefficient = 0.267
Bootstrapping = 4.231
Conclusion = Supported
H4. Facilitating conditions have a significant relationship with behavioral intention among Youth. Partially supported.Inner model path coefficient = 0.038 < 0.1
Conclusion = Rejected
Inner model path coefficient = 0.129
Bootstrapping = 2.026
Conclusion = Supported
H5. Effort expectancy has a significant relationship with behavioral intention among Youth.Inner model path coefficient = 0.09 < 0.1
Conclusion = Rejected
Inner model path coefficient = −0.028 < 0.1
Conclusion = Rejected
H6. Price value has a significant relationship with behavioral intention among Youth.Inner model path coefficient = 0.112
Bootstrapping = 1.686
Conclusion = Rejected
Inner model path coefficient = 0.040 < 0.1
Conclusion = Rejected
H7. Subjective norms have a significant relationship with behavioral intention among Youth. Partially supported.Inner model path coefficient = 0.197
Bootstrapping = 2.806
Conclusion = Supported
Inner model path coefficient = 0.089 < 0.1
Conclusion = Rejected
H8. Experience and habit have a significant relationship with behavioral intention among Youth. Partially supported.Inner model path coefficient = 0.159
Bootstrapping = 2.747
Conclusion = Supported
Inner model path coefficient = 0.008 < 0.1
Conclusion = Rejected
H9. Efficiency has a significant relationship with behavioral intention among Youth. Partially supported.Inner model path coefficient = 0.132
Bootstrapping = 1.874
Conclusion = Rejected
Inner model path coefficient = 0.277
Bootstrapping = 6.055
Conclusion = Supported
H10. Efficiency has a significant relationship with use behavior among Youth.Inner model path coefficient = −0.130
Bootstrapping = 2.276
Conclusion = Supported
Inner model path coefficient = 0.255
Bootstrapping = 4.512
Conclusion = Supported
Disclaimer/Publisher’s Note: The statements, opinions and data contained in all publications are solely those of the individual author(s) and contributor(s) and not of MDPI and/or the editor(s). MDPI and/or the editor(s) disclaim responsibility for any injury to people or property resulting from any ideas, methods, instructions or products referred to in the content.

