Beyond Donations: Isomorphism and Revenue Mix in Nonprofit Start-Ups


School of Economic, Political, and Policy Sciences, University of Texas at Dallas, Richardson, TX 75080, USA
Adm. Sci. 2023, 13(3), 89; https://doi.org/10.3390/admsci13030089
Submission received: 1 October 2022
/
Revised: 3 March 2023
/
Accepted: 6 March 2023
/
Published: 16 March 2023
Abstract
:The literature on nonprofit growth contains a practical ambiguity regarding which types of revenues to cultivate as a start-up nonprofit. The revenue portfolio of a more established organization may be inappropriate (or unattainable) for a new one, but there may be perils in relying too long on sources of nonprofit start-up capital. We posit that nonprofit entrepreneurs choose to mimic larger organizations in their field for growth rather than rely on the revenue mix of their start-up stage. This study uses two different dynamic econometric models to estimate the role of revenue type and other organizational factors in the growth of young and small nonprofits. We find that mimicking the revenue habits of larger organizations is generally (but not universally) advisable, with most conclusions sensitive to subsector.
1. Introduction
Stinchcombe (1965) suggested that young organizations face high mortality rates due to their limited resources; this includes both a lack of internal business processes and access to external capital. Later studies provided empirical support and theoretical development for this “liability of newness”, including for organizations in the social economy (Bruderl and Schussler 1990; Cafferata et al. 2009; Chambré and Fatt 2002; Hager et al. 2004). The cure for such a liability was to establish specializations and best practices to give the start-up a competitive edge in extracting resources from its environment.
This advice leaves social entrepreneurs seeking revenue and impact growth with several questions, particularly if they have founded a nonprofit organization. In many countries, nonprofit organizations draw on several different types of revenue and support, such as individual donations, government contracts, and earned market revenues. Given this diversity, there is little tailored guidance from the academic community on which revenue source a nonprofit should concentrate on. There are potential perils that come with each revenue type (such as government revenue crowd-out of private donations), but the popular advice to diversify or become more socially enterprising is often handed out regardless of circumstance (Kerlin and Pollak 2011). The academic literature on theoretical developments, such as the benefits theory of nonprofit finance, continues to grow (Wilsker and Young 2010; Young 2017), but it has had negligible crossover impact in the practicing nonprofit sector.
This study argues that nonprofit researchers and entrepreneurs can find inspiration in the biological and organizational sciences. Young mammals learn which foods are appropriate to eat by watching the older members of their family group. This learning process includes not only the lesson of what is not poisonous, but also how to locate and acquire the resource. In organizational sciences, this process is known as mimetic institutional isomorphism (Aldrich and Baker 2001; Mizruchi and Fein 1999; Spence et al. 2011). Organizations adopt the revenue habits of larger and more established organizations, gain legitimacy, and may even slowly begin to transform into versions of their chosen target (Miller 2012). However, the theory oversimplifies the lived experience of changing revenue sources from one appropriate to start-ups to one suitable for mature organizations. Given the lack of study in this area, there is not even conclusive evidence in the academic literature that the portfolios between young nonprofits and more established nonprofits differ.
This study fills that gap by documenting and evaluating the revenue portfolios of start-up and more established U.S. nonprofit organizations in four very different subsectors (Arts, Higher Education, Hospitals, and Public). After evaluating whether the revenue portfolios differ between the two age groups, we use two different dynamic econometric models to estimate which revenue sources are the most predictive of growth. Finally, we deduce whether the biggest gains come from increased specialization in the dominant revenues from the start-up stage or from changing the resource mix to mimic the more established nonprofits in the sample. We also move the literature past the current preoccupation with revenue specialization versus diversification by offering insights on which revenue should be specialized in. This allows us to contribute to the same theoretical debate which plagues strategic entrepreneurship more broadly: how to balance current competitive advantages with the possibility of future economic performance (Ireland and Webb 2009; Ketchen et al. 2007).
The rest of the paper is organized as follows. We first discuss institutional isomorphism, then describe how the lens can be applied to nonprofit revenue portfolios. We then develop our hypotheses and describe the two econometric models. Next, we present the descriptive findings of the revenue portfolios which inform the study, then follow up with the results from the econometric models. We then discuss the implications and limitations, and finally we present the conclusions.
2. The Role of Institutional Isomorphism
Institutional isomorphism was pioneered by DiMaggio and Powell (1983) as a means to explain homogeneity in organizational forms. Not only do new organizations pattern themselves after existing exemplars, but the increasing domination of the organizational type leads to conformist pressures from the crowd in addition to mimicry of the exemplars (Meyer and Rowan 1977); the former is known as coercive isomorphism and the latter as mimetic isomorphism (Verbruggen et al. 2011). This logic has been applied to numerous sectors, including business (Honig and Karlsson 2004), government (Frumkin and Galaskiewicz 2004; Radaelli 2000), and nonprofits (Ashley and Van Slyke 2012; Lu 2015).
In the nonprofit context, institutional isomorphism is most often invoked as a contributing explanation for resource dependency. In the case of government revenues, the argument is often that attracting such revenues means that you should look and act as much like your funder as possible. Lu (2015) found that similar goals and levels of bureaucracy increase the likelihood of government funding, while Suárez (2011) found similar returns to government-like characteristics, such as professionalization. Guo (2007) made a similar argument in reference to other revenue sources, finding that boards legitimize themselves through the addition of representatives of possible funding sources.
However, there are several studies which used isomorphism to explain structural and process elements in nonprofits. Here, the isomorphic influence is more about emulating successful nonprofits than it is in looking like funders. Zorn et al. (2011) found that nonprofits adopted technology in a way that emulated other innovative nonprofits, while Verbruggen et al. (2011) found that nonprofits voluntarily comply with financial reporting standards as a way to emulate larger organizations and appear more legitimate. Hersberger-Langloh et al. (2021) disentangled multiple types of isomorphism in Swiss nonprofits while isolating isomorphic impacts on managerialism and mission drift; the results are nuanced, with different types of isomorphism contributing in complex ways. AbouAssi and Bies (2018) found similar complexity when applying different types of isomorphism to the development of NGO self-regulation in Lebanon. Similar to the study of government crowd-out, which seemed normatively simplistic in initial studies but grew more complex when contextual factors varied (Grasse et al. 2022), the nuance of more recent literature on isomorphism emphasizes both positive and negative elements with the practice.
3. Revenue Source and Nonprofit Growth
Large sections of the nonprofit revenue literature involve the relationships among revenue types; specifically, there is a great deal of analysis regarding whether the presence of government funding will “crowd out” other forms of revenue, especially private giving (Andreoni and Payne 2003; Brooks 2003; de Wit and Bekkers 2016; Owalla 2007; Seaman 1980; Tinkelman 2010; Zhao and Lu 2019). Another area of the literature addresses the role of revenue diversification, or whether nonprofits should concentrate on having income from a variety of sources or specialize in just one or two (Carroll and Stater 2009; Chang and Tuckman 1994; Chikoto and Neely 2013; Chikoto et al. 2016; Froelich 1999; Frumkin and Keating 2011; Hung and Hager 2019; von Schnurbein and Fritz 2017). This argument is particularly strong in the vulnerability literature, where diversification is considered to be a strategy to protect the nonprofit against the dangers of being too dependent on one type of revenue. Finally, the growing field of benefits theory explores the relationship between the type of revenue and the nature of the services provided by the nonprofit (Wilsker and Young 2010; Young et al. 2010; Young 2017); though this generally does not look at the relationship between revenue growth and income type per se, it does lay the groundwork for a functional relationship between revenue types and operations.
Despite the recent focus on the diversification of the revenue portfolio, there are studies which have taken the first steps in exploring the area of specific revenue types on firm growth more closely. Using total expenses as a measure of health, Galaskiewicz et al. (2006) found that nonprofits that relied more on donations performed better with larger numbers of social contacts, while nonprofits which relied on more market revenue performed better when they had fewer contacts. Pratt (2004) advocated that organizations may find themselves more suited to certain types of revenues, and thus, should concentrate on accommodating and managing the available options. Thornton and Lecy (2022) found that many of the adverse effects attributable to government funding are actually symptoms of grants, regardless of source; furthermore, the benefits from such awards outlast the award itself. Finally, in their study of 144 nonprofits larger than USD 150 million in total revenues, Foster and Fine (2007) determined that the largest source of funding was the government and that revenue concentration was beneficial. Notably lacking, however, are studies of revenue behaviors in young and small nonprofits. An exception is Searing (2021), which examined the recovery of small and young nonprofits from conditions of financial vulnerability. This study found that growth in financially distressed nonprofits benefitted more from revenue diversification than from concentration, which meant that their age, size, and financial condition had a stronger influence on successful growth strategy than the specialization found in studies involving larger nonprofits.
4. Hypotheses Development
Fusing the literatures of isomorphism and revenue growth together provides a useful theoretical framework on which to build hypotheses. The isomorphic expectation would be that entrepreneurs managing small and young nonprofits will strategically emulate the revenue portfolios of older and larger nonprofits, regardless of the revenue mix that worked for them at start-up. This has an initial testable assumption:
Hypothesis 1 (H1):
Average revenue type is not consistent across time.
If revenue portfolios are consistent across an organization’s life span, then we do not have the opportunity to test any sort of divergence, whether that is due to isomorphism or another cause. There is a foundation in the business literature that certain types of capital are particularly beneficial to start-ups in comparison to later stages of firm development (Davila et al. 2003; Rosenbusch et al. 2013). Therefore, we would expect a similar evolution in nonprofit revenue portfolios. However, there is also literature suggesting that nonprofit revenue portfolios are stable across time (Teasdale et al. 2013), so testing this assumption is worthwhile.
Our research question is more directly addressed via two additional related hypotheses:
Hypothesis 2 (H2):
Increased specialization in the type of revenue which dominates the portfolio in larger and older nonprofits in the same subsector will increase growth.
This hypothesis (H2) supports the expectation from the literature that small start-ups will engage in mimetic isomorphism by emulating the revenue portfolios of their larger peer organizations. We would expect that, regardless of how diverse their portfolio was or what combination of revenue sources was keeping them afloat in their initial years, higher levels of growth will occur by dedicating more of the revenue portfolio to what is working for larger and older organizations in the same subsector. Ergo, rather than developing improved practices for their initial preferred type of revenue, growth occurs when this focus changes to mimic more established organizations.
Hypothesis 3 (H3):
Increased specialization in the type of revenue which dominates the portfolio as a small and young organization will decrease growth.
This hypothesis (H3) rejects the neoclassical expectation that an organization will enter the market to take advantage of a particular resource in an organizational niche and then grow by developing more effective and efficient ways of exploiting that particular resource. Instead, we predict that continued or increasing reliance on the initial dominant revenue source will impede growth.
5. Data and Measurement
5.1. Data
This study uses the “Digitized Data” made available by The National Center on Charitable Statistics (NCCS) (National Center for Charitable Statistics 2014). This dataset contains the administrative filings of the U.S. Form 990 for all public charities between 1998 and 2003 who earned more than USD 25,000 in total revenues.1 In addition to containing very detailed financial information compared to similar nonprofit datasets, the information in the “Digitized Data” has been verified by the NCCS. Although there are longer panels currently available from the NCCS and U.S. Internal Revenue Service (IRS) sources, none have been vetted for quality and completeness in the way that the Digitized Data has been. Therefore, we continue to consider the Digitized Data as the “gold standard” for studies which require detailed nonprofit revenue work.
We choose four nonprofit subsectors with revenue portfolios traditionally distinct from one another: Arts, Higher Education, Hospitals, and Public. Since this study focuses on the tension between initial revenue specialization and isomorphic pressures toward the revenue portfolios of larger organizations, the sample for the econometric analysis utilizes only new and young nonprofits. These are public charities that are less than 10 years old and have, during at least one fiscal year in the six years of the sample, earned less than USD 150,000 in total revenues. The data cleaning follows Calabrese (2012), including the removal of the 990-EZ filers and organizations not following accrual accounting. Although we recognize that this may remove the smallest of the nonprofits, such exclusion is necessary to examine the detailed revenue questions in the study. The final sample contains 15,190 observations representing 5171 nonprofits across the four subsectors.
5.2. Variable Definition
5.2.1. Dependent Variable
This study utilizes total annual expenses as the best measure of size for several reasons. First, the literature posits that service provision maximization is the focus of the objective function for the nonprofit executive director (Ansari et al. 1996; Weinberg 1978). Although service provision maximization is not universally accepted, other objectives (such as modified profit maximization, quantity/quality trade-offs, mixed motives, etc.) can be reasonably approximated by program expenditure growth (Steinberg 1986). Second, the choice to use total expenses instead of only programmatic expenditures stems from the notorious tendency for nonprofits to understate overhead and fundraising expenses, whether accidentally or as a way of potentially increasing their attractiveness to donors (Lecy and Searing 2015; Wing and Hager 2004). Therefore, it is more reliable to use the total expense figure. Third, even though employment is a common metric for size in studies targeting the entire sector, it is not as appropriate for the small and young nonprofit analysis, since many in this sample will have very few or no employees.
5.2.2. Independent Variables
Revenue Type. Using the granularity in the revenue information available in the Digitized Data, we separate the revenue streams into seven different types. Private donations from individuals (PrivGiving) are a traditional source of support for the nonprofit sector. Dues are paid by individuals who belong to a certain club, group, or status level within the organization; this distinction is what differentiates dues from donations. Indirect support (Indirect) concerns donations from other nonprofit organizations, such as foundations. Program service revenues from government sources (GovtPSR) are based on market exchange and are often for individual services, but the payer is the government; this is often the case for health and human services benefits such as Medicaid. Program service revenues from nongovernment sources (PrivPSR) are also based on market exchange, but the payer is a nongovernment entity, such as a person buying an opera ticket or paying tuition to a private school. Government grants (GovtGrant) are funds from the government which are not contractual in nature, and non-mission income is market exchange income which is used to cross-subsidize mission activities (such as selling themed t-shirts). Each revenue is then divided by the nonprofit’s total annual revenues, which produces that revenue type’s relative percentage of the revenue portfolio. Since some nonoperating revenue possibilities (such as investment revenue) are outside the scope of this study, they are excluded from the analysis. Therefore, the total revenue used to form the denominator for the ratios is calculated only from the sum of the seven included revenue types.
Unrelated Business Taxable Income. Research has shown that nonprofit organizations are cautious concerning income-generating activities that do not involve their core mission. Such activities are only undertaken to cross-subsidize activities closer to their exempt purpose (James 1983). The rules regarding participation in these types of activities are strict, and earning too much unrelated business taxable income (UBTI) could result in the loss of tax-exempt status (Kosaras 2000). Because of this complexity and monitoring, we expect that the presence of UBTI signals a greater level of financial sophistication and capability that is not necessarily correlated with the non-mission income revenue type.
Fixed Costs. Fixed costs represent a chain of financial obligations that extends into the future, and such risks are often only undertaken with the possibility of greater revenue potential. Therefore, we expect higher levels of growth from those nonprofits with a larger percentage of their costs attributable to fixed costs. There are a few possible mechanisms through which this may happen. First, the obligations themselves will boost total expenses, which is how this study operationalizes growth; however, there is also a possibility that planning for debt repayment will suppress other spending rather than buoy the total expense amount. Second, investment in fixed assets now or the recent past may enable future expansion and growth. One of the growth concerns of small nonprofits is in accessing financing to make capital investments; once this has been acquired (as shown by a spike in fixed costs), then growth may soon follow.
Unrestricted Net Assets. Similar logic influences the predicted impact of greater accumulation of unrestricted net assets (UNA). Net assets roughly correlate to a for-profit company’s accumulated profit: they are the amount of assets left over once all the liabilities have been paid. These net assets are then categorized according to how they can be used, with unrestricted net assets as discretionary funds. Calabrese (2012) found that nonprofit directors prefer to increase net assets to both serve as a hedge against risk and as a sign of financial health. Intuitively, we would expect a sign of greater health to be associated with greater growth.
Age. Although the age range is limited to organizations that have had tax-exempt status for less than ten years, this span still allows potential elements of age dependency. For example, the internal processes of a one-year-old nonprofit and a six-year-old nonprofit can be very different. Therefore, we expect to find evidence of age dependence, which reflects the literature on the liability of newness. Age is operationalized through the reported ruling date of the nonprofit’s tax-exempt status.
5.2.3. Control Variables
The subsector in which a nonprofit operates has a great deal of influence on the organization’s fixed costs and revenue structure; accordingly, most studies which utilize comparative financials or demise figures differentiate between subsectors. Following the logic of Calabrese (2012), we run separate sets of regressions for each subsector to allow unique dynamics in each subsector to emerge. Additionally, since growth is highly state-dependent, we utilize lags of the dependent variable. The models also include time dummies to help address correlation, as is often recommended for panel and dynamic panel models using difference- or system-GMM (Bluedorn 2009).
6. Methods
Modeling the growth process in a nonprofit organization requires careful attention to potential causes of bias and misspecification, such as autocorrelation, endogeneity, and simultaneity (Coad 2007; Lööf 2008; Oliveira and Fortunato 2006). As Okten and Weisbrod (2000) noted in their analysis of the donation level-fundraising expense relationship, the fixed effects model may not address all of the endogeneity. Even with a lag, it is not unreasonable to assert that the previous year’s income was at least partially determined by expected expenses for the following year. This would call for a more complex instrument than simply a lag, even with the de-meaned process in the fixed effects estimation. In addition, introducing a lagged dependent variable in a fixed-effects regression amplifies the potential for “Nickell bias”, especially in “large N, short t” data (Arellano 1993; Nickell 1981).
6.1. Model 1: Dynamic Model by Revenue Type and Subsector
Since the available data panel has many observations over a short period of time, the models utilize the instrumental variables (IV) estimator of Arellano and Bover (1995) and Blundell and Bond (1998), also known as the system generalized method of moments (GMM) estimator (Bluedorn 2009). This requires assumptions guaranteeing that not only are the past levels (where t ≥ 2) of total expenditures acceptable instruments for the current first difference, but also that the lagged differences are valid instruments for the lagged level (Bluedorn 2009):
And:
In addition to being considered more precise than the differences GMM of the original Arellano-Bond (Hayakawa 2009), time-invariant regressors can be included, since the model uses the level values in addition to lags; this is especially important since previous nonprofit literature has shown the importance of traits such as sector or year to financial structure.
In these models, all independent variables plus the lagged dependent variable are considered endogenous and are instrumented using two-step GMM.2 The year in which the nonprofit gained tax exemption status and all dummies for year are considered exogenous with the current year’s spending. All instrumented variables use the second lag and prior, while the covariance matrix is set to match that of Ox (Roodman 2009). Despite the panel being short, all monetary variables not included in a ratio reflect an adjustment for inflation with a base year of 2003; additionally, all monetary amounts not included in a ratio have been logged.3
The first model Is specified as:
where are the organizational fixed effects, are the year effects, and is the error term. Time-invariant characteristics, such as the year that tax exemption was granted, can be included, since they are used in the “levels” equation of the system estimator.
6.2. Model 2: Dynamic Full Portfolio by Subsector
The second model estimates the impact of revenue types on growth for the small and young nonprofits in each subsector using a single dynamic model and the percentages of total revenues for each revenue type. This allows us to weigh the gains in revenues against each other.
The inclusion of the revenue ratios means that all revenue coefficients are interpretable relative to the base category, which is private giving here.
7. Descriptive Findings: Revenue Portfolio Changes
The first step in the empirical analysis is to map the average revenue portfolio for each subsector for two different groups: the organizations that are young and small (and thus, the target of the research question) and the ones that are not. The latter group is used to form an expectation for what the nonprofits in the study would conform to out of isomorphic pressure, regardless of the start-up revenue specializations. We do this for four subsectors: arts, higher education, hospitals, and public nonprofits. These subsectors were chosen because of the broad range of revenue portfolios that are reflected in addition to simply being the best model fits. The subsector was chosen based on the NTEE code reported in the data, and revenue percentages were based on the reported totals for each revenue type. Summary statistics and average revenue portfolios are presented in table format in Appendix A.
7.1. Arts
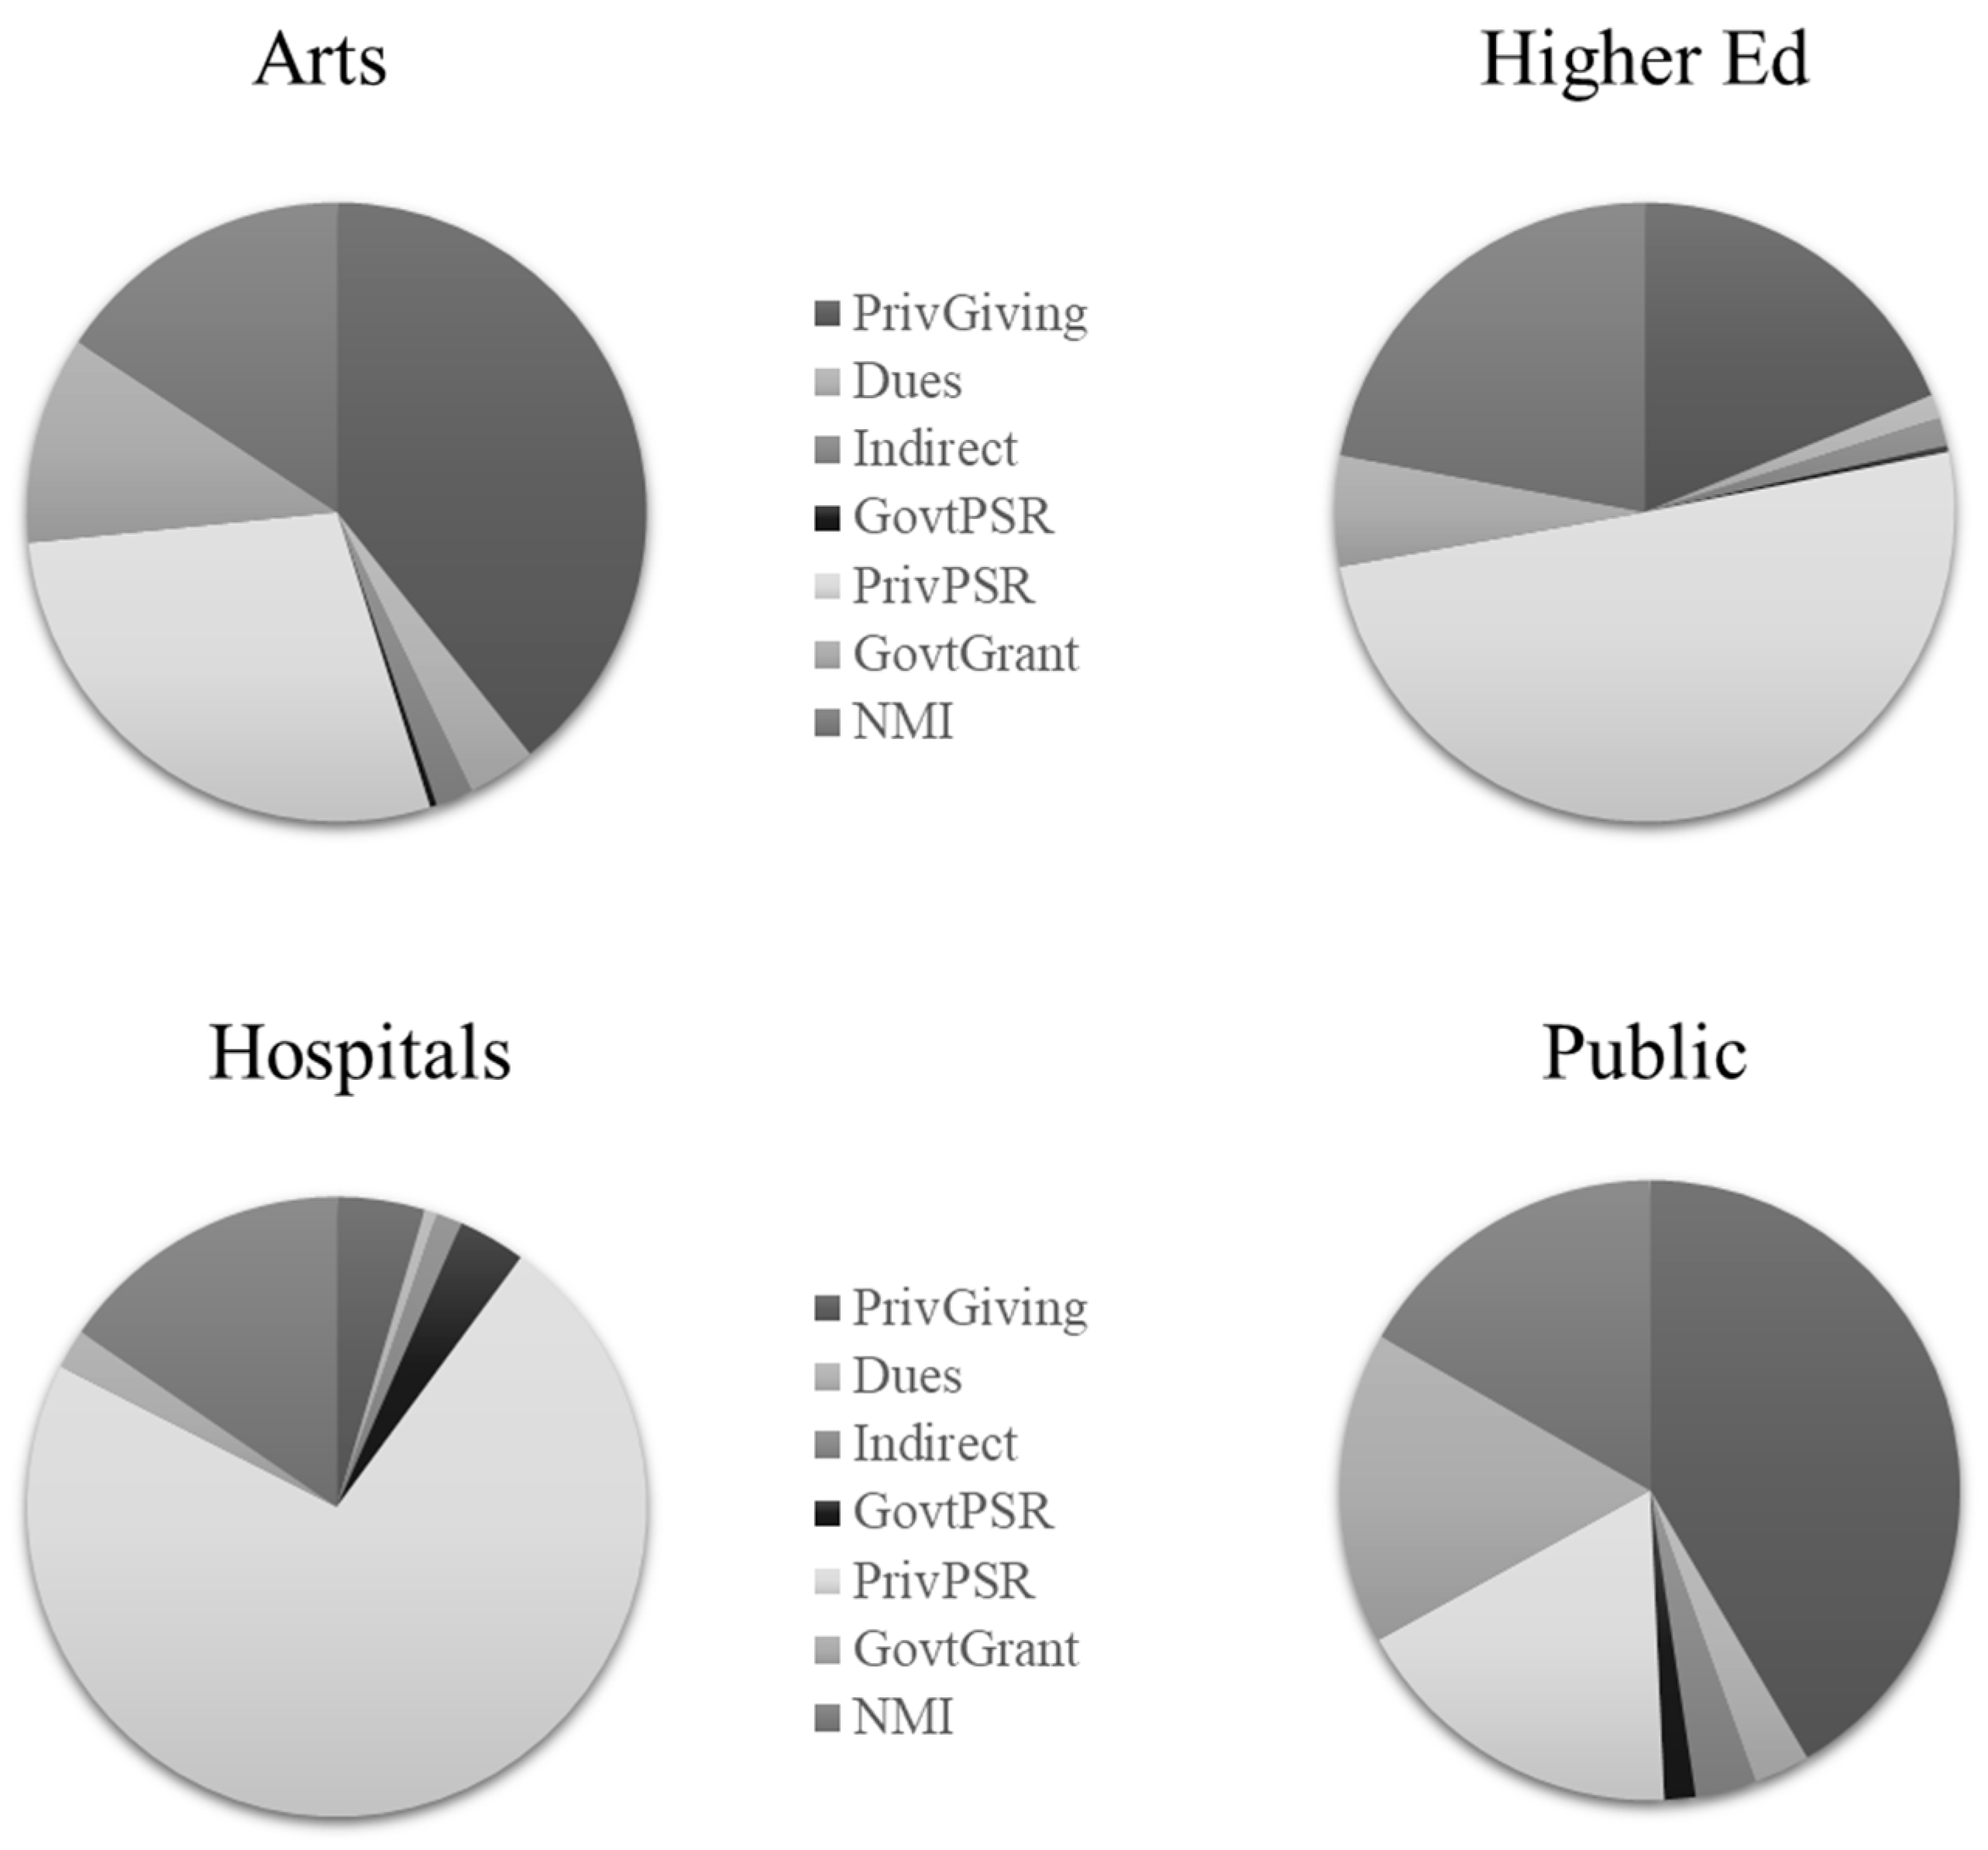
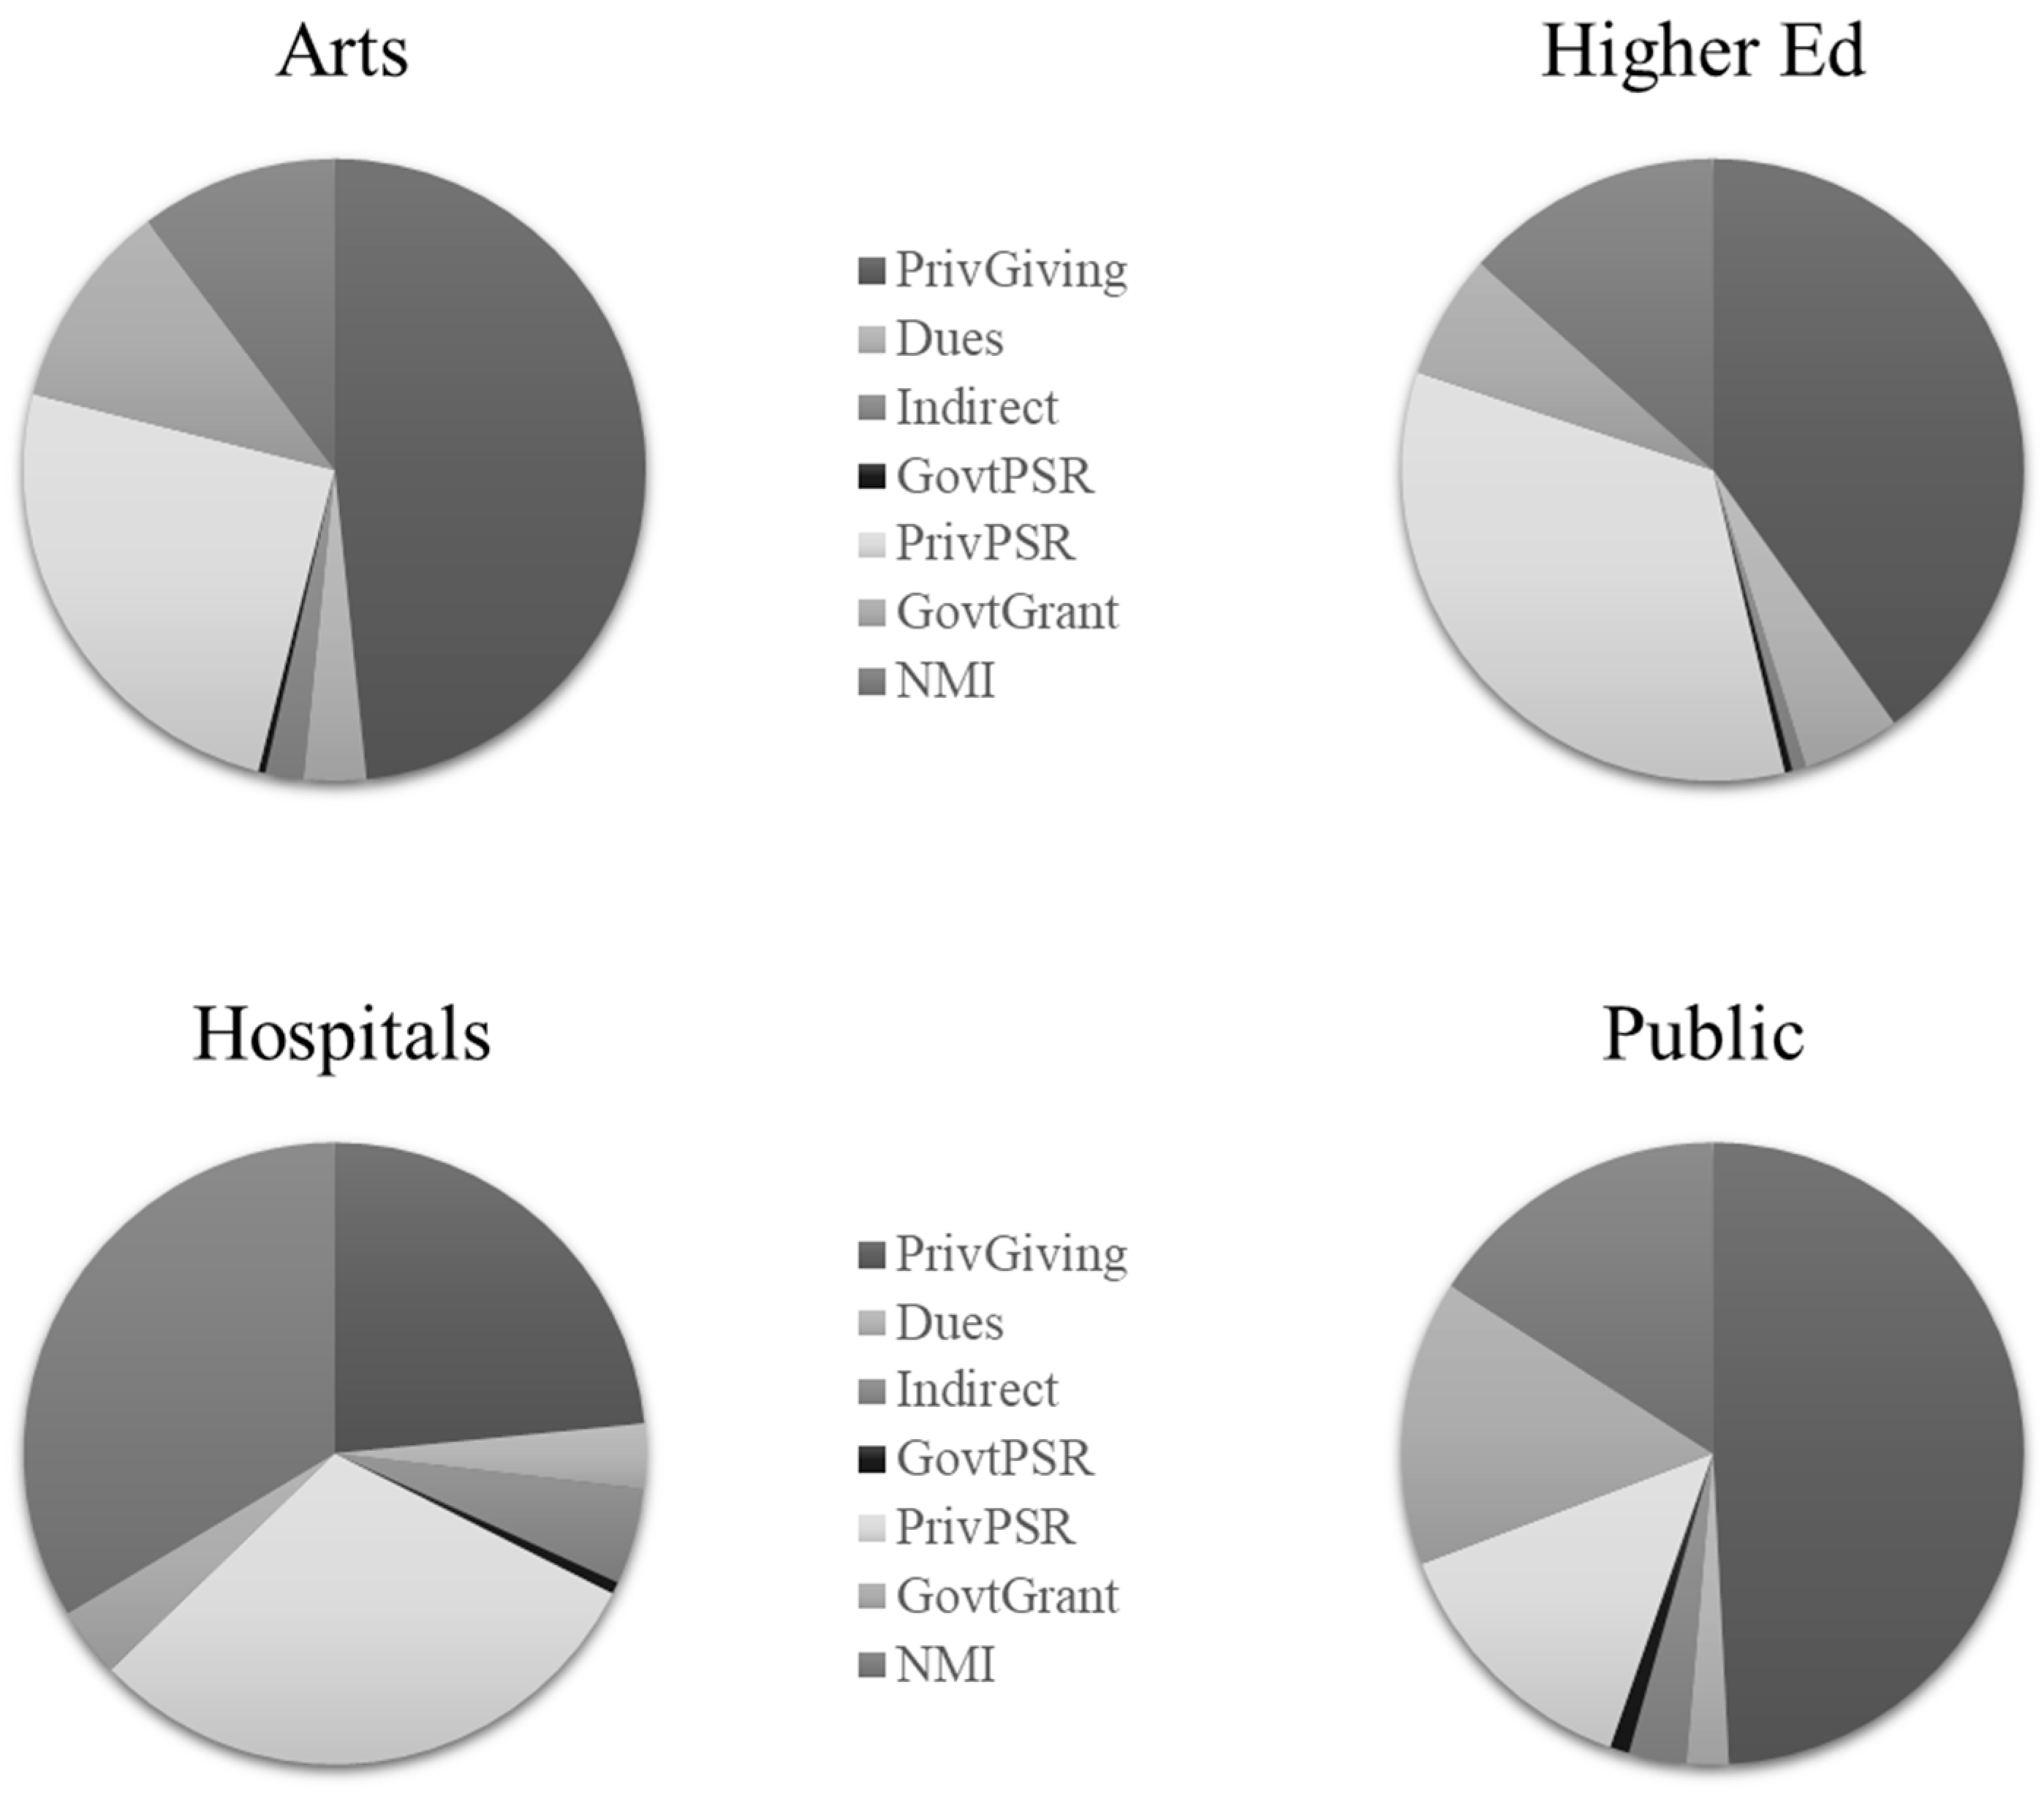
As seen in Figure 1 and Figure 2, private giving plays a large role in the portfolios of both large and small nonprofits. Almost half of the portfolio for small and young nonprofits comes from private giving, with another quarter from private program service revenues. Government grants and non-mission income each have approximately 10% of the remaining revenue streams. For the large nonprofits, the order of importance stays the same, but the relative shares shift. Private giving holds only 40% of the portfolio, while private PSR holds almost 30%. Non-mission income holds almost 5 percentage points more of the revenue portfolio than government grants do, with the latter holding steady at about 10%.
Given this finding, fitting our isomorphic hypotheses to expectations requires nuance. We predict that increases in private giving should still be impactful (though minimally, since it loses a relative share of the portfolio), but increases in the three minor fringe revenues would be detrimental.
7.2. Higher Education
The initial portfolio of the Higher Education subsector is dominated by private giving (40%) followed by private program services revenues (34%). Non-mission income provides an additional 13% of the portfolio; after that is government grants, dues, and other types. This stands in contrast to the revenue portfolios of larger nonprofits in higher education, which are sustained primarily by private program service revenues. Private giving loses more than half of its portfolio share, while non-mission income, private PSR, and indirect support (which are likely supporting organizations such as alumni clubs) all gain.
Therefore, we predict growth in private giving to be penalized, while gains in private PSR, non-mission income, and indirect support will have a positive role in growth.
7.3. Hospitals
Small and young nonprofits in the Hospital subsector have their initial revenue portfolios almost equally split between three sources: non-mission income (33%), private program service revenues (30%), and private giving (23%). The other four sources form a fringe of marginal revenue support. This shifts drastically, however, when the nonprofits are no longer small and young. Private programs service revenues clearly dominate with 72% of the revenue portfolio, which is more than three times any other revenue type. Non-mission income has lost half of its portfolio share, while the all the other revenue types combined contribute less than 12%.
Therefore, we would expect relative gains by private programs service revenue to be rewarded, while gains in non-mission income are penalized.
7.4. Public
The small and young nonprofits in the study for the Public subsector have similar portfolio behaviors to the Arts subsector, though with even more consistency across time. Private giving provides almost half of the small and young revenue portfolio, but it drops to approximately 42% for large public nonprofits. However, the relative importance of non-mission income (16%), government grants (15%), and private PSR (14%) in small organizations do not shift much as the organizations become larger. Private PSR gains a small edge (18%), but non-mission income (17%) and government grants (16%) stay relatively constant.
Therefore, we would expect that there would be minimal returns on an increase in private giving, since its proportional share of the portfolio decreases, but that increases in the stronger fringe revenues would be beneficial.
8. Growth Model Results
The second and third steps in the empirical analysis are the dynamic analyses of the revenues by subsector. First, we estimate the impact of increasing revenue specialization singly for each revenue; then, we estimate the entire portfolio to ascertain dynamics between revenue sources. Using these results, we test our hypotheses of whether either emulation of the revenue management of larger nonprofits or adherence to the mix of initial revenue types are better paths to growth. Results from the revenue-specific estimations are shown in four panels in Table 1, while the estimation containing the full portfolio model is reported in Table 2. Results are reported using Windmeijer-corrected cluster-robust errors.
8.1. Arts
The impact of revenue momentum in the Arts subsector is notable, with the lagged dependent variable being significant and relatively sizable across both specifications. As seen in Table 1, coefficients range between 0.30 and 0.34 in the revenue-specific model. Younger organizations have an advantage, though very slight. There is also a consistent penalty for an increase in unrestricted net assets if revenues are held constant, indicating that spending rather than saving is rewarded. The Arts subsector is the only one where this preference is seen.
The only notable revenue impacts are penalties to both non-mission income and dues, with the impact of the latter being twice the former in the revenue-specific model. In the portfolio model, increases in either relative to private giving negatively impact growth, but the penalty for non-mission income is greater. This is perplexing, since we would have expected a positive coefficient on NMI, since it makes relative gains in the portfolio. Dues behave as predicted, but NMI does not.
8.2. Higher Education
We find stronger support for isomorphic pressures in the Higher Education subsector than we did in Arts. As expected, gains in private giving are heavily penalized, while gains in indirect support have a positive impact on overall growth. Less conclusive is the positive effect of government grants, which lose less than a percentage point in portfolio share from small to large but are still beneficial to growth. Due to the small relative loss, we suspect that this is still an absolute gain in revenue and may serve as signaling more than an actual revenue increase. Unfortunately, the portfolio estimation is less helpful in the case of higher education, since the strongest result is for private giving, which is the control group in the specification.
The portfolio model does display some of the interesting findings from the other variables. First, higher education is the only subsector where the size of previous year is of dubious value to growth in future years: it is not significant in the portfolio model and has only scattered significance in the revenue-specific models. An increase in Unrelated Business Taxable Income is also scattered but retains its impact in the portfolio model. We also see approximately the same advantage for younger organizations that we did in the Arts sector.
8.3. Hospitals
As seen in Table 1 and Table 2, we find the strongest support for isomorphic revenue mimicry in the Hospital subsector. As expected, gains in private PSR are especially beneficial to growth, while there is a heavy penalty for relative increases in non-mission income in the revenue-specific model. Although the NMI penalty disappears in the full portfolio estimation, this is likely due to the use of the comparison group of private giving, which also loses a significant portfolio share from small to large nonprofits. The positive impact of increases in private PSR persist in the portfolio estimation.
Although the effect of previous size is not universally impactful in the revenue-specific models, it has significant importance in the full portfolio model. This means that the previous year’s size is a strong predictor of the current year size. Younger nonprofits have a slight edge in both estimations, and 2001 also seems to have been a particularly difficult year in the revenue-specific models, though this effect disappears in the full portfolio model.
8.4. Public
We also find mixed support for the hypotheses in the Public subsector. In the revenue-specific models, there are advantages to both indirect and government grants. These are both expected since they gain in relative proportion between the small and large samples. Similar to Higher Education, the importance of indirect support likely signals the appearance of a supporting organization and the credibility that comes with it; similar legitimacy logic can also be extended to the importance of government grants. However, the penalty on non-mission income is not expected since it also gains in relative share of the revenue portfolio, though the effect disappears in the full portfolio model. The benefit of an increase in government revenues is the only revenue benefit which persists in the portfolio model.
The lagged size is universally significant, though the impact is smaller than most other subsectors. Unrelated business taxable income also is beneficial in the individual private giving and program service revenue models. Youth is slightly beneficial to growth across all Public estimations, but a substantial penalty for increasing fixed costs appears only in the portfolio model.
9. Discussion
The introduction of subsectors in financial analysis marked a crucial turning point in nonprofit financial management, and this study provides further support to that. Each hypothesis has varying levels of support across the subsector of the nonprofit, so this should give scholars, researchers, or anyone else looking for “sector-wide” best practices pause. In order to clarify expectations that vary according to subsector, please see Table 3.
We find mixed support for our first hypothesis, which predicts that the average dominant revenue type in a nonprofit’s income portfolio will not remain consistent across time. Higher education provides the most dramatic support, with small and young nonprofits subsisting primarily on private giving and the more established nonprofits relying on private program service revenues, likely in the form of tuition and fees. We also find support for the first hypothesis in the Hospital subsector, with not only a change in the dominant revenue, but one where the dominant revenue for more established nonprofits more than doubles its share of the revenue portfolio. The Arts and Public subsectors offer very little support, with gains in the percentage of the portfolio attributable to the dominant income, but the same income remaining dominant for both the established and less established samples.
For the two subsectors where the dominant revenue type shifted, and thus, clearly met the initial condition of supporting Hypothesis 1, we find support for our Hypothesis 3, which predicts a growth penalty for gains in the revenue type that dominates the small and new portfolio. For Hospitals, non-mission income leads to a significant growth penalty, and we see a similar penalty for private giving in the Higher Education Sector. We do not find support for Hypothesis 2 in Higher Education: there appears to be no special benefits to boosting private program service revenues. However, there is strong support in the Hospital subsector, with private program service revenues showing a boost to growth in both the individual revenue and portfolio models.
The mixed support for the initial condition hypothesis mediates our interpretation of the implications for our second and third hypothesis in the Arts and Public subsectors. Both subsectors offer insights on revenues which can boost growth, but these insights are for revenue types which play middling roles in the composition of the revenue portfolio at either stage of organizational life. Instead, the most impactful insights for these subsectors involve other aspects of financial management: an apparent penalty for accumulated savings in the Arts subsector and inhibited growth based on fixed costs in the Public subsector.
Limitations
There are limitations to this study. First, there are concerns regarding the representativeness of the sample, since the Form 990 databases do not comprehensively cover those organizations whose revenues may fall below the mandatory filing line. These concerns can be addressed by either relaxing the standards of data quality, changing the model to include less granular information, or the assembly of a unique dataset, preferably one that began with a specific sector focus. Another important limitation is that we are only able to evaluate organizations that are still functioning. If the returns to a certain revenue are bimodal (meaning that nonprofits either grow strongly or die off), this study will not illustrate the potential hazard. There are also limitations to the models. Simple interpretation of variables that are not the lagged dependent variable in a dynamic model is not straightforward, and further work regarding the appropriateness of different modeling techniques for different data characteristics and research questions is warranted. We also echo Hambrick and Mason (1984) in the assumption that strategic decisions by the upper echelon of the entrepreneurial team will strongly influence the enterprise’s resulting revenue portfolio. We also acknowledge that the democratization of data in the U.S. means that data are available for much more recent periods of time; however, the Digitized Data was vetted for quality and consistency. Researchers are still working with validation measures for contemporary Form 990 data that are publicly available directly from the IRS, and this study offers an opportunity for insight while we wait for the data efforts to come to fruition.
10. Recommendations to Researchers and Practitioners
There are several insights from this study that can inform practice and policy. The first is that advice, whether sought or given, should be specific not only to the social sector and tax-exempt status, but also to the subsector or activity. Revenue portfolios and financial mechanisms vary widely between or even within nonprofit subsectors, so sector-wide studies should be carefully approached to look for certain caveats or assumptions. Entrepreneurs should be mindful of what peer organizations are doing rather than finding exemplars in an unrelated field to emulate.
Second, these findings should caution policymakers against seeking sector-wide panaceas in pursuit of bolstering growth for small nonprofits. Sector-wide initiatives, such as broadening the personal tax exemption for donations, may be crucial to boosting some types of nonprofit activity, but such initiatives will have negligible impact on others that rely on other revenues. This study illustrates how different the best practices in achieving an ideal revenue mix can be, even among organizations delivering public and social goods.
Finally, we encourage further quantitative and qualitative studies designed to inform practice. Although this study’s contribution toward understanding revenue portfolio changes is useful, the process of how such revenue practices and specializations can be developed would be of even greater use. Initiatives to democratize information across sectors and across countries will allow researchers, practitioners, and policymakers to isolate the factors that are unique to the financial health of their targeted nonprofit population through comparative and more frequent analysis.
11. Conclusions
Despite the importance of young and small nonprofits to the sector, there has been limited study and practical advice targeted to this group. This study provides several initial steps in filling those gaps. First, this study has provided additional confirmation that the financial characteristics of different ages, sizes, and subsectors of nonprofits are very unique (Calabrese 2012). Simply including these elements as control variables do not adequately explain the differences between financial structures. Second, there also needs to be further research on the causal mechanisms underlying financial decisions. As suggested in the Results section, this study suggests that an increase in indirect support is very beneficial to growth for Higher Education, but we do not know if this is because an alumni club has started giving or because an alumni club communicates to the rest of the organizational ecosystem that the nonprofit has earned legitimacy and begun to overcome the liability of newness. High-quality experimental and qualitative work can fill in the gaps of understanding following econometric results. Finally, we do find limited support that growth-minded nonprofit entrepreneurs will shift away from the revenue mixes which successfully brought them into existence. Most of these start-up portfolios are dominated by private donations, but this appears inappropriate for larger or older organizations, especially in the case of Hospitals and Higher Education. Furthermore, there are penalties associated in some instances with increased savings or non-mission income; these are suggestive of resistance to accumulated surpluses and mission drift that are found elsewhere in the literature (Calabrese 2013; Lecy and Searing 2015). Thus, while we do not find conclusive evidence of revenue isomorphism in all cases, we find enough evidence in support that this study’s contribution is a useful step forward in understanding revenue portfolio composition and growth.
Funding
This research received no external funding.
Institutional Review Board Statement
This project was deemed exempt from Institutional Review due to the data being publicly available, on the organization level, and resulting in analysis reported only in the aggregate.
Data Availability Statement
The data presented in this study are openly available from the National Center on Charitable Statistics. The current version is available at https://nccs-data.urban.org/data.php?ds=digitizeddata (accessed on 2 March 2023).
Acknowledgments
The author would like to acknowledge the helpful comments of Thad Calabrese, Jesse Lecy, Greg Lewis, Bruce Seaman, Dennis Young, Edward F. Searing, and the journal editors and reviewers.
Conflicts of Interest
The author declares no conflict of interest for this study.
Appendix A

Table A1.
Summary statistics.
| Arts | Higher Ed | Hospitals | Public | Full Sample | |
|---|---|---|---|---|---|
| PrivGiving | 0.48 | 0.40 | 0.23 | 0.49 | 0.48 |
| Dues | 0.03 | 0.05 | 0.03 | 0.02 | 0.03 |
| Indirect | 0.02 | 0.01 | 0.05 | 0.03 | 0.03 |
| GovtPSR | 0.00 | 0.00 | 0.01 | 0.01 | 0.01 |
| PrivPSR | 0.25 | 0.34 | 0.30 | 0.14 | 0.19 |
| GovtGrant | 0.11 | 0.06 | 0.04 | 0.15 | 0.13 |
| NMI | 0.10 | 0.13 | 0.33 | 0.16 | 0.14 |
| TotalExpenses | 11.54 | 11.65 | 12.13 | 11.54 | 11.56 |
| UBTI | 0.04 | 0.02 | 0.04 | 0.02 | 0.03 |
| FixedCost | 0.10 | 0.09 | 0.09 | 0.07 | 0.08 |
| UNA | 6.81 | 7.85 | 8.69 | 7.82 | 7.49 |
| RuleDate | 1995 | 1994 | 1993 | 1995 | 1995 |
| FY1998 | 0.11 | 0.14 | 0.15 | 0.12 | 0.12 |
| FY1999 | 0.14 | 0.18 | 0.16 | 0.14 | 0.14 |
| FY2000 | 0.16 | 0.16 | 0.17 | 0.17 | 0.17 |
| FY2001 | 0.19 | 0.16 | 0.18 | 0.19 | 0.18 |
| FY2002 | 0.19 | 0.16 | 0.17 | 0.19 | 0.19 |
| FY2003 | 0.21 | 0.19 | 0.17 | 0.19 | 0.20 |
| N | 8151 | 294 | 768 | 13,834 | 23,047 |
Note. TotalExpenses and UNA have natural log transformations. Revenue Types and FixedCost are ratios. UBTI is a binary indicator of the presence of UBTI above the Form 990 reporting threshold. Summary statistic sample size is higher than the regression analysis sample size due to observations utilized for lags. N is number of observations.
Table A2.
Average revenue portfolio composition.
| Revenue Types | Small and Young Nonprofits (Sample) | Older and Established Nonprofits | |
|---|---|---|---|
| ARTS | PrivGiving | 0.48 | 0.39 |
| Dues | 0.03 | 0.04 | |
| Indirect | 0.02 | 0.02 | |
| GovtPSR | 0.00 | 0.00 | |
| PrivPSR | 0.25 | 0.28 | |
| GovtGrant | 0.11 | 0.11 | |
| NMI | 0.10 | 0.16 | |
| HIGHER ED | PrivGiving | 0.40 | 0.19 |
| Dues | 0.05 | 0.01 | |
| Indirect | 0.01 | 0.01 | |
| GovtPSR | 0.00 | 0.00 | |
| PrivPSR | 0.34 | 0.50 | |
| GovtGrant | 0.06 | 0.06 | |
| NMI | 0.13 | 0.22 | |
| HOSPITALS | PrivGiving | 0.23 | 0.05 |
| Dues | 0.03 | 0.01 | |
| Indirect | 0.05 | 0.01 | |
| GovtPSR | 0.01 | 0.04 | |
| PrivPSR | 0.30 | 0.72 | |
| GovtGrant | 0.04 | 0.02 | |
| NMI | 0.33 | 0.15 | |
| PUBLIC | PrivGiving | 0.49 | 0.42 |
| Dues | 0.02 | 0.03 | |
| Indirect | 0.03 | 0.03 | |
| GovtPSR | 0.01 | 0.02 | |
| PrivPSR | 0.14 | 0.18 | |
| GovtGrant | 0.15 | 0.16 | |
| NMI | 0.16 | 0.17 |
| 1 | Organizations earning more than USD 25,000 were required to file, though many that were smaller filed anyway. |
| 2 | |
| 3 | Since the constant has no real empirical meaning, it has been suppressed in the system GMM analysis. |
References
- AbouAssi, Khaldoun, and Angela Bies. 2018. Relationships and resources: The isomorphism of nonprofit organizations’(NPO) self-regulation. Public Management Review 20: 1581–601. [Google Scholar] [CrossRef]
- Aldrich, Howard E., and Ted Baker. 2001. Learning and Legitimacy. In The Entrepreneurship Dynamic: Origins of Entrepreneurship and the Evolution of Industries. Edited by Claudia Bird Schoonhoven and Elaine Romanelli. Stanford: Stanford University Press, pp. 207–35. [Google Scholar]
- Andreoni, James, and A. Abigail Payne. 2003. Do Government Grants to Private Charities Crowd out Giving or Fund-Raising? The American Economic Review 93: 792–812. [Google Scholar] [CrossRef] [Green Version]
- Ansari, Asim, S. Siddarth, and Charles B. Weinberg. 1996. Pricing a bundle of products or services: The case of nonprofits. Journal of Marketing Research 33: 86–93. [Google Scholar] [CrossRef]
- Arellano, Manuel. 1993. On the testing of correlated effects with panel data. Journal of Econometrics 59: 87–97. [Google Scholar] [CrossRef]
- Arellano, Manuel, and Olympia Bover. 1995. Another look at the instrumental variable estimation of error-components models. Journal of Econometrics 68: 29–51. [Google Scholar] [CrossRef] [Green Version]
- Ashley, Shena R., and David M. Van Slyke. 2012. The Influence of Administrative Cost Ratios on State Government Grant Allocations to Nonprofits. Public Administration Review 72: 47–56. [Google Scholar] [CrossRef]
- Bluedorn, John C. 2009. Classic Dynamic Panel Models//Difference and System GMM Estimators. In Economics 6003: Quantitative Economics Lecture Notes. Available online: http://static1.1.sqspcdn.com/static/f/432578/5235575/1262580566863/soton_pg_ec6003_2008-2009s2-lecture07.pdf (accessed on 10 March 2015).
- Blundell, Richard, and Stephen Bond. 1998. Initial conditions and moment restrictions in dynamic panel data models. Journal of Econometrics 87: 115–43. [Google Scholar] [CrossRef] [Green Version]
- Brooks, Arthur C. 2003. Do Government Subsidies To Nonprofits Crowd Out Donations or Donors? Public Finance Review 31: 166–79. [Google Scholar] [CrossRef]
- Bruderl, Josef, and Rudolf Schussler. 1990. Organizational mortality: The liabilities of newness and adolescence. Administrative Science Quarterly 35: 530–47. [Google Scholar] [CrossRef]
- Cafferata, Roberto, Gianpaolo Abatecola, and Sara Poggesi. 2009. Revisiting Stinchcombe’s’ liability of newness’: A systematic literature review. International Journal of Globalisation and Small Business 3: 374–92. [Google Scholar] [CrossRef]
- Calabrese, Thad D. 2012. The Accumulation of Nonprofit Profits: A Dynamic Analysis. Nonprofit and Voluntary Sector Quarterly 41: 300–24. [Google Scholar] [CrossRef]
- Calabrese, Thad D. 2013. Running on empty: The operating reserves of US nonprofit organizations. Nonprofit Management and Leadership 23: 281–302. [Google Scholar] [CrossRef]
- Carroll, Deborah A., and Keely Jones Stater. 2009. Revenue Diversification in nonprofit organizations: Does it lead to financial stability? Journal of Public Administration Research and Theory 19: 947–66. [Google Scholar] [CrossRef]
- Chambré, Susan M., and Naomi Fatt. 2002. Beyond the liability of newness: Nonprofit organizations in an emerging policy domain. Nonprofit and Voluntary Sector Quarterly 31: 502–24. [Google Scholar] [CrossRef] [Green Version]
- Chang, Cyril.F., and Howard P. Tuckman. 1994. Revenue diversification among non-profits. Voluntas: International Journal of Voluntary and Nonprofit Organizations 5: 273–90. [Google Scholar] [CrossRef]
- Chikoto, Grace L., and Daniel Gordon Neely. 2013. Building Nonprofit Financial Capacity: The Impact of Revenue Concentration and Overhead Costs. Nonprofit and Voluntary Sector Quarterly 43: 570–88. [Google Scholar] [CrossRef]
- Chikoto, Grace L., Qianhua Ling, and Daniel Gordon Neely. 2016. The adoption and use of the Hirschman–Herfindahl Index in nonprofit research: Does revenue diversification measurement matter? Voluntas: International Journal of Voluntary and Nonprofit Organizations 27: 1425–47. [Google Scholar] [CrossRef]
- Coad, Alex. 2007. Testing the principle of ‘growth of the fitter’: The relationship between profits and firm growth. Structural Change and Economic Dynamics 18: 370–86. [Google Scholar] [CrossRef]
- Davila, Antonio, George Foster, and Mahendra Gupta. 2003. Venture capital financing and the growth of startup firms. Journal of Business Venturing 18: 689–708. [Google Scholar] [CrossRef]
- de Wit, Arjen, and René Bekkers. 2016. Government support and charitable donations: A meta-analysis of the crowding-out hypothesis. Journal of Public Administration Research and Theory 27: 301–19. [Google Scholar] [CrossRef] [Green Version]
- DiMaggio, Paul J., and Walter W. Powell. 1983. The iron cage revisited: Institutional isomorphism and collective rationality in organizational fields. American Sociological Review 48: 147–60. [Google Scholar] [CrossRef] [Green Version]
- Foster, William, and Gail Fine. 2007. How nonprofits get really big. Stanford Social Innovation Review 5: 46–55. [Google Scholar]
- Froelich, Karen A. 1999. Diversification of revenue strategies: Evolving resource dependence in nonprofit organizations. Nonprofit and Voluntary Sector Quarterly 28: 246–68. [Google Scholar] [CrossRef]
- Frumkin, Peter, and Elizabeth K. Keating. 2011. Diversification Reconsidered: The Risks and Rewards of Revenue Concentration. Journal of Social Entrepreneurship 2: 151–64. [Google Scholar] [CrossRef]
- Frumkin, Peter, and Joseph Galaskiewicz. 2004. Institutional isomorphism and public sector organizations. Journal of Public Administration Research and Theory 14: 283–307. [Google Scholar] [CrossRef] [Green Version]
- Galaskiewicz, Joseph, Wolfgang Bielefeld, and Myron Dowell. 2006. Networks and organizational growth: A study of community based nonprofits. Administrative Science Quarterly 51: 337–80. [Google Scholar] [CrossRef] [Green Version]
- Grasse, Nathan J., Elizabeth A. M. Searing, and Daniel G. Neely. 2022. Finding your crowd: The role of government level and charity type in revenue crowd-out. Journal of Public Administration Research and Theory 32: 200–16. [Google Scholar] [CrossRef]
- Guo, Chao. 2007. When government becomes the principal philanthropist: The effects of public funding on patterns of nonprofit governance. Public Administration Review 67: 458–73. [Google Scholar] [CrossRef]
- Hager, Mark A., Joseph Galaskiewicz, and Jeff A. Larson. 2004. Structural embeddedness and the liability of newness among nonprofit organizations. Public Management Review 6: 159–88. [Google Scholar] [CrossRef]
- Hambrick, Donald C., and Phyllis A Mason. 1984. Upper echelons: The organization as a reflection of its top managers. Academy of Management Review 9: 193–206. [Google Scholar] [CrossRef]
- Hayakawa, Kazuhiko. 2009. First difference or forward orthogonal deviations-which transformation should be used in dynamic panel data models?: A simulation study. Economics Bulletin 29: 2008–17. [Google Scholar]
- Hersberger-Langloh, Sophie E., Sara Stühlinger, and Georg von Schnurbein. 2021. Institutional isomorphism and nonprofit managerialism: For better or worse? Nonprofit Management and Leadership 31: 461–80. [Google Scholar] [CrossRef]
- Honig, Benson, and Tomas Karlsson. 2004. Institutional forces and the written business plan. Journal of Management 30: 29–48. [Google Scholar] [CrossRef]
- Hung, ChiaKo, and Mark A. Hager. 2019. The impact of revenue diversification on nonprofit financial health: A meta-analysis. Nonprofit and Voluntary Sector Quarterly 48: 5–27. [Google Scholar] [CrossRef]
- Ireland, R. Duane, and Justin W. Webb. 2009. Crossing the great divide of strategic entrepreneurship: Transitioning between exploration and exploitation. Business Horizons 52: 469–79. [Google Scholar] [CrossRef]
- James, Estelle. 1983. How nonprofits grow: A model. Journal of Policy Analysis and Management 2: 350–65. [Google Scholar] [CrossRef]
- Kerlin, Janelle A., and Tom H. Pollak. 2011. Nonprofit Commercial Revenue: A Replacement for Declining Government Grants and Private Contributions? The American Review of Public Administration 41: 686–704. [Google Scholar] [CrossRef]
- Ketchen, David J., Jr., R. Duane Ireland, and Charles C. Snow. 2007. Strategic entrepreneurship, collaborative innovation, and wealth creation. Strategic Entrepreneurship Journal 1: 371–85. [Google Scholar] [CrossRef] [Green Version]
- Kosaras, Andras. 2000. Federal income and state property tax exemption of commercialized nonprofits: Should profit-seeking art museums be tax exempt. New England Law Review 35: 115. [Google Scholar]
- Lecy, Jesse D., and Elizabeth A. M. Searing. 2015. Anatomy of the Nonprofit Starvation Cycle: An Analysis of Falling Overhead Ratios in the Nonprofit Sector. Nonprofit & Voluntary Sector Quarterly 44: 539–63. [Google Scholar] [CrossRef]
- Lööf, Hans. 2008. The Dynamics of Firm Growth: A Re-Examination. Stockholm: The Royal Institute of Technology Centre of Excellence for Science and Innovation Studies (CESIS). [Google Scholar]
- Lu, Jiahuan. 2015. Which Nonprofit Gets More Government Funding? Nonprofit Management & Leadership 25: 297–312. [Google Scholar] [CrossRef]
- Meyer, John W., and Brian Rowan. 1977. Institutionalized organizations: Formal structure as myth and ceremony. American Journal of Sociology 83: 340–63. [Google Scholar] [CrossRef] [Green Version]
- Miller, Justin I. 2012. The mortality problem of learning and mimetic practice in emerging industries: Dying to be legitimate. Strategic Entrepreneurship Journal 6: 59–88. [Google Scholar] [CrossRef]
- Mizruchi, Mark S., and Lisa C. Fein. 1999. The social construction of organizational knowledge: A study of the uses of coercive, mimetic, and normative isomorphism. Administrative Science Quarterly 44: 653–83. [Google Scholar] [CrossRef]
- National Center for Charitable Statistics. 2014. The National Center on Charitable Statistics (NCCS)–GuideStar National Nonprofit Research Database. Digitized Data Files 1998–2003. Available online: http://nccs-data.urban.org (accessed on 2 March 2023).
- Nickell, Stephen. 1981. Biases in dynamic models with fixed effects. Econometrica: Journal of the Econometric Society 26: 1417–26. [Google Scholar] [CrossRef]
- Okten, Cagla, and Burton A. Weisbrod. 2000. Determinants of donations in private nonprofit markets. Journal of Public Economics 75: 255–72. [Google Scholar] [CrossRef]
- Oliveira, Blandina, and Adelino Fortunato. 2006. Firm growth and liquidity constraints: A dynamic analysis. Small Business Economics 27: 139–56. [Google Scholar] [CrossRef] [Green Version]
- Owalla, King Odhiambo. 2007. Government Grants, Crowding Out Theory, and American Based International Non-Governmental Organizations. Ph.D. thesis, Georgia State University, Atlanta, GA, USA. [Google Scholar]
- Pratt, Jon. 2004. Analyzing the Dynamics of Funding: Reliability and Autonomy. The Nonprofit Quarterly. June 21. Available online: https://nonprofitquarterly.org/analyzing-the-dynamics-of-funding-reliability-and-autonomy/ (accessed on 2 March 2023).
- Radaelli, Claudio M. 2000. Policy transfer in the European Union: Institutional isomorphism as a source of legitimacy. Governance 13: 25–43. [Google Scholar] [CrossRef] [Green Version]
- Roodman, David. 2009. How to do xtabond2: An introduction to difference and system GMM in Stata. Stata Journal 9: 86. [Google Scholar] [CrossRef] [Green Version]
- Roodman, David. 2020. xtabond2: Stata Module to Extend Xtabond Dynamic Panel Data Estimator. Statistical Software Components from Boston College Department of Economics. Available online: https://econpapers.repec.org/RePEc:boc:bocode:s435901 (accessed on 2 March 2023).
- Rosenbusch, Nina, Jan Brinckmann, and Verena Müller. 2013. Does acquiring venture capital pay off for the funded firms? A meta-analysis on the relationship between venture capital investment and funded firm financial performance. Journal of Business Venturing 28: 335–53. [Google Scholar] [CrossRef]
- Seaman, Bruce A. 1980. Economic Models and Support for the Arts. In Economic Policy for the Arts. Edited by William S. Hendon, James L. Shanahan and Alice J. MacDonald. Cambridge: Abt Books. [Google Scholar]
- Searing, Elizabeth A. M. 2021. Resilience in Vulnerable Small and New Social Enterprises. Sustainability 13: 13546. [Google Scholar] [CrossRef]
- Spence, Martine, Jouhaina Ben Boubaker Gherib, and Viviane Ondoua Biwolé. 2011. Sustainable entrepreneurship: Is entrepreneurial will enough? A north–south comparison. Journal of Business Ethics 99: 335–67. [Google Scholar] [CrossRef]
- Steinberg, Richard. 1986. The Revealed Objective Functions of Nonprofit Firms. The RAND Journal of Economics 17: 508–26. [Google Scholar] [CrossRef]
- Stinchcombe, Arthur L. 1965. Social Structure and Organization. In Handbook of Organizations. Edited by James G. March. Chicago: Rand McNally, pp. 142–93. [Google Scholar]
- Suárez, David F. 2011. Collaboration and Professionalization: The Contours of Public Sector Funding for Nonprofit Organizations. Journal of Public Administration Research and Theory 21: 307–26. [Google Scholar] [CrossRef]
- Teasdale, Simon, Janelle Kerlin, Dennis Young, and Jung-In Soh. 2013. Oil and Water Rarely Mix: Exploring the Relative Stability of Nonprofit Revenue Mixes Over Time. Journal of Social Entrepreneurship 4: 69–87. [Google Scholar] [CrossRef]
- Thornton, Jeremy, and Jesse Lecy. 2022. Net impact of government funding on nonprofit fiscal health: Burden or benefit? Nonprofit Management and Leadership 33: 561–84. [Google Scholar] [CrossRef]
- Tinkelman, Daniel. 2010. Revenue interactions: Crowding out, crowding in, or neither. In Handbook of Research on Nonprofit Economics and Management. Edited by Bruce Seaman and Dennis Young. Cheltenham: Edward Elgar Publishing, pp. 18–41. [Google Scholar]
- Verbruggen, Sandra, Johan Christiaens, and Koen Milis. 2011. Can resource dependence and coercive isomorphism explain nonprofit organizations’ compliance with reporting standards? Nonprofit and Voluntary Sector Quarterly 40: 5–32. [Google Scholar] [CrossRef] [Green Version]
- von Schnurbein, Georg, and Tizian M. Fritz. 2017. Benefits and drivers of nonprofit revenue concentration. Nonprofit and Voluntary Sector Quarterly 46: 922–43. [Google Scholar] [CrossRef] [Green Version]
- Weinberg, Charles B. 1978. Marketing Mix Decision Rules for Nonprofit Organizations. Stanford: Graduate School of Business, Stanford University. [Google Scholar]
- Wilsker, Amanda L, and Dennis R Young. 2010. How does program composition affect the revenues of nonprofit organizations?: Investigating a benefits theory of nonprofit finance. Public Finance Review 38: 193–216. [Google Scholar] [CrossRef]
- Wing, Kennard, and Mark A. Hager. 2004. Getting What We Pay For: Low Overhead Limits Nonprofit Effectiveness. Available online: https://webarchive.urban.org/publications/311044.html (accessed on 3 March 2014).
- Young, Dennis R. 2017. Financing Nonprofits and Other Social Enterprises: A Benefits Approach. Cheltenham: Edward Elgar Publishing. [Google Scholar]
- Young, Dennis R., Amanda L. Wilsker, and Mary Clark Grinsfelder. 2010. Understanding the determinants of nonprofit income portfolios. Voluntary Sector Review 1: 161–73. [Google Scholar] [CrossRef]
- Zhao, Jianzhi, and Jiahuan Lu. 2019. The crowding-out effect within government funding: Implications for within-source diversification. Nonprofit Management and Leadership 29: 611–22. [Google Scholar] [CrossRef]
- Zorn, Theodore E, Andrew J. Flanagin, and Mirit Devorah Shoham. 2011. Institutional and noninstitutional influences on information and communication technology adoption and use among nonprofit organizations. Human Communication Research 37: 1–33. [Google Scholar] [CrossRef]
Figure 1.
Average revenue portfolios for larger and older nonprofits. Revenue percentages are in means.
Figure 1.
Average revenue portfolios for larger and older nonprofits. Revenue percentages are in means.

Figure 2.
Average revenue portfolios for smaller and younger nonprofits. Revenue percentages are in means.
Figure 2.
Average revenue portfolios for smaller and younger nonprofits. Revenue percentages are in means.

Table 1.
Impact of revenue type on growth, dynamic analysis by revenue type.
| (1) | (2) | (3) | (4) | (5) | (6) | (7) | |
|---|---|---|---|---|---|---|---|
| Priv Giving | Dues | Indirect | G&M PSR | Priv PSR | Gov Grant | NMI | |
| ARTS N = 5228; NFP = 1842 | |||||||
| Size (lag) | 0.3003 *** | 0.3205 *** | 0.3120 *** | 0.3179 *** | 0.3185 *** | 0.3278 *** | 0.3448 *** |
| (0.065) | (0.060) | (0.067) | (0.071) | (0.063) | (0.067) | (0.068) | |
| Revenue Type % | −0.0893 | −1.1770 *** | 0.6542 | −0.1411 | 0.0258 | 0.3796 | −0.6878 * |
| (0.236) | (0.415) | (0.648) | (0.465) | (0.262) | (0.335) | (0.355) | |
| UBTI | 0.2262 | 0.3569 * | 0.2265 | 0.2346 | 0.2291 | 0.1806 | 0.2101 |
| (0.190) | (0.197) | (0.206) | (0.212) | (0.195) | (0.221) | (0.235) | |
| Fixed Cost % | 0.2935 | 0.0726 | −0.0223 | −0.0232 | 0.0232 | 0.2045 | 0.1006 |
| (0.436) | (0.431) | (0.438) | (0.460) | (0.441) | (0.433) | (0.436) | |
| UNA (log) | −0.0250 *** | −0.0258 *** | −0.0291 *** | −0.0196 *** | −0.0236 *** | −0.0258 *** | −0.0253 *** |
| (0.007) | (0.007) | (0.008) | (0.007) | (0.008) | (0.008) | (0.008) | |
| Date of Exemption | 0.0042 *** | 0.0041 *** | 0.0042 *** | 0.0041 *** | 0.0041 *** | 0.0040 *** | 0.0040 *** |
| (0.000) | (0.000) | (0.000) | (0.000) | (0.000) | (0.000) | (0.000) | |
| FY2003 | −0.0477 | −0.0449 | −0.0454 | −0.0535 * | −0.0461 | −0.0513 | −0.0658 ** |
| (0.030) | (0.031) | (0.031) | (0.031) | (0.030) | (0.031) | (0.033) | |
| Hansen J | 62.04 | 52.84 | 60.72 | 57.80 | 55.36 | 54.24 | 54.13 |
| Hansen p-Value | 0.740 | 0.937 | 0.778 | 0.851 | 0.899 | 0.918 | 0.919 |
| AR(2) p-Value | 0.101 | 0.108 | 0.0971 | 0.103 | 0.0991 | 0.0994 | 0.0961 |
| HIGHER ED N = 196; NFP = 65 | |||||||
| Size (lag) | 0.3215 ** | 0.4751 ** | 0.3683 | 0.4564 ** | 0.4417 | 0.4144 * | 0.3430 * |
| (0.156) | (0.240) | (0.254) | (0.223) | (0.275) | (0.213) | (0.194) | |
| Revenue Type % | −1.3199 *** | −0.2323 | 2.6714 * | −5.2502 | −0.1088 | 1.2173 * | 0.2433 |
| (0.316) | (0.339) | (1.507) | (3.900) | (0.594) | (0.625) | (0.609) | |
| UBTI | 1.8792 | 2.2361 ** | 1.5847 ** | 1.6340 * | 1.5509 * | 2.2872 *** | 0.9466 |
| (1.155) | (0.917) | (0.797) | (0.892) | (0.795) | (0.544) | (0.998) | |
| Fixed Cost % | 0.3467 | 0.3872 | 0.5187 | −0.1676 | 0.6837 | 0.6335 | 1.3418 |
| (1.478) | (1.422) | (1.481) | (0.951) | (1.250) | (1.381) | (1.403) | |
| UNA (log) | −0.0045 | −0.0192 | −0.0095 | −0.0350 | −0.0284 | −0.0188 | −0.0458* |
| (0.021) | (0.026) | (0.025) | (0.024) | (0.023) | (0.032) | (0.027) | |
| Date of Exemption | 0.0042 *** | 0.0031 ** | 0.0037 ** | 0.0033 ** | 0.0034 ** | 0.0034 *** | 0.0039 *** |
| (0.001) | (0.001) | (0.001) | (0.001) | (0.002) | (0.001) | (0.001) | |
| Hansen J | 48.38 | 47.80 | 48.74 | 45.49 | 45.70 | 48.28 | 44.13 |
| Hansen p-Value | 0.755 | 0.774 | 0.641 | 0.759 | 0.835 | 0.759 | 0.874 |
| AR(2) p-Value | 0.969 | 0.932 | 0.940 | 0.905 | 0.978 | 0.968 | 0.922 |
| HOSPITALS N = 538; NFP = 160 | |||||||
| Size (lag) | 0.4526 *** | 0.4609 ** | 0.4881 ** | 0.5571 *** | 0.4031 * | 0.4670 ** | 0.3629 |
| (0.168) | (0.208) | (0.207) | (0.188) | (0.232) | (0.193) | (0.224) | |
| Revenue Type % | 0.2056 | 0.5799 | −1.7242 | 5.9511 | 2.2346 *** | −0.1660 | −1.5293 ** |
| (0.703) | (1.112) | (2.592) | (10.068) | (0.815) | (1.576) | (0.773) | |
| UBTI | 0.9065 | 1.1767 | 1.2707 | 1.2223 | −0.5695 | 1.0237 | 0.3944 |
| (1.175) | (1.302) | (0.956) | (1.418) | (1.005) | (1.289) | (1.068) | |
| Fixed Cost % | −1.8796 | −1.5027 | −0.7735 | −1.3149 | −2.1491 * | −1.6315 | −1.3321 |
| (1.400) | (1.201) | (1.194) | (1.692) | (1.118) | (1.337) | (1.259) | |
| UNA (log) | −0.0412 | −0.0433 | −0.0345 | −0.0147 | −0.0311 | −0.0389 | −0.0524 |
| (0.043) | (0.054) | (0.050) | (0.029) | (0.042) | (0.050) | (0.058) | |
| Date of Exemption | 0.0038 *** | 0.0037 *** | 0.0035 *** | 0.0030 *** | 0.0037 *** | 0.0037 *** | 0.0046 *** |
| (0.001) | (0.001) | (0.001) | (0.001) | (0.001) | (0.001) | (0.002) | |
| FY2001 | −0.4333 ** | −0.3746 | −0.3759 * | −0.4154 ** | −0.3337 ** | −0.3412 | −0.2951 * |
| (0.184) | (0.260) | (0.208) | (0.180) | (0.163) | (0.224) | (0.161) | |
| Hansen J | 63.21 | 70.62 | 69.25 | 63.97 | 69.14 | 65.98 | 72.10 |
| Hansen p-Value | 0.642 | 0.390 | 0.435 | 0.616 | 0.439 | 0.547 | 0.344 |
| AR(2) p-Value | 0.134 | 0.143 | 0.121 | 0.178 | 0.117 | 0.132 | 0.117 |
| PUBLIC N = 9228; NFP = 3104 | |||||||
| Size (lag) | 0.2795 *** | 0.3315 *** | 0.3482 *** | 0.3358 *** | 0.3532 *** | 0.3416 *** | 0.3332 *** |
| (0.059) | (0.053) | (0.048) | (0.051) | (0.053) | (0.050) | (0.059) | |
| Revenue Type % | 0.2108 | −1.1542 | 0.7827 ** | 0.1935 | 0.2098 | 0.5212 ** | −0.5775 ** |
| (0.262) | (1.020) | (0.384) | (0.218) | (0.180) | (0.210) | (0.293) | |
| UBTI | 0.8085 ** | 0.6736 | 0.6384 | 0.6782 * | 0.6807 * | 0.6217 | 0.6590 |
| (0.390) | (0.412) | (0.396) | (0.396) | (0.388) | (0.402) | (0.421) | |
| Fixed Cost % | −0.2729 | −0.2212 | −0.1497 | −0.3103 | −0.2584 | −0.2231 | −0.6183 |
| (0.420) | (0.359) | (0.353) | (0.315) | (0.349) | (0.358) | (0.459) | |
| UNA (log) | −0.0185 ** | −0.0099 | −0.0088 | −0.0122 | −0.0101 | −0.0115 | −0.0123 |
| (0.009) | (0.008) | (0.008) | (0.008) | (0.008) | (0.008) | (0.009) | |
| Date of Exemption | 0.0043 *** | 0.0040 *** | 0.0039 *** | 0.0040 *** | 0.0039 *** | 0.0039 *** | 0.0041 *** |
| (0.000) | (0.000) | (0.000) | (0.000) | (0.000) | (0.000) | (0.000) | |
| FY2003 | 0.0053 | −0.0151 | −0.0126 | −0.0183 | −0.0095 | −0.0200 | −0.0614 * |
| (0.034) | (0.033) | (0.033) | (0.033) | (0.032) | (0.032) | (0.035) | |
| Hansen J | 85.59 | 73.18 | 64.82 | 68.35 | 75.75 | 66.35 | 80.87 |
| Hansen p-Value | 0.0992 | 0.374 | 0.653 | 0.534 | 0.298 | 0.602 | 0.176 |
| AR(2) p-Value | 0.284 | 0.230 | 0.203 | 0.215 | 0.206 | 0.213 | 0.210 |
Note. N is number of observations; NFP is number of unique nonprofits. Only year dummies with at least one significant result across revenue types reported. Wald statistic p-values for all estimations are effectively zero. Robust errors in parentheses adjusted using Windmeijer’s finite-sample correction. *** p < 0.01, ** p < 0.05, * p < 0.1.
Table 2.
Impact of revenue type on growth, dynamic analysis of full portfolio.
| (1) | (2) | (3) | (4) | |
|---|---|---|---|---|
| Variables | Arts | Higher Ed | Hospitals | Public |
| Size (lag) | 0.3488 *** | 0.2224 | 0.4998 *** | 0.3360 *** |
| (0.070) | (0.195) | (0.175) | (0.052) | |
| % Dues | −1.0228 ** | 0.1991 | 0.0208 | −0.8787 |
| (0.407) | (0.590) | (0.788) | (0.785) | |
| % Indirect | 0.7545 | 2.8623 | −3.5265 | 0.5657 |
| (0.612) | (3.724) | (3.643) | (0.369) | |
| % G&M PSR | −0.3422 | 0.1521 | 7.2594 | 0.3205 |
| (0.481) | (1.164) | (8.182) | (0.287) | |
| % Private PSR | 0.0554 | 0.6450 | 1.3841 * | 0.2607 |
| (0.261) | (0.557) | (0.707) | (0.203) | |
| % Govt Grant | 0.0885 | 1.5250 | −0.2003 | 0.4129 * |
| (0.329) | (1.007) | (2.082) | (0.240) | |
| % NMI | −1.0958 *** | 0.6318 | 0.4872 | −0.2815 |
| (0.421) | (0.806) | (0.921) | (0.300) | |
| UBTI | 0.3262 | 1.8051 ** | 0.3066 | 0.6303 |
| (0.231) | (0.839) | (0.819) | (0.392) | |
| Fixed Cost Ratio | −0.0991 | −0.0916 | −0.5151 | −0.8538 ** |
| (0.382) | (1.568) | (1.767) | (0.356) | |
| UNA (lag) | −0.0224 *** | −0.0079 | −0.0012 | −0.0100 |
| (0.006) | (0.040) | (0.036) | (0.008) | |
| Date of Exemption | 0.0040 *** | 0.0043 *** | 0.0030 *** | 0.0040 *** |
| (0.000) | (0.001) | (0.001) | (0.000) | |
| FY2000 | 0.0230 | 0.2359 | −0.3334 | −0.0044 |
| (0.028) | (0.209) | (0.259) | (0.024) | |
| FY2001 | 0.0220 | 0.0292 | −0.3633 | −0.0136 |
| (0.028) | (0.238) | (0.253) | (0.027) | |
| FY2002 | −0.0087 | 0.0740 | −0.2601 | −0.0198 |
| (0.032) | (0.186) | (0.301) | (0.030) | |
| FY2003 | −0.0615 ** | 0.1486 | −0.2087 | −0.0452 |
| (0.031) | (0.174) | (0.277) | (0.032) | |
| Observations | 5228 | 196 | 538 | 9228 |
| Number of NFPs | 1842 | 65 | 160 | 3104 |
| Hansen J | 103.5 | 44.49 | 123.2 | 132.6 |
| Hansen p-Value | 0.980 | 1 | 0.717 | 0.543 |
| AR(2) p-Value | 0.102 | 0.675 | 0.120 | 0.202 |
Note. Wald statistic p-values for all estimations are effectively zero. Robust errors in parentheses adjusted using Windmeijer’s finite-sample correction. *** p < 0.01, ** p < 0.05, * p < 0.1.
Table 3.
Summary of hypotheses (Y = Yes, N = No).
| Arts | Higher Ed | Hospitals | Public | |||||
|---|---|---|---|---|---|---|---|---|
| Expected | Found | Expected | Found | Expected | Found | Expected | Found | |
| H1: Portfolio Changes | Y | N | Y | Y | Y | Y | Y | N |
| H2: Gains in Older/Larger Dominant Revenue Boosts Growth | + Private PSR | N | + Private PSR | Y Y | ||||
| H3: Gains in Younger/Smaller Dominant Revenue Hinders Growth | − NMI | Y | − Private Giving | Y | ||||
Disclaimer/Publisher’s Note: The statements, opinions and data contained in all publications are solely those of the individual author(s) and contributor(s) and not of MDPI and/or the editor(s). MDPI and/or the editor(s) disclaim responsibility for any injury to people or property resulting from any ideas, methods, instructions or products referred to in the content. |
© 2023 by the author. Licensee MDPI, Basel, Switzerland. This article is an open access article distributed under the terms and conditions of the Creative Commons Attribution (CC BY) license (https://creativecommons.org/licenses/by/4.0/).
Share and Cite
MDPI and ACS Style
Searing, E.A.M. Beyond Donations: Isomorphism and Revenue Mix in Nonprofit Start-Ups. Adm. Sci. 2023, 13, 89. https://doi.org/10.3390/admsci13030089
AMA Style
Searing EAM. Beyond Donations: Isomorphism and Revenue Mix in Nonprofit Start-Ups. Administrative Sciences. 2023; 13(3):89. https://doi.org/10.3390/admsci13030089
Chicago/Turabian StyleSearing, Elizabeth A. M. 2023. "Beyond Donations: Isomorphism and Revenue Mix in Nonprofit Start-Ups" Administrative Sciences 13, no. 3: 89. https://doi.org/10.3390/admsci13030089
Note that from the first issue of 2016, this journal uses article numbers instead of page numbers. See further details here.