The Relationship between Leadership in BPM and Company Profitability


Abstract
:1. Introduction
2. Theoretical Basis and Literature Review
2.1. The Interest Aspect of an Organisation and the Role of Leadership in BPM
2.2. Business Processes and the Risk-Adjusted Profitability Measures of Companies
2.2.1. Risk-Adjusted Equity Capital Profitability Measure Based on Residual Income
2.2.2. Risk-Adjusted Equity Capital Profitability Measure Based on ROE Adjusted for a Systematic Risk
3. Materials and Methods
3.1. Data Collecting Methodology
3.2. Financial Data of Companies
3.3. Data Analysis
4. Results
4.1. Population and Sample
4.2. Interest Aspects of Leadership Concerning Changes in Core Business Processes
4.3. Company Risk-Adjusted Performance Measures Estimation
4.3.1. Input Variables Estimation
4.3.2. Estimated Variables
4.3.3. Adjusted Profitability Measures Estimation
5. Conclusions
Author Contributions
Funding
Institutional Review Board Statement
Informed Consent Statement
Data Availability Statement
Conflicts of Interest
References
- Abdallah, Ayman Bahjat, Rasha Zuhair Alkhaldi, and Majed M. Aljuaid. 2021. Impact of social and technical lean management on operational performance in manufacturing SMEs: The roles of process and management innovations. Business Process Management Journal 27: 1418–44. [Google Scholar]
- Adamides, Emmanuel D. 2015. Linking operations strategy to the corporate strategy process: A practice perspective. Business Process Management Journal 31: 345–66. [Google Scholar]
- APQC. 2022. Process Classification Framework. Available online: www.apqc.org (accessed on 12 December 2022).
- Arshad, Noreen I., Rachelle Bosua, Simon Milton, A. Kamil Mahmood, A. Izuddin Zainal-Abidin, Mazeyanti M. Ariffin, and Nurshazlyn M. Aszemi. 2022. A sustainable enterprise content management technologies use framework supporting agile business processes. Knowledge Management Research & Practice 20: 123–40. [Google Scholar]
- Bai, Hang, Kewei Hou, Howard Kung, and Lu Zhang. 2022. The CAPM Strikes Back? An Investment Model with Disasters. Available online: http://www.nber.org/papers/w21016.pdf (accessed on 12 December 2022).
- Bloomberg. 2022. Financial Data. Available online: https://www.bloomberg.com/europe (accessed on 25 June 2022).
- Christensen, Peter O., Gerald A. Feltham, and Martin G. H. Wu. 2022. Cost of capital in residual income for performance evaluation. The Accounting Review 7: 1–23. [Google Scholar]
- Damodaran, Aswath. 2022. Damodaran Online. Available online: https://pages.stern.nyu.edu/~adamodar/New_Home_Page/data.html (accessed on 12 December 2022).
- De Waal, André A. 2008. The Secret of High-Performance Organizations. Management Online Review 2: 100–8. [Google Scholar]
- European Central Bank. 2022. Monetary policy/Strategy/Two percent inflation target. Available online: https://www.ecb.europa.eu/mopo/strategy/pricestab/html/index.en.html (accessed on 12 December 2022).
- Fred. 2022. Federal Reserve Bank of St. Louis. Economic Data. Available online: https://www.stlouisfed.org/ (accessed on 12 December 2022).
- Gošnik, Dušan, and Igor Stubelj. 2021. Business process management and risk-adjusted performance in SMEs. Kybernetes 51: 659–75. Available online: https://doi.org/10.1108/K-11-2020-0794 (accessed on 15 December 2022).
- Gošnik, Dušan, and Klemen Kavčič. 2021. Analysis of selected aspects of an organisation: The organisation as an instrument, an interest group and as a process. Managing Global Transitions: International Research Journal 19: 167–81. [Google Scholar] [CrossRef]
- Gošnik, Dušan. 2019. Core business process management and company performance. Management 14: 59–86, 89. [Google Scholar] [CrossRef]
- Gvin. 2022. Financial Data. Available online: https://accounts.bisnode.si/Home/?product=0&language=en-US (accessed on 12 December 2022).
- Halsey, Robert F. 2001. Using the Residual-Income Stock Price Valuation Model to Teach and Learn Ratio Analysis. Issues in Accounting Education 16: 257–72. [Google Scholar] [CrossRef] [Green Version]
- Hamada, Robert S. 1972. The Effect of the Firm’s Capital Structure on the Systematic Risk of Common Stocks. Journal of Finance 27: 435–52. [Google Scholar] [CrossRef]
- Hernández, Virginia, María Jesús Nieto, and Alicia Rodríguez. 2021. Product and Process Innovations and the Institutional Context of Transition Economies: The Effects of External Knowledge. In The Multiple Dimensions of Institutional Complexity in International Business Research (Progress in International Business Research). Edited by Alan Verbeke, Rob Van Tulder, Elizabeth L. Rose and Yingqi Wei. Bingley: Emerald Publishing Limited, vol. 15, pp. 155–70. [Google Scholar]
- Hung, Richard Yu-Yuan. 2006. Business process management as competitive advantage: A review and empirical study. Total Quality Management and Business Excellence 17: 21–40. [Google Scholar]
- Hutahayan, Benny. 2020. The mediating role of human capital and management accounting information system in the relationship between innovation strategy and internal process performance and the impact on corporate financial performance. Benchmarking: An International Journal 27: 1289–318. [Google Scholar]
- John Jeston, Johan Nelis. 2008. Management by Process a Roadmap to Sustainable Business Process Management. Burlington: Butterworth-Heinemann, pp. 1–10. [Google Scholar]
- Ljubljana Stock Exchange. 2022. Annual Reports. Available online: https://ljse.si/en/annual-reports/762 (accessed on 12 December 2022).
- Lyridis, Dimitrios V., Georgios O. Andreadis, Christos Papaleonidas, and Violetta Tsiampa. 2022. A BPM-based framework for the impact assessment of blockchain to the midstream LNG supply chain. Maritime Business Review 7: 49–69. [Google Scholar]
- Mamedova, Natalia, Mikhail Afanasev, Alexey Dyuzhov, Andrey Ivanov, and Antonina Kuzyakina. 2022. Optimal model of it directors’ interaction in the digital transformation of business processes. Technology Analysis & Strategic Management. Available online: https://www.tandfonline.com/doi/full/10.1080/09537325.2022.2090331 (accessed on 12 December 2022).
- Nodeson, Suresh, P. Beleya, G. Raman, and C. Ramendran. 2012. Leadership role in handling employee’s resistance: Implementation of innovation. Interdisciplinary Journal of Contemporary Research in Business 4: 466–77. [Google Scholar]
- Nogueira, Cintia Alves, Silvia Inês Dallavalle Pádua, and Ronaldo Bernardo. 2022. A map for the holistic BPM diagnosis. Business Process Management Journal 28: 630–55. [Google Scholar]
- Sahoo, Saumyaranjan. 2022. Process quality management and operational performance: Exploring the role of learning and development orientation. International Journal of Quality & Reliability Management 39: 1190–208. [Google Scholar]
- Seyffarth, Tobias, and Stephan Kuehnel. 2022. Maintaining business process compliance despite changes: A decision support approach based on process adaptations. Journal of Decision Systems 31: 305–35. [Google Scholar]
- Sharpe, William F. 1964. Capital Asset Prices: A Theory of Market Equilibrium under Conditions of Risk. The Journal of Finance 19: 425–42. [Google Scholar]
- Trkman, Peter, Willem Mertens, Stijn Viaene, and Paul Gemmel. 2015. From business process management to customer process management. Business Process Management Journal 21: 250–66. [Google Scholar]
- Usman, Indrianawati, Nira Hariyatie Hartani, and Mariusz Sroka. 2020. Operational performance of SME: The impact of entrepreneurial leadership, good governance and business process management. Polish Journal of Management Studies 21: 408–18. [Google Scholar] [CrossRef]


| Statement | Avg. (1–6) | St. Dev. | Skewness Koef. | Kurtosis Koef. |
|---|---|---|---|---|
| When changing the core business process, we regularly involve our employees. | 4.35 | 1.194 | −0.640 | 0.190 |
| When changing core business processes, we regularly involve our customers. | 3.69 | 1.210 | −0.076 | −0.468 |
| When changing core business processes, we regularly involve our suppliers. | 3.77 | 1.263 | −0.121 | −0.625 |
| The involvement of middle management is crucial for successfully implementing changes in core business processes. | 4.02 | 1.267 | −0.323 | −0.624 |
| Total | 3.96 |
| Kaiser–Meyer–Olkin test | 0.701 | |
| Bartlett test | Hi-square | 150.263 |
| Degree of freedom | 6 | |
| p-value | 0.000 | |
| Statements | When changing the core business process, we regularly involve our employees. | When changing core business processes, we regularly involve our customers. | When changing core business processes, we regularly involve our suppliers. | The involvement of middle management is crucial for successfully implementing changes in core business processes. |
| When changing the core business process, we regularly involve our employees. | 1.000 | |||
| When changing core business processes, we regularly involve our customers. | 0.444 | 1.000 | ||
| When changing core business processes, we regularly involve our suppliers. | 0.384 | 0.599 | 1.000 | |
| The involvement of middle management is crucial for successfully implementing changes in core business processes. | 0.439 | 0.307 | 0.312 | 1.000 |
| Variable/Year | 2017 | 2018 | 2019 | 2020 |
|---|---|---|---|---|
| Real risk-free rate (%) | 1.07 | 0.93 | 0.75 | 0.51 |
| Nominal risk-free rate (%) | 3.07 | 2.93 | 2.75 | 2.51 |
| Estimated market risk premium (%) | 5.54 | 5.68 | 5.51 | 4.40 |
| Aggregated ROE in % | 2017 | 2018 | 2019 | 2020 |
|---|---|---|---|---|
| Median ROE of all analysed companies (n = 143) | 10.05 | 10.20 | 9.86 | 8.31 |
| Aggregate ROE of all Slovenian companies | 8.29 | 9.1 | 9.36 | 5.40 |
| Difference | 1.76 | 1.10 | 0.50 | 2.91 |
| Median (n = 143) | 2017 | 2018 | 2019 | 2020 |
|---|---|---|---|---|
| Leveraged beta of all analysed companies | 1.16 | 1.26 | 1.28 | 1.24 |
| Required return on equity capital (%) | 9.49 | 10.07 | 9.81 | 9.21 |
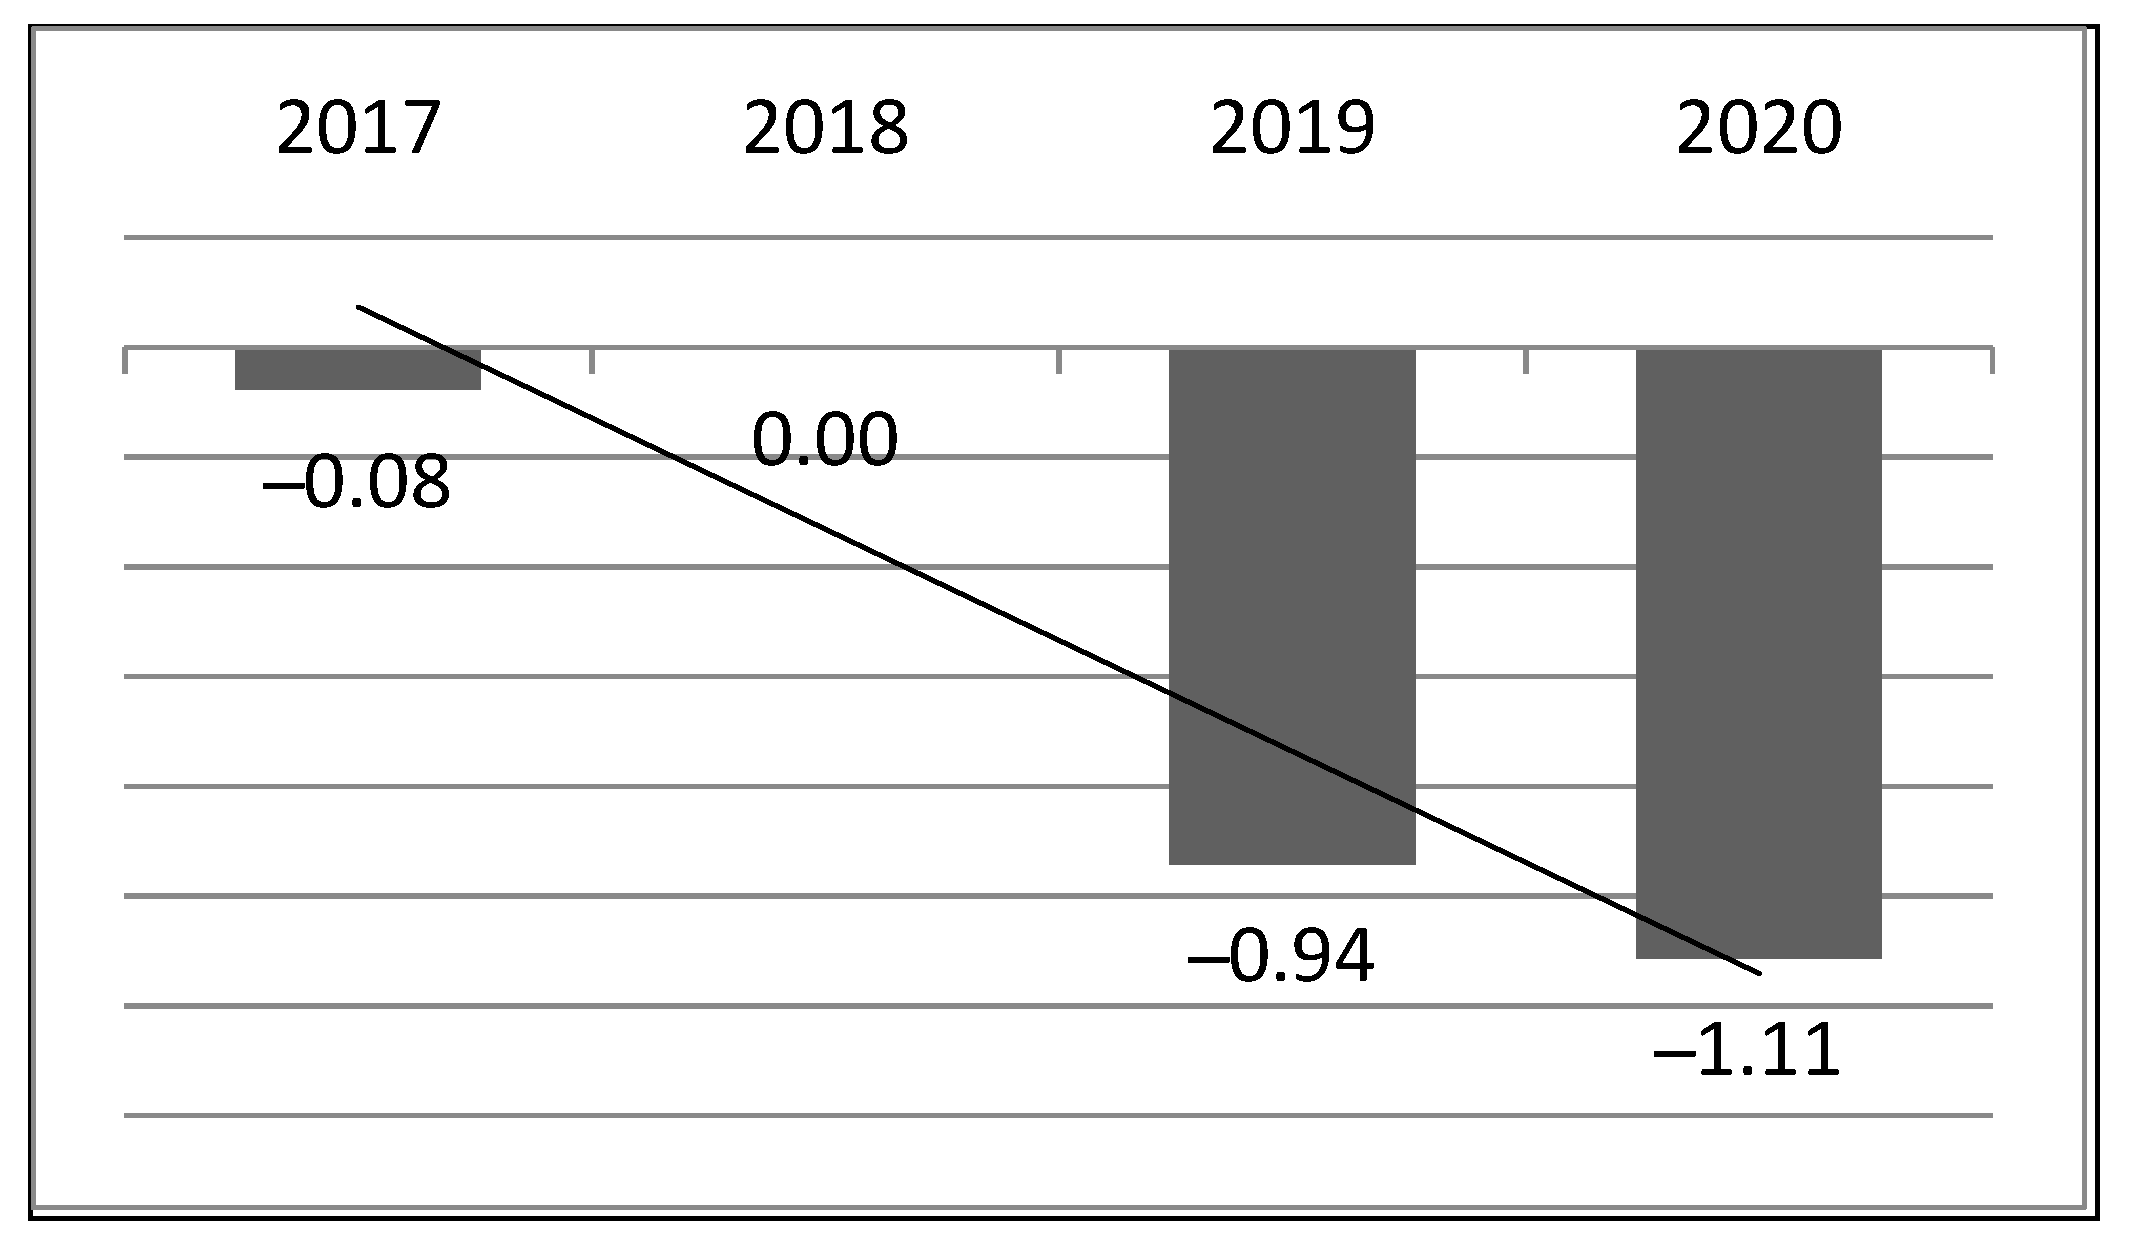
| Relative residual income (ROEr) (%) | −0.08 | 0.00 | −0.94 | −1.11 |
| Risk-adjusted ROE (ROEa) (%) | 8.53 | 8.61 | 7.33 | 7.15 |
| 2017 | 2018 | 2019 | 2020 | |
|---|---|---|---|---|
| Required return on equity capital (%) | 8.61 | 8.61 | 8.26 | 7.91 |
| Relative residual income (ROEr) (%) | −0.32 | 0.49 | 1.10 | −2.51 |
| Risk-adjusted ROE (ROEa) (%) | 8.29 | 9.10 | 9.36 | 5.40 |
| ROEr | ROEa | |||
|---|---|---|---|---|
| Top 20% of Companies | Bottom 20% of Companies | Top 20% of Companies | Bottom 20% of Companies | |
| Four-year average (%) (2017–2020) | 8.07 | −8.67 | 15.02 | 2.68 |
| Statements | Likert (1–6) | Likert (1–6) | Likert (1–6) | Likert (1–6) |
| When changing the core business process, we regularly involve our employees. | 4.29 | 4.18 | 4.46 | 3.96 |
| When changing core business processes, we regularly involve our customers. | 3.43 | 3.68 | 3.64 | 3.57 |
| When changing core business processes, we regularly involve our suppliers. | 3.89 | 3.89 | 4.04 | 3.57 |
| The involvement of middle management is crucial for successfully implementing changes in core business processes. | 4.32 | 3.82 | 4.14 | 3.57 |
Disclaimer/Publisher’s Note: The statements, opinions and data contained in all publications are solely those of the individual author(s) and contributor(s) and not of MDPI and/or the editor(s). MDPI and/or the editor(s) disclaim responsibility for any injury to people or property resulting from any ideas, methods, instructions or products referred to in the content. |
© 2023 by the authors. Licensee MDPI, Basel, Switzerland. This article is an open access article distributed under the terms and conditions of the Creative Commons Attribution (CC BY) license (https://creativecommons.org/licenses/by/4.0/).
Share and Cite
Gošnik, D.; Meško, M.; Stubelj, I. The Relationship between Leadership in BPM and Company Profitability. Adm. Sci. 2023, 13, 77. https://doi.org/10.3390/admsci13030077
Gošnik D, Meško M, Stubelj I. The Relationship between Leadership in BPM and Company Profitability. Administrative Sciences. 2023; 13(3):77. https://doi.org/10.3390/admsci13030077
Chicago/Turabian StyleGošnik, Dušan, Maja Meško, and Igor Stubelj. 2023. "The Relationship between Leadership in BPM and Company Profitability" Administrative Sciences 13, no. 3: 77. https://doi.org/10.3390/admsci13030077