Article

Firm Characteristics, Business Environment, Strategic Orientation, and Performance

1
Faculty of Economics and Business, Universitas Padjadjaran, Bandung 40113, Indonesia
2
Faculty of Accountancy, Universiti Teknologi MARA, Puncak Alam 42300, Selangor, Malaysia
3
Indonesia Ministry of National Development Planning, Jakarta 10310, Indonesia
*
Author to whom correspondence should be addressed.
Adm. Sci. 2023, 13(3), 74; https://doi.org/10.3390/admsci13030074
Submission received: 29 December 2022 / Revised: 23 January 2023 / Accepted: 28 January 2023 / Published: 2 March 2023
(This article belongs to the Section Strategic Management)

Abstract

:
The purpose of this study is to empirically examine the influence of firm characteristics (size, age, industry type, and ownership) on a firm’s strategic orientation. The business environment, namely market uncertainty and competition intensity, is also analysed in association with the firm’s strategic orientation. Furthermore, the implication of strategic orientation for performance is tested. The study used 1024 data sets of 128 manufacturing firms listed on the Indonesia stock exchange from 2014 to 2021. Data panel regression and independent t-tests were employed for statistical analysis. Adopting Miles and Snow’s strategy typology framework, the findings indicated that the firm size, industry type, and competition intensity significantly influence the firm’s strategic orientation. Small firms preferred to adopt a proactive strategic orientation (prospector and analyser). Firms in the fast-moving consumer goods (FMCG) industry tended to adopt a proactive strategic orientation (prospector and analyser). Strategic orientation was found to positively and significantly influence firm performance. Firms that adopt a proactive strategic orientation (analyser and prospector) showed better performance than defensive ones (reactor and defender).

1. Introduction

Business organisations need a strategy to achieve their goals. Miles and Snow’s strategy typology is one of the business strategy classifications most frequently cited among scholars in business and management research. According to Miles and Snow (1978), strategies are classified into reactor, defender, analyser, and prospector. The reactor and defender strategies emphasise production efficiency (Anwar et al. 2021). Firms that adopt the reactor and defender strategies are typically passive in responding to market opportunities and prefer to be involved in a stable market (Chereau and Meschi 2019; Grimmer et al. 2017). Meanwhile, the analyser and prospector strategies focus on product innovation (Daft et al. 2020). Firms with prospector and analyser strategies consider a dynamic change in the market as an opportunity. Aggressive product promotion, research and development, and innovation are characteristics of prospector and analyser firms. Therefore, prospectors and analysers are frequently associated with proactive strategic orientation (Bentley et al. 2013). Meanwhile, reactors and defenders are classified into defensive strategic orientation (DeSarbo et al. 2005).
Organisational behaviour has gotten more attention lately due to the dynamic change in the business environment. Each business organisation has a uniqueness that differentiates management practice from one to another. However, questions about why firms adopted different strategic orientations still need to be clarified. The factors determining strategic orientation adoption still need to be better understood. To enrich the body of knowledge in business, management, and organisation, it is essential to understand a firm’s behaviour and activities to achieve its goals (Peng et al. 2016). Therefore, studying the factors affecting a firm’s strategic orientation adoption is relevant to understand this matter. Furthermore, the implication of adopting a particular strategic orientation for a firm’s performance needs to be investigated to reveal the most effective strategic orientation.
Business organisation theory posits that organisational behaviour is affected by internal and external factors (Jones 2013). Internal factors are closely associated with a firm’s characteristics. Firm size, firm age, industry type, and resources (ownership) are typical firm characteristics most frequently studied. Meanwhile, the business environment is one of the external factors recognised as a significant determinant affecting firm behaviour (Vecchiato 2012). The business environment can be identified from the customer perspective (market demand uncertainty) and competitor perspective (competition intensity). A firm’s behaviour regarding adopting a typology business strategy needs to be studied from internal (firm characteristics) and external points of view (market uncertainty and competition intensity) to obtain a better understanding.
Firm characteristics distinguish one firm from another in terms of its functions and operations (Nkundabanyanga et al. 2019). They describe a firm’s physical dimensions (size and resource) or inherent identity (age and type). Different firms have different strengths and weaknesses that affect the choice of competitive strategy (Aranda 2002). Firm characteristics (size, age, industry type, ownership) are associated with resources, accumulation of experiences, and the nature of the business. A large firm is associated with superior resources compared to a small firm. Mature firms are expected to have more accumulation of experience than young firms. Industry type affects the way organisations are managed following the nature of the business. Different ownership (foreign vs. domestic) implies the disparity of resources, knowledge, and technology. The literature suggests that resources, capability, and constraints influence the organisation’s management approach, including the business strategy (Jiang et al. 2011; Ozer and Markóczy 2010).
The contingency theory hypothesises that the effectiveness of business strategy depends on fitness with the external environment (DeSarbo et al. 2005). In a turbulent and dynamic business environment, a flexible business strategy is the most suitable (Helmig et al. 2014). It is because a strategy needs to be adjusted and adapted continuously to the business environment field changes (Ghofar and Islam 2015). To succeed, organisations should have different strategies, behaviours, and structures following the environmental condition (Saraç 2019). Market competition demands that organisations respond appropriately to threats and opportunities in the competitive environment (Mia and Clarke 1999). The efficient structure hypothesis posits that competition intensity forces firms to be more efficient (Casu and Girardone 2009; Özgen Narcı et al. 2015). Firms in a more competitive environment will likely adopt a business strategy to improve the internal business process (Chang and Gurbaxani 2013).
Miles and Snow’s strategic orientation’s impact on firm performance has been studied frequently. Miles and Snow’s strategic orientation postulates that each type would yield comparable results (Anwar and Hasnu 2017). It means there is no superiority of one type of strategy over another. However, the study results have been mixed and inconclusive (Otache 2019). The findings indicated divergence and did not wholly follow the theory. Some findings agreed with Miles and Snow’s strategy typology assumptions (Navissi et al. 2016; Peljhan et al. 2018), while others did not agree with the assumptions (Andrews et al. 2009; Anwar and Hasnu 2017). This implies the existence of a theoretical gap. Therefore, further study to understand the relationship between a firm’s strategic orientation and performance is still relevant.
The purpose of this study is to empirically examine the influence of firm characteristics (firm size, firm age, industry type, and ownership) and business environment (market uncertainty and competition intensity) on firm behaviour in adopting a particular strategic orientation (defensive or proactive strategy). In addition, the study also analysed the implication of strategic orientation adoption (defensive or proactive strategy) for firm performance. This study proposes different model analyses in understanding a firm’s behaviour regarding strategic orientation adoption. Unlike previous studies, where firm characteristics were proxied as a control variable, this study proposes firm characteristics as active variables influencing strategic orientation adoption. Furthermore, analysis involves internal (firm characteristics) and external (business environment) factors. By combining analysis using internal and external factors, this study offers a more comprehensive approach to understanding a firm’s behaviour regarding its strategic orientation.
This study contributes to three aspects: academic, managerial, and government policy. From an academic perspective, findings in this study may enrich business and management literature, especially on organisational behaviour and strategic management. Each country has differences in economic, political, national cultural, and social values (Djajadikerta and Trireksani 2012). Research with the same variables and methodology may yield different results if conducted in different countries. Given that the study was conducted in an emerging country (Indonesia), the findings are expected to be useful for comparative study purposes, such as with advanced countries. From a managerial perspective, the findings in this study give valuable information for business managers to decide which strategic orientation should be adopted to give better performance impact for business organisations. Lastly, considering that the study focuses on manufacturing firms, this study’s findings may give government agencies insight into formulating an industrialisation policy.

2. Literature Review and Hypothesis Development

2.1. Firm Size and Strategic Orientation

Firm size is a typical attribute that potentially affects a firm’s behaviours and strategic orientation decisions (Jiang et al. 2011; Park and Luo 2001). Different firm sizes and industry types will respond to a given situation differently (Moss et al. 2013). It is because firms have different emphases regarding their strategic positions (Bishop and Megicks 2002). Large companies tend to adopt a defensive approach due to their established systems and resources, allowing them to make profitable decisions with less risk. In contrast, small companies must take on more risks to achieve profits and success. Essentially, large firms prioritize long-term stability, while small firms seek a significant opportunity for growth. Yannopoulos (2011) argues that large firms tend to take part in business opportunities that give high margins only. Meanwhile, small firms with a growing orientation tend to involve any business opportunities regardless of low or high margins. Therefore, large firms are expected to adopt a defensive strategy and small firms a proactive one. Chen and Hambrick (1995), who studied US airlines, found that small airlines were quick to initiate competitive challenges and were discreet in their execution. Even though they were slower to respond when attacked, their responses were more noticeable than their larger competitors’ (Chen and Hambrick 1995). Dean et al. (1998) compared firms’ responses to environmental context between large and small firms in US manufacturing firms. The findings indicate that small businesses have certain resources that enable them to surmount barriers that present greater challenges for larger businesses and allow them to capitalize on certain industry opportunities more easily than larger businesses (Dean et al. 1998).
Hypothesis 1 (H1).
Firm size significantly influences a firm’s strategic orientation.
Hypothesis 2 (H2).
There are significant size differences between defensive and proactive firms. Large firms are more likely to adopt a defensive strategic orientation, while small firms are more likely to adopt a proactive one.

2.2. Firm Age and Strategic Orientation

Firm age is associated with accumulating knowledge and experiences (Hannan et al. 1998). Knowledge, experiences, and reputation are typically developed over time, and the accumulation level aligns with the length of the firm existence (Shinkle and Kriauciunas 2009). Therefore, older firms tend to have more accumulation of experience and reputation than younger firms. One factor that makes younger firms tend to have poor performance is a lack of experience (Hannan et al. 1998). Firm age may indicate experience-based capabilities, adaptation capabilities, reliability, and market credibility (Shinkle and Kriauciunas 2009). Hence, firm age is an essential determinant of firm dynamics (Anić et al. 2009) and the firm’s survival (Nkundabanyanga et al. 2019). Research indicates that firm age is associated with firm survival and failure probability (Yasuda 2005). Accumulation of experiences is a contributing factor toward the enhancement of firm performance (Ismail et al. 2010). Therefore, older firms with more accumulation of experiences should perform better than younger firms with fewer experiences (Ismail et al. 2010). Older firms have more accumulation of information regarding market behaviour. Therefore, they behave more prudently and passively toward market opportunities. Older firms respond to market opportunity only if the business risks are perceived as low. Meanwhile, due to growth orientation, young firms tend to seek market opportunities actively. In general, young firms are relatively more careless about business risks than older firms.
According to the theory of knowledge spillover entrepreneurship, start-up firms (young firms) are more likely to absorb external knowledge faster than older firms because they act as a conduit for ideas and knowledge to growth (Audretsch and Keilbach 2007). Lechner et al. (2016) argue that young and small firms obtain benefits from interaction with large and mature firms. Large and mature firms have a proven track record of understanding consumer demand and effectively marketing their products. Conversely, small and young firms may lack this experience and can benefit from working with more experienced firms to develop quickly and market relevant products (Lechner et al. 2016). With external knowledge obtained from large and mature firms, young and small firms proactively respond to market opportunities to achieve firm growth (Lechner et al. 2016).
Hypothesis 3 (H3).
Firm age significantly influences a firm’s strategic orientation.
Hypothesis 4 (H4).
There are significant age differences between defensive and proactive firms. Older firms are more likely to adopt a defensive strategic orientation, while younger firms are more likely to adopt a proactive one.

2.3. Industry Type and Strategic Orientation

Firms select and apply particular strategic orientations depending on their characteristics, including industry type (Varma et al. 2006). Ozer and Markóczy (2010) found that industry structure and firm characteristics significantly impact corporate strategy and innovation. Firms develop and implement a particular strategy to respond to external and internal forces (O’Cass and Julian 2003). Fast-moving consumer goods (FMCG) is a specific industry that is very dynamic (Arafat et al. 2014). The FMCG industry has high product demand, innovation, massive marketing investments, product variety, and a short life cycle (Bilgen and Günther 2010; Diehl and Spinler 2013). In line with the increasing world population, FMCG is one of the industries with the highest business growth (Feimianti and Anantadjaya 2014). Despite offering great market opportunities, competition in FMCG is also intense (Alhakimi and Baharun 2010). Hence, marketing has played a more critical role in FMCG than in other industries (Alhakimi and Baharun 2010). Furthermore, new product development and innovation are necessary for survival in FMCG (Derqui et al. 2022). Its strategic orientation is characterised by intense research and development, innovation, and market expansion. FMCG’s typical strategic orientation is intended to develop and exploit market opportunities. Therefore, a proactive strategy is more suitable for this industry than a defensive strategy for maintaining firm performance (Alhakimi and Baharun 2010).
Hypothesis 5 (H5).
The industry type significantly influences a firm’s strategic orientation.
Hypothesis 6 (H6).
There is a significant industry-type difference between defensive and proactive firms. The fast-moving consumer goods (FMCG) industry is more likely to adopt a proactive strategic orientation, while a non-FMCG industry is more likely to adopt a defensive one.

2.4. Ownership and Strategic Orientation

Ownership implies an organisation’s control and directional power (Chen and Hua Tan 2013). Firms with different types of ownership have different human resource availabilities and financial resources (Douma et al. 2006). It is believed that ownership has implications in terms of the way an organisation is managed, and it is expected to influence its strategic orientation (Douma et al. 2006; Mahajan et al. 2018). Differences in ownership structure and resource endowments affect organisational decisions and action policies (Chen and Hua Tan 2013). The ownership structure is associated with resource endowments among owners that determine their power and ability to manage business organisations (Douma et al. 2006). From the perspective of developing countries, firms with foreign ownership are associated with greater technological skills, good management practices, sufficient financial resources, better innovation capability, and higher economies of scale (Mahajan et al. 2018; Wiwattanakantang 2001). Firms with greater levels of foreign ownership are typically more capital-intensive (Chhibber and Majumdar 1999). Superior production technology and management know-how enable foreign-owned firms to produce more efficiently than domestically owned firms (Ramstetter 1999).
The company’s ownership type plays a significant role in shaping its internal processes and guiding its strategic direction (Peng et al. 2020). Firms with majority foreign ownership are, in general, multinational companies. Their market network is not only limited to the domestic market but also the international market. Therefore, the strategic direction of the majority of firms with foreign ownership is market expansion. They are actively seeking market opportunities by investing in local firms. A study in Italy found that a higher level of human capital and the presence of foreign shareholders in small and medium-sized enterprises (SMEs) positively impact the internationalisation of these businesses (Cerrato and Piva 2012). A study on 46 African countries by Narteh and Acheampong (2018) shows that the involvement of foreign entities in businesses has been found to positively impact the internationalisation level. Empirical findings from studies in China show that foreign ownership greatly enhances multinational entities’ financial performance and export activity compared to those acquired by domestic entities (Wang and Wang 2015).
Investment by foreign investors in local firms is normally also followed by a transfer of knowledge, technology, and human resources (Guadalupe et al. 2012). A study in China found that when foreign equity control is higher, product differentiation capability increases due to the technology transfer (Chen et al. 2014). Empirical findings from Spanish manufacturing firms indicate that there is a strong correlation between foreign ownership and innovation capabilities (Guadalupe et al. 2012). Foreign investors expect a high return from their investment in local firms. Therefore, the strategic orientation of multinational firms is more actively seeking market opportunities rather than waiting for opportunities. Therefore, international marketing, research and development, and product innovation are expected to be more intensive in firms with foreign ownership than domestic ones. Pan (1996) studied influences on foreign equity ownership levels in joint ventures in China. He found that advertising intensity increases in line with the level of foreign equity ownership. With foreign investors’ higher equity control, the firm’s strategic orientation is more likely to seek market opportunities actively.
Hypothesis 7 (H7).
Ownership significantly influences a firm’s strategic orientation.
Hypothesis 8 (H8).
There are significant ownership differences between defensive and proactive firms. Firms with majority ownership by foreign investors are more likely to adopt a proactive strategic orientation, while domestic investors are more likely to adopt a defensive one.

2.5. Business Environment and Strategic Orientation

Organisational performance is determined by its strategic choice and adaptive capability, in which strategic choice interacts with environmental forces such as market uncertainty (Dominguez et al. 2015). In an uncertain market environment, firms face challenging efforts to adapt to change and remain stable to control uncertainty and simultaneously to maintain their competitive position (Anwar and Hasnu 2017). In an unstable and uncertain environment, organisations are forced to constantly adapt to new conditions requiring a more flexible, less formalised structure (Jaffee 2001; Lawrence and Lorsch 1967). Strategic management literature suggests that the firm’s performance is primarily influenced by a concomitant consideration of environmental conditions (Aghajari and Senin 2014). Changes in environmental conditions considerably and structurally affect firms’ performance (Sternad 2012). Strategic orientation should be different in stable and uncertain market conditions. Strategic orientation should be adjusted following the market condition to obtain optimal performance.
Market competition demands that organisations respond appropriately to threats and opportunities (Mia and Clarke 1999). Intense competition forces firms to decrease costs and streamline operations to maintain competitiveness (Ax et al. 2008). Firms operating in highly competitive environments must ensure their cost structures are low enough to help them maintain their returns (Ramaswamy and Renforth 1996). The intense competition motivates firms to adopt productive technology and increase cost awareness through cost control and management (Ax et al. 2008; Chupradit et al. 2021; Guilding et al. 2005; Ramaswamy 2001). Meanwhile, in uncompetitive markets, firms tend to emphasise cost control and efficiency less since the impact of market forces is minimal (Ramaswamy and Renforth 1996; Schaeck and Cihak 2008). Firms exposed to more intensive competition are expected to be more efficient due to tight screening and monitoring procedures (Petersen and Rajan 1995). Under intense business competition, firms are more likely to adopt a strategic orientation focusing on improving an internal business process.
Hypothesis 9 (H9).
Market uncertainty significantly influences a firm’s strategic orientation.
Hypothesis 10 (H10).
Competition intensity significantly influences a firm’s strategic orientation.

2.6. Strategic Orientation and Performance
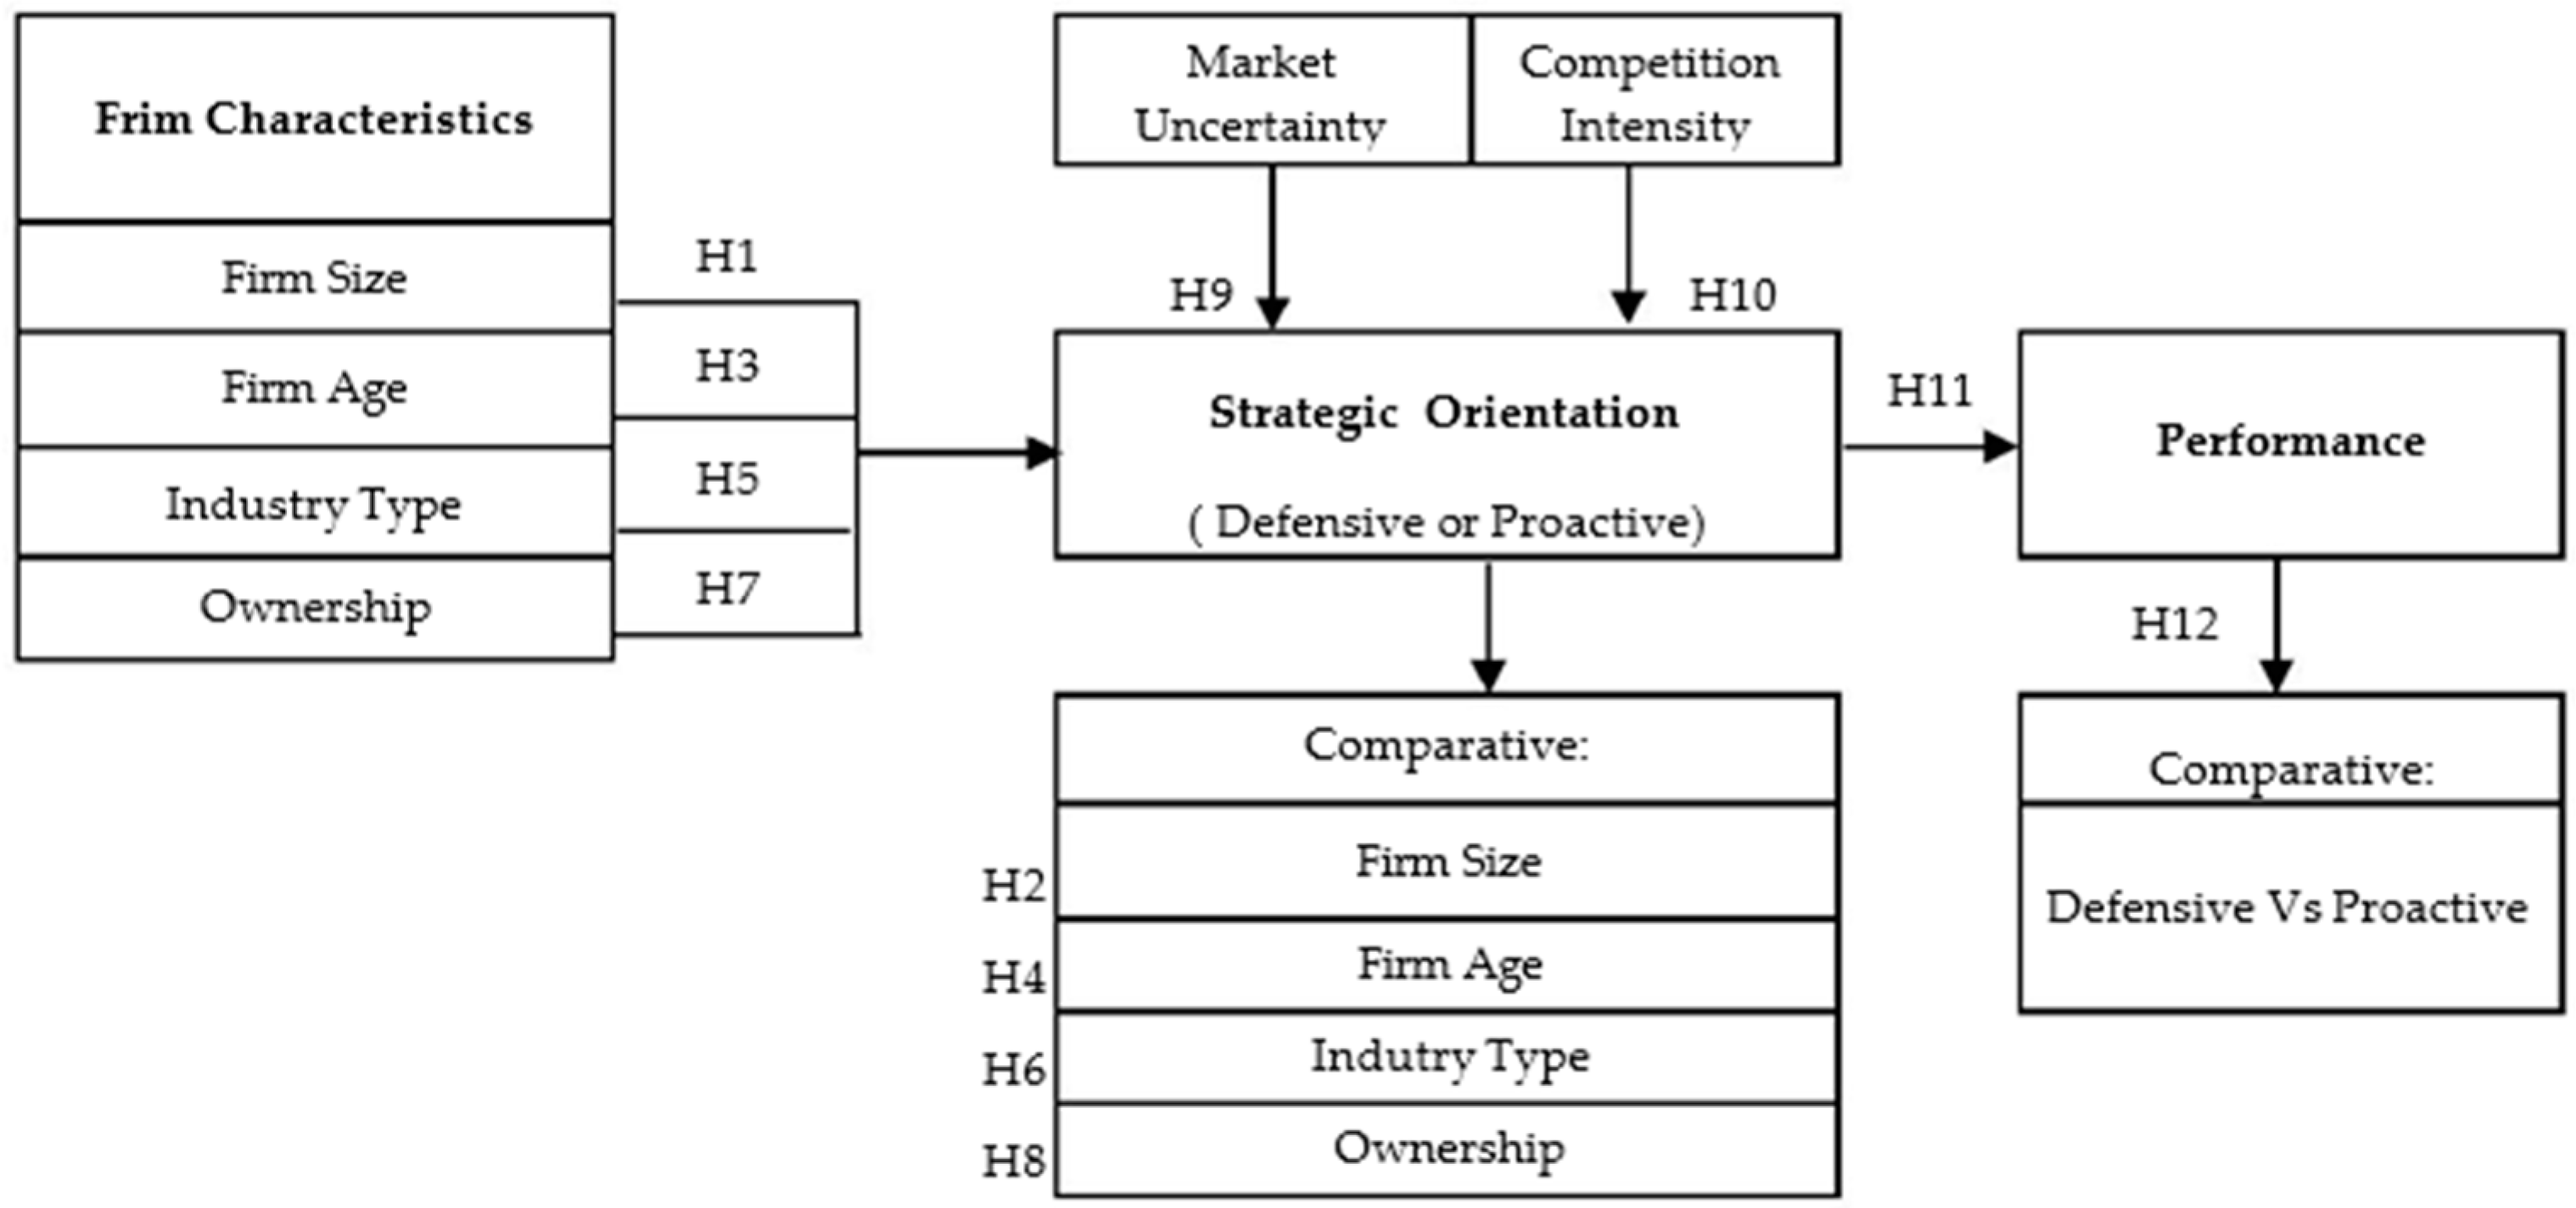
Studies suggest a link between business strategy and a firm’s performance (MacKinnon et al. 2012; Stone-Romero and Rosopa 2010). Firms with proactive strategic orientation (prospector and analyser) tend to adopt the latest technology to achieve their competitive advantage (Chang et al. 2003). As an innovator, proactive firms will have the advantage of charging skim prices (Wheelen et al. 2018) and turning them into high-profit margins (Chang et al. 2003). The study indicates that market orientation and innovativeness were positively related to firm performance (Frishammar and Åke Hörte 2007). Since prospectors and analysers are typically market-oriented, they tend to have aggressive marketing approaches. Therefore, proactive firms have broader market coverage and higher potential revenues and profitability than defensive firms. Proactive firms have a better chance of growth by taking advantage of market opportunities. Therefore, a proactive strategic orientation (prospector and analyser) is positively associated with the performance (Aragon-Correa et al. 2008; Grimmer et al. 2017). Firms with a proactive strategic orientation are more likely to be more successful than a defensive one (Pleshko and Heiens 2011). It is simply because defender firms would not be able to take advantage of the many opportunities available in the market (Jaworski and Kohli 1993). Proactive firms persistently search for market opportunities and will be more likely to adapt their strategy to achieve better performance (Khan et al. 2010). Zahra and Pearce (1990) argued that the adaptive strategy (prospectors and analysers) would outperform the non-adaptive strategy (defenders and reactors).
Hypothesis 11 (H11).
A firm’s strategic orientation significantly influences performance.
Hypothesis 12 (H12).
There are significant performance differences between defensive and proactive firms. Firms with a proactive strategic orientation are more likely to perform better than those with a defensive one.

3. Research Model

This study is designed to examine the influence of firm characteristics (size, age, industry type, and ownership) and business environment (market uncertainty and competition intensity) on a firm’s strategic orientation (defensive or proactive). The implication of the firm’s strategic orientation (defensive and proactive) for performance is also analysed. Furthermore, firms that adopt a defensive and proactive strategic orientation are compared in terms of size, age, industry type, ownership, and performance. Graphically, the research model proposed in this study is presented in Figure 1.

4. Research Methods

4.1. Sample and Data

The sample in this study consists of manufacturing firms listed on the Indonesia stock exchange (IDX) from 2014 to 2021. In total, 128 listed manufacturing firms were involved in the study. Only manufacturing firms consecutively listed were selected as samples of the study. With eight years of financial data (2014–2021), a 1024 data set was obtained. Sources of data are generated from financial archives. The data were generated and processed from annual reports and supplementary financial information released by the IDX and the sample firm’s website.

4.2. Variable Measurement

4.2.1. Strategic Orientation Measurement

The strategic orientation used in this study refers to the construct developed by Miles and Snow. To identify a firm’s strategic orientation, a strategy composite measure following the works of Ittner et al. (1997), Bentley et al. (2013), and Higgins et al. (2015) was adopted. The construct of strategic orientation was proxied with five ratios, namely, (1) research and development to sales, (2) marketing expenditures to sales, (3) employment to sales, (4) market to book ratio, and (5) property and equipment to total assets (capital intensity). We ranked each of the five ratios by forming a quartile to construct the composite measure. The top first quartile was given a score of 4, the top second quartile was given a score of 3, and so on. Those in the lowest quintile were given a score of 0. For each firm year, the scores across the five ratios were summed up with a maximum score of 20 and a minimum score of 0. Higher composite scores represent a proactive strategic orientation, while lower ones represent a defensive strategic orientation (Habib and Hasan 2017). To classify strategic orientation into proactive or defensive types, we adopt a parameter following previous works by Cohen et al. (2014). The scoring system of business strategy typology and scaling of the data is presented in Table 1.

4.2.2. Firm Characteristics Measurement

The firm characteristics in this study consist of the firm size, firm age, industry type, and ownership. The firm size was proxied with total assets. Meanwhile, the firm age refers to the length of business operation counted from the firm’s establishment until the period of investigation (2014–2021). Industry type was defined as the classification of industry into fast-moving consumer goods (FMCG) and non-FMCG industries. The country origin of the majority of common stock owners points out ownership. Firms with a common stock majority possessed by overseas investors were identified as firms with foreign ownership. Meanwhile, firms with domestic ownership are typical firms with the majority of common stock possessed by domestic investors.

4.2.3. Business Environment Measurement

The business environment in this study refers to market uncertainty and competition intensity. Following a previous study by Habib et al. (2011), market uncertainty was measured using a proxy of the coefficient of variation of sales revenues (CVR). A higher coefficient of variation indicates fluctuations in sales revenues and, therefore, higher market uncertainty and vice versa. The coefficient of variation of sales revenues (CVR) is formulated as follows:
CVR   ( SR i ) = k = 1 5 ( SR i SR ¯ ) 2 5 SR ¯
where CVR = coefficient of variation of revenues; SRi = firm’s sales revenue at the period of observation “i”; and SR ¯ = firm’s average sales revenues for eight years.
This study defines competition intensity as the degree of competition among firms in the same business sector. Following works by Chen et al. (2015) and Holm and Ax (2020), the Herfindahl–Hirschman Index (HHI) was adopted to measure competition intensity. The formula to determine the HHI is as follows:
HHI = i = 1 n S i 2 S i =   Sales   value   of   sample   firm   for   eight   years   sales   value   for   all   firms   in   one   business   sec tor   for   eight   years
where HHI = Herfindahl–Hirschman Index; Si = market share of the sample firm; and n = the number of sample firms in the market.
A higher HHI indicates a low level of competition intensity. It implies that a few firms dominate the market share of a particular business sector. Meanwhile, a lower HHI indicates high-level competition intensity. Market share is distributed relatively equally to all firms in that business sector.

4.2.4. Firm Performance Measurement

Firm performance in this study was measured using the return on assets (ROA). ROA indicates the performance of the firms measured using a proportion of profitability and total assets. ROA can give an objective perspective on performance measurement indicators compared to other financial indicators. It is because ROA includes total assets to determine a firm’s performance. By including total assets, the firm’s size effect can be eliminated. A robustness test is conducted to ensure that the finding regarding the effect of strategic orientation on performance is robust. Other financial performance indicators, namely operating profit margin (OPM) and net profit margin (OPM), were adopted during the robustness test.

4.3. Analysis

4.3.1. Regression Analysis

Regression analysis was adopted to empirically examine the influence of firm characteristics and business environment on a firm’s strategic orientation. In this study, the firm’s strategic orientation (straor) was proposed as a function of firm characteristics, namely firm size (size), firm age (age), industry type (type), ownership (own), market uncertainty (muncer), and competition intensity (comin). Since the data type combines time series and cross-section, panel data regression analysis was employed. The model estimation of panel data regression is as follows:
straorit = b0 + b1sizeit + b2ageit + b3typeit + b4ownit + b5muncerit + b6cominit + eit
The second model analysis examines the causal relationship between strategic orientation (defensive or proactive) and firm performance. In this model, firm performance (fperm) is a function of a firm’s strategic orientation (straor). The second model estimation of panel data regression is as follows:
fpermit = b0 + b1straorit + eit
The third model analysis includes firm characteristics (size, age, industry type, and ownership) and business environment in model 3. The firm characteristics and business environment were set up as a control variable for performance. The purpose of model analysis 3 is to examine the role of firm characteristics and business environment in affecting firm performance. The third model estimation of panel data regression is as follows:
fpermit = b0 + b1straorit + b1sizeit + b2ageit + b3typeit + b4ownit + b5muncerit + b6cominit + eit

4.3.2. Comparative Analysis

An independent t-test was employed to compare the mean differences between the two groups. For the firms that adopt defensive and proactive strategic orientations, the differences in size, age, industry type, and ownership were compared. Furthermore, performance differences between firms adopting defensive and proactive strategic orientations were also evaluated.

5. Results

5.1. Firm Characteristics, Business Environment, and Strategic Orientation

Panel data regression analysis requires a preliminary test before determining the analysis method. A Chow test and Hausman test were performed to determine the suitable method (common-effect method, fixed-effect method, or random-effect method). The Chow test is a statistical test used to determine whether there is a significant difference between the coefficients of two linear regression models (common effect versus fixed effect) fitted to different subsets of the same data set. The Chow test (Table 2) indicates that the fixed-effect method is the most suitable model with the data (p < 0.05).
The Hausman test is a test used to determine whether it is better to use fixed effects or random effects in a linear regression model. The test compares the difference in the estimates of the parameters obtained using these two methods and determines whether the fixed-effect model is consistent, efficient, and more appropriate than the random-effect model. The Hausman test (Table 2) indicates that the random-effect method (p > 0.05) is the better method to analyse the data than the fixed-effect method.
The fitness data on model analysis indicate that the random-effect model is the most suitable one. Therefore, panel data regression with the random-effect method was applied in this study. The output of the panel data regression analysis of the estimated general least-squares random-effect model (Panel EGLS—period random effects) is presented in Table 3.
H1 proposes that firm size (size) significantly influences a firm’s strategic orientation. The regression analysis outcome (Table 3) indicates that the probability value of firm size (size) is significant (p < 0.05). Therefore, hypothesis statement H1 is supported. It implies that a firm’s scale (whether small-scale or large-scale) significantly affects a firm’s behaviour regarding its strategic orientation preference.
The study predicts that a firm’s age (age) significantly influences the firm’s strategic orientation (H3). The result of regression analysis (Table 3) shows that firm age (age) has a probability value of 0.0651 (p > 0.05). It suggests that proposition statement H3 needs to be validated further. Whether young or mature, firm age does not affect the firm’s behaviour regarding its strategic orientation adoption (H3 is not affirmed).
Strategic orientation is also associated with the industry type (H5). The study estimates that industry type (type), the classification of industries into FMCG and non-FMCG, will impact the firm’s decision to designate a particular strategic orientation (defensive or proactive). The output of the regression analysis (Table 3) implies that the probability value is 0.0000 (p < 0.0001). Therefore, hypothesis statement H5 is statistically proven.
H7 states that ownership (domestic or foreign ownership) significantly influences a firm’s decision to select a particular strategic orientation (defensive or proactive). The result of regression analysis (Table 3) demonstrates that ownership structure (own) has a probability value of 0.3717 (p > 0.05). It concludes that hypothesis statement H7 is not backed. Whether domestic or foreign, ownership did not play a significant role in determining a firm’s strategic orientation (defensive or proactive).
The study predicts that strategic orientation is also influenced by external factors, namely the business environment (market uncertainty and competition intensity). H9 states that market uncertainty significantly influences a firm’s strategic orientation. The output of regression analysis (Table 3) indicates that market uncertainty (muncer) has a probability value of 0.6407 (p > 0.05). It confirms that hypothesis statement H9 is not upheld. Meanwhile, competition intensity (comin) has a probability value of 0.0113 (p < 0.05). Therefore, hypothesis statement H10, which concludes that competition intensity (comin) influences a firm’s strategic orientation, is endorsed.
Regression analysis model 1 estimates that strategic orientation is a function of firm size (size), firm age (age), industry type (type), ownership (own), market uncertainty (muncer), and competition intensity (comin). Referring to the regression analysis output (Table 3), firm size, industry type, and competition intensity have significantly influenced a firm’s strategic orientation. Analysis model 1 can predict strategic orientation amounting to 23.8% (R-squared = 0.238827). The remaining (76.2%) is determined by the other variables not included in this study’s analysis.

5.2. Firm’s Strategic Orientation and Performance

The study’s design also examines the influence of strategic orientation (defensive and proactive) on performance (model 2 and model 3). Model 2 estimates the influence of strategic orientation on performance. Meanwhile, model 3 estimates the impact of strategic orientation on performance by including control variables. Control variables in model 3 refer to firm characteristics, namely firm size, age, industry type, and ownership. The output of regression analysis regarding the influence of strategic orientation on performance is presented in Table 4.
H11 proposes that a firm’s performance is significantly influenced by the firm’s strategic orientation preference (defensive or proactive). The outcome of regression analysis model 2 (Table 4) indicates that strategic orientation (straor) has a probability value of 0.0000 (p < 0.0001). It justifies that hypothesis statement H9 is confirmed. A firm’s decision to favour a particular strategic orientation (defensive or proactive) has implications for the firm’s performance.
Model 3 includes control variables, a firm’s characteristics (size, age, industry type, and ownership), into regression analysis. The output of regression analysis in model 3 shows that all firm characteristics (size, age, industry type, and ownership) are significantly associated with performance (p < 0.0001 and p < 0.05). It implies that besides strategic orientation, a firm’s characteristics also contribute to determining performance.

5.3. Comparative Analysis Results

Before performing an independent t-test, a data normality check was conducted. The purpose of a data normality test is to determine whether the independent t-test will use a parametric method or a non-parametric method. A test of data normality was conducted using the Shapiro–Wilk method, and the outcome of the data normality test is presented in Table 5. The results in Table 5 imply that the data are not normally distributed (p < 0.05). Since the type of data is not normally distributed, a non-parametric independent t-test was performed in this study. Using the Mann–Whitney method, the outcome of the non-parametric independent t-test is presented in Table 6.
Hypothesis 2 estimates a significant size difference between defensive and proactive firms. Larger firms are expected to adopt a defensive strategic orientation, while smaller firms adopt a proactive one. The independent-samples t-test (Table 6) shows a significant size difference (p < 0.05) between proactive and defensive firms. Additionally, the group descriptive statistic (Table 7) indicates that small-size firms (mean = 21.506) tend to adopt a proactive strategic orientation, and large firms (mean = 21.842) adopt a defensive one. Therefore, the statement in H2 is approved.
Proactive and defensive strategic orientation adopters have significant age differences (H4). Independent-samples t-test (Table 6), however, displays an insignificant sign of size difference (p > 0.05). Therefore, the premise that predicts a firm’s size difference between proactive and defensive strategic orientation is not supported.
Different industry types (FMCG and non-FMCG) are proposed to have different strategic orientation implications. The FMCG industry is expected to select a proactive strategic orientation. Meanwhile, a defensive strategic orientation will be adopted by non-FMCG (hypothesis 6). The independent-samples t-test (Table 6) gives statistical evidence that there is a significant difference in the industry type between proactive and defensive firms (p < 0.05). Since categorisation uses a nominal type of data (FMCG = 2 and non-FMCG = 1), a higher mean value refers to FMCG, and a lower one refers to non-FMCG. Group descriptive statistics (Table 7) show that proactive firms have a mean value of 1.398 and defensive firms have a mean value of 1.1418. Therefore, hypothesis statement H6 is justified.
This study predicts that there are significant ownership differences between defensive and proactive firms. Firms with ownership majority by foreign investors are more likely to adopt a proactive strategy, while domestic investors adopt a defensive one (H8). The independent-samples t-test (Table 6) indicates that ownership between defensive and proactive firms was found to have no significant difference (p > 0.05). Hence, hypothesis statement H8 is not supported.
The study proposes a significant performance difference between defensive firms and proactive firms. Proactive firms are more likely to perform better than defensive firms (H10). The independent-samples t-test (Table 6) shows a significant performance difference between the defensive strategy and proactive strategy (p < 0.0001). Group descriptive statistics (Table 7) indicate that the proactive strategy has a performance mean value of 0.045 and 0.045 for the defensive strategy. It confirms that proactive firms have better performance than defensive firms. Hence, hypothesis statement H10 is upheld.

5.4. Robustness Test

The robustness test in this study was designed to test the consistency of the findings in model 2. Model 2 estimates that performance is a function of strategic orientation. Previously in model 2, performance was measured using proxy return on assets (ROA). In the robustness test, performance was proxied with different financial indicators: operating profit margin (OPM) and net profit margin (NPM). The output of the robustness test is presented in Table 8. Using the OPM and NPM as a proxy for performance, the findings show that strategic orientation did not significantly influence performance (p > 0.05). However, when performance was proxied with ROA, strategic orientation was found to have a positive and significant influence on performance (p < 0.0001).
Based on the robustness test findings, strategic orientation is not a consistent predictor of performance. The influence of a firm’s size may affect the different results regarding the effect strategic orientation has on performance. ROA considers the size factor of firms in measuring performance. Meanwhile, the OPM and NPM are relatively neglected firm size factors for the purpose of performance measurement. Therefore, including firm size as a control variable in the analysis may explain the inconsistency in the robustness test.

6. Discussion

6.1. Firm’s Characteristics as the Determinant of Strategic Orientation

Firm characteristics distinguish one firm from another (Nkundabanyanga et al. 2019). They describe a firm’s physical dimensions (size) or identity (age, industry type, ownership). They are related to two aspects, the scale of an organisation’s operations and the number of resources available (Graubner 2006). This study’s findings suggest that firm characteristics, namely firm size and industry type, significantly influence firms’ strategic orientation. Meanwhile, firm age and ownership had no significant relationship with strategic orientation. The industry type is the most convincing firm characteristic as the determinant of strategic orientation (p < 0.0001). Meanwhile, the firm size provides moderate estimation power on strategic orientation (p < 0.05). These findings are in line with previous studies by Anwar and Hasnu (2017), Aranda (2002), and Godos-Díez et al. (2020), in that firm characteristics contribute to firms’ behaviour regarding strategic orientation.
A firm’s size has been found to positively and significantly influence the firm’s strategic orientation. The findings indicated that small-scale firms are more likely to adopt a proactive strategic orientation. On the contrary, large-scale firms tend to adopt a defensive one. The finding is in accordance with the hypothesis proposed. However, this finding did not comply with the principle of resources-based theory. Anwar and Hasnu (2017) asserted that resource capacity makes a difference between large and small firms’ strategic orientation choices. Diversification strategies among firms are closely associated with the scale of the firms (Godos-Díez et al. 2020). A proactive strategic orientation consumes a significant number of resources. Large firms are associated with sufficient resources. Therefore, adopting a proactive strategic orientation is likely for large-scale firms (Ke et al. 2008). Meanwhile, small firms with limited resources tend to adopt low-resource spending strategies (Bishop and Megicks 2002). A proactive strategic orientation is characterised by intense competition and a high risk of failure. Due to limited resources, small firms are relatively prudent in spending resources. Therefore, a strategic orientation with low risks (defensive strategy) makes sense for small firms. Based on the resources theory, it is expected that large-scale firms will adopt a proactive strategic orientation. Given that larger-scale firms favoured a defensive strategic orientation, it raises the question regarding the linearity of resource possession and spending. Larger-scale firms with abundant resources are not necessarily also spending many resources that lead to proactive strategy adoption.
Firm age indicates the accumulation of experiences. Mature firms are expected to have more accumulation of experience. Based on the RBT perspective, the accumulation of experiences is a source of competitive advantage. Firm size and age are typical attributes that strongly influence behaviours and strategic orientation decisions (Jiang et al. 2011). Older firms with more accumulation of experience are expected to adopt a proactive strategic orientation. Meanwhile, younger firms with less accumulation of experience tend to adopt a more conservative approach (defensive strategy). However, findings in this study show that firm age did not play any role in determining a firm’s strategic orientation. Furthermore, there were no significant differences in strategic orientation choices between younger and older firms. These findings leave a theoretical gap that needs to be explained further. Although the findings are not in line with the theoretical basis used, the findings are consistent with some previous research. Previous studies by Ke et al. (2008), Aranda (2002), Godos-Díez et al. (2020), and Panda (2015) found that firm characteristics did not play any role in determining a firm’s strategic orientation and performance. The findings expose two issues that need to be addressed. Firstly, the validity of the premise that firm maturity is associated with the accumulation of experiences. Secondly, the connection between firm age, accumulation of experiences, and strategic orientation may be affected by other variables such as the type of industry, firm size, and competition intensity.
Bishop and Megicks (2002) argued that firms emphasise their strategic positions. It is because each industry has a unique business process and environment. Therefore, each industry type will respond differently to its business environment (Moss et al. 2013). Each type of industry has characteristics that affect how the industry reacts to the external environment (Moss et al. 2013). It implies that firms will emphasise their strategic positions differently (Bishop and Megicks 2002). There is a particular industry where the market is stable. Meanwhile, there is also a type of industry characterised by intense competition and fluctuation of market conditions. The FMCG industry is a type of industry that dynamically follows market changes. Product innovation is typical in the FMCG industry. Firms in this category will naturally actively seek out opportunities in the market with their knowledge and technology. Fast-growing firms adopt flexible (proactive) strategies, while slow-growing firms adopt a conservative approach by adopting a defensive strategy (Panda 2015). Findings in this study confirm that industry type (FMCG and non-FMCG) is significantly associated with a firm’s strategic orientation. The premise that mentions that the FMCG industry will be more likely to adopt a proactive strategy while non-FMCG will adopt a defensive approach is also validated.
Ownership (foreign and domestic ownership) is associated with the firm’s resources and capability. Foreign investors tend to have superior resources and abilities such as financial, technology, international networks, and know-how (Foster-Mcgregor et al. 2015). Acquisition of domestic firms by foreign investors, in general, is followed by the transfer of technology, managerial know-how, and good corporate governance practice (Genthner and Kis-Katos 2019). Domestically owned firms gain resources and capabilities from the transformation process of being MNCs. It will enable the domestic to compete in both local and global markets (Gaur and Delios 2015). Technology transfer from foreign investors allows domestic firms to conduct better product innovation (Othmani 2022). MNCs are generally capital-intensive rather than labour-intensive (Chhibber and Majumdar 1999). The utilisation of high technology in the production process enables MNCs to be more productive and efficient than domestic firms’ counterparts (Greenaway et al. 2014). Firms with majority ownership by foreign investors are expected to adopt a market-oriented (proactive) strategy. The finding in this study validates the premise that firms with foreign ownership majority have more tendency to adopt a proactive strategic orientation. However, statistically, it shows no significant sign (p > 0.05). An unbalanced sample between foreign and domestic ownership may cause it. Therefore, the role of ownership structure (foreign vs. domestic) on strategic orientation needs to be validated further in a future study.
Whether strategic orientation choice is influenced dominantly by organisational factors (firm characteristics) or external environmental factors is still an ongoing debate. The findings in this study confirm that organisational factors (size and industry type) strongly influence a firm’s strategic orientation. However, this does not mean that external factors did not play any role in determining organisational behaviour. External factors still have a notable influence, but their effect may not be as strong as that of internal environmental factors. If we look at the regression analysis result, it shows that the industry type is solid to be categorised as statistically significant (r < 0.0001) in influencing a firm’s strategic orientation. This implies that firm characteristics are essential in determining a firm’s strategic orientation. Aranda (2002) argued that a typical firm’s operation strategy is closely associated with firm characteristics in normal business conditions. However, when the business environment is uncertain, firms will consider the external environment to be the dominant factor determining the firm’s strategic orientation (Anwar and Hasnu 2017).

6.2. Business Environment as the Determinant of Strategic Orientation

This study proposed that besides internal factors (firm characteristics), strategic orientation is also affected by an external factor (business environment). The business environment in this study refers to market uncertainty and competition intensity. Market uncertainty is a business situation in which probabilities cannot be predicted easily (Chenhall 2003; Wong et al. 2011). It includes turbulence, hostility, diversity, complexity, ambiguity, and an uncontrollable business environment (Chenhall 2003; Hatch and Cunliffe 2012). Firms are affected by significant changes that create uncertainty in their micro and macro environment (Vecchiato 2012). Business uncertainties may be caused by financial markets, government regulation, competition, supply chain, and market fluctuation (DeSarbo et al. 2005). The primary force that generates market uncertainty is volatility in the market demand (Chenhall 2003). Significant fluctuation in terms of sales revenues is an indication of market uncertainty. Theoretically, firms will respond differently under different business environment conditions (certain vs. uncertain). The finding in this study indicates that market uncertainty did not significantly influence a firm’s strategic orientation. It implies that a short market demand fluctuation does not necessarily affect strategic orientation in time. Strategic orientation is not easy to change due to temporary dynamic market fluctuation.
Intense competition is characterised by sharing market share among multiple firms by offering a competitive price. The more intense competition, the more business organisations will do their best to enable firms to offer competitive prices. A competitive business environment forces organisations to maximise their potential, including operating cost efficiency (Casu and Girardone 2009; Guimaraes and Paranjape 2019; Ramaswamy 2001). Firms in a more competitive environment will likely improve efficiency by increasing capital investment (Chang and Gurbaxani 2013). Intense competition compels firms to minimise resources for profit maximisation (Fernández-Kranz and Santaló 2010). Miles and Snow’s typology identifies the defender and reactor as types of business strategies focusing on internal business processes rather than market opportunities. Therefore, firms are expected to adopt a defensive strategic orientation under intense business competition. This study confirms that competition intensity significantly influences a firm’s strategic orientation. The level of competition will determine whether firms will adopt a proactive or defensive strategic orientation. It implies that strategic orientation is not only affected by internal factors (firm characteristics) but also external factors (business environment).

6.3. The Implication of Strategic Orientation for Performance

This study found that strategic orientation positively and significantly influences firm performance (ROA). These findings are in line with previous research conducted by Anwar and Hasnu (2017), MacKinnon et al. (2012), and Stone-Romero and Rosopa (2010). The findings also confirmed that firms with a proactive strategic orientation have better business performance (ROA) than those with defensive ones. These findings are consistent with previous studies conducted by Grimmer et al. (2017), Madanoglu et al. (2014), and Peljhan et al. (2018). Proactive firms typically focus on market opportunities. They can exploit market opportunities and improve sales revenues and probability in dynamic market conditions. Meanwhile, a defensive strategic orientation focuses on operational efficiency. Even though defensive firms have advantages in reducing operating costs, they must catch up in following dynamic market changes. Firms with a defensive strategic orientation are losing the opportunity to increase revenues and profitability since they need to follow dynamic market changes. The positive influence of strategic orientation on performance needs to be validated for its consistency in the future. The robustness test in this study indicates that strategic orientation was not found positively significant when the performance was measured using the NPM and OPM. It implies that the influence of strategic orientation on firm performance may have different results if performance indicators are different.
Even though the study’s findings supported the hypotheses, some of the results needed to be more consistent with previous studies. Blackmore and Nesbitt (2013) and Parnell et al. (2012) found that a defensive strategic orientation resulted in better performance than a proactive one. Meanwhile, Shoham and Lev (2015) did not find any performance differences between Miles and Snow’s strategic orientation (defensive and proactive). Strategic orientation is not necessarily related to superior performance, but superior performance is a product of an appropriate match between the contingent factors (Cadez and Guilding 2008). Anwar and Hasnu (2016) argued that the differences in performance among strategic orientations result from external environments’ influence. Interactions between strategic orientation and environmental forces affect firm performance (Dominguez et al. 2015). It implies that the best strategy is not necessarily associated with optimum performance, but it depends on the external environment, such as the business conditions (Jusoh and Parnell 2008).
In general, a proactive strategic orientation outperforms a defensive one. However, in a particular industry, a defensive strategic orientation is superior to a proactive one (Anwar and Hasnu 2017). Strategic orientation, in some cases, is also associated with the external environment, such as business uncertainty (Aghajari and Senin 2014). This implies that firms can change their strategic orientation from proactive to defensive and vice versa to adjust to the external environment to achieve better performance. Panda (2015) suggested that small firms with a defensive strategic orientation should move from a traditional product-focused strategy to a flexible market-focused approach to improve growth. Empirical evidence in this study overall supports the idea that a proactive strategic orientation positively impacts a firm’s performance. However, business environment conditions must be considered to obtain the expected benefits of a proactive strategic orientation. External business environments such as competition intensity and market uncertainty must be regarded to determine proper strategic orientation.
Some studies have suggested that firm characteristics are contingent factors of strategic orientation and performance (Murthi et al. 2013). Using the contingency theory point of view, an organisation should have a functional fit among the elements of its environment, strategy, and structure (Luoma 2015). Hence, firm characteristics (structure) are not the only factors actively affecting a firm’s decision regarding strategic orientation. Barbosa (2013) found that the geographical location and external environment govern the relationship between firm growth and size. Strategic orientation should fit the external environment to attain expected firm performance (Anwar and Hasnu 2017). It implies that the strategic orientation chosen by firms may be conditional on the business environment (Panda 2015). Firms with sufficient resources and experience in the industry may choose a defensive strategy over a proactive approach when the external business environment is uncertain. Furthermore, the organisation’s internal factors should also be considered when studying the association between strategic orientation and firm performance. The analysis that has been conducted (model 3) proved that firm characteristics (size, age, and type) were found to have a positive and significant effect on performance. It implies that there is still expansive room to study the connection between strategic orientation and performance to understand it comprehensively.

7. Conclusions, Limitations, and Suggestions

The resource-based theory posits that firm characteristics imply resources and capabilities that can influence a firm’s strategic orientation. The study found a significant causal relationship between a firm’s size and industry type on strategic orientation. However, firm age and ownership failed to prove to be determinants of the firm’s strategic orientation. Small firms tended to adopt a proactive strategic orientation, and larger firms tended to adopt a defensive one. Proactive strategic orientation was closely associated with the typical firms in the FMCG industry. Meanwhile, a defensive strategic orientation type was adopted by the non-FMCG industry.
The organisation theory argues that firm behaviour is strongly affected by the internal and external factors of the organisation. Firm characteristics may not be the only factors that have a direct causal relationship with strategic orientation. External environments, such as business uncertainty and competition intensity, may influence a firm’s strategic orientation. The finding in this study indicated that competition intensity played a significant role in determining a firm’s strategic orientation. However, market uncertainty did not significantly affect a firm’s strategic orientation.
The implication of strategic orientation for firm performance was also revealed in this study. The study concluded that strategic orientation played a significant role in determining performance. However, the positive effect of strategic orientation on performance is not robust. The findings were inconsistent when measured with different performance indicators (OPM and NPM). The comparative performance between proactive firms and defensive firms showed significant differences. Firms that adopted a proactive strategic orientation tended to perform better than those with a defensive one.
Academically, these findings add to a growing literature on strategic management and organisational behaviour. Findings in this study may be helpful by adding sources of information from Southeast Asia country perspectives for comparative research with other regions. Practically, the results may be useful for the managers regarding strategic orientation that should be adopted to achieve better firm performance. Since the study was conducted in the manufacturing industry, findings in this study are also expected to provide valuable information for policymakers in developing industrialisation policy.
Our work has some limitations that need to be addressed. First, the sample involved in this study was limited to manufacturing firms only. Therefore, the findings in this study cannot represent other firms’ categories. Thus, future studies should consider including also nonmanufacturing firms. Second, the classification of ownership structure should be more specific. Breaking down ownership categories into foreign ownership, government ownership, and domestic private ownership is recommended. Third, this study focused on firm characteristics limited to size, age, industry type, and ownership but neglected other internal factors such as growth, market capitalisation, and industry sector. Fourth, the business environment is represented by business uncertainty and competition intensity only. Adding other macroeconomic conditions into the analysis will provide a more comprehensive understanding of the firm’s strategic orientation determinants.

Author Contributions

Conceptualisation, S.H. and S.M.; methodology, S.H. and E.K.G.; software, S.H.; validation, S.M., E.K.G. and S.S.; formal analysis, S.H.; investigation, S.H.; resources, S.H.; data curation, S.H. and S.S.; writing—original draft preparation, S.H.; writing—review and editing, S.H. and E.K.G.; visualisation, S.H.; supervision, S.M., E.K.G. and S.S. All authors have read and agreed to the published version of the manuscript.

Funding

This research received article processing charge support from Padjadjaran University.

Institutional Review Board Statement

Not applicable.

Informed Consent Statement

Not applicable.

Data Availability Statement

Data available upon request.

Conflicts of Interest

The authors declare no conflict of interest.

References

  1. Aghajari, Nezal, and Aslan Amat Senin. 2014. Strategic orientation and dual innovative operation strategies. Asia-Pacific Journal of Business Administration 6: 127–47. [Google Scholar] [CrossRef]
  2. Alhakimi, Wail, and Rohaizat Baharun. 2010. An Integrative Model of Market Orientation Constructs in Consumer Goods Industry: An Empirical Evidence. International Management Review 6: 40–54. [Google Scholar]
  3. Andrews, Rhys, George A. Boyne, Jennifer Law, and Richard M. Walker. 2009. Strategy Formulation, Strategy Content and Performance. Public Management Review 11: 1–22. [Google Scholar] [CrossRef]
  4. Anić, Ivan-Damir, Edo Rajh, and Ivan Teodorović. 2009. Firms’ characteristics, strategic factors and firms’ performance in the Croatian manufacturing industry. Ekonomski Pregled 60: 413–31. [Google Scholar]
  5. Anwar, Jamil, and S. A. F. Hasnu. 2016. Business strategy and firm performance: A multi-industry analysis. Journal of Strategy and Management 9: 361–82. [Google Scholar] [CrossRef]
  6. Anwar, Jamil, and S. A. F. Hasnu. 2017. Strategic patterns and firm performance: Comparing consistent, flexible and reactor strategies. Journal of Organizational Change Management 30: 1015–29. [Google Scholar] [CrossRef]
  7. Anwar, Jamil, S. A. F. Hasnu, Irfan Butt, and Nisar Ahmed. 2021. Miles and Snow Typology: Most influential journals, articles, authors and subject areas. Journal of Organizational Change Management 34: 385–402. [Google Scholar] [CrossRef]
  8. Arafat, M. Yasser, Ari Warokka, and Ruswiati Suryasaputra. 2014. Capital Structure and Investment Decision: What Does Emerging Consumer Goods Industry Tell Us? Journal of Financial Studies & Research, 1–11. [Google Scholar] [CrossRef] [Green Version]
  9. Aragon-Correa, J. Alberto, Nuria Hurtado-Torres, Sanjay Sharma, and Víctor J. García-Morales. 2008. Environmental strategy and performance in small firms: A resource-based perspective. Journal of Environmental Management 86: 88–103. [Google Scholar] [CrossRef]
  10. Aranda, Arias Daniel. 2002. Relationship between operations strategy and size in engineering consulting firms. International Journal of Service Industry Management 13: 263–85. [Google Scholar] [CrossRef] [Green Version]
  11. Audretsch, David B., and Max Keilbach. 2007. The Theory of Knowledge Spillover Entrepreneurship. Journal of Management Studies 44: 1242–54. [Google Scholar] [CrossRef] [Green Version]
  12. Ax, Christian, Jan Greve, and Ulf Nilsson. 2008. The impact of competition and uncertainty on the adoption of target costing. International Journal of Production Economics 115: 92–103. [Google Scholar] [CrossRef] [Green Version]
  13. Barbosa, Diana Marcela Escandón. 2013. Factors determining the appearance of ‘born global’ companies: Analysis of early internationalisation for SMES in Colombia. Pensamiento & Gestión 35: 206–23. [Google Scholar]
  14. Bentley, Kathleen A., Thomas C. Omer, and Nathan Y. Sharp. 2013. Business Strategy, Financial Reporting Irregularities, and Audit Effort. Contemporary Accounting Research 30: 780–817. [Google Scholar] [CrossRef]
  15. Bilgen, Bilge, and H. O. Günther. 2010. Integrated production and distribution planning in the fast moving consumer goods industry: A block planning application. OR Spectrum 32: 927–55. [Google Scholar] [CrossRef]
  16. Bishop, Paul, and Phil Megicks. 2002. Competitive strategy and firm size in the estate agency industry. Journal of Small Business and Enterprise Development 9: 150–61. [Google Scholar] [CrossRef]
  17. Blackmore, Karen, and Keith Nesbitt. 2013. Verifying the Miles and Snow strategy types in Australian small- and medium-size enterprises. Australian Journal of Management 38: 171–90. [Google Scholar] [CrossRef]
  18. Cadez, Simon, and Chris Guilding. 2008. An exploratory investigation of an integrated contingency model of strategic management accounting. Accounting, Organizations and Society 33: 836–63. [Google Scholar] [CrossRef] [Green Version]
  19. Casu, Barbara, and Claudia Girardone. 2009. Does Competition Lead to Efficiency? The Case of Eu commercial Banks. Working Paper Series; London: Centre for Banking Research. [Google Scholar]
  20. Cerrato, Daniele, and Mariacristina Piva. 2012. The internationalization of small and medium-sized enterprises: The effect of family management, human capital and foreign ownership. Journal of Management & Governance 16: 617–44. [Google Scholar] [CrossRef] [Green Version]
  21. Chang, Shih-Chia, Chen-Lung Yang, Hsin-Chia Cheng, and Chwen Sheu. 2003. Manufacturing flexibility and business strategy: An empirical study of small and medium sized firms. International Journal of Production Economics 83: 13–26. [Google Scholar] [CrossRef]
  22. Chang, Young Bong, and Vijay Gurbaxani. 2013. An Empirical Analysis of Technical Efficiency: The Role of IT Intensity and Competition. Information Systems Research 24: 561–78. [Google Scholar] [CrossRef]
  23. Chen, Clara Xiaoling, Ella Mae Matsumura, Jae Yong Shin, and Steve Yu-Ching Wu. 2015. The effect of competition intensity and competition type on the use of customer satisfaction measures in executive annual bonus contracts. Accounting Review 90: 229–63. [Google Scholar] [CrossRef]
  24. Chen, Ming-Jer, and Donald C. Hambrick. 1995. Speed, Stealth, and Selective Attack: How Small Firms Differ From Large Firms in Competitive Behavior. Academy of Management Journal 38: 453–82. [Google Scholar] [CrossRef]
  25. Chen, Xiaoyun, Alex Xin Chen, and Kevin Zheng Zhou. 2014. Strategic Orientation, Foreign Parent Control, and Differentiation Capability Building of International Joint Ventures in an Emerging Market. Journal of International Marketing 22: 30–49. [Google Scholar] [CrossRef]
  26. Chen, Zhixiang, and Kim Hua Tan. 2013. The impact of organization ownership structure on JIT implementation and production operations performance. International Journal of Operations & Production Management 33: 1202–29. [Google Scholar] [CrossRef]
  27. Chenhall, Robert H. 2003. Management control systems design within its organizational context: Findings from contingency-based research and directions for the future. Accounting, Organizations and Society 28: 127–68. [Google Scholar] [CrossRef]
  28. Chereau, Philippe, and Pierre-Xavier Meschi. 2019. The performance implications of the strategy–business model fit. Journal of Small Business and Enterprise Development 26: 441–63. [Google Scholar] [CrossRef]
  29. Chhibber, Pradeep K., and Sumit K. Majumdar. 1999. Foreign Ownership and Profitability: Property Rights, Control, and the Performance of Firms in Indian Industry. The Journal of Law and Economics 42: 209–38. [Google Scholar] [CrossRef]
  30. Chupradit, Supat, Dai Yannan, Hafiz Waqas Kamran, Sadaf S. Soudagar, Alaa Mohamd Shoukry, and Jameel A. Khader. 2021. Measuring technical efficiency associated with environmental investment: Does market competition and risk matters in banking sector. Environmental Science and Pollution Research 28: 66575–88. [Google Scholar] [CrossRef]
  31. Cohen, Sandra, Vassilios-Christos Naoum, and Orestes Vlismas. 2014. Intellectual capital, strategy and financial crisis from a SMEs perspective. Journal of Intellectual Capital 15: 294–315. [Google Scholar] [CrossRef]
  32. Daft, Richard L., Jonathan Murphy, and Hugh Willmott. 2020. Organization Theory Design: An International Perspective. Singapore: CENGAGE. [Google Scholar]
  33. Dean, Thomas J., Robert L. Brown, and Charles E. Bamford. 1998. Differences in large and small firm responses to environmental context: Strategic implications from a comparative analysis of business formations. Strategic Management Journal 19: 709–28. [Google Scholar] [CrossRef]
  34. Derqui, Belén, Teresa Fayos, and Nicoletta Occhiocupo. 2022. The virtuous cycle of trust. Unveiling clues to successful innovation in the Fast Moving Consumer Goods industry. European Journal of Innovation Management 25: 1036–56. [Google Scholar] [CrossRef]
  35. DeSarbo, Wayne S., C. Anthony Di Benedetto, Michael Song, and Indrajit Sinha. 2005. Revisiting the Miles and Snow strategic framework: Uncovering interrelationships between strategic types, capabilities, environmental uncertainty, and firm performance. Strategic Management Journal 26: 47–74. [Google Scholar] [CrossRef]
  36. Diehl, Doreen, and Stefan Spinler. 2013. Defining a common ground for supply chain risk management—A case study in the fast-moving consumer goods industry. International Journal of Logistics Research and Applications 16: 311–27. [Google Scholar] [CrossRef]
  37. Djajadikerta, Hadrian Geri, and Terri Trireksani. 2012. Corporate social and environmental disclosure by Indonesian listed companies on their corporate web sites. Journal of Applied Accounting Research 13: 21–36. [Google Scholar] [CrossRef]
  38. Dominguez, Marta, Jose Luís Galán-González, and Carmen Barroso. 2015. Patterns of strategic change. Journal of Organizational Change Management 28: 411–31. [Google Scholar] [CrossRef]
  39. Douma, Sytse, Rejie George, and Rezaul Kabir. 2006. Foreign and domestic ownership, business groups, and firm performance: Evidence from a large emerging market. Strategic Management Journal 27: 637–57. [Google Scholar] [CrossRef]
  40. Feimianti, Elisabeth, and Samuel Anantadjaya. 2014. Value Creation of Intellectual Capital: Financial Performance Analyses in Indonesian Publicly-Listed Consumer Goods Industry. RIBER: Review of Integrated Business and Economics Research 3: 99–113. [Google Scholar]
  41. Fernández-Kranz, Daniel, and Juan Santaló. 2010. When Necessity Becomes a Virtue: The Effect of Product Market Competition on Corporate Social Responsibility. Journal of Economics & Management Strategy 19: 453–87. [Google Scholar] [CrossRef]
  42. Foster-Mcgregor, Neil, Anders Isaksson, and Florian Kaulich. 2015. Foreign Ownership and Performance in Sub-Saharan African Manufacturing and Services. Journal of International Development 27: 1197–222. [Google Scholar] [CrossRef]
  43. Frishammar, Johan, and Sven Åke Hörte. 2007. The Role of Market Orientation and Entrepreneurial Orientation for New Product Development Performance in Manufacturing Firms. Technology Analysis & Strategic Management 19: 765–88. [Google Scholar] [CrossRef]
  44. Gaur, Ajai, and Andrew Delios. 2015. International Diversification of Emerging Market Firms: The Role of Ownership Structure and Group Affiliation. Management International Review 55: 235–53. [Google Scholar] [CrossRef]
  45. Genthner, Robert, and Krisztina Kis-Katos. 2019. Foreign Investment Regulation and Firm Productivity: Granular Evidence From Indonesia. Journal of Comparative Economics 50: 668–87. [Google Scholar] [CrossRef]
  46. Ghofar, Abdul, and Sardar M. N. Islam. 2015. Corporate Governance and Contingency Theory: A Structural Equation Modeling Approach and Accounting Risk Implications. Berlin/Heidelberg: Springer. [Google Scholar]
  47. Godos-Díez, José-Luis, Laura Cabeza-García, Almudena Martínez-Campillo, and Roberto Fernández-Gago. 2020. The Importance of Firm Size and Development Strategies for CSR Formalisation. In Adapting to Environmental Challenges: New Research in Strategy and International Business. Bingley: Emerald Group Publishing, pp. 107–31. [Google Scholar]
  48. Graubner, Michael. 2006. Task, Firm Size, and Organizational Structure in Management Consulting: An Empirical Analysis from a Contingency Perspective. Wiesbaden: Deutscher Universitaets Verlag. [Google Scholar]
  49. Greenaway, David, Alessandra Guariglia, and Zhihong Yu. 2014. The more the better? Foreign ownership and corporate performance in China. European Journal of Finance 20: 681–702. [Google Scholar] [CrossRef]
  50. Grimmer, Louise, Morgan P. Miles, John Byrom, and Martin Grimmer. 2017. The Impact of Resources and Strategic Orientation on Small Retail Firm Performance. Journal of Small Business Management 55: 7–26. [Google Scholar] [CrossRef]
  51. Guadalupe, Maria, Olga Kuzmina, and Catherine Thomas. 2012. Innovation and Foreign Ownership. American Economic Review 102: 3594–627. [Google Scholar] [CrossRef] [Green Version]
  52. Guilding, Chris, Colin Drury, and Mike Tayles. 2005. An empirical investigation of the importance of cost-plus pricing. Managerial Auditing Journal 20: 125–37. [Google Scholar] [CrossRef] [Green Version]
  53. Guimaraes, Tor, and Ketan Paranjape. 2019. Competition intensity as moderator for NPD success. International Journal of Innovation Science 11: 618–47. [Google Scholar] [CrossRef]
  54. Habib, Ahsan, and Mostafa Monzur Hasan. 2017. Business strategy, overvalued equities, and stock price crash risk. Research in International Business and Finance 39: 389–405. [Google Scholar] [CrossRef]
  55. Habib, Ahsan, Mahmud Hossain, and Haiyan Jiang. 2011. Environmental uncertainty and the market pricing of earnings smoothness. Advances in Accounting 27: 256–65. [Google Scholar] [CrossRef]
  56. Hannan, Michael T., Glenn R. Carroll, Stanislav D. Dobrev, and Joon Han. 1998. Organizational mortality in European and American automobile industries Part I: Revisiting the effects of age and size. European Sociological Review 14: 279–302. [Google Scholar] [CrossRef] [Green Version]
  57. Hatch, Mary Jo, and Ann L. Cunliffe. 2012. Organization Theory Modern, Symbolic and Postmodern Perspectives, 3rd ed. Oxford: Oxford University Press. [Google Scholar]
  58. Helmig, Bernd, Vera Hinz, and Stefan Ingerfurth. 2014. Extending Miles & Snow’s strategy choice typology to the German hospital sector. Health Policy 118: 363–76. [Google Scholar] [CrossRef] [PubMed]
  59. Higgins, Danielle, Thomas C. Omer, and John D. Phillips. 2015. The Influence of a Firm’s Business Strategy on its Tax Aggressiveness. Contemporary Accounting Research 32: 674–702. [Google Scholar] [CrossRef]
  60. Holm, Morten, and Christian Ax. 2020. The interactive effect of competition intensity and customer service competition on customer accounting sophistication—Evidence of positive and negative associations. Management Accounting Research 46. [Google Scholar] [CrossRef]
  61. Ismail, Alimin Ismadi, Raduan Che Rose, Haslinda Abdullah, and Jegak Uli. 2010. The relationship between organisational competitive advantage and performance moderated by the age and size of firms. Asian Academy of Management Journal 15: 157–73. [Google Scholar]
  62. Ittner, Christopher D., David F. Larcker, and Madhav V. Rajan. 1997. The choice of performance measures in annual bonus contract. The Accounting Review 72: 231–55. [Google Scholar]
  63. Jaffee, David. 2001. Organization Theory Tension and Change, 1st ed. New York: McGraw-Hill. [Google Scholar]
  64. Jaworski, Bernard J., and Ajay K. Kohli. 1993. Market Orientation: Antecedents and Consequences. Journal of Marketing 57: 53–70. [Google Scholar] [CrossRef]
  65. Jiang, Crystal X., Roy Y. J. Chua, Masaaki Kotabe, and Janet Y. Murray. 2011. Effects of cultural ethnicity, firm size, and firm age on senior executives’ trust in their overseas business partners: Evidence from China. Journal of International Business Studies 42: 1150–73. [Google Scholar] [CrossRef]
  66. Jones, Gareth R. 2013. Organizational Theory, Design, and Change, 7th ed. Edinburg: Pearson. [Google Scholar]
  67. Jusoh, Ruzita, and John A. Parnell. 2008. Competitive strategy and performance measurement in the Malaysian context. Management Decision 46: 5–31. [Google Scholar] [CrossRef]
  68. Ke, Qiulin, David Isaac, and Peter Dalton. 2008. The determinants of business performance of estate agency in England and Wales. Property Management 26: 255–72. [Google Scholar] [CrossRef]
  69. Khan, Md Habib-Uz-Zaman, Rafiuddin Ahmed, and Abdel Karim Halabi. 2010. The roles of degree of competition and types of business strategies in adopting multiple performance measurement practices: Some reflections from bangladesh. In Research in Accounting in Emerging Economies. Bingley: Emerald Group Publishing Limited, pp. 201–32. [Google Scholar]
  70. Lawrence, Paul R., and Jay W. Lorsch. 1967. Organization and Environment Managing Differentiation and Integration. Cambridge: Harvard University. [Google Scholar]
  71. Lechner, Christian, Birthe Soppe, and Michael Dowling. 2016. Vertical Coopetition and the Sales Growth of Young and Small Firms. Journal of Small Business Management 54: 67–84. [Google Scholar] [CrossRef]
  72. Luoma, Mikko Antero. 2015. Revisiting the strategy-performance linkage. Management Decision 53: 1083–106. [Google Scholar] [CrossRef]
  73. MacKinnon, David P., Stefany Coxe, and Amanda N. Baraldi. 2012. Guidelines for the Investigation of Mediating Variables in Business Research. Journal of Business and Psychology 27: 1–14. [Google Scholar] [CrossRef] [Green Version]
  74. Madanoglu, Melih, Fevzi Okumus, and Umut Avci. 2014. Building a case against strategic equifinality. Management Decision 52: 1174–93. [Google Scholar] [CrossRef]
  75. Mahajan, Varun, Dinesh Kumar Nauriyal, and S. P. Singh. 2018. Efficiency and Its Determinants: Panel Data Evidence from the Indian Pharmaceutical Industry. Margin: The Journal of Applied Economic Research 12: 19–40. [Google Scholar] [CrossRef] [Green Version]
  76. Mia, Lokman, and Brian Clarke. 1999. Market competition, management accounting systems and business unit performance. Management Accounting Research 10: 137–58. [Google Scholar] [CrossRef]
  77. Miles, Raymond, and Charles Snow. 1978. Organizational Strategy, Structure, and Process. New York: McGraw-Hill. [Google Scholar]
  78. Moss, Todd W., G. Tyge Payne, and Curt B. Moore. 2013. Strategic Consistency of Exploration and Exploitation in Family Businesses. Family Business Review 27: 51–71. [Google Scholar] [CrossRef]
  79. Murthi, B. P. S., Abdul A. Rasheed, and Irene Goll. 2013. An Empirical Analysis of Strategic Groups in the Airline Industry using Latent Class Regressions. Managerial and Decision Economics 34: 59–73. [Google Scholar] [CrossRef]
  80. Narteh, Bedman, and George Acheampong. 2018. Foreign participation and internationalization intensity of African enterprises. International Marketing Review 35: 560–79. [Google Scholar] [CrossRef]
  81. Navissi, Farshid, V. G. Sridharan, Mehdi Khedmati, Edwin KiaYang Lim, and Egor Evdokimov. 2016. Business Strategy, Over- (Under-) Investment, and Managerial Compensation. Journal of Management Accounting Research 29: 63–86. [Google Scholar] [CrossRef]
  82. Nkundabanyanga, Stephen Korutaro, Elizabeth Mugumya, Irene Nalukenge, Moses Muhwezi, and Grace Muganga Najjemba. 2019. Firm characteristics, innovation, financial resilience and survival of financial institutions. Journal of Accounting in Emerging Economies 10: 48–73. [Google Scholar] [CrossRef]
  83. O’Cass, Aron, and Craig Julian. 2003. Examining firm and environmental influences on export marketing mix strategy and export performance of Australian exporters. European Journal of Marketing 37: 366–84. [Google Scholar] [CrossRef] [Green Version]
  84. Otache, Innocent. 2019. The mediating effect of teamwork on the relationship between strategic orientation and performance of Nigerian banks. European Business Review 31: 744–60. [Google Scholar] [CrossRef]
  85. Othmani, Hidaya. 2022. Foreign institutional ownership and bank performance: Evidence from Tunisia. African Development Review 34: 42–53. [Google Scholar] [CrossRef]
  86. Ozer, Mine, and Lívia Markóczy. 2010. Complementary or alternative? The effects of corporate political strategy on innovation. Journal of Strategy and Management 3: 252–72. [Google Scholar] [CrossRef]
  87. Özgen Narcı, Hacer, Yasar A. Ozcan, İsmet Şahin, Menderes Tarcan, and Mustafa Narcı. 2015. An examination of competition and efficiency for hospital industry in Turkey. Health Care Management Science 18: 407–18. [Google Scholar] [CrossRef]
  88. Pan, Yigang. 1996. Influences on Foreign Equity Ownership Level in Joint Ventures in China. Journal of International Business Studies 27: 1–26. [Google Scholar] [CrossRef]
  89. Panda, Debadutta. 2015. Growth determinants in small firms: Drawing evidence from the Indian agro-industry. International Journal of Commerce and Management 25: 52–66. [Google Scholar] [CrossRef]
  90. Park, Eung Ho, and Yadong Luo. 2001. Guanxi and Organizational Dynamics: Organizational Networking in Chinese Firms. Strategic Management Journal 22: 455–77. [Google Scholar] [CrossRef]
  91. Parnell, John A., Donald L. Lester, Zhang Long, and Mehmet Ali Köseoglu. 2012. How environmental uncertainty affects the link between business strategy and performance in SMEs. Management Decision 50: 546–68. [Google Scholar] [CrossRef]
  92. Peljhan, Darja, Danijela Miloš Sprčić, and Mojca Marc. 2018. Chapter 4 Strategy and Organizational Performance: The Role of Risk Management System Development. In Performance Measurement and Management Control: The Relevance of Performance Measurement and Management Control Research. Bingley: Emerald Group Publishing, pp. 65–91. [Google Scholar]
  93. Peng, Li, Yuan Li, Marc van Essen, and Mike W. Peng. 2020. Institutions, resources, and strategic orientations: A meta-analysis. Asia Pacific Journal of Management 37: 499–529. [Google Scholar] [CrossRef]
  94. Peng, Mike W., Garry D. Bruton, Ciprian V. Stan, and Yuanyuan Huang. 2016. Theories of the (state-owned) firm. Asia Pacific Journal of Management 33: 293–317. [Google Scholar] [CrossRef]
  95. Petersen, Mitchell A., and Raghuram G. Rajan. 1995. The Effect of Credit Market Competition on Lending Relationships. The Quarterly Journal of Economics 110: 407–43. [Google Scholar] [CrossRef]
  96. Pleshko, Larry P., and Richard A. Heiens. 2011. A contingency theory approach to market orientation and related marketing strategy concepts: Does fit relate to share performance? Academy of Banking Studies Journal 10: 119–33. [Google Scholar]
  97. Ramaswamy, Kannan. 2001. Organizational ownership, competitive intensity, and firm performance: An empirical study of the Indian manufacturing sector. Strategic Management Journal 22: 989–98. [Google Scholar] [CrossRef]
  98. Ramaswamy, Kannan, and William Renforth. 1996. Competitive intensity and technical efficiency in public sector firms: Evidence from India. International Journal of Public Sector Management 9: 4–17. [Google Scholar] [CrossRef]
  99. Ramstetter, Eric D. 1999. Trade propensities and foreign ownership shares in Indonesian manufacturing. Bulletin of Indonesian Economic Studies 35: 43–66. [Google Scholar] [CrossRef]
  100. Saraç, Mehlika. 2019. Which firms outperform the others under uncertainty: Revisiting miles and snow typology. International Journal of Social Inquiry 12: 261–85. [Google Scholar]
  101. Schaeck, Klaus, and Martin Cihak. 2008. How Does Competition Affect Efficiency and Soundness in Banking? New Empirical Evidence (September 30, 2008). ECB Working Paper. Frankfurt am Main: European Central Bank. [Google Scholar]
  102. Shinkle, George A., and Aldas P. Kriauciunas. 2009. Institutions, size and age in transition economies: Implications for export growth. Journal of International Business Studies 41: 267–86. [Google Scholar] [CrossRef]
  103. Shoham, Aviv, and Sara Lev. 2015. The Miles and Snow Strategic Typology and its Performance Implications. In Global Perspectives in Marketing for the 21st Century. Cham: Springer. [Google Scholar]
  104. Sternad, Dietmar. 2012. Adaptive Strategies in Response to the Economic Crisis: A Cross-Cultural Study in Austria and Slovenia. Managing Global Transitions 10: 257–82. [Google Scholar]
  105. Stone-Romero, Eugene F., and Patrick J. Rosopa. 2010. Experimental Tests of Mediation Models. Organizational Research Methods 14: 631–46. [Google Scholar] [CrossRef]
  106. Varma, Siddharth, Subhash Wadhwa, and S. G. Deshmukh. 2006. Implementing supply chain management in a firm: Issues and remedies. Asia Pacific Journal of Marketing and Logistics 18: 223–43. [Google Scholar] [CrossRef]
  107. Vecchiato, Riccardo. 2012. Strategic foresight and environmental uncertainty: A research agenda. Foresight 14: 387–400. [Google Scholar] [CrossRef]
  108. Wang, Jian, and Xiao Wang. 2015. Benefits of foreign ownership: Evidence from foreign direct investment in China. Journal of International Economics 97: 325–38. [Google Scholar] [CrossRef] [Green Version]
  109. Wheelen, Thomas L., J. David Hunger, Alan N. Hoffman, and Charles E. Bamford. 2018. Strategic Management and Business Policy: Globalization, Innovation and Sustainability, 15th ed. London: Pearson. [Google Scholar]
  110. Wiwattanakantang, Yupana. 2001. Controlling shareholders and corporate value: Evidence from Thailand. Pacific-Basin Finance Journal 9: 323–62. [Google Scholar] [CrossRef] [Green Version]
  111. Wong, Chee Yew, Sakun Boon-itt, and Christina W. Y. Wong. 2011. The contingency effects of environmental uncertainty on the relationship between supply chain integration and operational performance. Journal of Operations Management 29: 604–15. [Google Scholar] [CrossRef]
  112. Yannopoulos, Peter. 2011. Defensive and Offensive Strategies for Market Success. International Journal of Business and Social Science 2: 1–12. [Google Scholar]
  113. Yasuda, Takehiko. 2005. Firm Growth, Size, Age and Behavior in Japanese Manufacturing. Small Business Economics 24: 1–15. [Google Scholar] [CrossRef]
  114. Zahra, Shaker A., and John A. Pearce. 1990. Research Evidence On The Miles-Snow Typology. Journal of Management 16: 751–68. [Google Scholar] [CrossRef]
Figure 1. Research model.
Admsci 13 00074 g001
Table 1. Business strategy scoring.
Strategy TypeRange Total Composite Index ScoreStrategic OrientationNominal Type of Data
Reactor≥0 < 5Defensive1
Defender≥5 < 10
Analyser≥10 < 15Proactive2
Prospector≥15
Table 2. Model fitness to data set test.
Statistical TestChi-SquareProbability
Chow Test63.0704600.0000
Hausman Test0.00000001.0000
Table 3. Panel data regression analysis on strategic orientation.
Method:Panel EGLS (Period Random Effects)
Model:Model 1
Dependent Variable: Strategic Orientation
Independent Variables:CoefficientStd. Errort-statProb.
Firm size (size)−0.2053940.055867−3.6764590.0002 *
Firm age (age)−0.0090530.004902−1.8467220.0651
Industry type (type)3.2798820.19645516.695350.0000 **
Ownership (own)0.1616590.1808980.8936450.3717
Market uncertainty (muncer)−0.9001841.928104−0.4668750.6407
Competition intensity (comin)0.3771670.1486962.5364920.0113 *
Constant6.3673661.6374053.8886930.0001
Model Summary
R-squared0.238827
Adjusted R-squared0.234337
S.E. of regression2.710290
F-statistic53.18270
Prob (F-Statistic) 0.000000
* p < 0.05, ** p < 0.0001.
Table 4. Panel data regression analysis on strategic orientation.
Method:Panel EGLS (Period Random Effects)
Dependent Variable:Performance (ROA)
Model:Model 2Model 3
Independent Variables:CoefficientProb.CoefficientProb.
Strategic orientation 0.0078530.0000 **0.0056130.0000 **
Firm size--0.0142540.0000 **
Firm age --0.0015410.0000 **
Industry type --0.0432190.0000 **
Ownership--−0.0180790.0147 *
Market uncertainty--−0.0205940.7940
Competition intensity --0.0066730.2742
Constant−0.0108460.3391−0.4431980.0000
Model Summary
R-squared0.0409490.172889
Adjusted R-squared0.0400100.167190
S.E. of regression0.1197110.111596
F-statistic43.6362130.33885
Prob (F-Statistic)0.0000000.000000
* p < 0.05, ** p < 0.0001.
Table 5. Test of data normality.
Dependent VariableGroup VariableShapiro–WilkProbability
Firm sizeDefensive0.938<0.001
Proactive0.937<0.001
Firm ageDefensive0.761<0.001
Proactive0.786<0.001
Firm typeDefensive0.417<0.001
Proactive0.633<0.001
OwnershipDefensive0.621<0.001
Proactive0.627<0.001
PerformanceDefensive0.678<0.001
Proactive0.914<0.001
Table 6. Independent-samples t-test.
ComparativeMann–WhitneyProbabilityEffect Size
Firm Size Difference:
Proactive versus defensive strategy
143,125.500<0.0010.136
Firm Age Difference:
Proactive versus defensive strategy
124,890.0000.816−0.009
Firm Type Difference:
Proactive versus defensive strategy
87,659.500<0.001−0.304
Ownership Difference:
Proactive versus defensive strategy
123,395.5000.514−0.020
Performance difference:
Proactive versus defensive strategy
93,131.500<0.001−0.261
Table 7. Group descriptive statistics.
VariableGroupNMeanSD *S.E **CV ***
Firm SizeDefensive strategy61321.8421.5710.0630.072
Proactive strategy41121.5061.6490.0810.077
Firm AgeDefensive strategy61340.23217.8370.7200.443
Proactive strategy41140.21918.6060.9180.463
Industry TypeDefensive strategy6131.1440.3510.0140.307
Proactive strategy4111.4480.4980.0250.344
Ownership Defensive strategy6131.3980.4900.0200.350
Proactive strategy4111.4180.4940.0240.348
PerformanceDefensive strategy6130.0430.1270.0052.949
Proactive strategy4110.0820.1110.0051.354
* Standard deviation, ** standard error, *** coefficient of variation.
Table 8. Robustness Test.
Method:Panel EGLS (Period Random Effects)
Dependent Variables: Performance
Dependent Variable: ROAOPMNPM
Independent Variable:CoefficientProbCoefficientProbCoefficientProb
Strategic orientation (straor)0.0078530.0000 *0.0268250.2640−3.4463980.4936
Constant−0.0108460.3391−0.3060940.175945.911500.3322
Model Summary
R-squared0.0409490.0012200.000460
Adjusted R-squared0.0400100.000242−0.000518
S.E. of regression0.1197112.428608508.7173
F-statistic43.636211.2479170.469882
Prob (F-Statistic)0.0000000.2642130.493197
* p < 0.0001.
Disclaimer/Publisher’s Note: The statements, opinions and data contained in all publications are solely those of the individual author(s) and contributor(s) and not of MDPI and/or the editor(s). MDPI and/or the editor(s) disclaim responsibility for any injury to people or property resulting from any ideas, methods, instructions or products referred to in the content.

