Article

Linking Patient Experience to Customer Delight in the Private Laboratory Service

1
Department of Hospital Administration, Faculty of Economics and Business, Universitas Pelita Harapan, South Jakarta 12930, Indonesia
2
Medical Education Study Program, Faculty of Medicine, IPB University, Bogor 16680, Indonesia
*
Author to whom correspondence should be addressed.
Adm. Sci. 2023, 13(3), 71; https://doi.org/10.3390/admsci13030071
Submission received: 29 November 2022 / Revised: 20 February 2023 / Accepted: 22 February 2023 / Published: 27 February 2023

Abstract

:
The goal of this study was to analyse the influence of the antecedents of patient experience, namely staff appearance, laboratory staff attitude, information clarity, staff responsiveness, laboratory ambience, phlebotomy process, laboratory technology, and report results, which furtherly generate customer delight and drive favourable intentions such as revisit intentions to the laboratory and willingness to share and post on social media. By extending earlier studies and using data from a leading private clinical laboratory service, this study suggests a new insight. A quantitative study with a survey is used with a cross-sectional data approach. The sample was taken purposively from customers who have had laboratory services at the laboratory, particularly from customers who have undergone the phlebotomy process. The 186 samples that complied with the criteria were examined using the PLS-SEM method. The findings demonstrated that the eight antecedents show a high probability of influencing the patient experience, with the phlebotomy process found as the predominant antecedent, followed by laboratory staff attitude and patient perception of laboratory technology. Further, this study found strong evidence that patient experience could generate customer delight, which drives the revisit intention and willingness to share and post positive things on social media. Openness is found to strengthen that process. The results of this study revealed that the higher the patient’s experience through their journey, the higher the probability of delight could exist in the context of service provided in the private clinical laboratory. Thus, it is worth considering by the clinic management to develop a more effective business.

1. Introduction

As the standard of living increases, the quality of services by healthcare providers will also increase. In comprehensive health services, the continuum of healthcare would not be complete without clinical laboratories (Balter et al. 2018). Clinical laboratories carry out examinations of bodily samples that are utilised in diagnosing and treating patients (Piazza et al. 2019). Nowadays, there are more and more services provided by private clinical laboratories; these stand-alone laboratories are mostly separate from hospital management and often operate as chain laboratories across the country. The clinical laboratory healthcare industry documented significant growth worldwide due to recent developments in diagnostic techniques, the growing geriatric population, and the growth of chronic diseases (Philip et al. 2021; Ying et al. 2022).
Currently, the global market for clinical laboratory services is expected to grow faster (Greaves et al. 2019). According to a survey by WiseGuyReports.com, the global market for clinical laboratory services was valued at USD 205.56 billion in 2016 and is projected to expand to USD 333.45 billion by 2023, with a compound annual growth rate (CAGR) of 7.1 percent. The global market for clinical laboratory services is spread out into four main regions, including the Americas, Asia Pacific, Europe, and the Middle East and Africa. The Asia Pacific region is predicted to grow higher among other regions by more than 6 per cent (Dalurzo et al. 2021), which is dominated by India and Indonesia. The stand-alone laboratory segment appeared as the largest market share in the global market, related to the extensive test lists, the availability of new tests and biomarkers, and advancements in genomes and proteomics technology. Clinical laboratory services generally can be classified into biochemistry tests, endocrinology, microbiology, hematology, histopathology, cytology, and genetic testing. Those laboratory examination results are pivotal for clinicians to establish and ensure patient diagnoses, avoid unnecessary therapy, and minimise costs that are in line with a patient-centric approach (Yatham et al. 2018). On the business side, new testing areas, such as genome testing, are creating significant growth that generates substantial revenue for the laboratories (Pettitt et al. 2016).
Indonesia’s insurance-based healthcare system already covers 241 million people out of 273 million people (Indonesia Social Security Agency of Health 2022). However, middle-upper-level customers are still looking for premium services by using private insurance or out-of-pocket money. They are usually looking for hospitals with premium services and other supporting health facilities such as laboratories and clinics that also provide premium services. According to the Indonesian Ministry of Health (2022), there are 1496 private hospitals of various types in 2021, generally concentrated on the Island of Java. Meanwhile, there are around 1026 public hospitals and 10,292 primary healthcare facilities across the country. Because of tight competition in health services by the private sector, effective marketing strategies are needed.
In the competition among clinical laboratory providers, each of the providers tries to deliver superior service and create an impressive experience. A pleasant patient experience (PEX) can create a high degree of an emotional state beyond satisfaction (Oliver et al. 1997). This is known as customer delight (CDL), which can be formed when someone is comfortable with the service and gets an arousal feeling (Barnes and Krallman 2019). Customer delight is an emotional response more than a cognitive evaluation, and it can lead to the customer’s behavioural intention (Parasuraman et al. 2020). There are the elements of surprise, excitement, and arousal feeling co-existing in CDL that is involved in customer decisions (Barnes and Krallman 2019). Empirically, CDL can have a positive effect on intentions to support business performance (Shoukat and Ramkissoon 2022), as also in the healthcare sector (Anggiani et al. 2021). Unfortunately, there has been limited research focusing on delight in laboratory services, although there is a promising touch point that can be used to create delight. Thereof, the research model with CDL, which is devoted to private clinical laboratories, is expected to provide new insight.
Service quality in clinical laboratories is commonly done through patient satisfaction, which is carried out based on the theory of customer satisfaction with a confirmation-expectation approach (Oliver et al. 1997). However, there is an enigma with patient expectations, since patients generally do not have medical knowledge and are in an illness condition, which can affect their expectations (Van Campen et al. 1995). Moreover, patient satisfaction is evaluated by the service delivery, but less by the outcome of the quality of care (Swain and Kar 2018). Therefore, a holistic approach raised from the customer experiential concept is considered more useful (Schmitt 1999). This is in accordance with the concept of PEX in healthcare services (Wolf et al. 2014), which is defined as the total sum of experience from the contact points between patients and their healthcare providers and supporting facilities. In the healthcare sector, PEX has been widely used to measure care quality, such as outpatient experience (Li and Garrat 2005). However, the applicability of this concept in particular laboratory services is scarce. Likewise, the factors that can explain the patient’s response to comprehensive services is formed.
Some of the previous studies were conducted in labs operated by government facilities (Hailu et al. 2020; Khatri and Sharma 2021; Ramessur et al. 2015), while research conducted in private labs is still limited. Few studies conducted in private labs use satisfaction measurement (Almatrafi et al. 2018; Levana and Antonio 2022). However, the labs that compete with the service-excellent strategy need more than a satisfaction measurement, and researchers were challenged to explore other variables beyond satisfaction (Hefner et al. 2019). Moreover, studies related to service in the lab generally use a service quality framework, but this approach only touches on functional aspects and does not include technical aspects (Endeshaw 2020; Swain and Kar 2018). Therefore, another aspect of quality also needs to be explored in relation to patient experience.
Experience is known to be able to predict behaviour intention directly (Fatma 2014), such as revisit intention (RVI) (Shoukat and Ramkissoon 2022), even though this effect is rarely tested in the healthcare sector. According to Klaus and Maklan (2013), experience quality influences satisfaction and then affects loyalty. It seems that experience may need to be mediated by high levels of emotions that manifest in delight, as revealed by Collier et al. (2018). Arousal feelings that generate from PEX may have a stronger predictive ability to behaviour intention (Barnes and Krallman 2019). Hence, the private clinical laboratory that delivers superior service in healthcare should go beyond patient satisfaction (Wu et al. 2011; Hefner et al. 2019; Shoukat and Ramkissoon 2022). Thus, CDL becomes the desirable construct. This study emphasised CDL as the mediator of PEX to RVI and the willingness to share and post positive comments on social media. Nowadays, people are more affected by the information from digital platforms. Thus, making patients express their experiences on social media is effective in luring in new patients while keeping hold of the existing ones (Angela Trunfio et al. 2021).
The social cognitive theory (Bandura 1989) shows that there is a certain determination and process in individuals that could evolve, thus affecting behaviour intention. This theory emphasised that aside from stimuli from outside, individual decision-making is influenced by self-learning capability and also involves self-motivation that relates to personality. This is in accordance with the self-determination theory which revealed the relationship between human motivation and personality (Ryan and Deci 2020). A previous study has shown different results depending on personality type, where certain personality types tend to have a stronger influence on behaviour (Srisawatsakul et al. 2014). This may also apply in the healthcare sector. Thus, personality traits could act as moderators toward behavioural intention.
Based on the above considerations, three research questions (RQ) can be formulated as follows:
RQ1:
What are the antecedents of PEX in a private clinical laboratory service?
RQ2:
To what extent can PEX generate CDL and what is the further impact on behaviour intention?
RQ3:
Do personality traits play a role in moderating delight toward behaviour intention?
To answer the research questions above, a research model was developed, consisting of eight independent variables as antecedents of PEX that integrate both functional and technical qualities, namely staff appearance (SAP), LSA, information clarity (IFC), staff responsiveness (SRV), laboratory ambience (LAB), PHP, laboratory technology (LTC), and report results (RST). Further, this research model links the PEX to CDL and its impact on the two dependent variables, namely RVI and the willingness to share and post on social media (WSP). Those two behavioural intentions were moderated by personality traits of agreeableness (AGR) and openness (OPS). The goal of this study was to provide a new contribution by proposing a model that linked the antecedents of PEX of clinical laboratories service to a high level of patient emotional state, which becomes a predictor of behavioural intention. The findings from this research will help laboratory management in developing a more effective business plan. The proposed model is tested empirically on patients from a chain of private clinical laboratories in Indonesia that provide advanced tech and premium services. So far, to the authors’ knowledge, this is the first study done in a private lab service that links the element of service quality to the experience that triggers delight and impacts behavioural intention. This paper consists of an introduction, literature review, hypothesis development, methodology, results discussion, and conclusion.

2. Literature Review

This research is based on several theories, since this research model was developed to predict the intention of lab customers to return to visit and spread positive stories about the lab. The underpinning theory is the Theory of Reasoned Action (TRA), which has proven to be reliable in predicting individual intentions in a healthcare setting (LaCaille 2020). TRA itself was developed as a human behavioural theory based on goal-orientation, where a person’s behavior can be determined by intentions formed from attitudes and social norms (Fishbein and Ajzen 1980). In this study, intentions can be predicted by the attitude of the patient, who is delighted due to the services provided.
Another theory that was used as the foundation of this research was the customer experiential theory, initiated by Schmitt (1999). In this customer behaviour theory, a holistic approach is used for assessing the products and services consumed that are evaluated through the cognitive and emotional process. In this customer experience process, the value occurs in the continuum known as the customer journey, where the customer interacts from one to another touch point. Consumer experience is defined as a consumer’s cognitive, sensory, social, and behavioural responses to the specific offering during the purchasing (consumption) journey (Lemon and Verhoef 2016). Subsequent studies from Klaus and Maklan (2013) showed that the implementation of experience in measuring quality has an impact on behavioural intention. Maklan and Klaus (2011) illuminated the marketing ‘paradigm shift’ from product brand-based to service-based marketing that became the basis for experience. Moreover, experience is far broader than the concept of service quality that it replaces, hence its measure is far more complex.
A review study in healthcare management pointed out that patient experience is defined as “the sum of all interactions, shaped by an organisational culture, that influence patient perceptions, across the continuum of care, as developed by Beryl Institute” (Wolf et al. 2014). It supports the notion that the patient experience is not just one encounter, but spans over time and includes many touchpoints, and involves a certain level of interaction. Hewitson et al. (2014) described PEX as self-report forms of their experience of care, including the staff-patient interactions, information provision, involvement in decisions and support for self-care, and overall ratings of care. From this definition, the interaction and touchpoint during the care process is the factor that is similar in customer experience and PEX concepts as well.
Shale (2013) has posited PEX with contentment, where she argues that PEX has also become a clinical quality indicator. This experience occurs from the link between patient knowledge, patient’s expectations of care, patient’s response to the care delivered, and patient’s appraisal of care, which makes it a complex measurement. An earlier study by Weiss et al. (2009) stated that PEX is based on the components of a patient-centric paradigm in a healthcare organisation driven by what happens at the point of contact between the patient, the practice, and the provider, and PEX is compatible with a brand experience. Thus, PEX becomes relevant for healthcare management. Measuring PEX is crucial because it provides an opportunity for service providers to improve service quality, improve decision-making strategies, meet patient expectations, effectively manage and monitor health service performance, and document benchmarks for health service organisations (LaVela and Gallan 2014). The concept of patient experience and how to measure it is still evolving nowadays (Wolf et al. 2021). Despite several different views, the measurement of PEX has been carried out with several instruments that are relevant to the context and specificity of the health services provided, for example, the PEX scale in outpatient service (Garret-Bernardin et al. 2017).
In many previous studies, the construct of customer experience has been associated with customer satisfaction. Likewise, studies on healthcare often use overall patient satisfaction. Earlier studies by Tseng et al. (1999) stated that PEX can have a significant impact on customer satisfaction, while Haeckel et al. (2003) and Casper and Leonard (2006) stated that service clues affect satisfaction through the perceptions formed in each service experience. However, in response to fierce competition in the service industry, providers compete by trying to offer superior service to the segmented target customer (Barnes and Krallman 2019). Thus, ordinary service and patient satisfaction may not be enough; the service should be designed by the context and consider patient emotion. In this sense, the customer delight concept is raised as a targeted construct that attracts the researcher, and practitioners as well.
The theory of customer delight conceptualised by Oliver et al. (1997) pointed out the high level of the emotional state as customer responses. It is a person’s feeling of pleasure that arises because of comparing the service she or he receives with expectations. What is received is more than the expectations that have existed beforehand. Parasuraman et al. (2020) extended this theory by proposing that delight encompasses six characteristics, that, taken alone or together, go beyond happiness, joy, and surprise. Various combinations of six properties, including the customers experiencing positive emotions, interacting with others, successfully solving problems, engaging the customer’s senses, the timing of the events, and the sense of control that characterises the customer’s encounter, are associated with CDL. Other researchers denote that CDL is a high level of customer response to experience, where service performance can provide positive surprises and extraordinary feelings of pleasure (Kao et al. 2020). In line with this, Barnes and Krallman (2019) state that CDL is obtained when the performance provided by a service or company is at a level that exceeds customers’ expectations. Therefore, delight depends on the service offered by the provider. Consequently, delight must come from a well-planned and executed service design by optimizing all touch points in the customer journey.
Customer delight itself is known to have a positive impact on behaviour intentions such as loyalty. A recent study by Shoukat and Ramkissoon (2022) posited that CDL has a positive correlation with customer experience. Customer delight can encourage customers to return to using services at a company and encourage them to say or share positive things. Thus, it can be interpreted that customers are willing to be happy to become customers (Parasuraman et al. 2020). Few empirical studies (Collier et al. 2018; Anggiani et al. 2021) provide evidence that CDL could predict behaviour intention that benefits the service provider. Eisenbeiss et al. (2014) emphasise determinants of delight, such as product quality, product efficiency, service recovery, and the way customers are handled by employees of an organisation, while Morrison et al. (2019) argues that communication factors are an important factor in determining CDL. According to Gronroos (1984), there were functional and technical qualities that need to be considered in the service quality evaluation.
A study done by Holdford and Schulz (1999) determined the relative importance of functional quality and specialised or technical quality in terms of how cases perceive the quality of pharmaceutical services. The findings showed that patient satisfaction, a particular scale of the position of specialised and functional service quality of health services provided by hospitals, significantly and interactively influences the case’s impression of service quality. Instead, Dagger and Sweeney (2006) show how functional and specialised quality directly improves patient quality of life. They have discovered that technical quality has a somewhat greater influence in their healthcare environment than its functional counterpart, which shows that service expansion is most significant to customers. However, healthcare environments are distinct from other, for-profit services in particular with the targeted customer (Berry and Bendapudi 2007). Healthcare services, especially those provided by the private sector, are arguably the most specific and significant services that customers purchase (Berry and Bendapudi 2007), which merits in-depth investigation into their effects on pleasure, happiness, and quality of life.
This study emphasised the antecedent of PEX through the service quality measurement approach known as service quality (SERVQUAL) with 5 dimensions (Parasuraman et al. 1988). Van Campen et al. (1995) argued that service quality is general in nature and needs to be developed with more relevant dimensions according to the context and type of health services. Service quality (SERVQUAL), coined by Parasuraman et al. (1988), tends to be a more functional quality assessment, according to Jonkisz et al. (2021). In the context of health services in laboratories, SERVQUAL was developed into LabServ (Ramessur et al. 2015), which consists of eight dimensions, such as tangibility, reliability, responsiveness, turnaround time, test reports, communication, and laboratory staff attitude (LSA). Gronroos (1984) gave the first definition of functional quality, defining it as how the service is delivered. Consequently, it does not cover the technical dimension that is related to the result, which is also important in customer evaluation of service quality (Gronroos 1984; Van Campen et al. 1995; Swain and Kar 2018). According to previous studies, SERVQUAL has limitations to evaluate healthcare services (Van Campen et al. 1995; Endeshaw 2020), although it has proven useful in the healthcare sector (Jonkisz et al. 2021). Other authors (Swain and Kar 2018; Chahal and Kumari 2010) pointed out that there are technical and other qualities that are relevant to healthcare, such as interaction and outcome quality.
Another study on laboratory services (Levana and Antonio 2022) involved variables such as administrative process, information availability, waiting time, PHP, environment, and result notification. A study by Hailu et al. (2020), done in a public clinical laboratory, indicates the cleanliness and importance of facilities, while Almatrafi et al. (2018) put focus on the PHP, including the attitude of the phlebotomist. Due to the uniqueness of clinical laboratory services, the PHP is an important factor and needs to be considered in the research model.
One of the technical qualities of the laboratory clinic is the phlebotomy process (PHP). Venous blood examination (phlebotomy) is the most common clinical procedure performed in clinical laboratories (Balter et al. 2018), and it can determine the medical assessment of the patient’s condition. The success of phlebotomy depends on the skills of medical personnel and the patient’s physiological condition (Piazza et al. 2019), which become the determinants of patient comfort and satisfaction. Hence, it should be considered a noteworthy technical quality in the research model. The PHP is a touch point where there is physical contact from the medical staff, and thereof an opportunity to create an impressive experience. Previous studies in clinical laboratory services have demonstrated a positive effect of PHP on patient satisfaction (Levana and Antonio 2022; Khatri and Sharma 2021; Almatrafi et al. 2018). Therefore, this study attempts to extend the LabServ by adding specific antecedents as elements of service in the laboratory in the sense to integrate technical and functional aspects of services that have so far been considered separately.
Research on customer behaviour has adopted social cognitive theory (Bandura 1989), which shows that customers can be assessed from a dynamic customer point of view, where customers can learn from their interactions with the environment and past experiences. The customer has a conviction or belief that he is capable of doing a task, and therefore the decision depends on himself. This theory is in line with the self-determinant theory (Ryan and Deci 2020), which shows that internal motivation and certain personality traits possessed by individuals play a role in decision-making and intentions. Therefore, personality traits are believed to play a role in individual decisions in making choices and determining attitudes (McCrae and John 1992). Regarding the marketing research model that considers customer-free choices, this study attempts to involve personality traits in the decision and behaviour intention.
Personality can be defined as individual differences in characteristic patterns of thinking, feeling, and behaving (Kazdin 2000). Researchers revealed the importance of personality traits being stable across time and various situations, which makes them characteristic of each person (Bleidorn et al. 2013). The widely used assessment for personality traits is the five-factor model, referring to extroversion, openness to experience, agreeableness, conscientiousness, and neuroticism. These personality traits have an important impact on individuals’ lives (McCrae and John 1992).
Of all the five personality traits, two are considered relevant and related to RVI and the intention to express electronic word of mouth (eWOM), namely OPS and AGR. This does not mean that other personality types are not taken into account. According to McCrae and John (1992), OPS is characterised by an individual tendency to be open to new experiences, and that he or she is more creative, imaginative, intellectually curious, impulsive, and originally open to new ideas. On the other side, AGR has been known as an individual tendency that prefers more cooperation, considers morality, and shows sympathy, but sometimes has low self-confidence. This personality often shows high levels of trust in others and tends to be happy and satisfied because of their close interrelationships (McCrae and John 1992). According to Oliver et al. (1997), CDL can be moderate by service context, and this may also be related to the patient’s background, including the intrinsic factor. One latest study (Addalia and Antonio 2022) related to health clinics also involved this personality trait as a moderator on the path to visit intention.
Table 1 summarises the conceptual definitions of the constructs explained above.

3. Hypothesis Development

3.1. Antecedents of Patient Experience

Staff appearance can affect someone’s judgment. An attractive appearance will give a positive impression to others (Wang et al. 2018). In particular, the appearance of medical personnel reflects their professionalism and service in the medical procedures they provide. Having staff who have a good appearance will be able to improve the PEX (Ramya and Ali 2016). Laboratory staff attitude, according to Howe and Krosnick (2017), is an attitude that reflects behaviour patterns, tendencies or anticipatory readiness, or predisposition to adapt to social situations; or simply, attitude is a response to conditioned social stimuli. A good attitude will provide comfort to the patient before, during, and after carrying out medical procedures, so that the patient feels a good experience in receiving the attitude given by medical personnel. The existence of an LSA will be able to increase the PEX (Laukkanen et al. 2019; Ramessur et al. 2015). Information clarity, according to Choi and Lee (2021), is the information needed while waiting that influences customer reactions. Providing clarity on waiting time and queue information will affect the mechanism of customer behaviour that has an impact on service evaluation (Yogarajah et al. 2019). Another effect of providing the information is reducing the effect of uncertainty and having a positive effect on cognition so that it can evaluate the waiting time lived by patients (Wang and Galloway 2021).
While undergoing medical action, it is important to have IFC for the patient’s needs in knowing their health condition as well as information about what actions they are receiving, so that patients will experience an easy or good experience when undergoing treatment. The clarity of this information can improve the PEX (Ramya and Ali 2016; Levana and Antonio 2022). Staff responsiveness, according to Norcross and Wampold (2018), is the company’s ability to be carried out directly by employees to provide fast and responsive services. Responsiveness can foster a positive perception of the quality of services provided. By providing fast and responsive service from medical staff, a PEX can be fostered where patients feel a positive experience when receiving services that meet their expectations of responsive responses from medical staff. In this case, it can be said that SRV can influence the PEX (Ramessur et al. 2015; Almatrafi et al. 2018).
In the results of previous research (Ali et al. 2015; Hailu et al. 2020), the waiting room and LAB are one of the services that a laboratory must have regarding ambience factors or factors surrounding the laboratory. The environment is mostly in terms of the cleanliness of facilities (Wu et al. 2016). Through the conditions or situations of good laboratory facilities to be given to patients, patients can feel comfortable in undergoing their treatment to give rise to a good experience. The results of Jeon et al. (2020) showed that LAB had a significant effect on PEX. Based on that consideration that could be seen as functional quality, the hypothesis can be arranged as follows:
Hypothesis 1 (H1).
Staff appearance has a positive effect on patient experience.
Hypothesis 2 (H2).
Laboratory staff attitude has a positive effect on patient experience.
Hypothesis 3 (H3).
Information clarity has a positive effect on patient experience.
Hypothesis 4 (H4).
Staff responsiveness has a positive effect on patient experience.
Hypothesis 5 (H5).
Laboratory ambience has a positive effect on patient experience.
The PHP is a major part of the patient in the laboratory, and the PHP will affect the PEX (Khatri and Sharma 2021; Yip et al. 2016). This can be seen from how the blood-taking process is carried out by medical staff; whether it makes the patient feel sick, scared, or even the patient feels nothing because the process is carried out very well, it can bring up an experience for the patient where the patient will give a good or bad description of his experience. Previous research shows a positive relationship between the PHP to patient satisfaction (Levana and Antonio 2022; Almatrafi et al. 2018).
A laboratory is a place that is equipped with various kinds of equipment, instruments, and chemicals to carry out experimental activities, inspection activities, and inspection mechanisms. In addition to the environment, a good laboratory can adapt to technological developments as needed (Ramessur et al. 2015). With technology that is more advanced and can speed up or make it easier for patients when undergoing treatment, it can make patients feel a good experience when undergoing treatment. It can bring up research results, one of which is by Xie and Or (2017), which shows that LTC has a significant effect on PEX. The report result is the result of a laboratory examination as one of the medical supports to see the health condition of the patient. Therefore, the ease and speed of getting laboratory results can affect PEX (Völker et al. 2020). This can be seen in how patients respond to the results of treatment carried out in a laboratory in line with patient expectations and technical quality outcomes in the laboratory. The hypothesis based on the service provided by the laboratory can be arranged as follows:
Hypothesis 6 (H6).
Phlebotomy process has a positive effect on patient experience.
Hypothesis 7 (H7).
Laboratory technology has a positive effect on patient experience.
Hypothesis 8 (H8).
Report result has a positive effect on patient experience.
The existence of a PEX process will be able to increase CDL, according to previous studies (Kao et al. 2020; Shoukat and Ramkissoon 2022). In this study, patient and customer could be used interchangeably. Pleasure is born because the company succeeds in meeting the needs, desires, or expectations of consumers, and even consumers feel satisfied. This is also a benchmark for company performance or achievement for the company because it already understands its consumers. Customer delight is a customer reaction when they receive a service or product that provides value beyond their expectations (Torres et al. 2020). Patients who experience good experiences while getting services will feel delighted. Empirical studies provide evidence that experience could affect CDL (Collier et al. 2018; Anggiani et al. 2021). Based on the description above, the hypothesis in the context of the customer in the laboratory clinic can be arranged as follows:
Hypothesis 9 (H9).
Patient experience has a positive effect on customer delight.

3.2. Revisit Intention and Willingness to Share and Post on Social Media

Pleasure and excitement were born because the company succeeded in fulfilling the needs and desires or expectations of consumers, and even consumers feel more than satisfied (Kao et al. 2020). Customer delight drives the favourable outcome to the company upon customer reaction when they receive a service or product that provides value beyond their expectations (Torres et al. 2020; Barnes and Krallman 2019). It is thereof important to the private sector to attempt to provide superior service. The existence of CDL will be able to increase RVI and customer expression, such as WSP (Jeon et al. 2020). This RVI is also found in empirical studies in healthcare (Woo and Choi 2021), where RVI is considered crucial in increasing the number of medical tourist visits in the future, since it could generate positive word of mouth (Junio et al. 2017). A study by Collier et al. (2018) demonstrated that delight also has a positive relation with word of mouth. The CDL process is also able to increase the WSP according to prior studies (Jatiyananda et al. 2021; Pee 2018), indicating that social media is a means for consumers to share text, images, audio, and video information with each other and other companies. Customers will increasingly recognise the role of social media in boosting business performance. Based on the description above, in the context of the private laboratory service, the hypotheses can be arranged as follows:
Hypothesis 10 (H10).
Customer delight has a positive effect on revisit intention.
Hypothesis 11 (H11).
Customer delight has a positive effect on willingness to share and post on social media.

3.3. Agreeableness and Openness

Customers with high AGR, as this personality is quick to provide help, forgiving, warm, and soft-hearted, are expected to give more to support the service provider. On the other hand, people with low AGR tend to weaken the influence of customer evaluation on future intention. Since this personality trait involves customers’ decision-making (El Othman et al. 2020), the individual with AGR could be seen as a friendly customer who is relatively easy to maintain. Agreeableness, also known as friendliness, is also related to the level of adherence to individual norms (Tackett et al. 2019). On the other side, according to Friedman (2006), OPS also can be used to characterise a clinical laboratory customer as a person with an imaginative and creative perspective. The word openness, in this study, refers to the ability to tolerate and absorb information due to the service delivered in the laboratory. The higher OPS of an individual related to an open mindset, the higher he or she is open to accepting the new service and more willing to share the experience. This kind of personality trait also involves forming customer behaviour as a response to his or her experience (El Othman et al. 2020), and therefore could be considered to affect the dependent variable.
The existence of a CDL process might be able to increase the WSP. According to Pee (2018), social media is a means for customers to share text, image, audio, and video information with each other and with other companies. The results of previous studies (Jeon et al. 2020; El Othman et al. 2020) indicate that personality traits such as AGR and OPS were involved in future behaviour. As stated by Oliver et al. (1997), CDL could be moderated by its service context and the characteristics of the customer. An empirical study in healthcare (Addalia and Antonio 2022) revealed that AGR acts as a moderator on the path to visit intention. In that sense, it can moderate the influence of CDL on the WSP. Based on the description above, the hypotheses in this study can be arranged as follows:
Hypothesis 12 (H12).
Agreeableness moderates the effect of customer delight on revisit intention.
Hypothesis 13 (H13).
Agreeableness moderates the effect of customer delight on willingness to share and post on social media.
Hypothesis 14 (H14).
Openness moderates the effect of customer delight on revisit intention.
Hypothesis 15 (H15).
Openness moderates the effect of customer delight on willingness to share and post on social media.

4. Research Framework

In this study, the conceptual framework can be described as an illustration in answering the research hypothesis that has been determined as follows (Figure 1):

5. Methodology

5.1. Research Design

This research uses quantitative research methods with a cross-sectional design. The objects in this study are all the variables included in this research model. The dependent variables are RVI and WSP, which are moderated by AGR and OPS, while SAP, LSA, IFC, SRV, LAB, PHP, LTC, and the result are the independent variables. Patient experience and CDL act as mediating variables.

5.2. Settings and Participants

The conceptual framework was tested empirically in a population obtained from patients who had a history of blood draws in several branches of a private clinical laboratory in Jakarta and West Java, named Diagnos Clinical LaboratoryTM. Sampling was carried out in October 2022. The method used in sampling in this study was a purposive sampling method. G*Power (version 3.1.9.7) was used to estimate the required sample size (Memon et al. 2020) based on a significance level of 0.05, an effect size of 0.35, and a power of 0.95. Accordingly, the calculated required minimum sample size for this study was 172. The sample in this study was 186 patients. This amount met the criteria of the minimum sample requirement based on guidance for analysis with Partial Least Square-Structural Equation Modelling (PLS-SEM) (Kock and Hadaya 2018). Consideration of the criteria in selecting samples included patients who had a history of blood sampling at Diagnos Clinical LaboratoryTM in one last year. The respondents participated anonymously and voluntarily in which they were convinced of the confidentiality of their responses.

5.3. Data Collection

The constructs within the proposed conceptual framework are measured using a set of indicators in a structured questionnaire instrument and by exploring journals, books, and other information relevant to the study. This questionnaire has been translated into local languages to ensure that all questions are easy to understand. This questionnaire was reviewed by experts in the field of healthcare marketing. For the questionnaire, a Likert scale with 6 points was chosen according to the recommendations from previous research, which showed a tendency that research with Asian respondents was more sensible with a Likert scale of 6 points rather than a Likert scale of 5 points (Chomeya 2010). On a scale of 1 to 6, respondents were asked to rate their level of agreement with statements on a scale of 1 (strongly disagree) to 6 (strongly agree), as determined in a Likert scale questionnaire. The questionnaire is adapted from previous studies by Xie and Or (2017); Collier et al. (2018); Anggiani et al. (2021); Lee (2018); Kuppelwieser and Klaus (2020); Khatri and Sharma (2021); Abubakar et al. (2017); Tu et al. (2021); Ramessur et al. (2015); Wu et al. (2016); De Rosis et al. (2019); Han et al. (2017); Laukkanen et al. (2019); Werder (2015); Jeon et al. (2020); Yip et al. (2016); Ramya and Ali (2016); Ali et al. (2015); Alexandrov et al. (2013); Pau et al. (2013) and then modified to novelty concepts.

5.4. Data Analysis

The PLS-SEM approach was used because it could test complex models in explanatory research. The conceptual framework has fifteen components and is considered a complex research model. When the focus of the investigation is primarily on explanatory and predictive power models, the PLS-SEM technique is recommended (Hair et al. 2019; Shmueli et al. 2019). The PLS-SEM analysis was applied through the SmartPLS™ version 4.0, which is selected since it provides a bootstrapping menu to test significance (Memon et al. 2021). The main procedure with PLS-SEM is based on two types of models, namely measurement and structural models. The measurement model is established to measure the reliability and validity between indicators and their respective constructs in the model. The reliability testing phase includes indicator reliability (outer loading) and constructs reliability (Cronbach’s alpha and composite reliability). The validity testing phase includes construct validity (average variance extracted) and discriminant validity (heterotrait/monotrait ratio). If these four things have met the requirements of reliability and validity, it can proceed to the next stage, including the simple slope analysis. The structural model is deployed to test the significant relationship between each construct in the research model. In this work, the authors combine descriptive analysis with inferential analysis using Importance Performance Map Analysis (IPMA). The positions of variables and indicators based on the mean (descriptive analysis) and total impact (inferential analysis) are shown in the figure (Sarstedt et al. 2017) as a two-axis mapping combining the two analyses. IPMA can offer a useful summary of what can be improved (Sarstedt et al. 2022).

5.5. Ethical Consideration

To determine whether there are risks associated with the proposed research approach, the researchers used peer reviews from two lecturers from the Marketing Division of the Department of Hospital Administration, Universitas Pelita Harapan. The authors also sought approval from Diagnos Clinical LaboratoryTM. Informed consent forms are available as another measure to ensure that this research does not contravene ethical standards. The respondents who took part in this study signed a consent form that included information about the participants’ aims, methods, and rights. Confidentiality of respondent data is one of these aspects. Before data collection, hospital administration approval was initially sought.

6. Results and Discussion

6.1. Results

This research was conducted on 186 respondents who met the criteria in this study. The profile of the respondents who participated in the study is presented in the demographic profile (Table 2) and behaviour profile as follows:
Based on the demographic profile of the respondents, the majority of respondents were male (66.1 per cent). Based on the age group, most of the participants were from the age group 20–30 years (49.5 per cent), then the rest were aged 31–40 years (33.9 per cent), 41–50 years (11.8 per cent), and more than 50 years (4.8 per cent). As many as 58.1 per cent of the respondents had bachelor’s degrees (S1), and the rest were high school (Sekolah Menengah Pertama/SMP and Sekolah Menengah Atas/SMA) (16.7 per cent) and postgraduate (S2/S3) (25.2 per cent). Then, the work of the respondents is mostly as private sector employees (42.5 per cent). Most of the respondents live in Jakarta and its surroundings (81.7 per cent) and 18.3 per cent live in other areas.
Based on the behavioural history profile of the respondents (Table 3), it was known that most of the respondents had visited other clinics before visiting Diagnos Clinical LaboratoryTM (68.3 per cent). The number of times respondents came for blood tests at Diagnos Clinical LaboratoryTM in one last year was mostly 1–2 times (68.8 per cent). The reasons for respondents visiting Diagnos Clinical LaboratoryTM for the last laboratory check were personal initiative (31.7 per cent), requests from companies/institutions (37.6 per cent), referrals from doctors (18.8 per cent), and referrals from hospitals/clinics (4.8 per cent). The social media owned and most frequently used by respondents are Instagram (39.8 per cent) and Tiktok (27.4 per cent).
The first step in this research is to do an outer model analysis. Based on the results of the outer loading of this study, several indicators were eliminated that were not in accordance with the set value limit of 0.708. Then, if the value of all indicators is greater than 0.708, all indicators are considered reliable to measure each research item. The next step is to test the construct reliability by taking into account the value of Cronbach’s alpha (CA) and composite reliability (CR). In this study, all indicator values are worth more than 0.7 and do not cross the upper limit of 0.95, so it can be said that construct reliability is accepted (Table 4).
To ensure convergence validity in research, an evaluation of the average variance extracted (AVE) value was carried out. All research constructs have an AVE value of 0.5, so it can be said that each construct can explain at least 50 percent of the variance items in the model.
To determine the discriminant validity test, we used the heterotrait/monotrait ratio (HT/MT), as this ratio is known to be more accurate in detecting discriminant problems. The results of the validity test in this study showed that all the constructs had a value below 0.9 (Table 5), so it was concluded that all the indicators in this research model had been well discriminated against so that they could measure their respective constructs.
In the structural model, R2 is tested to measure predictive accuracy, Q2_predict is to measure predictive relevance, and the significance and coefficient of the variable are to decide whether the hypothesis can be supported or not. Previously, common method bias arising from errors or biases in measurement methodology was evaluated using the inner variance inflation factor (VIF). The findings in this study indicate that all constructs have an inner VIF value below 3, so it can be said that there is no common method bias issue found in this model.
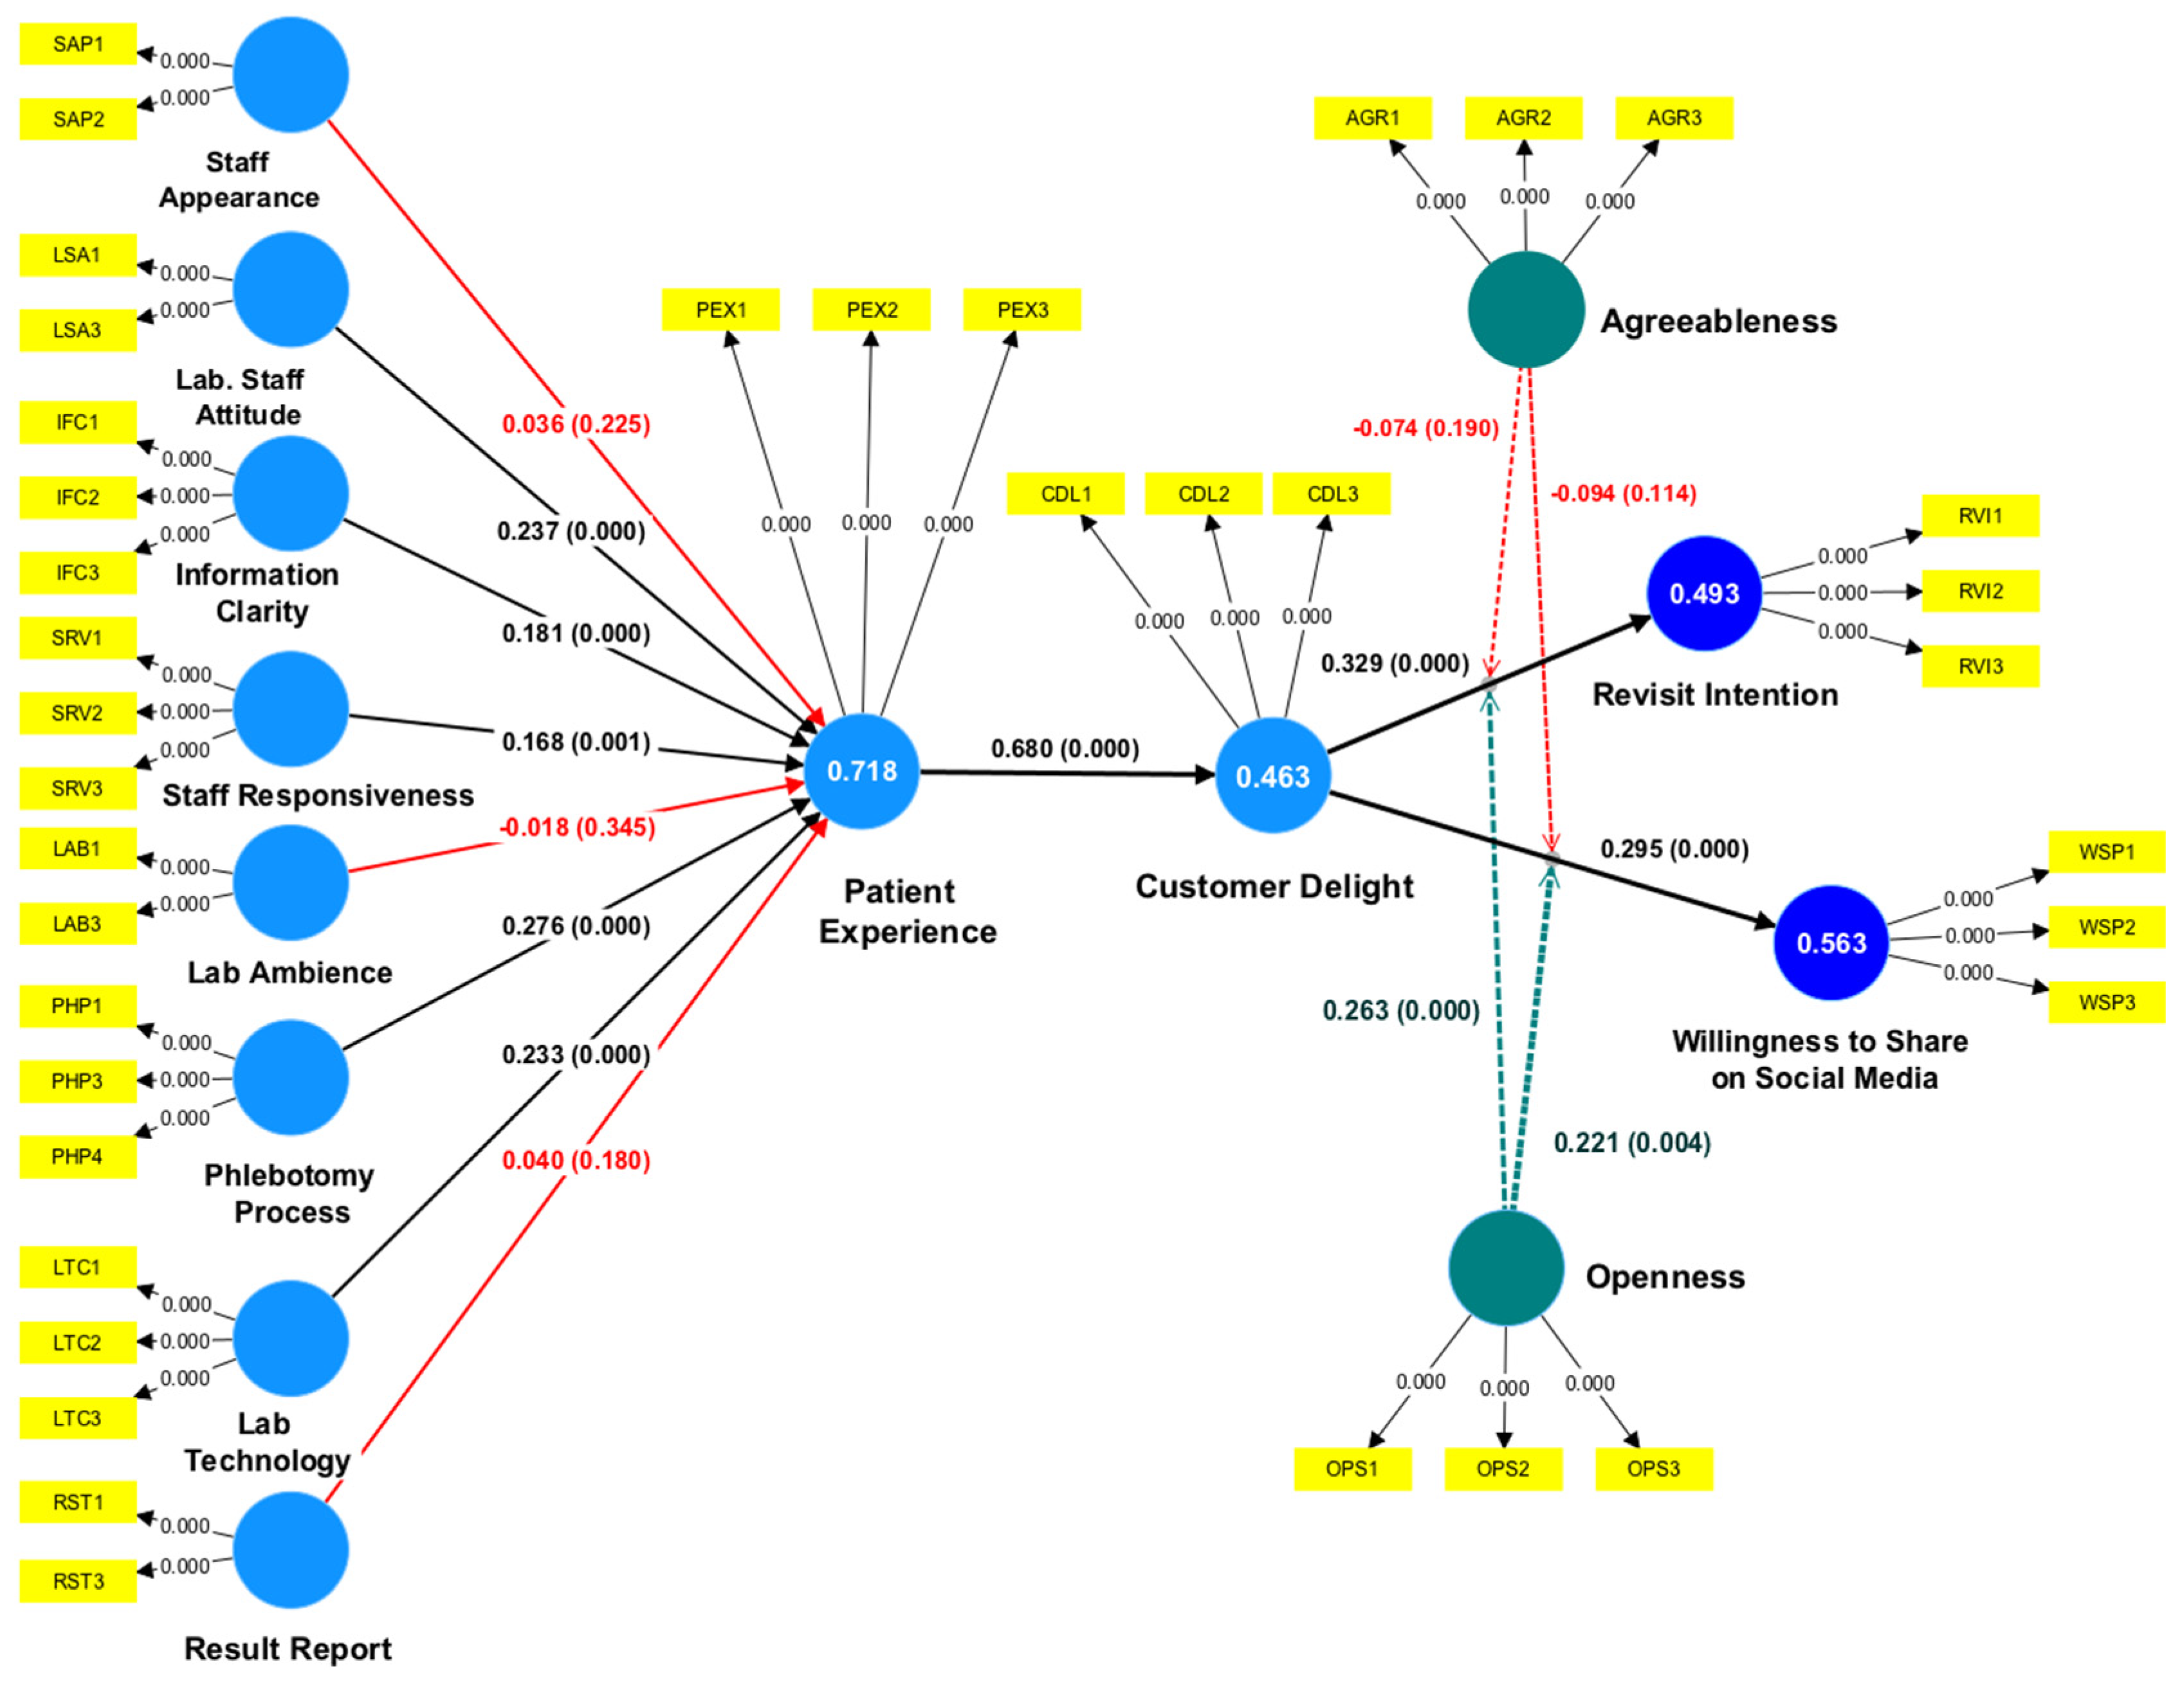
This research model shows that the PEX variable R2 is 0.718, categorised as moderate to strong predictive accuracy, while CDL (0.463), RVI (0.493), and WSP (0.563) were categorised as weak to moderate predictive accuracy. Based on these results, this model has adequate predictive ability. Patient experience has a large effect size on CDL with an f2 value of 0.861. The value of the construct Q2_predict on CDL (0.492) and RVI (0.454) shows medium predictive relevance, while the construct Q2_predict on PEX (0.692) and WSP (0.519) shows large predictive relevance. Based on these results, it can be said that this model has consistency in its predictive ability.
The output of PLS_predict can be used to assess predictive ability at the construct indicator level (Shmueli et al. 2019) according to the requirements contained in the flow developed by Hair et al. (2019). In its development, a method that is considered more appropriate for measuring the predictive ability of a model is the cross-validated predictive ability test (CVPAT) developed by Liengaard et al. (2021), and currently, CVPAT is recommended for measuring prediction-oriented model comparisons in PLS-SEM. From the findings of this study, we obtained CVPAT data compared to the average indicator (IA), both overall and at the indicator level (Table 6). The results show a lower average loss value, which is indicated by a negative value. In accordance with the flowchart developed by Sharma et al. (2022), this model has predictive validity. Furthermore, a comparison was made with the linear model (LM), which obtained an average loss value greater than LM with positive results. Therefore, this model can only be said to have predictive validity, according to the naïve benchmark stage.
Based on the results of hypothesis testing with the bootstrapping feature (Table 7), it was shown that there were ten accepted hypotheses (T statistics >1.645, p < 0.05, and CI 5% and CI 95% following the direction of the hypotheses). However, hypotheses H1, H5, H8, H12, and H13 do not meet the significance requirements, so they are not supported.
From the results of the hypothesis test, it can be found that the variables that have the strongest effects on PEX are the PHP (β = 0.276), LSA (β = 0.237), and LTC (β = 0.233). Then, PEX has a predominant relationship with CDL (β = 0.680), as well as CDL on RVI (β = 0.329) and CDL on WSP (β = 0.295). Furthermore, the moderating role of OPS could be seen in H14 and H15. T-statistics were found >1.645 with a coefficient of 0.263 and 0.221, respectively. Hence, it shows that OPS has a significant and positive moderating effect.
From the path linking the independent variables to the dependent variables, five pathways are having significant effects on RVI, and five have significant effects on WSP. This can be seen in Table 8, which only shows significant paths. Thus, the ten pathways are shown to be interconnected and show a link between the antecedents and both behaviour intentions as dependent variables. In the path segment from PEX to RVI and WSP, the authors found a statistically significant value (p ≤ 0.05). Therefore it was identified that CDL could mediate the effect of PEX on both behaviour intentions.
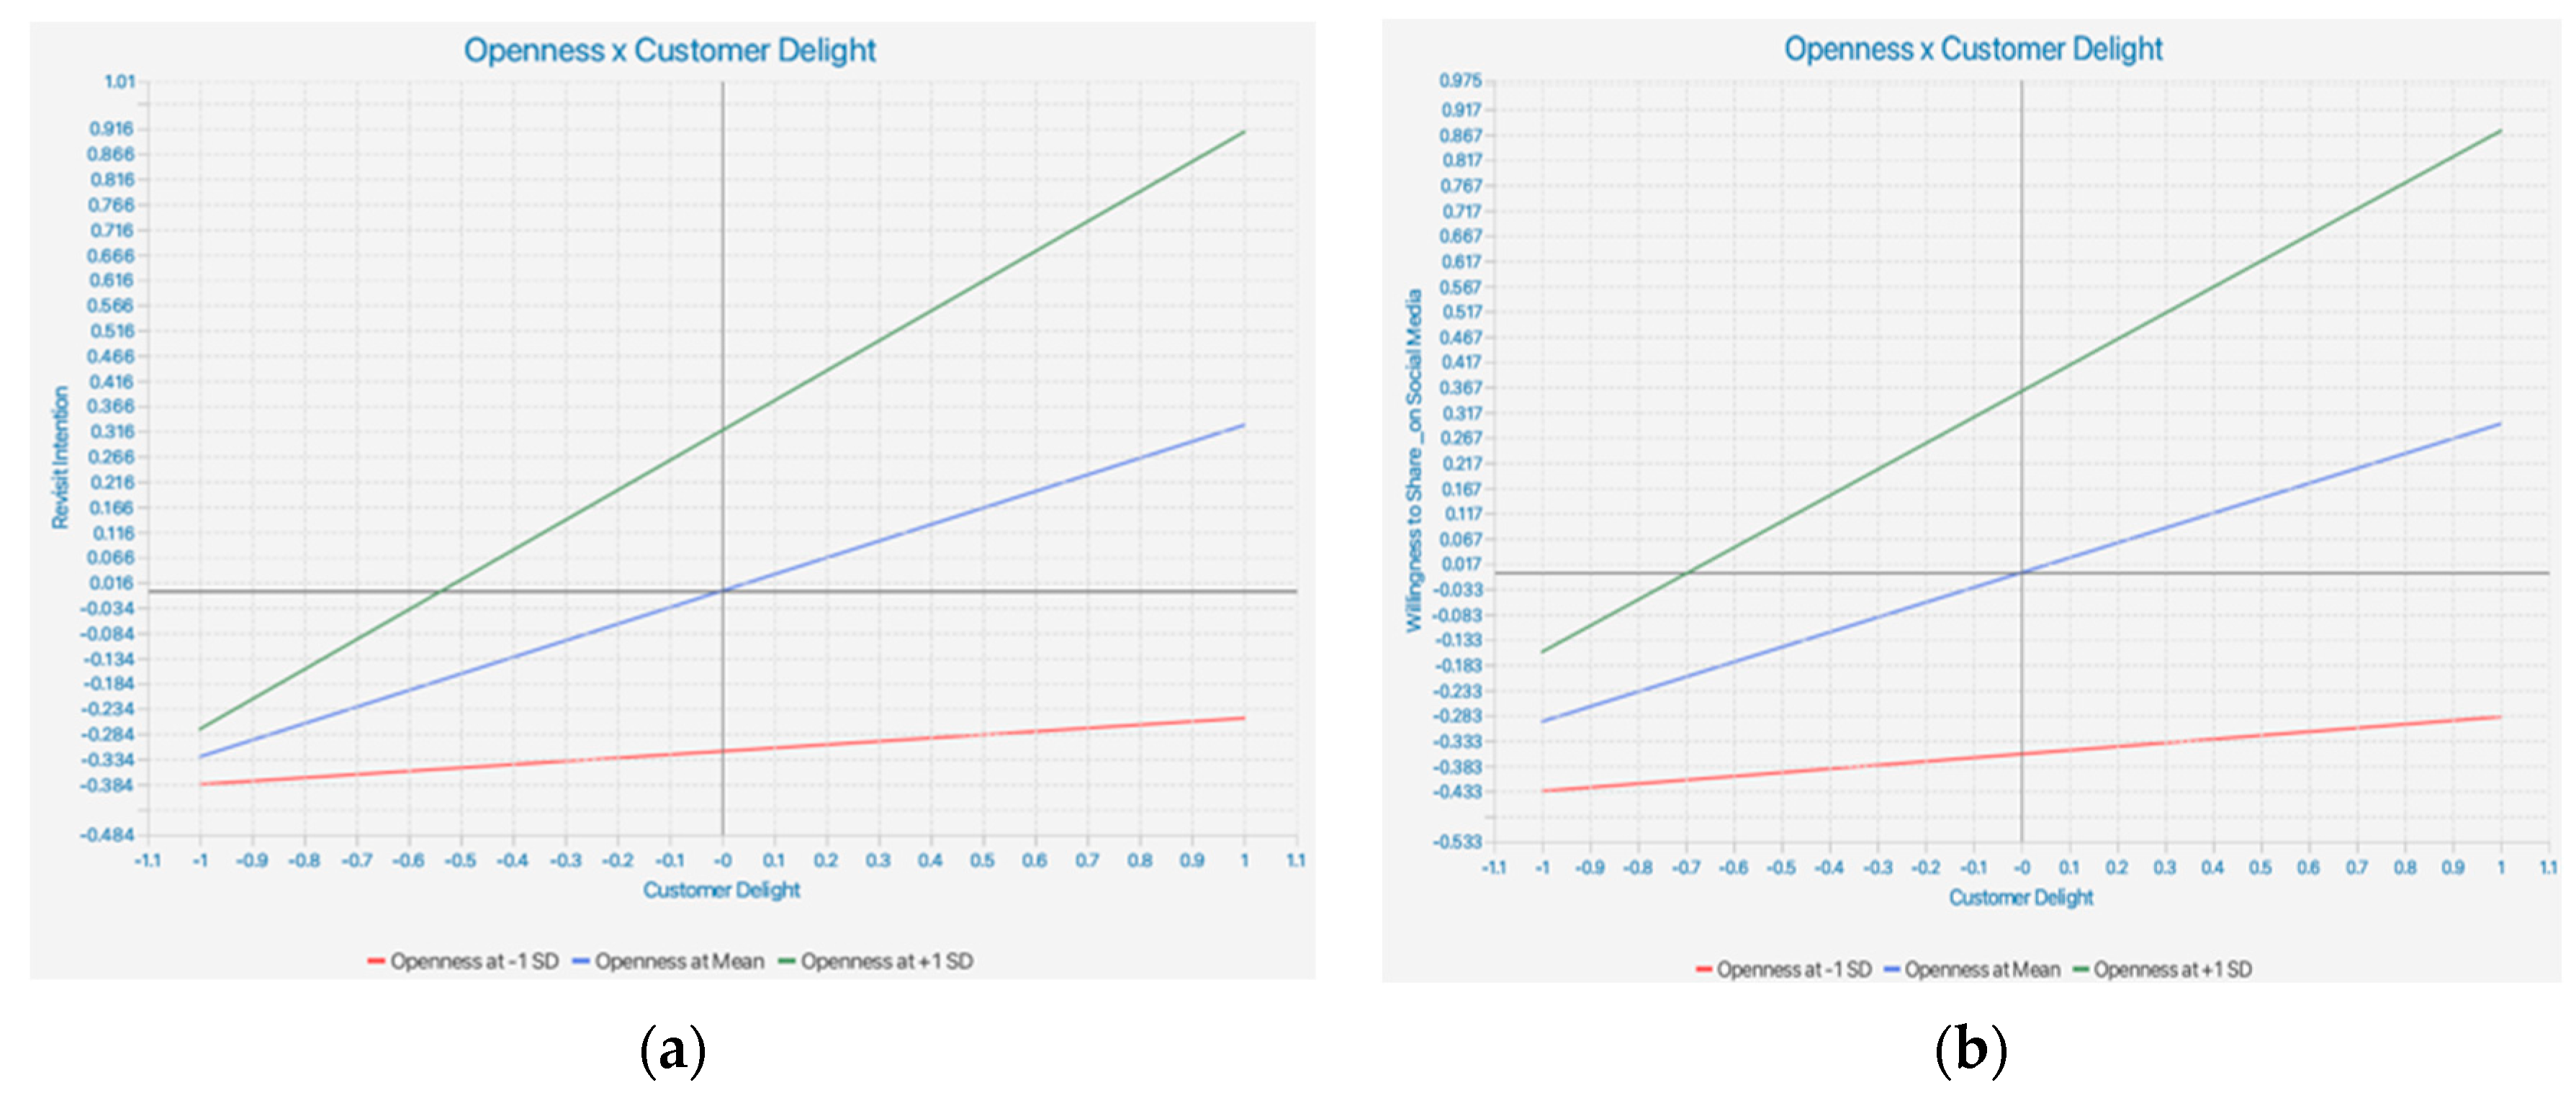
Figure 2 depicts the influence of the OPS moderating variable in the clinical laboratory in the form of a simple slope analysis. Figure 2a shows a linear relationship in which the higher the tendency of OPS, the greater the influence of CDL on RVI (+1 SD). Figure 2b also shows a linear relationship in which the higher the tendency of OPS, the greater the influence of CDL on WSP (+1 SD).
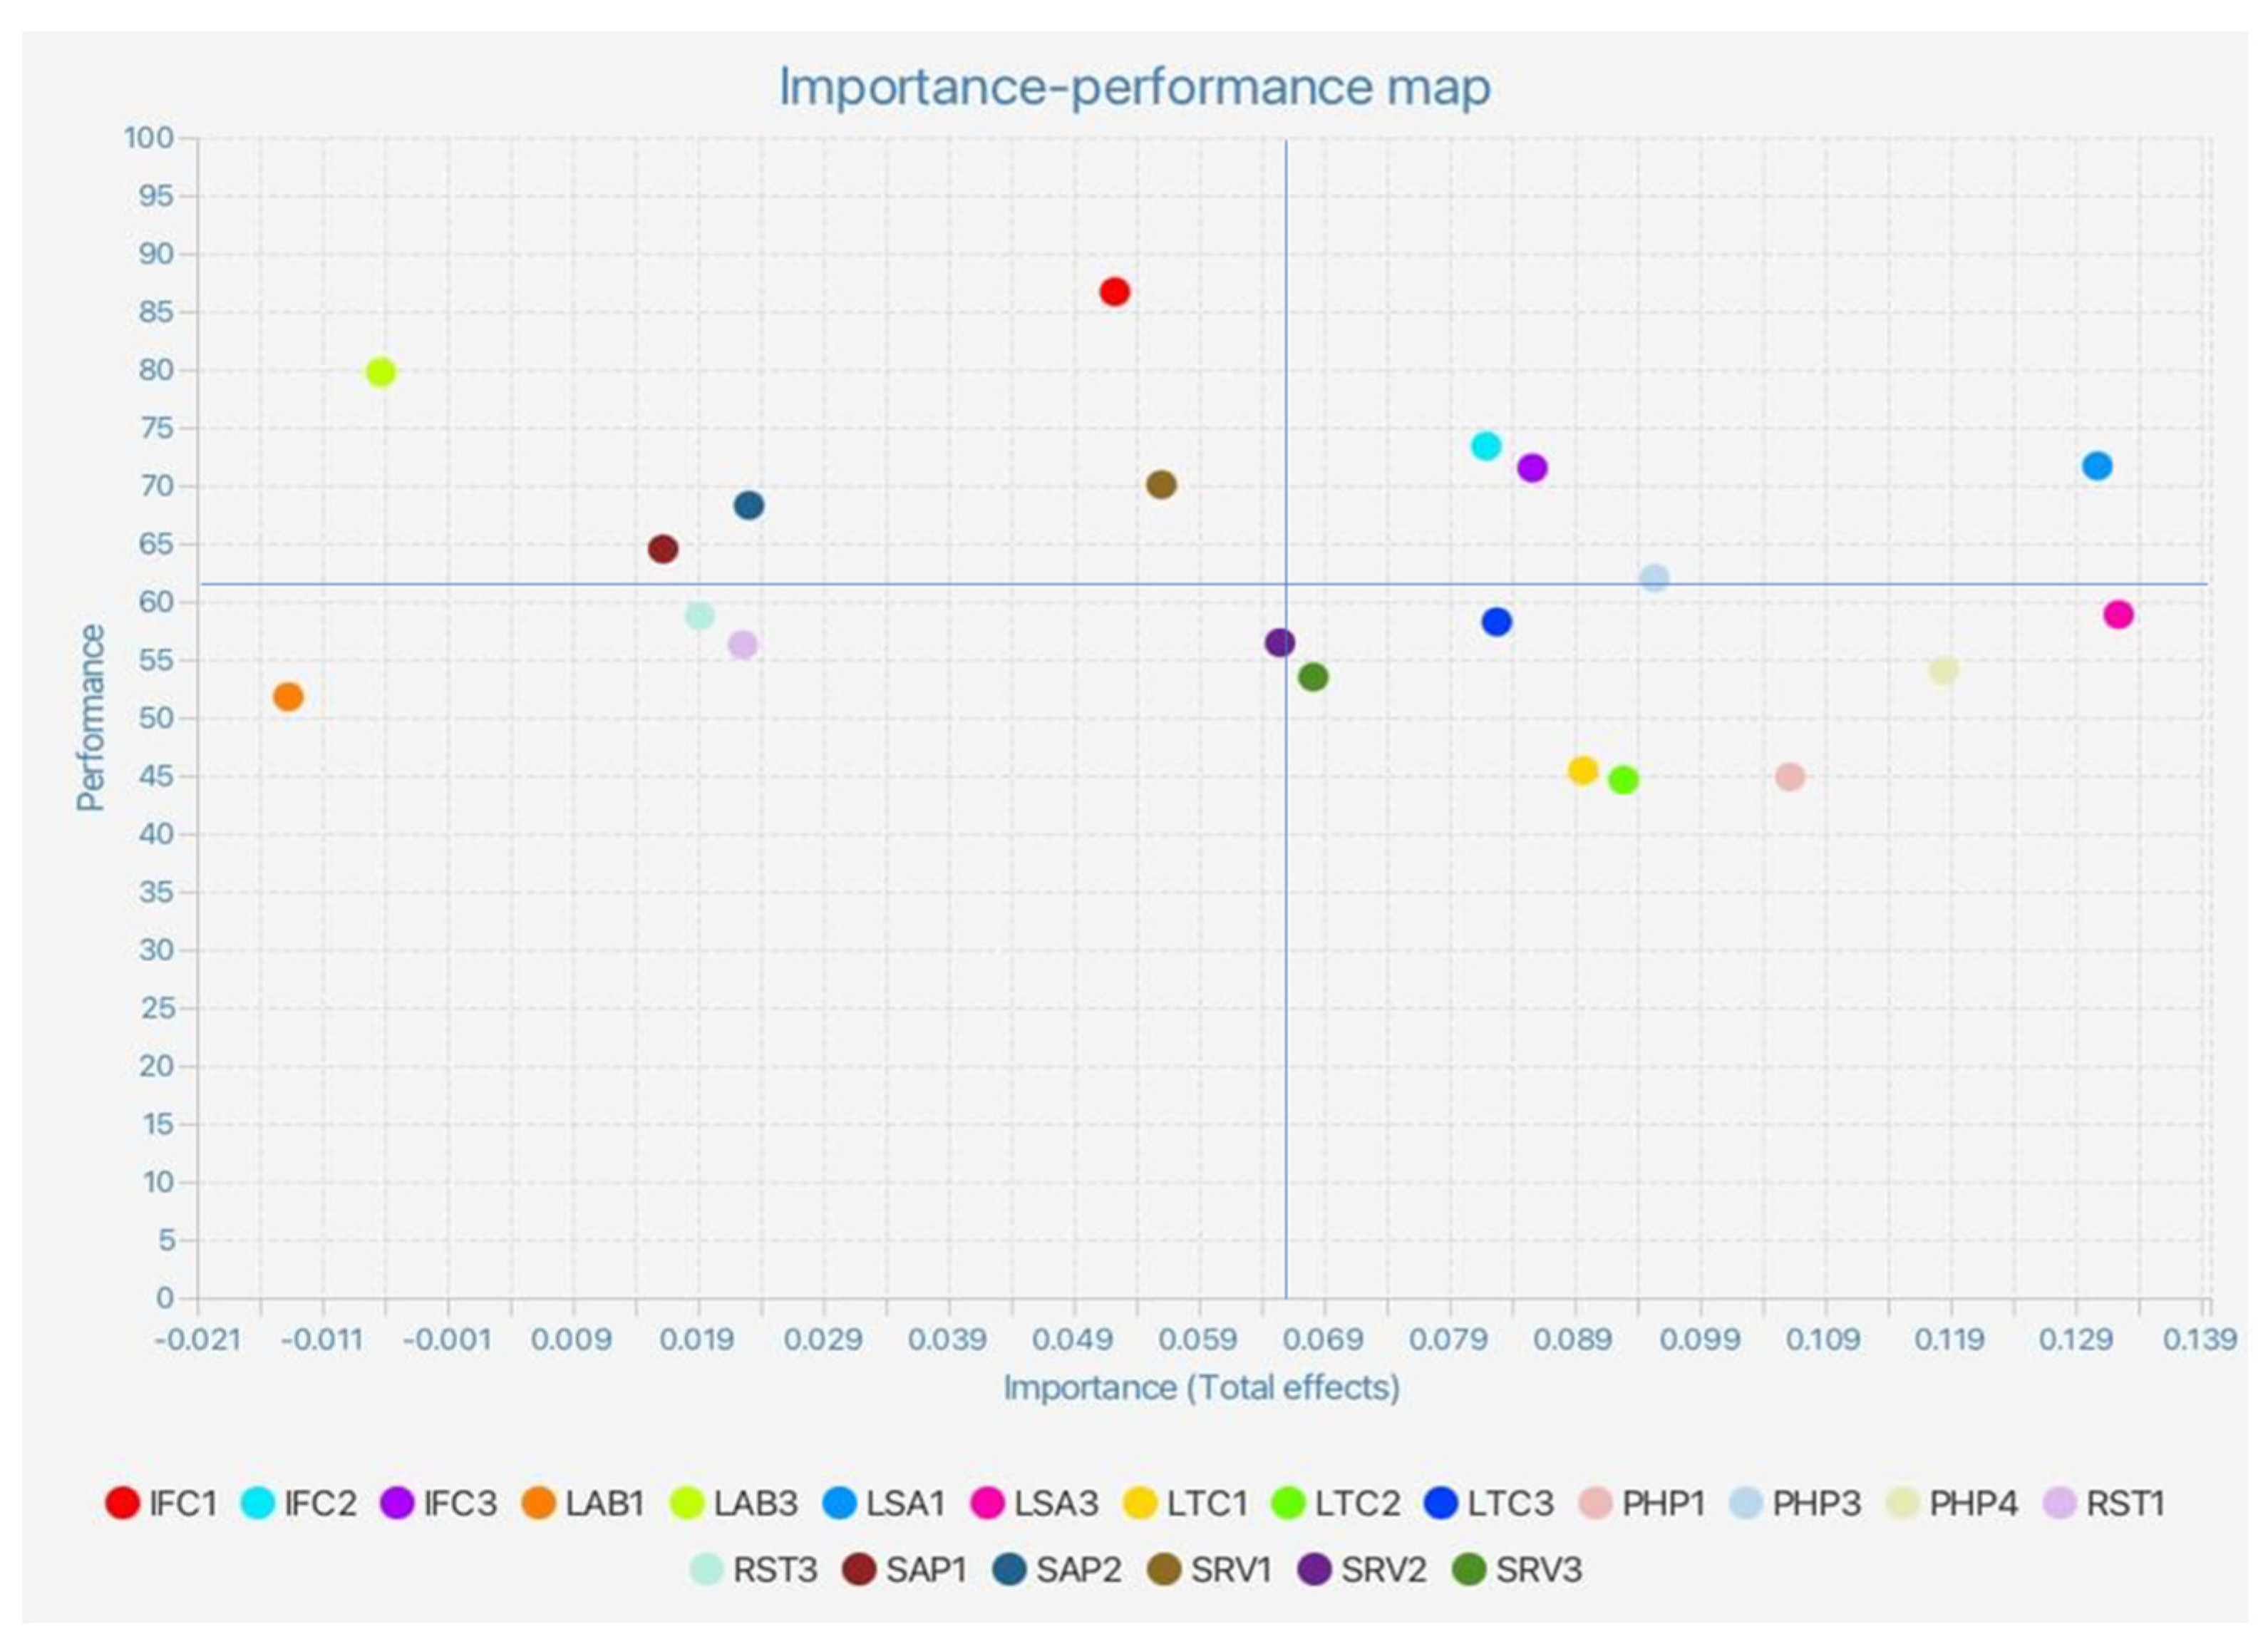
For practical implications, an IPMA was carried out using SmartPLSTM 4.0 calculations. Importance-performance map analysis can be described with indicators based on the total value of influence to show its performance. Based on the results of the IPMA below (Figure 3), it can be seen that the indicators that are important in influencing PEX are the LSA, namely LSA1 and LSA3. The LSA3 is shown in the right lower quadrant, meaning this indicator needs to be prioritised by clinical laboratory management because it is considered important for patients, but has not shown adequate performance.
The results of the PLS-SEM analysis with the coefficient value are described in Figure 4 as the empirical model. Based on this result, the proposed model has adequate capability to predict behavioural intentions in the context of clinical laboratory services.

6.2. Discussion

The results of this empirical research can answer the three research questions posed. First, the found five antecedents consisting of a combination of functional and technical quality aspects were proven to have a positive and significant effect on PEX from services in the clinical laboratory. The biggest influence can be seen from the PHP (β: 0.276), followed by LSA (0.237), LTC (0.233), IFC (0.181), and SRV (0.168). The results of this study indicate a high probability that patients feel the PHP as the touch point that has a major role in creating the impression.
The result of this technical quality aspect is aligned with the results of the previous study’s demonstrated positive effect (Levana and Antonio 2022; Khatri and Sharma 2021; Almatrafi et al. 2018). This study revealed that patients mostly feel the PHP that involves interaction between the patient and the medical staff has a major role in creating their experience. Therefore, clinical laboratory managers should pay attention to utilizing this process to provide services that make patients feel comfortable and impressed. On the other hand, an important aspect of functional quality from the antecedent experience, such as staff attitude and responsiveness, were identified as having an important influence, and this result confirms the previous studies in laboratory services (Ramessur et al. 2015; Hailu et al. 2020). Managers should ensure the quality of human resources employed in the laboratory who interact directly with the patient. A staff attitude that is full of empathy and responsiveness to the needs of patients is something that needs to become a standard of superior service in the laboratory. Staff who can show a highly caring attitude can play a big role in creating an emotional experience. In daily practice, management must ensure that laboratory staff responds quickly to questions or needs from patients, including answering telephone calls or through social networks such as WhatsApp.
Another thing that cannot be ignored is related to IFC. Staff in the laboratory must have good communication abilities and skills so that the information received by patients regarding the tests they have to undergo can be understood properly. Patients are usually in unhealthy conditions that make them often need information that can help calm themselves. This also needs to be supported by an adequate information system in the laboratory. In addition, aside from patient health literacy, patients in private laboratories generally have higher economic and educational status, so they are quicker to understand if there is new information technology. Hence, managers must make sure that the investment in modern diagnostic tests such as genomic tools can be well communicated to patients. This communication effort can create a positive impression that the laboratory is working on sophisticated tools to help and prioritise patient health.
In this study, it was also found that there was no adequate evidence from a few antecedents of experience in clinical laboratory services, namely the SAP, LAB, and RST, although it has a positive effect. Staff appearance is a tangibility factor that is usually assessed by patients, and it seems in this case, the patient will pay more attention to the attitude shown by medical staff, albeit a neat and clean uniform that supports appearance is important in health care. Generally, the waiting time for patients in the private clinical laboratory does not take too long, only less than 13 to 30 min since the patient came. This is different from the queue or waiting for time waiting for the doctor in the ambulatory service setting (Li and Garrat 2005). Patients thereby have no need to spend much time in the laboratory. That fact relates to the finding that ambience did not have a significant influence, even though a comfortable waiting room atmosphere remains a necessary factor in superior service. This finding is different from other studies have done in the public clinical laboratory service (Hailu et al. 2020), where factors such as waiting time and accessibility are still accounted for. On the other side, the report result also has an insignificant effect. This may relate that patients generally do not have a background in medical knowledge, so they cannot estimate how quickly the test results will be obtained. The patient seems to trust the reputation of the private laboratory they choose, so they tend to believe that the laboratory will immediately provide a report via email or WhatsApp. In addition, information about laboratory results depends on the type of examination, whereas in certain examinations, the results take longer. Nevertheless, management should inform how long until the test results will be received by the patient.
This study indicates that the PEX of a series of touch point interactions in the clinical laboratory, starting from SAP to the result report, can have a strong impact on CDL (β:0.680; p < 0.000). Likewise, the results of this study confirm the argument that the customer experience concept implemented as a PEX in clinical laboratory services can have a positive influence on CDL, which is a higher emotional state beyond the cognitive confirmation as found in satisfaction (Parasuraman et al. 2020; Klaus and Maklan 2013; Oliver et al. 1997). Furthermore, the result of this study on CDL, in accordance with the previous study, is that deliberate CDL mediates the experience and encourages the behavioural intention that is beneficial to the provider (Collier et al. 2018; Anggiani et al. 2021). Specifically, this study provides evidence that PEX could influence the delighted feeling and drive the RVI and WSP, although this finding was different from a previous study that identified that both experience and delight could have a direct impact on RVI (Shoukat and Ramkissoon 2022). This study supports the notion that experience should be placed as the evaluation of all interactions that may occur in service encounters (Wolf et al. 2014; Fatma 2014) that generate impressive and memorable feelings before coming to favourable customer behaviour intention.
Delight is known to have a greater influence on RVI than its influence on WSP. This study result is in line with previous studies (Anggiani et al. 2021; Collier et al. 2018). It is important for private clinical laboratory management, which competes to deliver service excellence, to seek activities that generate delight, so there must be services that exceed expectations as pinned by Barnes and Krallman (2019). In the context of a clinical laboratory, for example, the clinic can provide topical anaesthetics to patients who are prone to pain in the PHP. Also, if there is a damaged sample found, a home care visit will be made to take a sample again. Customer delight must be part of systemised design service in the laboratory’s business development plan.
The study confirms that delight can increase laboratory business performance, which is characterised by patients wanting to return to the clinical laboratory for the test as recommended by physicians and also for medical check-ups, because generally, elderly patients or patients with chronic degenerative diseases need regular check-ups at a later date. Likewise, their WSP platforms are very necessary because currently, potential consumers are more likely to choose authentic information from fellow patients, which is mostly obtained through digital platforms such as social media or social networks (Angela Trunfio et al. 2021). Hence, laboratory managers should facilitate the delightful patient so that the patient is eager to express his or her impressive experience by posting pictures, captions, and comments on social media.
This study also shows that the impact of customer service is moderated by the character or personality of the patient. This is in accordance with the see-determinant theory approach (Ryan and Deci 2020) and studies that show personality has a role in decision-making (El Othman et al. 2020). Openness as one of the personality traits (big five personalities) shows that the more an individual tends to have openness, the stronger the influence of delight on RVI and willingness to post and share on social media. This finding is in line with the study from Bayram and Aydemir (2017), which found a positive relationship between OPS and decision-making styles. This is logically understandable because the more open people are, the more likely they are to share. On another side, AGR was found to be not significant and has a negative influence, meaning that people with AGR weaken the influence of CDL on RVI and WSP. This finding aligns with the previous study (El Othman et al. 2020) that agreeable people are indeed more open and able to cooperate well, but when making decisions, someone with this personality type waits for another or is influenced by the opinions of others. This finding is reinforced by the profile of respondents of the study who are married and thus may need approval from their spouse or partner before going to the clinical laboratory. The result of the study implies that it is necessary to segment patients based on their personalities. Individuals with OPS segmentation have chances to become influencers in their respective social environments. This finding needs to extend in a future study with other personality traits, such as conscientiousness and extraversion.
This research model has strong predictive accuracy for PEX and moderate predictive accuracy for CDL, RVI, and WSP. This is understandable because there is only a single path that predicts both RVI and WSP. However, this is still classified as a meaningful effect size. The predictive relevance procedure with the out-of-sample approach (Q2_predict) indicates moderate predictive relevance for delight and both dependent variables. Thus, this model is considered adequate in predicting delight and behaviour intention in private clinical laboratory services and could be replicable in future studies with a different demography.

7. Conclusions

This research concludes that the PHP, LSA, perceived LTC, IFC, and SRV show adequate evidence as the antecedents of PEX in the private clinical laboratory setting. Further, the PEX could generate a highly emotional state as manifested in consumers delighted with health care service, which in turn drives the RVI and willingness to post and share good experiences on social media. The consumer with the openness personality trait tends to strengthen that relationship.
Finally, this research model provides a new contribution to healthcare management that integrates functional quality and technical quality as antecedents of PEX, specifically on clinical laboratory service and its effect on favourable behaviour intention mediated by CDL. The private clinical laboratory that pursues superior service to win the competition should take into account the effort to go beyond satisfaction and create CDL, which incorporates into their business strategy. Moreover, understanding the personality trait is beneficial for segmentation and marketing approaches, especially in social media platforms.
This research also notified some limitations, and one of them is that this study was only conducted in one clinical laboratory chain by taking samples from only five major branches, so it has limitations in generalizing the results. It is advised for the next study to use respondents from several laboratory clinics that have different managements with a larger sample size. The next limitation is that this study did not classify patients based on the type of test they performed. Certain tests that are more complex require not only a blood sample, but for example, a sample of urine or other body fluids. This certainly affects the service process and interactions with patients, which may also affect the PEX. This study also did not include the patient privacy factor, and this is important because currently, patient awareness is growing, and patients want their health status not to be exposed and confidentiality guaranteed. Lastly, we suggest in further research to measure PEX by a multidimensional approach. This can be done by hierarchical component analysis with a first and second order for a deeper assessment of the dimensions of PEX.

Author Contributions

Conceptualization, P.H.W. and F.A.; Methodology, A.A.; Software, A.A.; Validation, F.A.; Formal analysis, F.A. and A.A.; Investigation, F.A.; Resources, P.H.W.; Data curation, F.A.; Writing—original draft, P.H.W. and A.A.; Writing—review & editing, A.A.; Visualization, F.A.; Supervision, F.A.; Project administration, P.H.W. and A.A.; Funding acquisition, P.H.W. All authors have read and agreed to the published version of the manuscript.

Funding

This research received no external funding.

Institutional Review Board Statement

Not applicable.

Informed Consent Statement

Informed consent was obtained from all subjects involved in the study.

Data Availability Statement

The data that support the findings of this study are available on request from the corresponding author.

Conflicts of Interest

The authors declare no conflict of interest.

References

  1. Abubakar, Aisha Mohammed, Mustafa Ilkan, Raad Meshall Al-Tal, and Kayode Kolawole Eluwole. 2017. eWOM, revisit intention, destination trust and gender. Journal of Hospitality and Tourism Management 31: 220–27. [Google Scholar] [CrossRef]
  2. Addalia, Andriana, and Ferdi Antonio. 2022. Antecedents of the Sports Clinic Image and Its Impact on Visit Intention with Personality Traits as the Moderating Factor. Universal Journal of Public Health 10: 316–28. [Google Scholar] [CrossRef]
  3. Alexandrov, Aliosha, Bryan Lilly, and Emin Babakus. 2013. The effects of social-and self-motives on the intentions to share positive and negative word of mouth. Journal of the Academy of Marketing Science 41: 531–46. [Google Scholar] [CrossRef]
  4. Ali, Faleh Mohamed Hussain, Zlatko Nikoloski, and Husein Reka. 2015. Satisfaction and responsiveness with health-care services in Qatar—Evidence from a survey. Health Policy 119: 1499–505. [Google Scholar] [CrossRef]
  5. Almatrafi, Daliah, Najwa Altaweel, Mona Abdelfattah, Moayad Alqazlan, Hussam Darrar, Abdulrahman Alomari, Waed Yaseen, and Mohannad Alsulami. 2018. Assessment of customer satisfaction with the clinical laboratory services provided in King Abdullah Medical City, Makkah. The Egyptian Journal of Hospital Medicine 70: 2029–37. Available online: https://journals.ekb.eg/article_9413.html (accessed on 19 November 2022). [CrossRef]
  6. Angela Trunfio, Teresa, Arianna Scala, Cristiana Giglio, Giovanni Rossi, Anna Borrelli, Paolo Gargiulo, and Maria Romano. 2021. Modelling the hospital length of stay for patients undergoing laparoscopic appendectomy through a Multiple Regression Model. In 2021 International Symposium on Biomedical Engineering and Computational Biology. New York: Association for Computing Machinery, pp. 1–5. [Google Scholar] [CrossRef]
  7. Anggiani, Sarfilianty, Ferdi Antonio, and Antonius Adi. 2021. The Antecedents and Consequences of Idiosyncratic Service Experiences (ISE) Model; An Empirical Study in Transport and Health Care Industry. Webology 18: 223–32. Available online: https://www.webology.org/data-cms/articles/20210429104826amWEB18036.pdf (accessed on 24 November 2022). [CrossRef]
  8. Balter, Max L., John M. Leipheimer, Alvin I. Chen, Anil Shrirao, Tim J. Maguire, and Martin L. Yarmush. 2018. Automated end-to-end blood testing at the point-of-care: Integration of robotic phlebotomy with downstream sample processing. Technology 6: 59–66. [Google Scholar] [CrossRef]
  9. Bandura, Albert. 1989. Human agency in social cognitive theory. American Psychologist 44: 1175. [Google Scholar] [CrossRef] [PubMed]
  10. Barnes, Donald C., and Alexandra Krallman. 2019. Customer Delight: A Review and Agenda for Research. Journal of Marketing Theory and Practice 27: 174–95. [Google Scholar] [CrossRef]
  11. Bayram, Nuran, and Mine Aydemir. 2017. Decision-making styles and personality traits. International Journal of Recent Advances in Organizational Behaviour and Decision Sciences 3: 905–15. Available online: https://www.researchgate.net/profile/Mine-Aydemir-Dev/publication/330832648_Decision-Making_Styles_and_Personality_Traits/links/61a60d88b4bbff76e277843b/Decision-Making-Styles-and-Personality-Traits.pdf (accessed on 18 November 2022).
  12. Berry, Leonard L., and Neeli Bendapudi. 2007. Health care: A fertile field for service research. Journal of Service Research 10: 111–22. [Google Scholar] [CrossRef] [Green Version]
  13. Bleidorn, Wiebke, Theo A. Klimstra, Jaap J. Denissen, Peter J. Rentfrow, Jeff Potter, and Samuel D. Gosling. 2013. Personality maturation around the world: A cross-cultural examination of social-investment theory. Psychological Science 24: 2530–40. [Google Scholar] [CrossRef] [PubMed] [Green Version]
  14. Casper, Janina K., and Raymond Leonard. 2006. Understanding Voice Problems: A Physiological Perspective for Diagnosis and Treatment. Philadelphia: Lippincott Williams & Wilkins. [Google Scholar]
  15. Chahal, Hardeep, and Neetu Kumari. 2010. Development of multidimensional scale for healthcare service quality (HCSQ) in Indian context. Journal of Indian Business Research 2: 230–55. [Google Scholar] [CrossRef]
  16. Choi, Jihyang, and Jae Kook Lee. 2021. Confusing effects of fake news on clarity of political information in the social media environment. Journalism Practice 16: 2147–65. [Google Scholar] [CrossRef]
  17. Chomeya, Rungson. 2010. Quality of psychology test between Likert Scale 5 and 6 points. Journal of Social Sciences 6: 399–403. [Google Scholar] [CrossRef] [Green Version]
  18. Chun, Se-Hak, and Ariunzaya Nyam-Ochir. 2020. The effects of fast food restaurant attributes on customer satisfaction, revisit intention, and recommendation using LABSERV scale. Sustainability 12: 7435. [Google Scholar] [CrossRef]
  19. Collier, Natham, Forrest M. Hoffman, David M. Lawrence, Gretchen Keppel-Aleks, Charles Dunbar Koven, William Jay Riley, Mingquan Mu, and James T. Randerson. 2018. The International Land Model Benchmarking (ILAMB) System: Design, Theory, and Implementation. Journal of Advances in Modeling Earth Systems 10: 2731–54. [Google Scholar] [CrossRef] [Green Version]
  20. Dagger, Tracey S., and Jillian Carol Sweeney. 2006. The effect of service evaluations on behavioural intentions and quality of life. Journal of Service Research 9: 3–18. [Google Scholar] [CrossRef]
  21. Dalurzo, Mercedes L., Alejandro Avilés-Salas, Fernando Augusto Soares, Yingyong Hou, Yuan Li, Anna Stroganova, Büge Öz, Arif Abdillah, Hui Wan, and Yoon-La Choi. 2021. Testing for egfr mutations and alk rearrangements in advanced non-small-cell lung cancer: Considerations for countries in emerging markets. OncoTargets and Therapy 14: 4671. Available online: https://www.ncbi.nlm.nih.gov/pmc/articles/PMC8420791/ (accessed on 19 November 2022). [CrossRef]
  22. De Rosis, Sabrina, Francesca Pennucci, and Chiara Seghieri. 2019. Segmenting adolescents around social influences on their eating behaviour: Findings from Italy. Social Marketing Quarterly 25: 256–74. [Google Scholar] [CrossRef]
  23. Eisenbeiss, Maik, Markus Cornelißen, Klaus Backhaus, and Wayne D. Hoyer. 2014. Nonlinear and asymmetric returns on customer satisfaction: Do they vary across situations and consumers? Journal of the Academy of Marketing Science 42: 242–63. [Google Scholar] [CrossRef]
  24. El Othman, Radwan, Rola El Othman, Rabih Hallit, Sahar Obeid, and Souheil Hallit. 2020. Personality traits, emotional intelligence and decision-making styles in Lebanese universities medical students. BMC Psychology 8: 46. [Google Scholar] [CrossRef]
  25. Endeshaw, Berhanu. 2020. Healthcare service quality-measurement models: A review. Journal of Health Research 35: 106–17. [Google Scholar] [CrossRef]
  26. Fatma, Saba. 2014. Antecedents and consequences of customer experience management-a literature review and research agenda. International Journal of Business and Commerce 3: 32–49. Available online: https://papers.ssrn.com/sol3/papers.cfm?abstract_id=3015607 (accessed on 24 November 2022).
  27. Feist, Jess, Greogory John Feist, and Tomi-Ann Roberts. 2017. Teori Kepribadian. Theories of Personality.Buku 2: Edisi 8. Terjemahan: Raden Ajeng Hadwitia Dewi Pertiwi.Salemba Humanika, Jakarta Selatan. 308 hlm. Available online: https://epdf.tips/theories-of-personality7d838aad7601fbb979dfd9ab3d1f733179678.html (accessed on 25 November 2022).
  28. Fishbein, Martin, and Icek Ajzen. 1980. Predicting and understanding consumer behaviour: Attitude-behavior correspondence. In Understanding Attitudes and Predicting Social Behaviour. Edited by Icek Ajzen and Morris Fishbein. Englewood Cliffs: Prentice Hall, pp. 148–72. [Google Scholar]
  29. Friedman, Thomas. 2006. The first law of petropolitics. Ecologist-London And Wadebridge Then Slinfold Then London 36: 24. Available online: https://nghiencuuquocte.org/wp-content/uploads/2013/09/The-First-Law-of-Petropolitics-friedman.pdf (accessed on 18 November 2022).
  30. Garret-Bernardin, Annelyse, Tiziana Cantile, Vincenzo D’Antò, Alexandros Galanakis, Gabriel Fauxpoint, Gianmaria Fabrizio Ferrazzano, Sara De Rosa, Giulia Vallogini, Umberto Romeo, and Angela Galeotti. 2017. Pain experience and behaviour management in pediatric dentistry: A comparison between traditional local anesthesia and the wand computerized delivery system. Pain Research and Management 2017: 7941238. [Google Scholar] [CrossRef]
  31. Greaves, Ronda F., Sergio Bernardini, Maurizio Ferrari, Paolo Fortina, Bernard Gouget, Damien Gruson, Tim Lang, Tze Ping Loh, Howard A. Morris, Jason Y. Park, and et al. 2019. Key questions about the future of laboratory medicine in the next decade of the 21st century: A report from the Information Clarity C-Emerging Technologies Division. Clinica Chimica Acta 495: 570–89. [Google Scholar] [CrossRef] [PubMed]
  32. Gronroos, Christian. 1984. Strategic management and marketing in the service sector: A service quality and its marketing implication. European Journal of Marketing 18: 36–44. [Google Scholar] [CrossRef]
  33. Haeckel, Stephan H., Lewis P. Carbone, and Leonard L. Berry. 2003. How to Lead the Customer Experience. Marketing Management 12: 18–23. Available online: https://www.elibrary.ru/item.asp?id=6447600 (accessed on 18 November 2022).
  34. Hailu, Hiwot Amare, Anteneh Yalew, Adinew Desale, Habtamu Asrat, Sisay Kebede, Daniel Dejene, Hiwot Abebe, Andargachew Gashu, Nebiyou Yenealem, Birhan Moges, and et al. 2020. Physicians’ satisfaction with clinical laboratory services at public hospitals in Ethiopia: A national survey. PLoS ONE 15: e0232178. [Google Scholar] [CrossRef]
  35. Hair, Joseph F., Jeffrey J. Risher, Marko Sarstedt, and Christian M. Ringle. 2019. When to use and how to report the results of PLS-SEM. European Business Review 31: 2–24. [Google Scholar] [CrossRef]
  36. Han, Heesup, Kiattipoom Kiatkawsin, Wansoo Kim, and Sanghyeop Lee. 2017. Investigating customer loyalty formation for wellness spa: Individualism vs. collectivism. International Journal of Hospitality Management 67: 11–23. [Google Scholar] [CrossRef]
  37. Hefner, Jennifer L., Ann Scheck McAlearney, Nicole Spatafora, and Susan D. Moffat-Bruce. 2019. Beyond Patient Satisfaction: Optimizing the Patient Experience. Available online: https://pubmed.ncbi.nlm.nih.gov/32077654/ (accessed on 24 November 2022).
  38. Hewitson, Paul, Alex Skew, Chris Graham, Crispin Jenkinson, and Angela Coulter. 2014. People with limiting long-term conditions report poorer experiences and more problems with hospital care. BMC Health Services Research 14: 33. [Google Scholar] [CrossRef] [PubMed] [Green Version]
  39. Holdford, David, and Richard Schulz. 1999. Effect of technical and functional quality on patient perceptions of pharmaceutical service quality. Pharmaceutical Research 16: 1344–51. [Google Scholar] [CrossRef] [PubMed]
  40. Howe, Lauren C., and Jon Alexander Krosnick. 2017. Attitude strength. Annual Review of Psychology 68: 327–51. Available online: https://pprg.stanford.edu/wp-content/uploads/2017-Attitude-Strength-Howe-Krosnick.pdf (accessed on 24 November 2022). [CrossRef]
  41. Indonesia Social Security Agency of Health. 2022. Available online: https://www.bpjs-kesehatan.go.id/bpjs/post/read/2022/2360/BPJS-Kesehatan-Mendengar-2022-Jaring-Masukan-tentang-Pengelolaan-JKN-ke-Depan (accessed on 18 November 2022).
  42. Jatiyananda, Chanantakanok, Wasutida Nurittamont, and Bordin Phayaphrom. 2021. Understanding the Social Media Marketing Activities Influence on Revisit Intention in Beauty Clinics: The Case Study in Bangkok, Thailand. PSAKU International Journal of Interdisciplinary Research, Forthcoming, Asian Administration & Management Review 4: 31–45. Available online: https://papers.ssrn.com/sol3/papers.cfm?abstract_id=4028928 (accessed on 18 November 2022).
  43. Javed, Saad Ahmed, Sifeng Liu, Amin Mahmoudi, and Muhammad Nawaz. 2019. Patients’ satisfaction and public and private sectors’ health care service quality in Pakistan: Application of grey decision analysis approaches. The International Journal of Health Planning and Management 34: e168–e182. [Google Scholar] [CrossRef] [Green Version]
  44. Jeon, Hyeon Mo, Se Ran Yoo, and Seon Hee Kim. 2020. The relationships among experience, delight, and recollection for revisit intention in chocolate exposition. Sustainability 12: 8644. [Google Scholar] [CrossRef]
  45. Jonkisz, Alesandra, Piotr Karniej, and Dorota Krasowska. 2021. SERVQUAL method as an “Old New” tool for improving the quality of medical services: A literature review. International Journal of Environmental Research and Public Health 18: 10758. [Google Scholar] [CrossRef] [PubMed]
  46. Junio, Maria Michelle V., Jae H. Kim, and Timothy Jeonglyeol Lee. 2017. Competitiveness attributes of a medical tourism destination: The case of South Korea with importance-performance analysis. Journal of Travel & Tourism Marketing 34: 444–60. [Google Scholar] [CrossRef]
  47. Kao, Chiu-Ying, ShengHshiung Tsaur, and Chung-Ching Huang. 2020. The scale development of organizational culture on customer delight. International Journal of Contemporary Hospitality Management 32: 3067–90. [Google Scholar] [CrossRef]
  48. Kazdin, Alan Edward. 2000. Encyclopedia of Psychology. Edited by American Psychological Association. Washington, DC: American Psychological Association, vol. 8, p. 4128. Available online: http://www.indigenouspsych.org/Members/Churchill,%20Scott/Churchill%20-%20Encyclopedia%20Articles%20Phenom.pdf (accessed on 19 November 2022).
  49. Khatri, Arti, and Shikha Sharma. 2021. Assessment of parent satisfaction with phlebotomy services at a paediatric hospital in East Delhi. International Journal of Current Research and Review 13: 104–11. Available online: https://ijcrr.com/uploads/3766_pdf.pdf (accessed on 24 November 2022). [CrossRef]
  50. Klaus, Philipp ‘Phil’, and Stan Maklan. 2013. Towards a better measure of customer experience. International Journal of Market Research 55: 227–46. [Google Scholar] [CrossRef] [Green Version]
  51. Kock, Ned, and Pierre Hadaya. 2018. Minimum sample size estimation in PLS-SEM: The inverse square root and gamma-exponential methods. Information Systems Journal 28: 227–61. [Google Scholar] [CrossRef]
  52. Kuppelwieser, Volker, and Philipp Klaus. 2020. Guest editorial: Age is a construct, not a characteristic. Journal of Services Marketing 35: 1–6. [Google Scholar] [CrossRef]
  53. LaCaille, Lara. 2020. Theory of Reasoned Action. In Encyclopedia of Behavioral Medicine. Edited by M. D. Gellman. Cham: Springer. [Google Scholar] [CrossRef]
  54. Laukkanen, Emilia, Katri Vehviläinen-Julkunen, Olavi Louheranta, and Lauri Kuosmanen. 2019. Psychiatric nursing staffs’ attitudes towards the use of containment methods in psychiatric inpatient care: An integrative review. International Journal of Mental Health Nursing 28: 390–406. [Google Scholar] [CrossRef]
  55. LaVela, Sherri L., and Andrew Gallan. 2014. Evaluation and measurement of PEX. PEX Journal 1: 28–36. Available online: https://papers.ssrn.com/sol3/papers.cfm?abstract_id=2643249 (accessed on 16 November 2022).
  56. Lee, Robert Edward. 2018. Phycology. Cambridge: Cambridge University Press. [Google Scholar]
  57. Lemon, Katherine N., and Peter C. Verhoef. 2016. Understanding customer experience throughout the customer journey. Journal of Marketing 80: 69–96. [Google Scholar] [CrossRef]
  58. Levana, Victorine, and Ferdi Antonio. 2022. Antecedents of Patient Satisfaction in Private Clinical Laboratories toward Patient Loyalty with Switching Cost and Location as Moderating Factors (An Empirical Study from Indonesia). Open Access Macedonian Journal of Medical Sciences 10: 1463–71. [Google Scholar] [CrossRef]
  59. Li, Yaojun, and Dean Garrat. 2005. The foundations of experimental/empirical research methods. In Research Methods in the Social Sciences. London: Sage Publications Ltd., p. 198. Available online: https://www.research.manchester.ac.uk/portal/files/32297727/FULL_TEXT.PDF (accessed on 24 November 2022).
  60. Liengaard, Benjamin Dybro, Pratyush Nidhi Sharma, G. Tomas M. Hult, Morten Berg Jensen, Marko Sarstedt, Joseph F. Hair, and Christian M. Ringle. 2021. Prediction: Coveted, Yet Forsaken? Introducing a Cross-validated Predictive Ability Test in Partial Least Squares Path Modeling. Decision Sciences 52: 362–92. [Google Scholar] [CrossRef]
  61. Maklan, Stan, and Philipp Klaus. 2011. Customer Experience: Are We Measuring the Right Things? International Journal of Market Research 53: 1–22. [Google Scholar] [CrossRef]
  62. McCrae, Robert Roger, and Oliver P. John. 1992. An introduction to the five-factor model and its applications. Journal of personality 60: 175–215. [Google Scholar] [CrossRef]
  63. McCrae, Robert Roger, and Paul T. Costa. 2003. Personality in Adulthood: A Five-Factor Theory Perspective. New York: Guilford Press. [Google Scholar]
  64. Memon, Mumtaz Ali, Hiram Ting, Jun-Hwa Cheah, Ramayah Thurasamy, Francis Chuah, and Tat Huei Cham. 2020. Sample size for survey research: Review and recommendations. Journal of Applied Structural Equation Modeling 4: 1–20. [Google Scholar] [CrossRef] [PubMed]
  65. Memon, Mumtaz Ali, Ramayah Thurasamy, Jun-Hwa Cheah, Hiram Ting, Francis Chuah, and Tat Huei Cham. 2021. PLSSEM statistical programs: A review. Journal of Applied Structural Equation Modeling 5: 1–14. [Google Scholar] [CrossRef] [PubMed]
  66. Ministry of Health. 2022. Profil Kesehatan Indonesia 2021. Available online: https://www.kemkes.go.id/downloads/resources/download/pusdatin/profil-kesehatan-indonesia/Profil-Kesehatan-2021.pdf (accessed on 17 November 2022).
  67. Morrison, Doug, Anton Milan, and Nontas Antonakos. 2019. Estimating Uncertainty in Instance Segmentation Using Dropout Sampling. Available online: https://www.amazon.science/publications/estimating-uncertainty-in-instance-segmentation-using-dropout-sampling (accessed on 18 November 2022).
  68. Norcross, John C., and Bruce E. Wampold. 2018. A new therapy for each patient: Evidence-based relationships and responsiveness. Journal of Clinical Psychology 74: 1889–906. [Google Scholar] [CrossRef] [PubMed]
  69. Oliver, Richard L., Roland T. Rust, and Sajeev Varki. 1997. Customer Delight: Foundations, Findings, and Managerial Insight. Journal of Retailing 73: 311–36. [Google Scholar] [CrossRef]
  70. Parasuraman, A., Joan Ball, Lerzan Aksoy, Timothy Lee Keiningham, and Mohamed Zaki. 2020. More Than A Feeling? Toward A Theory Of Customer Delight. Journal of Service Management 32: 1–26. [Google Scholar] [CrossRef]
  71. Parasuraman, A., Valerie A. Zeithaml, and Leonard L. Berry. 1988. SERVQUAL: A multiple-item scale for measuring consumer perceptions of service quality. Journal of Retailing 64: 12–40. [Google Scholar]
  72. Pau, David, Gabriel Choukroun, Olivier Moranne, Cécile Vigneau, Corinne Isnard-Bagnis, X. Boutry, S. Gokou, Stéphanie Rouanet, and A. Triglia. 2013. Results of a study evaluating patient’s perception regarding their erythropoiesis stimulating agent treatment in chronic kidney disease using a choice based conjoint analysis. Value in Health 16: A182–A183. [Google Scholar] [CrossRef] [Green Version]
  73. Pee, Loogeok G. 2018. Affordances for sharing domain-specific and complex knowledge on enterprise social media. International Journal of Information Management 43: 25–37. [Google Scholar] [CrossRef]
  74. Pettitt, David, James Smith, Nick Meadows, Zeeshaan Arshad, Anna Schuh, David DiGiusto, Chas Bountra, Georg Holländer, Richard Barker, and David Brindley. 2016. Regulatory barriers to the advancement of precision medicine. Expert Review of Precision Medicine and Drug Development 1: 319–29. [Google Scholar] [CrossRef]
  75. Philip, Nada Y., Joel José Puga Coelho Rodrigues, Honggang Wang, Simon James Fong, and Jia Chen. 2021. Internet of Things for in-home health monitoring systems: Current advances, challenges and future directions. IEEE Journal on Selected Areas in Communications 39: 300–10. Available online: https://ieeexplore.ieee.org/abstract/document/9325147/ (accessed on 24 November 2022). [CrossRef]
  76. Piazza, Julie, Sandra Merkel, Harry Neusius, Susan Murphy, Joan Gargaro, Brooke Rothberg, and Kristin Ann Kullgren. 2019. It’s not just a needlestick: Exploring phlebotomists’ knowledge, training, and use of comfort measures in pediatric care to improve the PEX. The Journal of Applied Laboratory Medicine 3: 847–56. [Google Scholar] [CrossRef] [PubMed]
  77. Ramessur, Vinaysing, Dinesh Kumar Hurreeram, and Kaylasson Maistry. 2015. Service quality framework for clinical laboratories. International Journal of Health Care Quality Assurance 28: 367–81. [Google Scholar] [CrossRef] [PubMed]
  78. Ramya, N., and S. A. Mohammed Ali. 2016. Factors affecting consumer buying behaviour. International Journal of Applied Research 2: 76–80. Available online: https://www.researchgate.net/profile/Ramya-N/publication/316429866_Factors_affecting_consumer_buying_behaviour/links/58fd7b5e0f7e9ba3ba55f83c/Factors-affecting-consumer-buying-behaviour.pdf (accessed on 26 November 2022).
  79. Ryan, Richard M., and Edward L. Deci. 2020. Intrinsic and extrinsic motivation from a self-determination theory perspective: Definitions, theory, practices, and future directions. Contemporary Educational Psychology 61: 101860. [Google Scholar] [CrossRef]
  80. Sarstedt, Marko, Christian M. Ringle, and Joseph F. Hair. 2017. Treating unobserved heterogeneity in PLS-SEM: A multi-method approach. In Partial Least Squares Path Modeling. Cham: Springer, pp. 197–217. [Google Scholar] [CrossRef]
  81. Sarstedt, Marko, Joseph F. Hair, Mandy Pick, Benjamin Dybro Liengaard, Lăcrămioara Radomir, and Christian M. Ringle. 2022. Progress in partial least squares structural equation modeling use in marketing research in the last decade. Psychology and Marketing 39: 1035–64. [Google Scholar] [CrossRef]
  82. Schmitt, Bernd. 1999. Experiential marketing. Journal of Marketing Management 15: 53–67. [Google Scholar] [CrossRef]
  83. Shale, Suzanne. 2013. PEX as an indicator of clinical quality in emergency care. Clinical Governance: An International Journal 18: 285–92. [Google Scholar] [CrossRef]
  84. Sharma, Pratyush Nidhi, Benjamin Dybro Liengaard, Joseph F. Hair, Marko Sarstedt, and Christian M. Ringle. 2022. Predictive Model Assessment and Selection in Composite-based Modeling Using PLS-SEM: Extensions and Guidelines for Using CVPAT. European Journal of Marketing. Vol. ahead-of-print. No. ahead-of-print. [Google Scholar] [CrossRef]
  85. Shmueli, Galit, Marko Sarstedt, Joseph F. Hair, Jun-Hwa Cheah, Hiram Ting, Santha Vaithilingam, and Christian M. Ringle. 2019. Predictive model assessment in PLS-SEM: Guidelines for using PLSpredict. European Journal of Marketing 53: 2322–47. [Google Scholar] [CrossRef]
  86. Shoukat, Muhammad Haroon, and Haywantee Ramkissoon. 2022. Customer delight, engagement, experience, value co-creation, place identity, and revisit intention: A new conceptual framework. Journal of Hospitality Marketing & Management 31: 757–75. [Google Scholar] [CrossRef]
  87. Srisawatsakul, Charnsak, Gerald Quirchmayr, and Borworn Papasratorn. 2014. A pilot study on the effects of personality traits on the usage of mobile applications: A case study on office workers and tertiary students in the Bangkok area. In Recent Advances in Information and Communication Technology. Cham: Springer, pp. 145–55. [Google Scholar] [CrossRef]
  88. Swain, Swapnarag, and Nirmal Chandra Kar. 2018. Hospital service quality as antecedent of patient satisfaction—A conceptual framework. International Journal of Pharmaceutical and Healthcare Marketing. Emerald Group Publishing Limited 12: 251–69. [Google Scholar] [CrossRef]
  89. Tackett, Jennifer L., Maciel M. Hernández, and Nancy Eisenberg. 2019. Agreeableness. Available online: https://psyarxiv.com/cr273/download?format=pdf (accessed on 24 November 2022).
  90. Torres, Edwin N., Tingting Zhang, and Giulio Ronzoni. 2020. Measuring delightful customer experiences: The validation and testing of a customer delight scale along with its antecedents and effects. International Journal of Hospitality Management 87: 102380. [Google Scholar] [CrossRef]
  91. Tseng, Mitchell M., Ma Qinhai, and Chuan-Jun Su. 1999. Mapping customers’ service experience for operations improvement. Business Process Management Journal 5: 50–64. [Google Scholar] [CrossRef] [Green Version]
  92. Tu, Lei, Yaqiong Lv, Zhang Yajie, and Cao Xiaohua. 2021. Logistics service provider selection decision making for healthcare industry based on a novel weighted density-based hierarchical clustering. Advanced Engineering Informatics 48: 101301. [Google Scholar] [CrossRef]
  93. Van Campen, Cretien, Herman Sixma, Ronald D. Friele, Jan J. Kerssens, and Loe Peters. 1995. Quality of care and patient satisfaction: A review of measuring instruments. Medical Care Research and Review 52: 109–33. [Google Scholar] [CrossRef]
  94. Völker, Linus A., Jessica Kaufeld, Wolfgang Miesbach, Sebastian Brähler, Martin Reinhardt, Lucas Kühne, Anja Mühlfeld, Adrian Schreiber, Jens Gaedeke, Jan Menne, and et al. 2020. Real-world data confirm the effectiveness of caplacizumab in acquired thrombotic thrombocytopenic purpura. Blood Advances 4: 3085–92. [Google Scholar] [CrossRef]
  95. Wang, Limin, Wei Li, Wen Li, and Luc Van Gool. 2018. Appearance-and-relation networks for video classification. In Proceedings of the IEEE Conference on Computer Vision and Pattern Recognition, Salt Lake City, UT, USA, June 16–18; pp. 1430–39. Available online: https://openaccess.thecvf.com/content_cvpr_2018/html/Wang_Appearance-and-Relation_Networks_for_CVPR_2018_paper.html (accessed on 25 November 2022).
  96. Wang, Nathan B., and Kate E. Galloway. 2021. Evaluation of Lee et al.: Clarity and interpretation of mutual information in promoter transfer functions. Cell Systems 12: 1023–25. [Google Scholar] [CrossRef]
  97. Weiss, Majorie D., Steve Tyink, and Curt Kubiak. 2009. Delivering ideal employee experiences. Aaohn Journal 57: 210–15. [Google Scholar] [CrossRef] [Green Version]
  98. Werder, Matthew. 2015. Health information technology: A key ingredient of the PEX. PEX Journal 2: 143–47. [Google Scholar] [CrossRef] [Green Version]
  99. Wolf, Jason A., Victoria Niederhauser, Dianne Marshburn, and Sherri L. LaVela. 2014. Defining PEX. PEX Journal 1: 7–19. Available online: https://pxjournal.org/cgi/viewcontent.cgi?article=1004&context=journal (accessed on 25 November 2022).
  100. Wolf, Jason A., Victoria Niederhauser, Dianne Marshburn, and Sherri L. LaVela. 2021. Reexamining “Defining PEX”: The human experience in healthcare. PEX Journal 8: 16–29. Available online: https://pxjournal.org/journal/vol8/iss1/4/ (accessed on 24 November 2022).
  101. Woo, Selin, and Mankyu Choi. 2021. Medical service quality, patient satisfaction and intent to revisit: Case study of public hub hospitals in the Republic of Korea. PLoS ONE 16: e0252241. [Google Scholar] [CrossRef]
  102. Wu, Ing-Long, Jhao-Yin Li, and Chu-Ying Fu. 2011. The adoption of mobile healthcare by hospital’s professionals: An integrative perspective. Decision Support Systems 51: 587–96. [Google Scholar] [CrossRef]
  103. Wu, Laurie, Anna S. Mattila, Chen-Ya Wang, and Lydia Hanks. 2016. The impact of power on service customers’ willingness to post online reviews. Journal of Service Research 19: 224–38. [Google Scholar] [CrossRef]
  104. Xie, Zhenzhen, and Calvin Or. 2017. Associations between waiting times, service times, and patient satisfaction in an endocrinology outpatient department: A time study and questionnaire survey. INQUIRY: The Journal of Health Care Organization, Provision, and Financing 54: 0046958017739527. [Google Scholar] [CrossRef] [PubMed]
  105. Yatham, Lakshmi N., Sidney H. Kennedy, Sagar V. Parikh, Ayal Schaffer, David J. Bond, Benicio N. Frey, Verinder Sharma, Benjamin I. Goldstein, Soham Rej, Serge Beaulieu, and et al. 2018. Canadian Network for Mood and Anxiety Treatments (CANMAT) and International Society for Bipolar Disorders (ISBD) 2018 guidelines for the management of patients with bipolar disorder. Bipolar Disorders 20: 97–170. [Google Scholar] [CrossRef]
  106. Ying, Song, Daniele Leone, Antonella Francesca Cicchiello, Antonella Francesca Cicchiello, and Amirreza Kazemikhasragh. 2022. Industrial dynamics and economic growth in health-care context. Evidence from selected OECD countries. Journal of Business & Industrial Marketing 37: 1706–16. [Google Scholar] [CrossRef]
  107. Yip, Kenneth, Suk-King Pang, Kui-Tim Chan, Chi-Kuen Chan, and Tsz-Leung Lee. 2016. Improving outpatient phlebotomy service efficiency and PEX using discrete-event simulation. International Journal of Health Care Quality Assurance 29: 733–43. [Google Scholar] [CrossRef] [PubMed]
  108. Yogarajah, Mahinda, Ruth Child, Niruj Agrawal, Sarah Cope, Mark Edwards, and Marco Mula. 2019. Functional seizures: An evaluation of the attitudes of general practitioners local to a tertiary neuroscience service in London. Epilepsia Open 4: 54–62. [Google Scholar] [CrossRef] [PubMed]
Figure 1. Conceptual framework.
Admsci 13 00071 g001
Figure 2. Simple slope analysis: (a) Moderation effect of OPS on the impact of CDL to RVI; (b) Moderation effect of OPS on the impact of CDL to WSP.
Admsci 13 00071 g002
Figure 3. Importance-performance map of indicators.
Admsci 13 00071 g003
Figure 4. Result model.
Admsci 13 00071 g004
Table 1. Conceptualised definitions of constructs.
ConstructsConceptualised DefinitionReferences
Staff AppearanceThe form of the physical appearance of the individual that provides the service and its supporting tangibility (such as clothing), which give a positive impression to othersWang et al. (2018)
Laboratory Staff AttitudeThe pattern of staff caring attitude, tendency or anticipatory readiness, or predisposition to adapt in the service environment contextHowe and Krosnick (2017)
Information ClarityInformation conveyed clearly to patients in the service process affects customer understanding of specific information that has an impact on the overall evaluationChoi and Lee (2021)
Staff ResponsivenessThe ability of the staff which is carried out directly to provide services quickly and responsively to the patient’s request Norcross and Wampold (2018)
Laboratory ambienceThe environment of services provided by the health care provider includes the facilities’ cleanliness, the building’s condition, and physical factor that make patients convenientWu et al. (2016)
Phlebotomy processThe process of taking blood from the circulation through a puncture or incision can be through a vein, artery, or capillary with the right technique to maintain the composition of the analyteAlmatrafi et al. (2018)
Laboratory technologyPatient’s perception of modern technology or sophisticated equipment provided by laboratories in the healthcare processYip et al. (2016)
Report resultThe process to inform the result of laboratory examination and the ease and speed of getting lab results that affect the patient experienceVölker et al. (2020)
Revisit intentionThe customer’s desire to revisit the same health service to get the healthcare they needChun and Nyam-Ochir (2020)
Willingness to share and post on social mediaThe willingness to share positive things and the intention to take photos related to the service delivery and spreading information through social media Javed et al. (2019)
AgreeablenessAgreeableness is part of a person’s motivational system that comes from a process of self-regulation, in which a person is driven to gain intimacy, unity, and solidarity with his groupMcCrae and Costa (2003)
OpennessOpenness is what separates people who prefer diversity and people who need the perfect ending, and who remain comfortable with their associations with familiar things and peopleFeist et al. (2017)
Table 2. Respondent demographic profiles.
Demographic VariablesSample (n)Percentage (%)
GenderMale12366.1
Female6333.9
Do not want to mention00
Age20–30 years9249.5
31–40 years6333.9
41–50 years2211.8
>50 years94.8
EducationHigh School (SMP/SMA)3116.7
Bachelor Degree (S1)10858.1
Post Graduate (S2/S3)4725.2
OccupationPrivate sector employee7942.5
Professional2211.8
Self-employed137
Part-time/Freelancer31.6
Housewife3418.3
Retired84.3
Student94.8
Others189.7
Current ResidenceJakarta and its surroundings15281.7
Other areas3418.3
Table 3. Respondent behavioural history profile.
Respondent Behavioural History VariableSample (n)Percentage (%)
Have visited other clinical laboratories before visiting Diagnos Clinical LaboratoryTMYes12768.3
No5931.7
Frequency of visits for blood tests at Diagnos Clinical LaboratoryTM in one last year1–2 times12868.8
3–4 times2915.6
>5 times2915.6
The reason for visiting the Diagnos Clinical LaboratoryTM for the last laboratory checkPersonal initiative5931.7
Referrals from doctors3518.8
Referrals from Hospitals/Clinics94.8
Requests from companies/institutions7037.6
Others137.1
The bearer of laboratory test costsSelf/family6736.0
Company claims (reimbursement)9249.5
Private insurance2111.3
Others63.2
Owned and most frequently used social mediaInstagram7439.8
Facebook126.5
Tiktok5127.4
Twitter115.9
Others3820.4
Table 4. Reliability and validity analysis.
VariableIndicatorOuter LoadingCACRAVE
SAPSAP10.8710.7850.9010.819
SAP20.938
LSALSA10.8980.7630.8940.809
LSA30.901
IFCIFC10.6570.7320.8470.653
IFC20.854
IFC30.893
SRVSRV10.7870.8530.9120.776
SRV20.936
SRV30.911
LABLAB10.9670.7980.8970.813
LAB20.831
PHPPHP10.8450.8280.8970.743
PHP30.861
PHP40.880
LTCLTC10.9300.8430.9080.768
LTC20.933
LTC30.753
RSTRST10.9610.9000.9500.908
RST30.945
PEXPEX10.8760.8700.9200.794
PEX20.894
PEX30.903
CDLCDL10.8800.8950.9350.826
CDL20.921
RVIRVI10.9060.8410.9050.760
RVI20.885
RVI30.822
WSPWSP10.8380.7950.8810.713
WSP20.931
WSP30.755
AGRAGR10.8650.8850.9290.814
AGR20.908
AGR30.932
OPSOPS10.8550.7570.8560.665
OPS20.819
OPS30.771
CA: Cronbach’s alpha; CR: composite reliability; AVE: average variance extracted; SAP: staff appearance; LSA: laboratory staff attitude; IFC: information clarity; SRV: staff responsiveness; LAB: laboratory ambience; PHP: phlebotomy process; LTC: laboratory technology; RST: result; PEX: patient experience; CDL: customer delight; RVI: revisit intention; WSP: willingness to share and post on social media; AGR: agreeableness; OPS: openness.
Table 5. Discriminant validity.
VarAGRCDLIFCLABLSALTCOPSPEXPHPRSTRVISRVSAPWSP
AGR
CDL0.654
IFC0.7050.710
LAB0.1950.1980.250
LSA0.7560.8790.7080.241
LTC0.4620.6260.5820.5240.506
OPS0.7460.6180.8210.3110.7770.501
PEX0.7860.7690.8360.3080.8100.6670.839
PHP0.6460.5120.7500.2330.6570.4920.8320.824
RST0.2350.2940.2690.4410.2770.5330.3190.3050.271
RVI0.6670.6300.6430.3700.5930.8180.6820.7960.7460.377
SRV0.6740.5750.7650.2850.6290.4620.7210.7730.7400.2350.658
SAP0.2060.1270.3260.1950.1880.2380.2700.1010.1080.0650.0930.273
WSP0.7460.6790.7730.2030.6620.5350.7950.8170.7630.2110.6950.6770.348
SAP: staff appearance; LSA: laboratory staff attitude; IFC: information clarity; SRV: staff responsiveness; LAB: laboratory ambience; PHP: phlebotomy process; LTC: laboratory technology; RST: result; PEX: patient experience; CDL: customer delight; RVI: revisit intention; WSP: willingness to share and post on social media; AGR: agreeableness; OPS: openness.
Table 6. Cross-validated predictive ability test result.
PLS-SEM vs. IAPLS-SEM vs. LM
Average Loss Differencep-Values *Average Loss Differencep-Values *
CDL−0.1710.0000.0960.000
PEX−0.1850.0000.0110.245
RVI−0.1780.0000.1370.000
WSP−0.1550.0000.0870.000
Overall−0.172 **0.0000.083 ***0.000
* Sig. at p ≤ 0.05; ** The PLS-SEM predictions are significantly better than the naïve IA prediction benchmark. *** The PLS-SEM predictions are not significantly better than the LM prediction benchmark. PLS-SEM: partial least square-structural equation modeling; IA: indicator averages; LM: linear model; PEX: patient experience; CDL: customer delight; RVI: revisit intention; WSP: willingness to share and post on social media.
Table 7. Hypothesis test result.
NoHypothesisStandardised CoefficientsT-StatisticsCI 5%CI 95%p-Values *Results
H1SAP → PEX0.0360.754−0.0420.1150.225Hypothesis not supported
H2LSA → PEX0.2374.2270.1400.3240.000Hypothesis supported
H3IFC → PEX0.1813.5140.0930.2630.000Hypothesis supported
H4SRV → PEX0.1682.9730.0740.2580.001Hypothesis supported
H5LAB → PEX−0.0180.400−0.1050.0470.345Hypothesis not supported
H6PHP → PEX0.2765.4320.1900.3590.000Hypothesis supported
H7LTC → PEX0.2333.8430.1380.3370.000Hypothesis supported
H8RST → PEX0.0400.916−0.0320.1100.180Hypothesis not supported
H9PEX → CDL0.68016.4250.6090.7440.000Hypothesis supported
H10CDL → RVI0.3293.5320.1860.4880.000Hypothesis supported
H11CDL → WSP0.2954.1230.1790.4110.000Hypothesis supported
H12CDL x AGR → RVI−0.0740.880−0.2160.0620.190Hypothesis not supported
H13CDL x AGR → WSP−0.0941.208−0.2210.0340.114Hypothesis not supported
H14CDL x OPS → RVI0.2633.3310.1370.3930.000Hypothesis supported
H15CDL x OPS → WSP0.2212.6660.0810.3570.004Hypothesis supported
* Sig. at p ≤ 0.05; CI: confidence interval; SAP: staff appearance; LSA: laboratory staff attitude; IFC: information clarity; SRV: staff responsiveness; LAB: laboratory ambience; PHP: phlebotomy process; LTC: laboratory technology; RST: result; PEX: patient experience; CDL: customer delight; RVI: revisit intention; WSP: willingness to share and post on social media; AGR: agreeableness; OPS: openness.
Table 8. Specific indirect effect.
PathStandardised Coefficientsp-Values *
PHP → PEX → CDL → RVI0.0620.003
PEX → CDL → WSP0.200<0.001
SRV → PEX → CDL → RVI0.0380.013
PHP → PEX → CDL → WSP0.0550.002
IFC → PEX → CDL → RVI0.0400.013
LTC → PEX → CDL → RVI0.0520.008
IFC → PEX → CDL → WSP0.0360.004
PEX → CDL → RVI0.2240.001
LSA → PEX → CDL → WSP0.0470.003
LSA → PEX → CDL → RVI0.0530.004
LTC → PEX → CDL → WSP0.0470.005
SRV → PEX → CDL → WSP0.0340.011
* Sig. at p ≤ 0.05; SAP: staff appearance; LSA: laboratory staff attitude; IFC: information clarity; SRV: staff responsiveness; LAB: laboratory ambience; PHP: phlebotomy process; LTC: laboratory technology; RST: result; PEX: patient experience; CDL: customer delight; RVI: revisit intention; WSP: willingness to share and post on social media.
Disclaimer/Publisher’s Note: The statements, opinions and data contained in all publications are solely those of the individual author(s) and contributor(s) and not of MDPI and/or the editor(s). MDPI and/or the editor(s) disclaim responsibility for any injury to people or property resulting from any ideas, methods, instructions or products referred to in the content.

