Article

A GIS-Based Comparative Groundwater Vulnerability Assessment Using Modified-DRASTIC, Modified-SINTACS and NV Index in a Porous Aquifer, Greece

by
Marios C. Kirlas
1,*,
Dimitrios K. Karpouzos
1,
Pantazis E. Georgiou
1 and
Nicolaos Theodossiou
2
1
School of Agriculture, Aristotle University of Thessaloniki, 54124 Thessaloniki, Greece
2
School of Civil Engineering, Aristotle University of Thessaloniki, 54124 Thessaloniki, Greece
*
Author to whom correspondence should be addressed.
Environments 2023, 10(6), 95; https://doi.org/10.3390/environments10060095
Submission received: 5 April 2023 / Revised: 30 May 2023 / Accepted: 2 June 2023 / Published: 4 June 2023

Abstract

:
Groundwater vulnerability assessment is of pivotal importance for the sustainable management of groundwater resources, particularly in regions with intense agricultural activity. This research primarily aims to assess and delineate groundwater vulnerability zones using a comparative approach of three different GIS-based modified models, namely Pesticide DRASTIC-LU, Nitrate SINTACS-LU and Nitrate NV index. For this reason, eight hydrogeological parameters were employed to analyze the spatial distribution of groundwater vulnerability in the Nea Moudania aquifer, Chalkidiki, Greece. This multi-model methodology was implemented to ascertain the most reliable method for the study area. Results indicated that the southern and southwestern parts of the study area exhibited the highest vulnerability potential, whilst the northern part displayed the lowest. Moreover, single-parameter sensitivity analysis has revealed that land use and topography were the most critical parameters of the vulnerability indexes, whereas hydraulic conductivity was the least influential. Finally, the three vulnerability models were validated with nitrate concentrations of groundwater samples. Results revealed that the Nitrate NV index was the most accurate method, trailed by the Pesticide DRASTIC-LU and the Nitrate SINTACS-LU.

1. Introduction

In many countries, groundwater has a significant contribution to fresh water supply for various anthropogenic activities associated with the industry, irrigation, human consumption and economic development [1]. During the last few decades, an unprecedented development in the utilization of groundwater resources has been seen, with estimates suggesting that groundwater covers more than 30% of the world’s water demand [2]. Especially in regions characterized by arid, semi-arid or Mediterranean climates, groundwater often represents the primary potable water source, particularly where scarcity of surface water is substantial.
Notwithstanding, groundwater quality and quantity are at high risk due to the haphazard development of groundwater resources [3,4]. In particular, numerous anthropogenic activities, such as population growth, rapid urbanization, deforestation, intensive agriculture, alterations in land use and industrialization, lead to serious groundwater quality degradation and depletion [5,6,7]. Furthermore, climate variability is a climatic factor that has the propensity to stress groundwater and exacerbate the situation by influencing groundwater recharge markedly [3,8]. In recent years, in various agricultural areas, the extensive application of chemical fertilizers has caused substantial nitrate pollution of aquifers, which in turn, has crucial effects on public health and the ecosystem [7,9,10,11]. Hence, the safeguarding of groundwater and pollution prevention are fundamental prerequisites for efficient groundwater management and the socioeconomic advancement of an area [12,13].
A cost-effective key tool for the prevention and reduction of groundwater pollution can be the assessment of groundwater vulnerability through the utilization of various techniques and methodologies, as proposed in the literature [14,15,16]. A typical classification of the groundwater vulnerability methods comprises three primary categories, namely: (i) statistical assessment, (ii) process-based simulationand (iii) index and overlay methods [17]. Among the most commonly used index and overlay methods in porous aquifers are DRASTIC [18], GOD [19], AVI [20], SINTACS [21] and SI [22]. Moreover, groundwater vulnerability assessment can be divided into intrinsic, specific and integrated. Regarding the intrinsic, it represents the vulnerability based on the geological and hydrogeological characteristics of an aquifer, whilst the specific describes the vulnerability against specific pollutants. Both types are considered essential and useful for the safeguarding of groundwater resources and the protection of groundwater quality from pollution [23,24]. Additionally, the integrated vulnerability assessment, alongside the intrinsic vulnerability, incorporates the presence of danger centers, namely construction material factories, sewage outlets, gas stations, livestock farms, proximity to main roads, rivers and residential areas, as well as landfills, olive mills, animal barns and stockpiles of fertilizers and pesticides [6,25,26].
One of the most popular and extensively used index methods for groundwater vulnerability mapping is DRASTIC, which was originally developed by the US Environmental Protection Agency (EPA) [6,
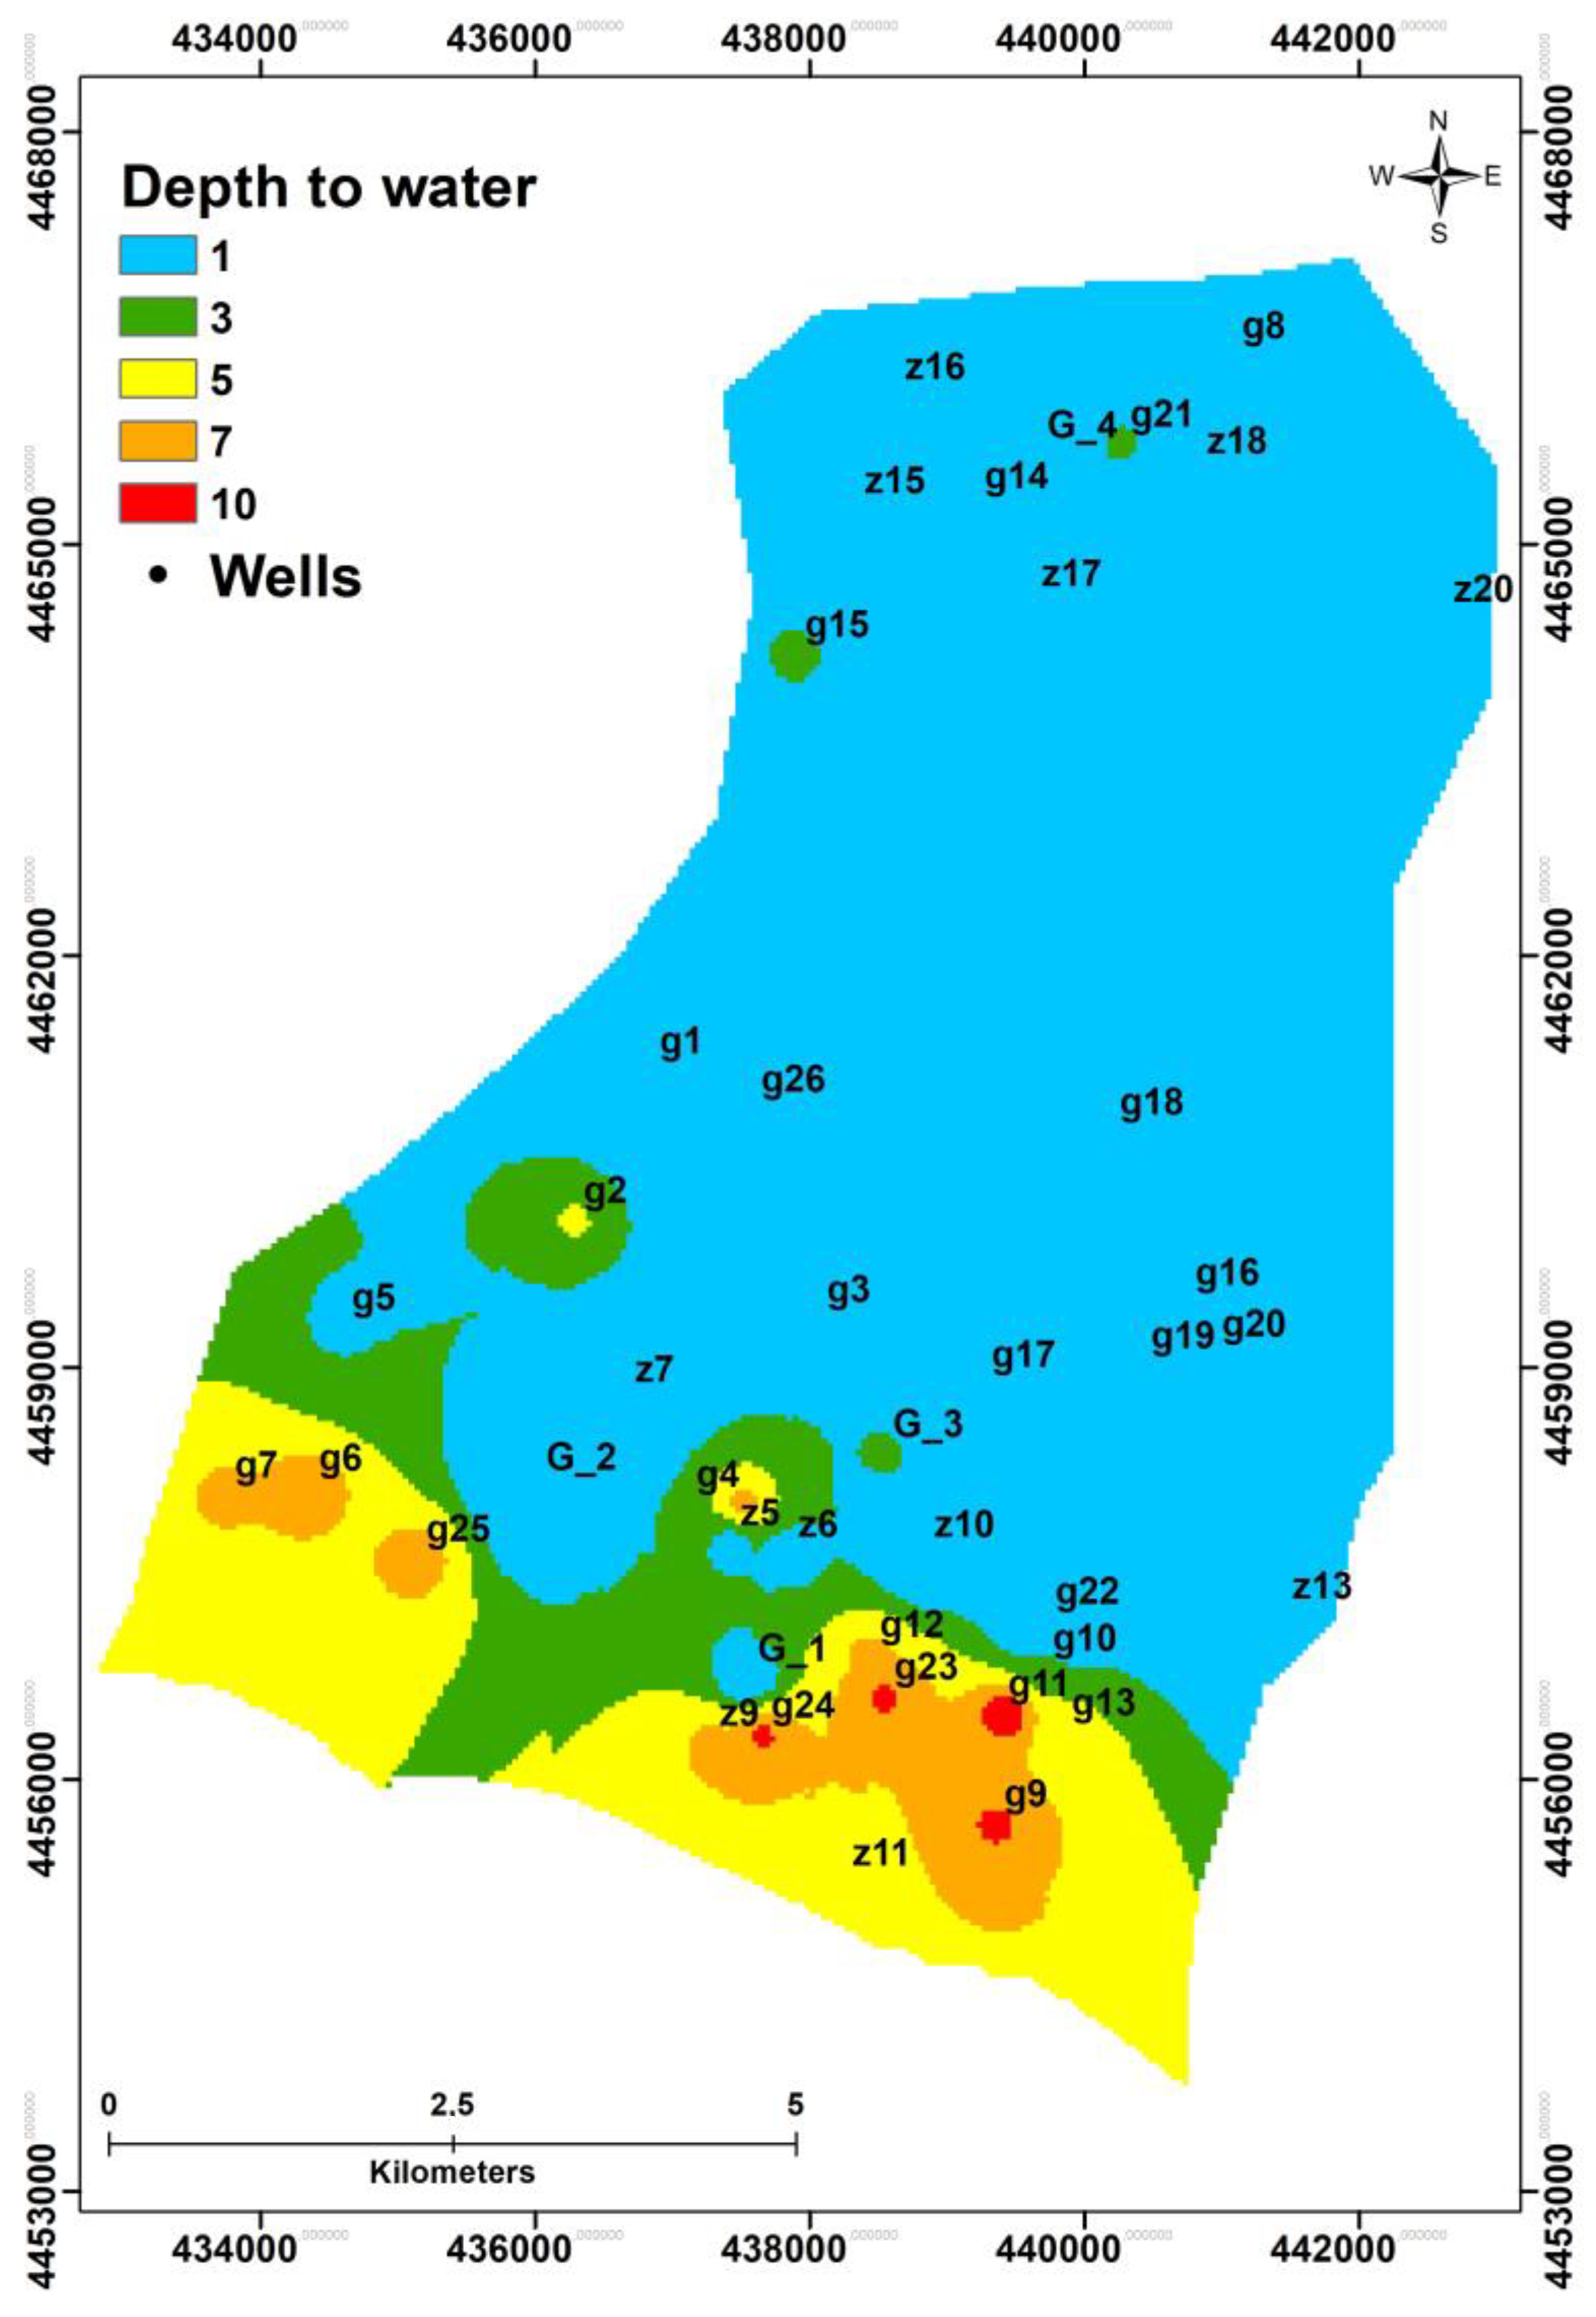
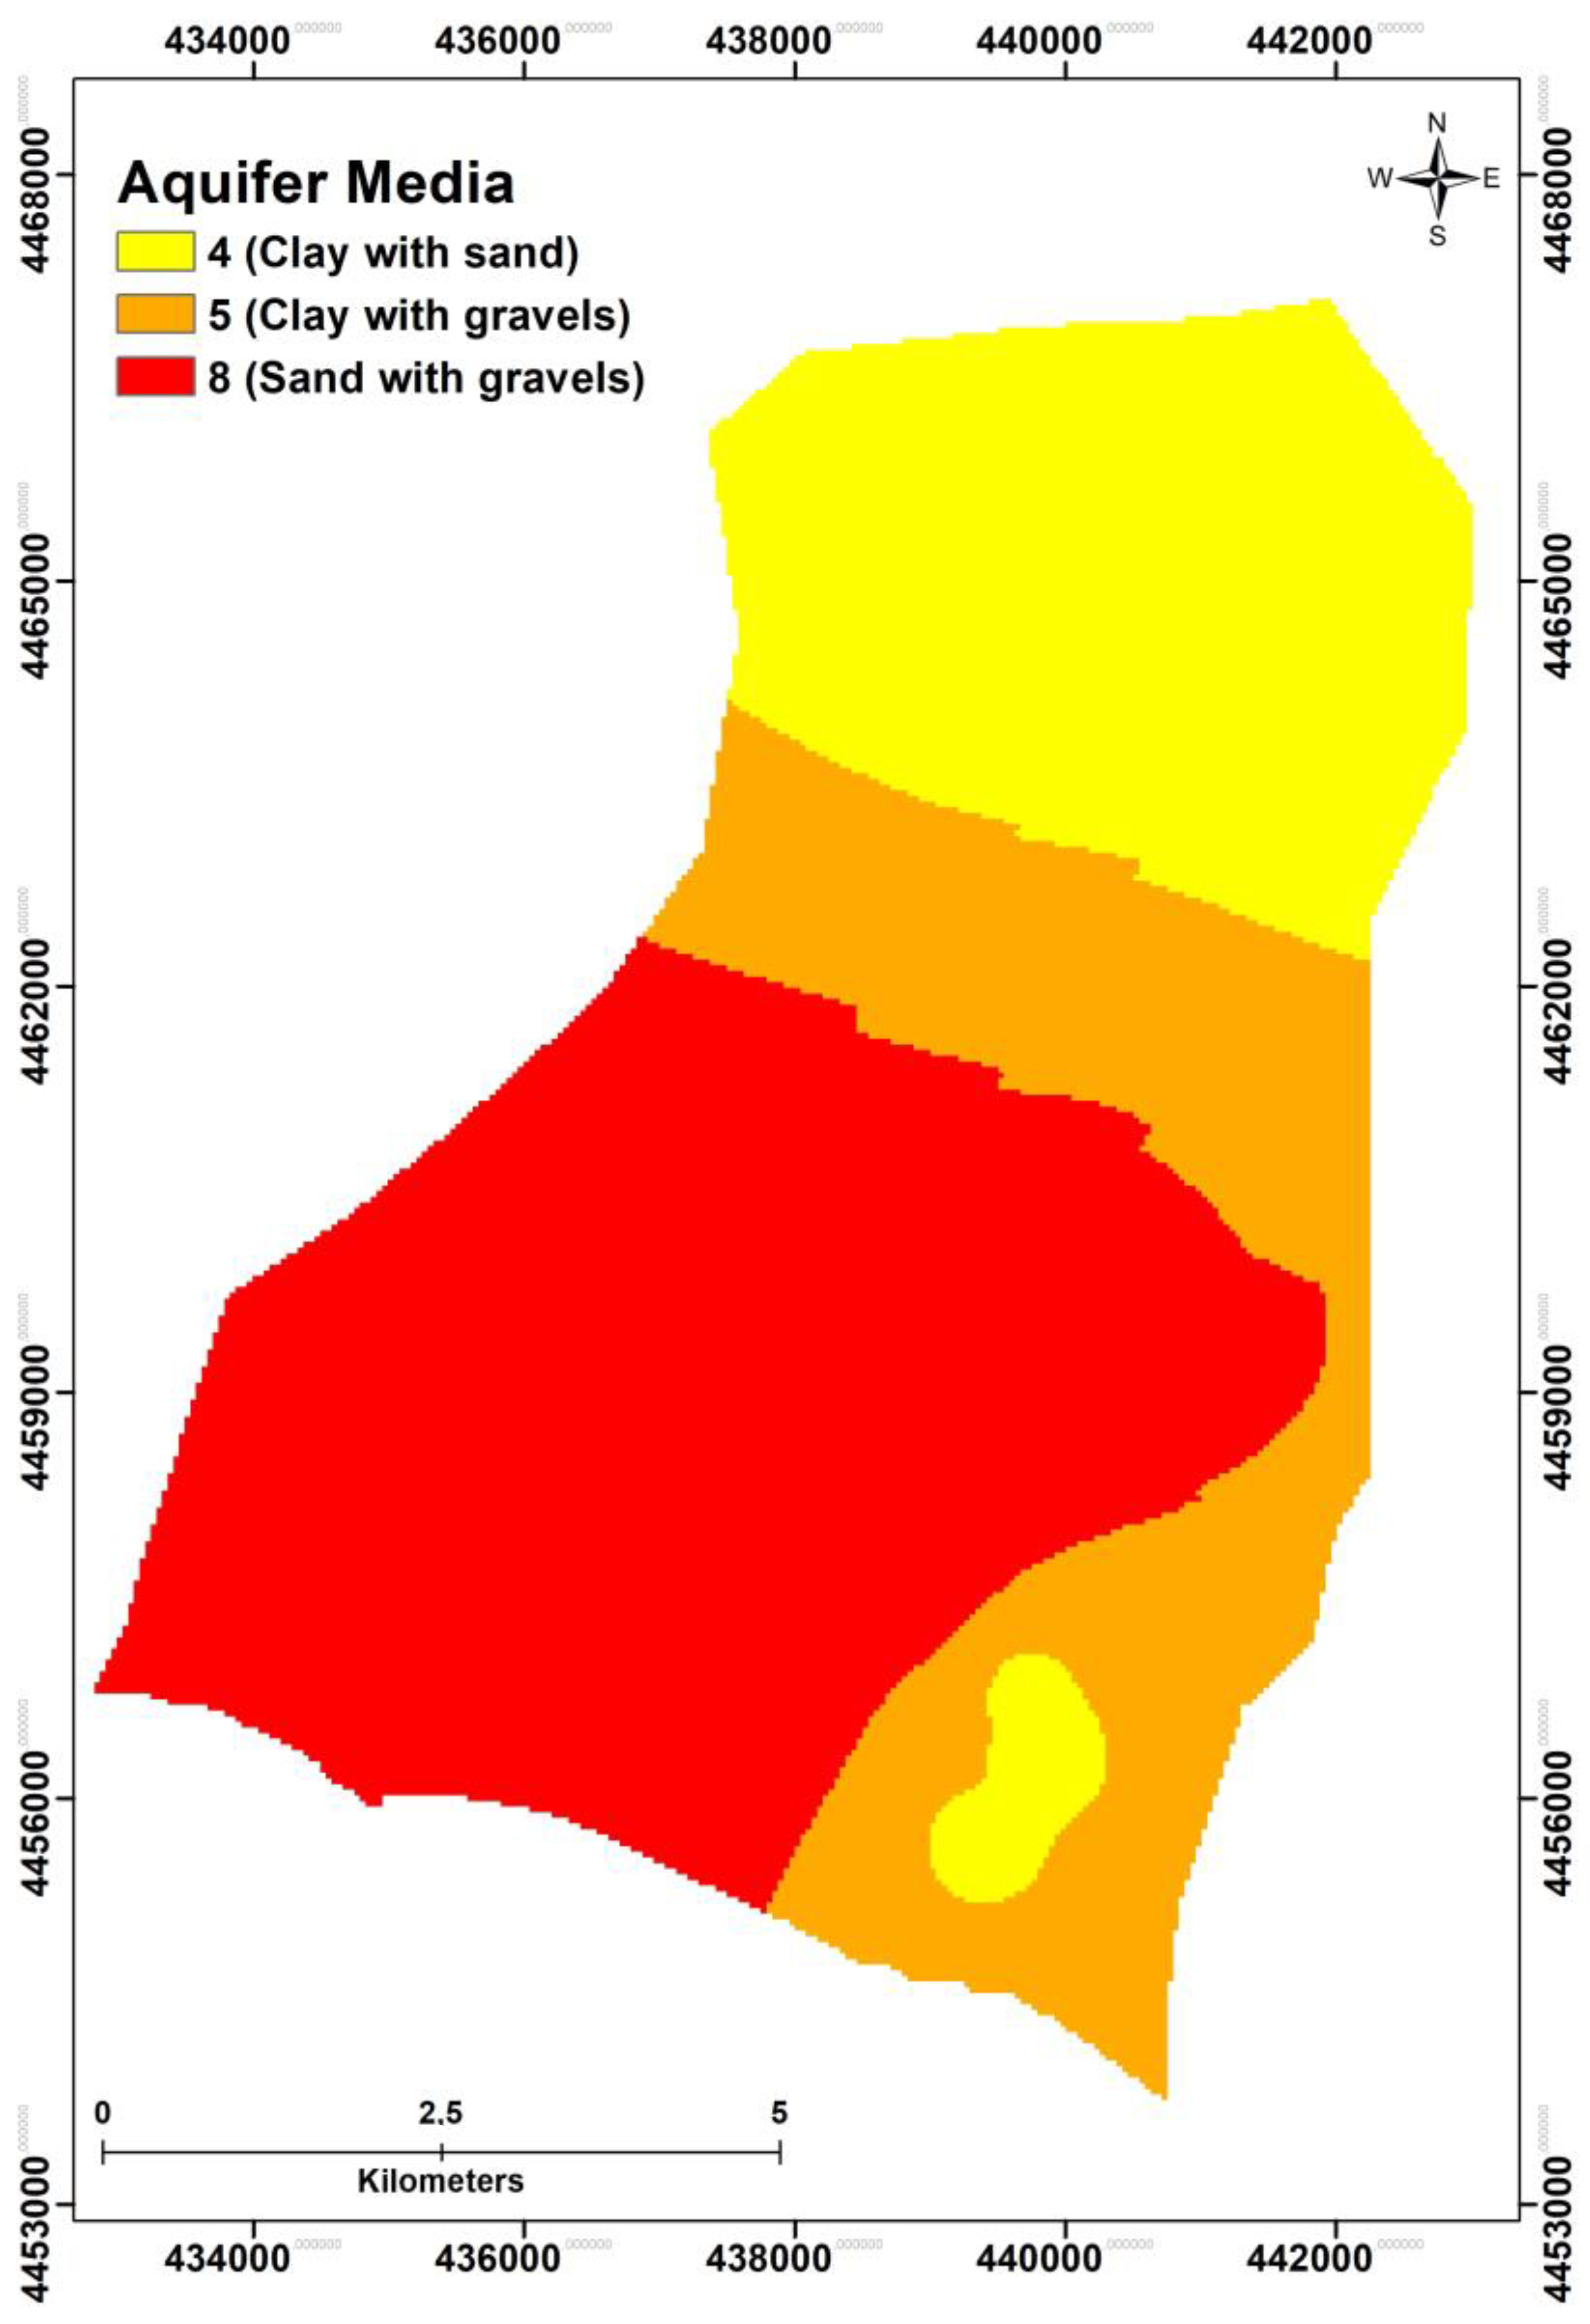
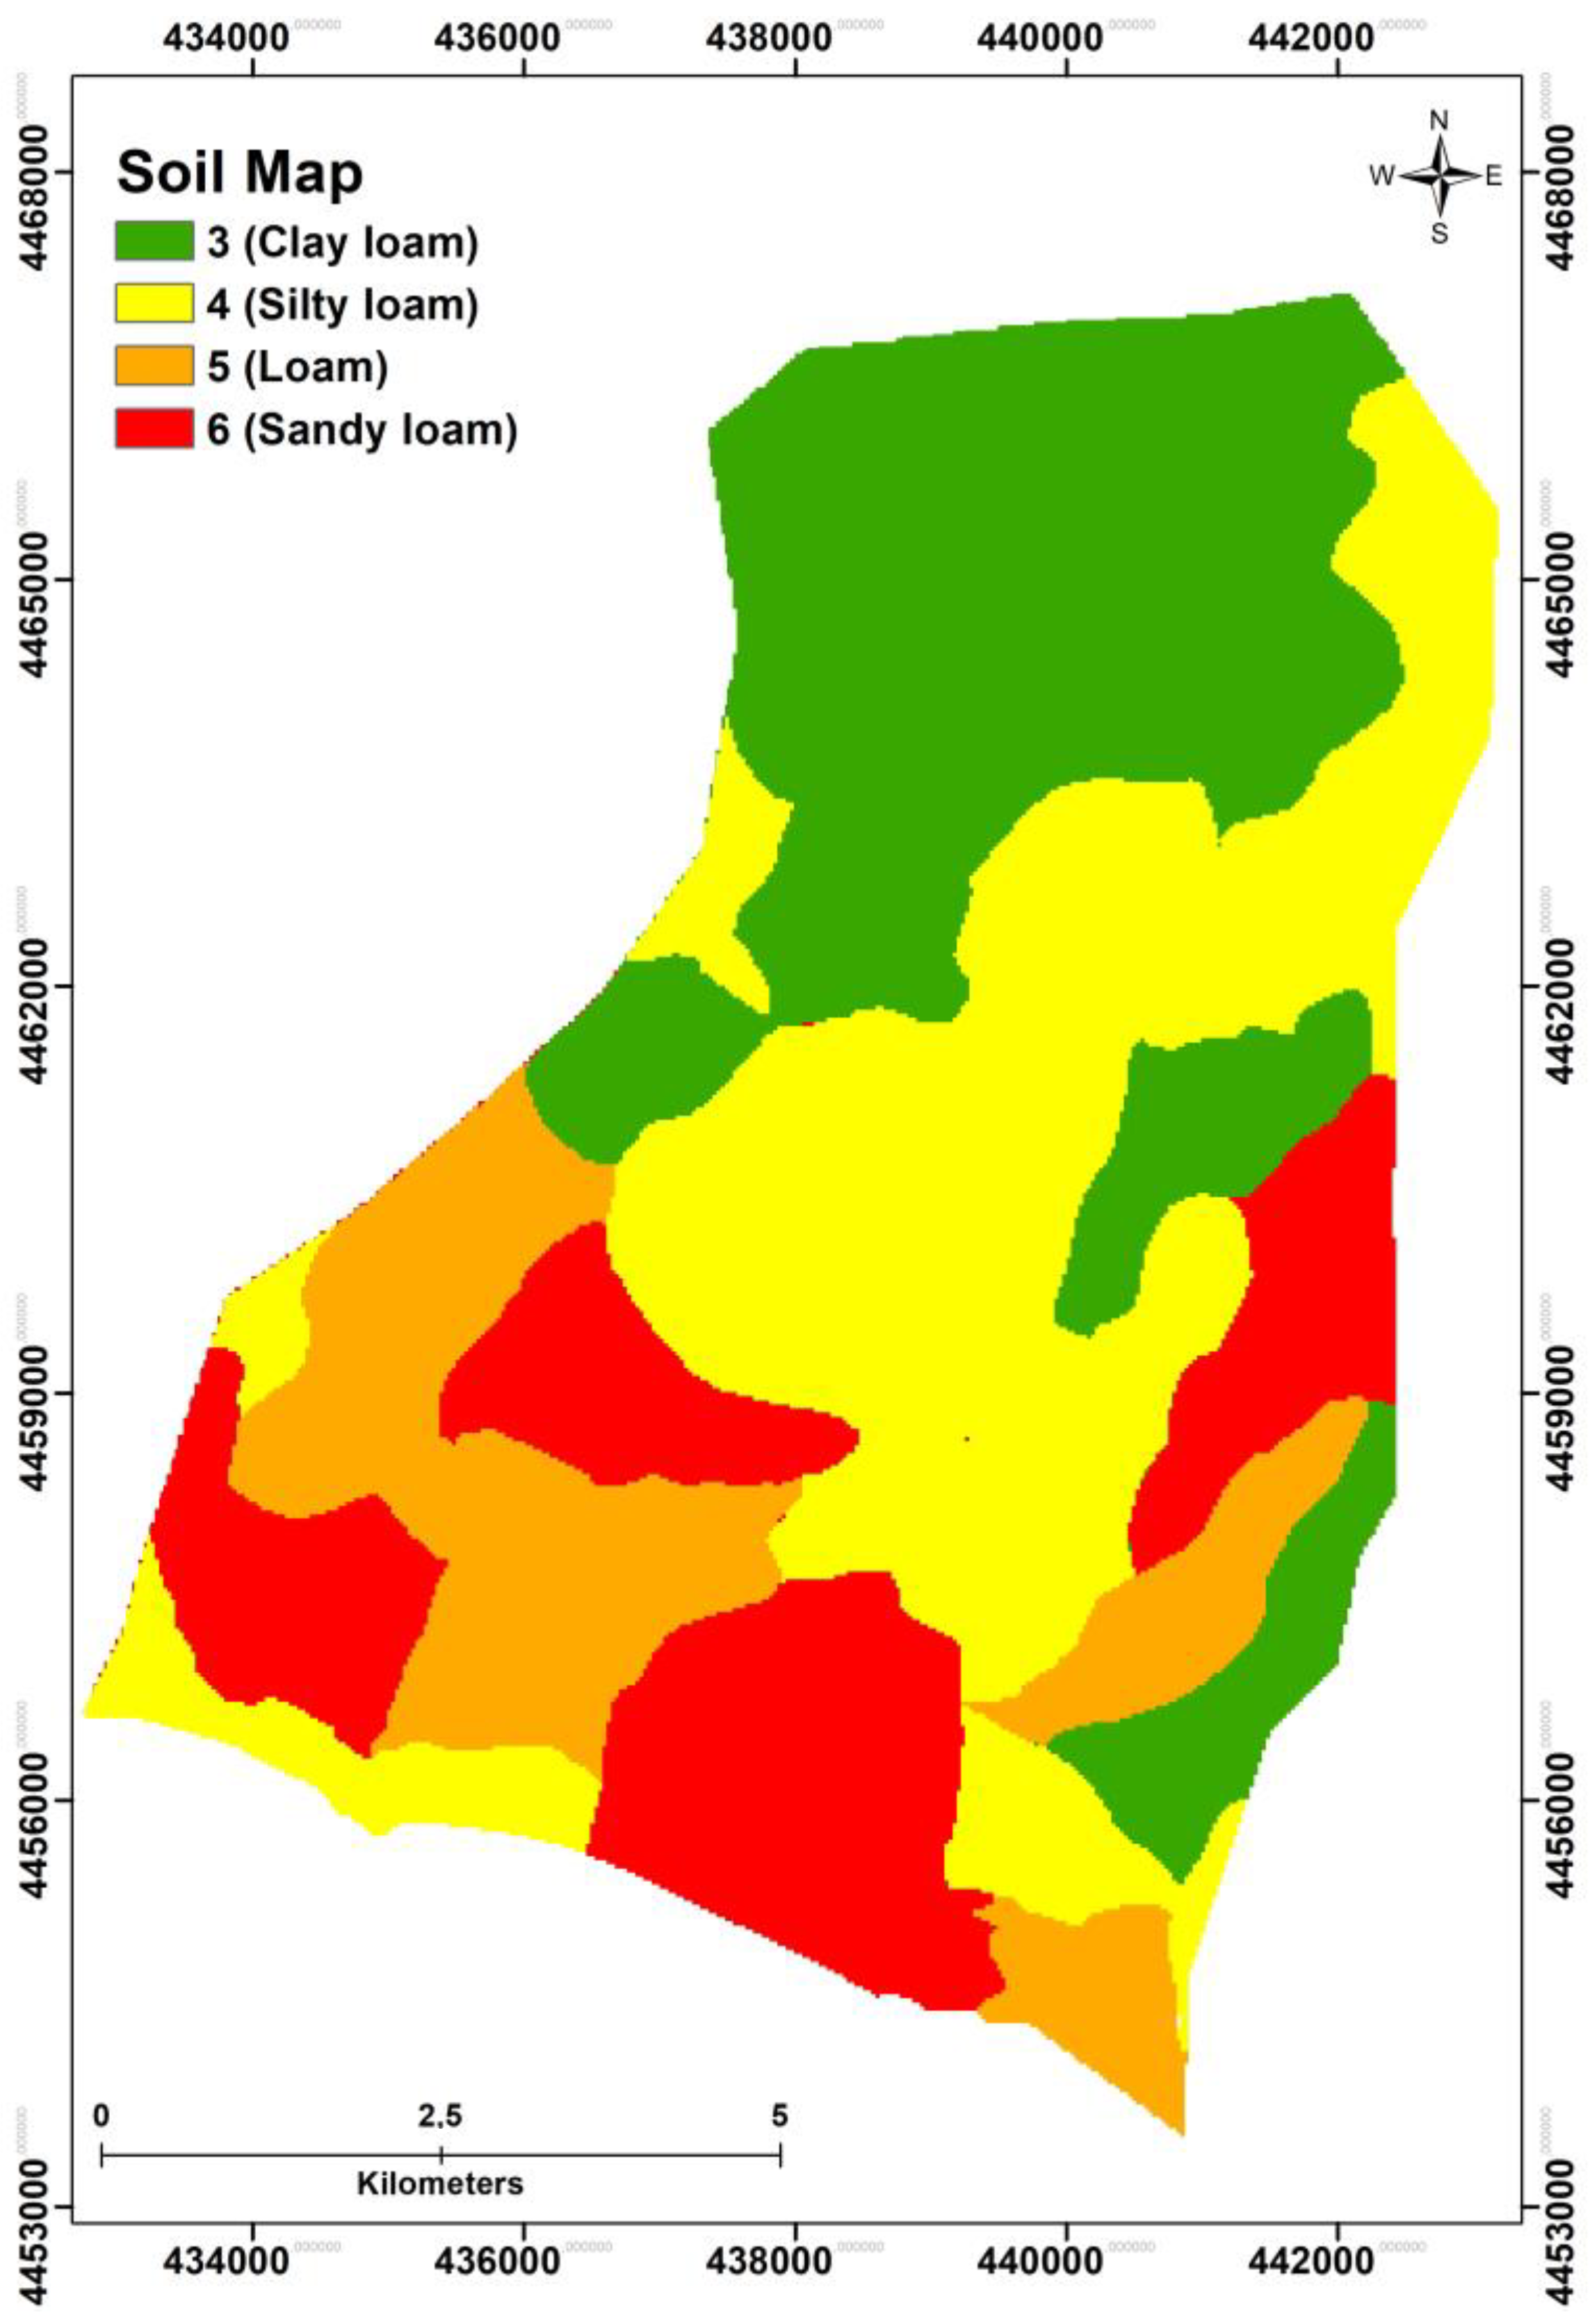
27]. This method utilizes seven hydrogeological parameters controlling the flow of the water from the surface to the aquifer, namely depth to water table (D), net recharge (R), aquifer media (A), soil media (S), topography (T), impact of the vadose zone (I) and hydraulic conductivity (C) [28]. A significant advantage of DRASTIC is its adaptability and appropriateness for regions with varying hydrogeological characteristics and sources of pollution, such as agricultural, urban and industrial [7,29,30,31]. Despite being the most established method for regional vulnerability assessment, DRASTIC has its limitations, including the subjectivity and uncertainty in the delineation of the rates and the weights of each parameter [32]. Thus, various techniques have been employed to modify and enhance the reliability and precision of the method and minimize the subjectivity in the evaluation of each parameter’s ratings and weight. These techniques include sensitivity analysis, analytic hierarchy process (AHP), Fuzzy AHP method, binary classifier calibration with a genetic algorithm, multiple linear regression, multi-criteria decision-making approach coupled with a metaheuristic algorithm, as well as additional factors, such as land use (DRASTIC-LU) have been incorporated [33,34,35,36,37,38,39,40,41,42,
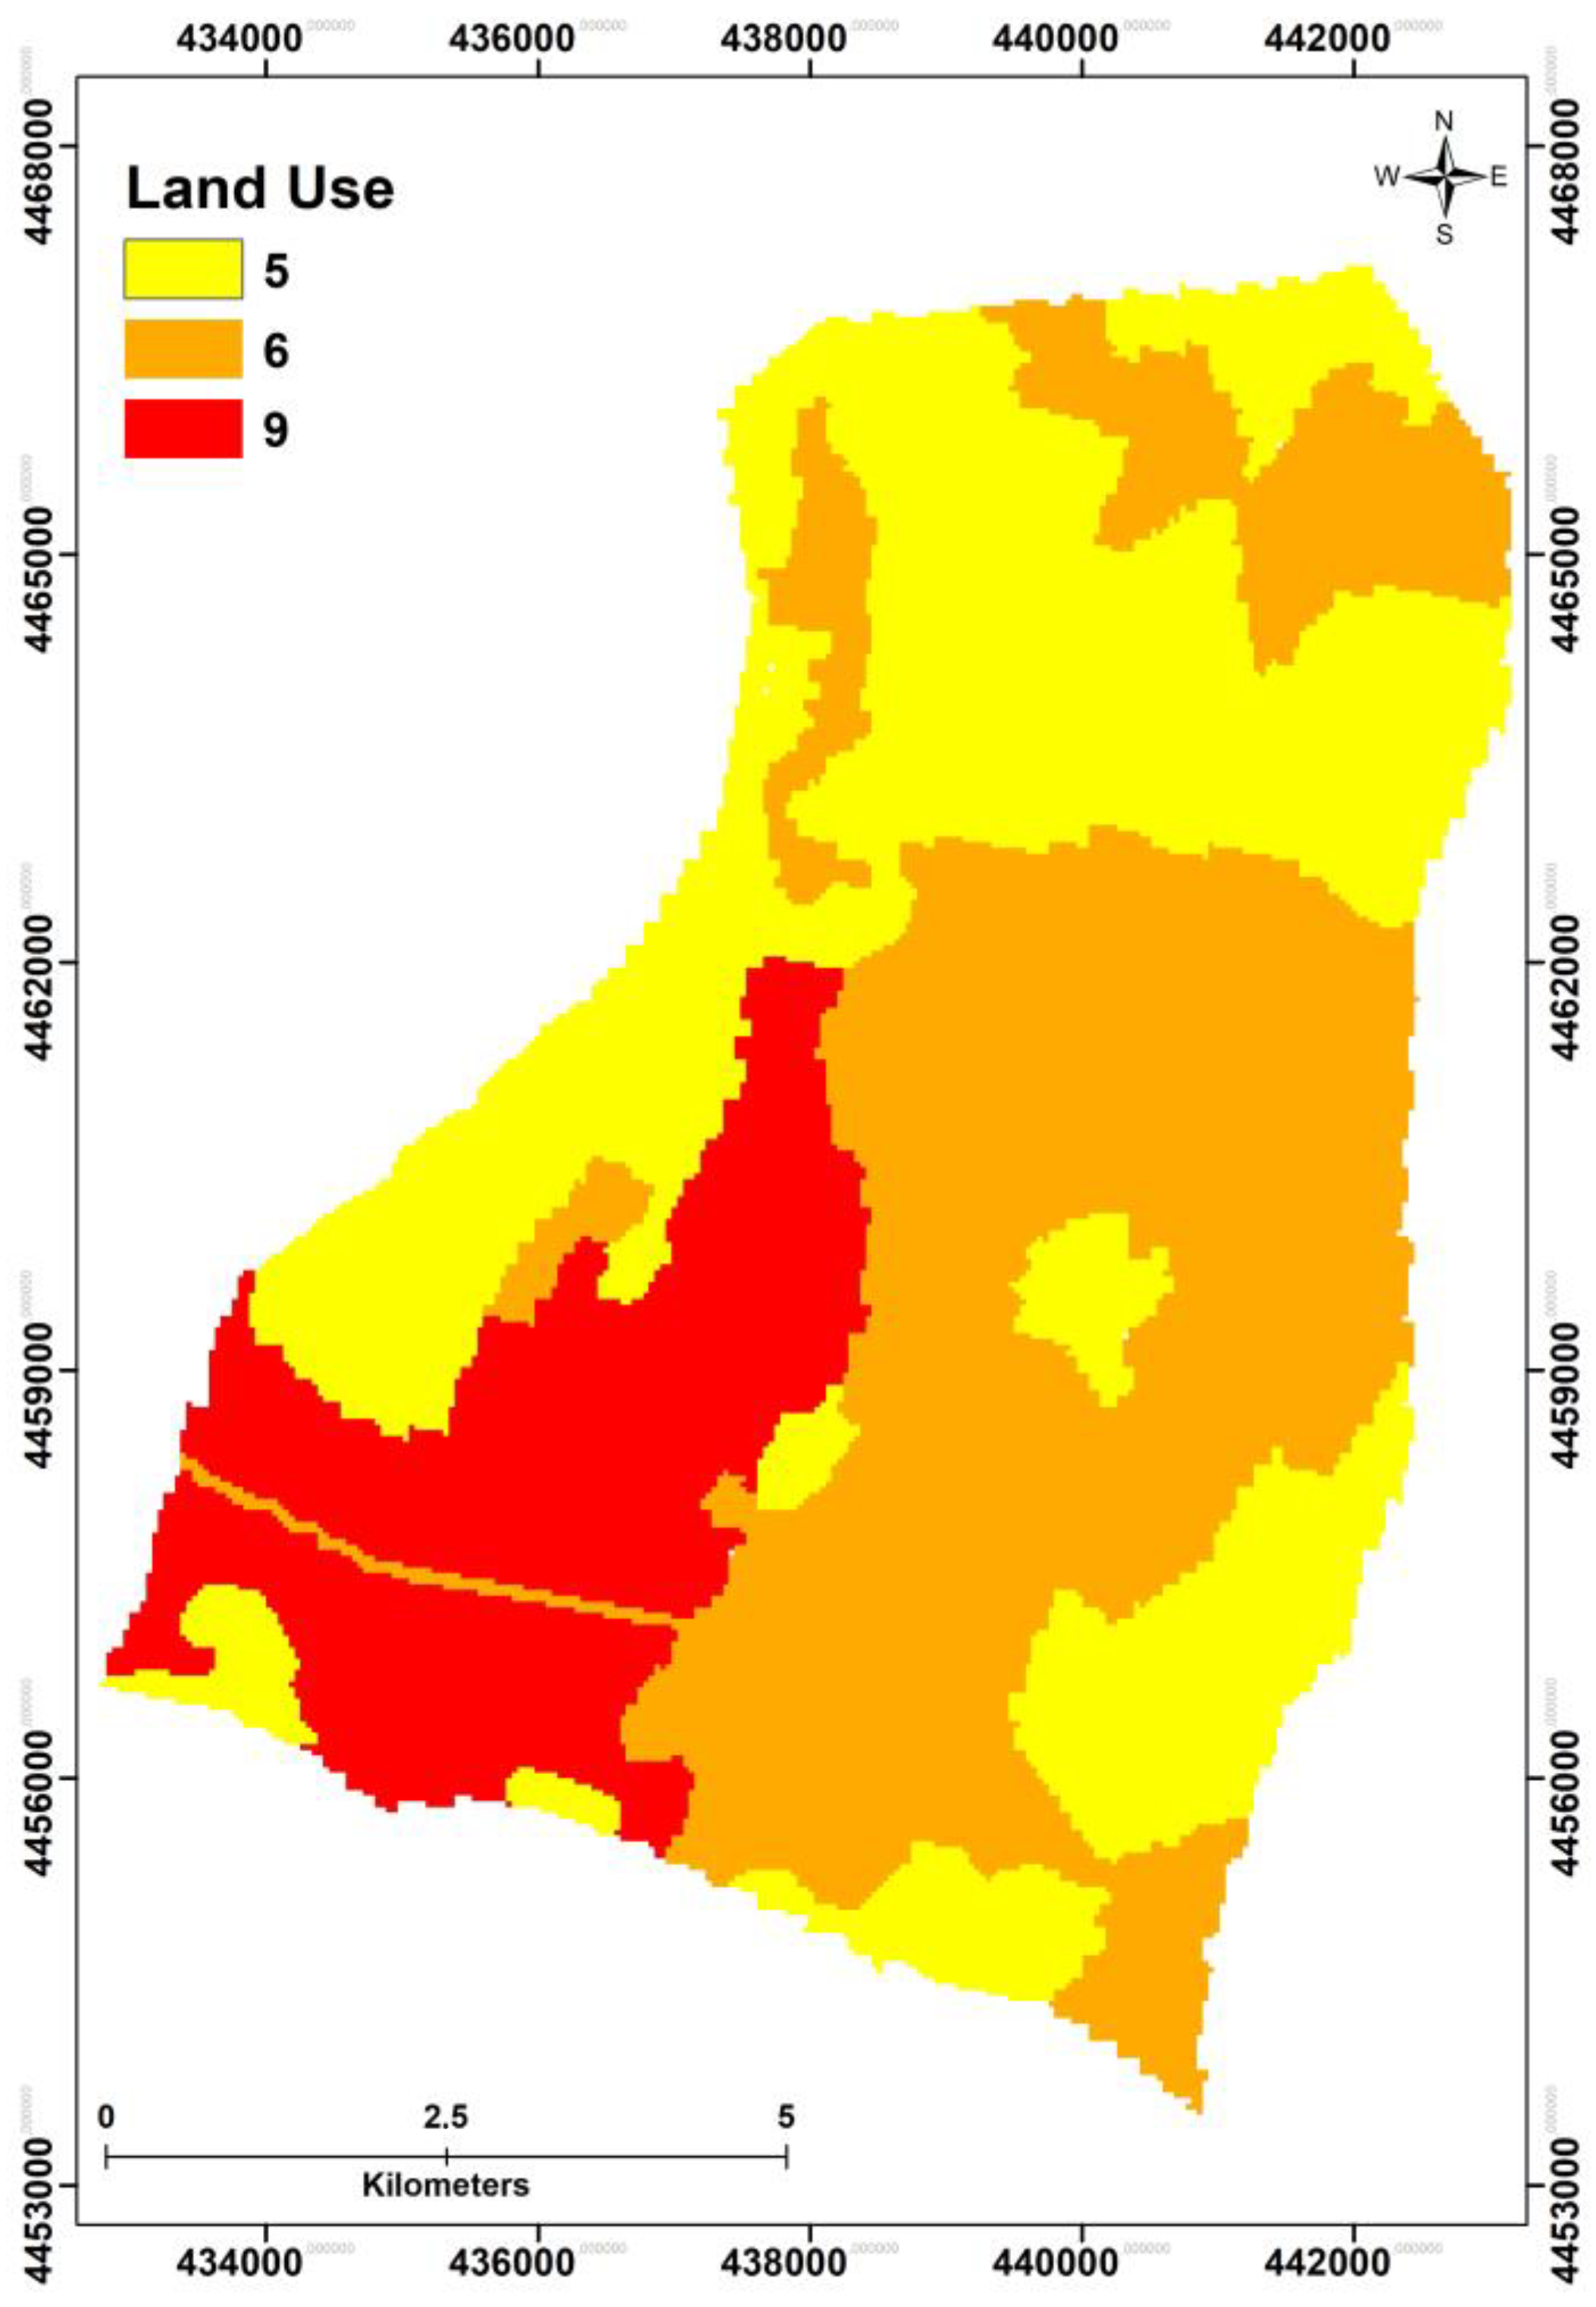
43]. In particular, the impact of land use, such as agriculture, is considered to have a noteworthy impact on groundwater quality and thus warrants inclusion in groundwater vulnerability assessment [44].
Martínez-Bastida et al. [45] proposed the Nitrate Vulnerability (NV) index, which is a novel approach based on the standard DRASTIC and the incorporation of land use parameters (as a potential nitrogen source). The new specific vulnerability index is based on a multiplicative model and is concentrated on nitrate pollution by adding an additional parameter denoted as the “potential risk associated with land use” (LU). Results indicated that the NV index achieved greater accuracy in the assessment of specific vulnerabilities compared with DRASTIC-LU [45,46].
Another significant and widely employed low-cost vulnerability method for enhancing and adapting DRASTIC to the particularities of Mediterranean regions, such as Italy and Greece, is SINTACS [21,47]. The aforementioned method, developed in Italy, employs the same hydrogeological parameters as DRASTIC, albeit it has a more flexible weighting and rating system that is contingent upon regional-specific conditions [48]. The inherent subjectivity in the parameters’ weight and rating is a major limitation. To overcome this drawback, the SINTACS method can be enhanced by integrating land use parameters into its calculations (SINTACS-LU), reporting greater performance and giving more accurate results over the standard version [48,49,50]. In general, the method can be employed for medium to relatively large-scale porous-media aquifers, whereas in fractured, karstic or carbonate aquifer systems, the results might be debatable.
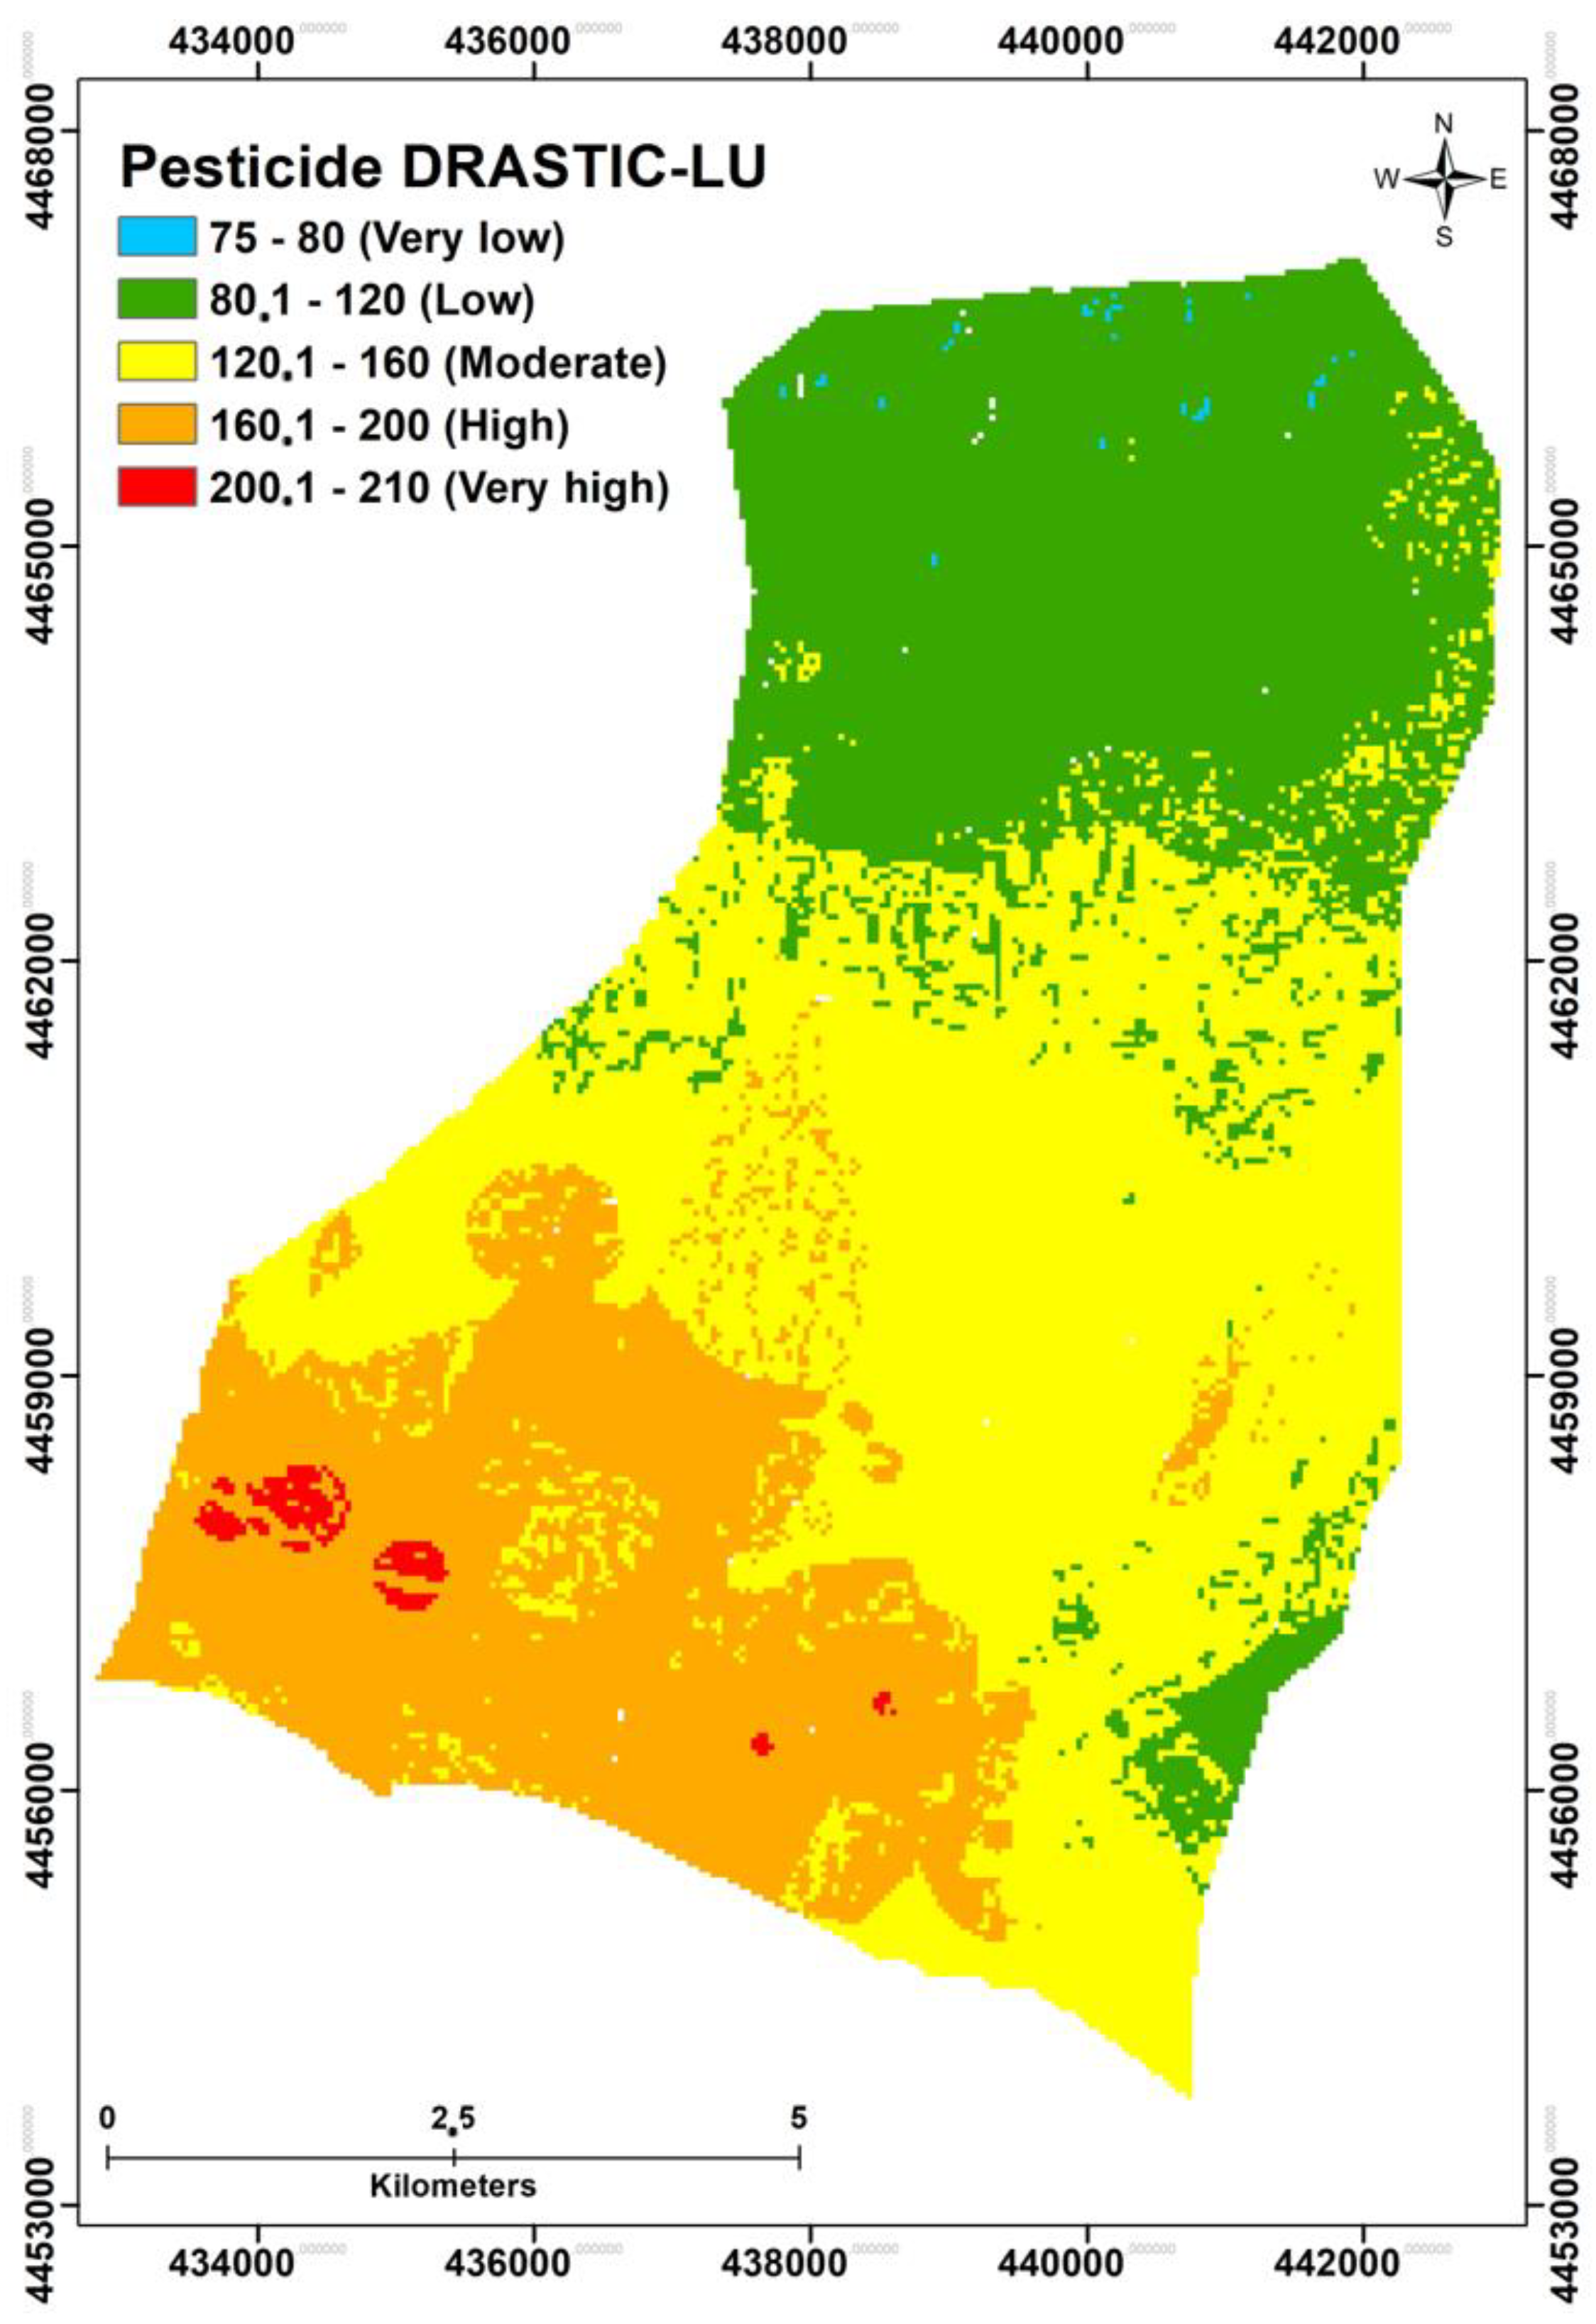
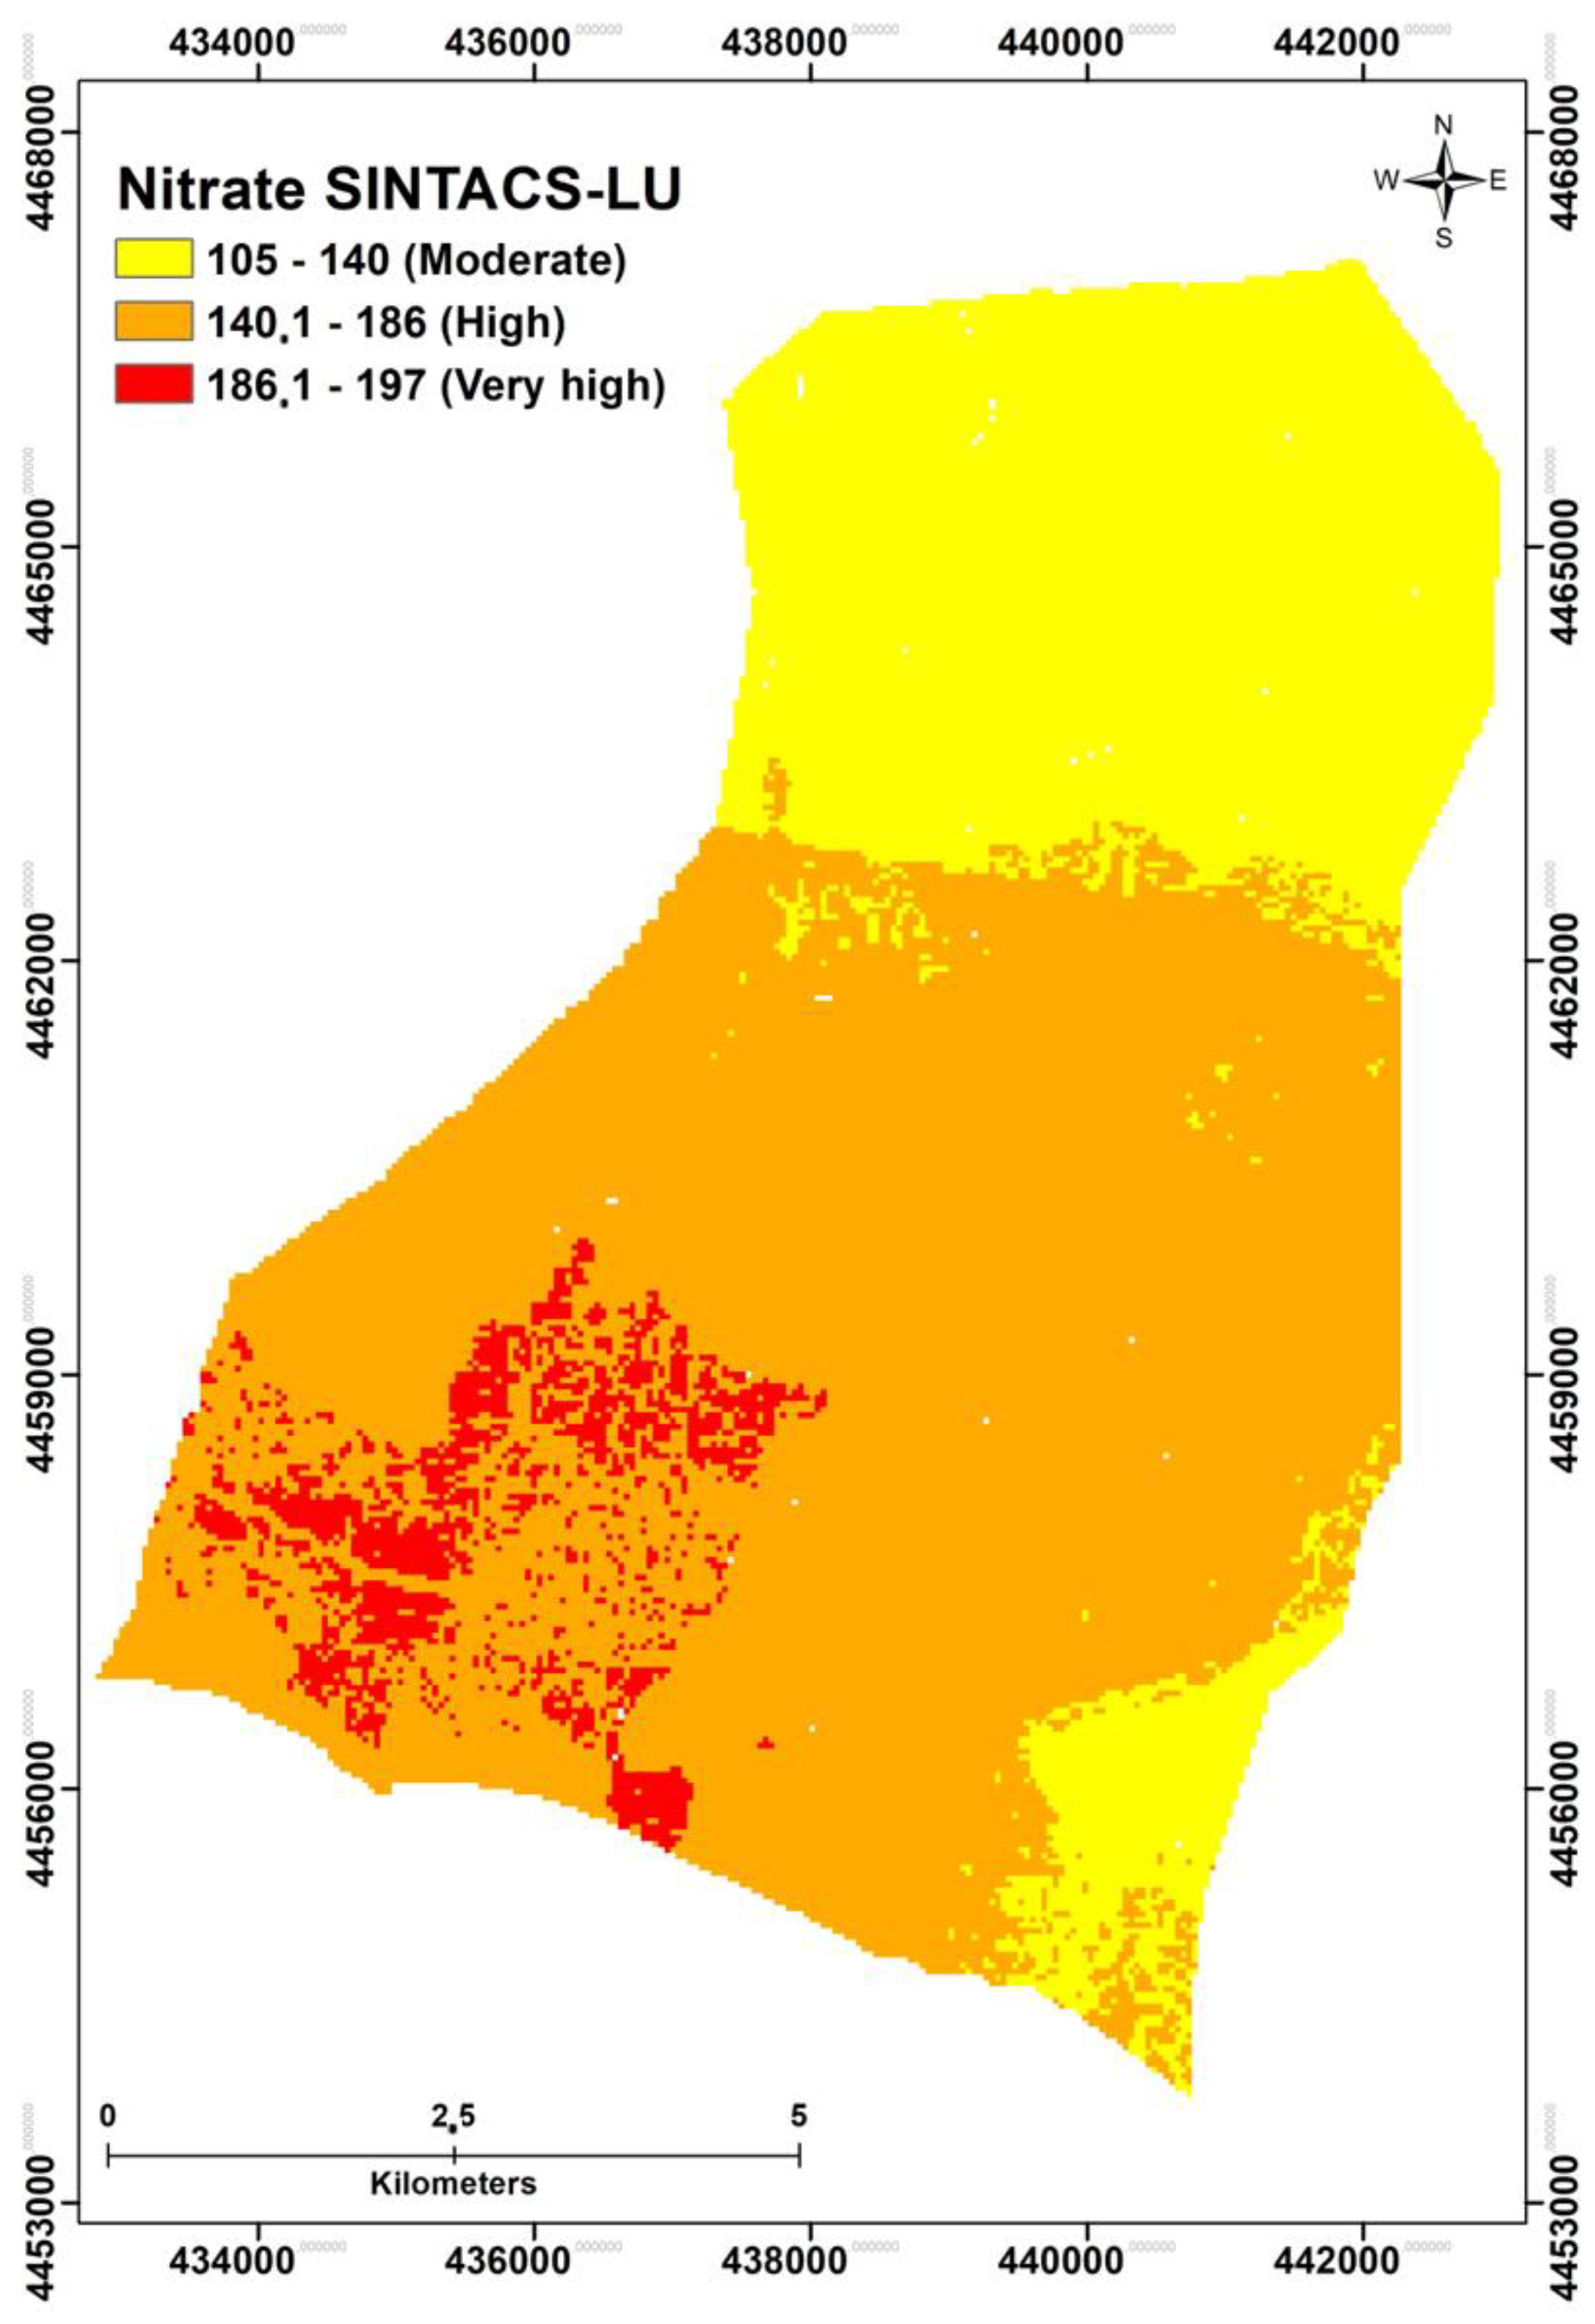
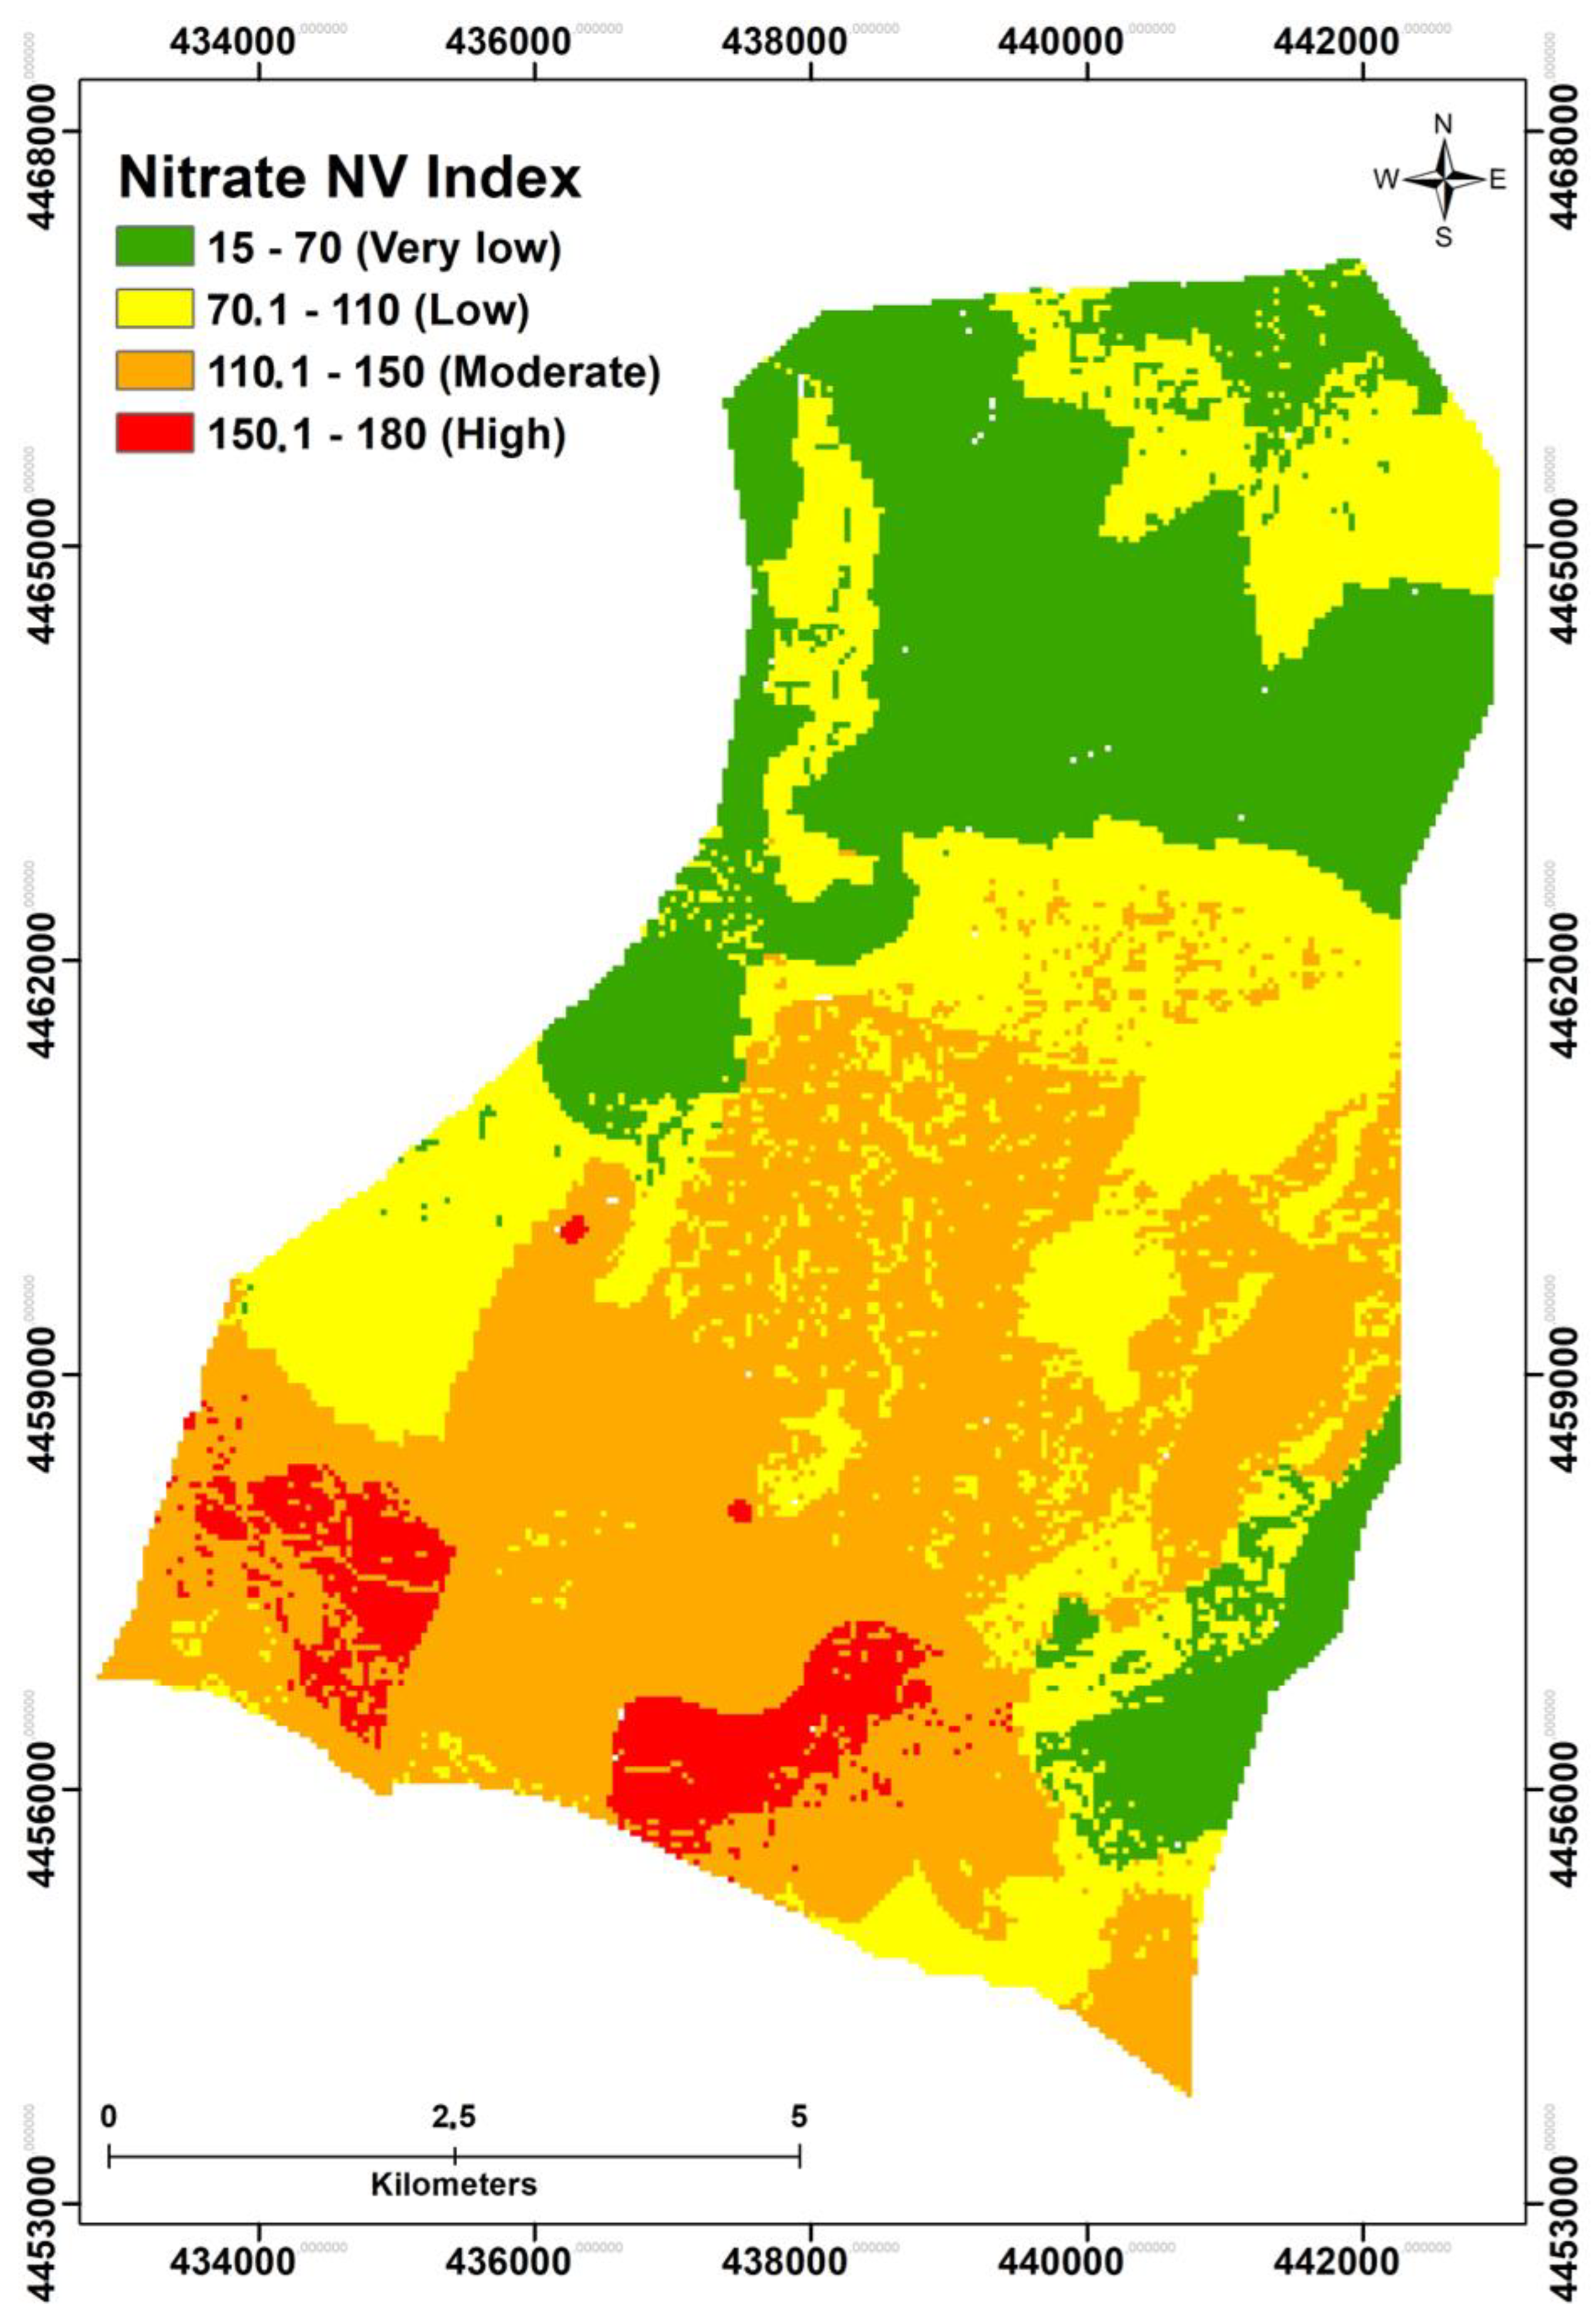
This study aims to assess and identify the groundwater vulnerability zones to specific pollution in the NeaMoudania aquifer, Chalkidiki, Greece. However, the application of a single groundwater vulnerability method in a given area might, in some cases, lead to imprecise results. Therefore, our study endeavors to conduct a comparative analysis by employing an ensemble of groundwater vulnerability methods, namely Pesticide DRASTIC-LU, Nitrate SINTACS-LU and NV index, in order to evaluate the efficacy and appropriateness of these methods in an agricultural area. The verification of the produced vulnerability maps of the aforementioned methods was appraised through the correlation between the nitrate concentration (NO3) in groundwater and the vulnerability index. Furthermore, the effective weight of each parameter in Pesticide DRASTIC-LU, Nitrate SINTACS-LU and NV index was evaluated by performing a single parameter sensitivity analysis (SPSA).

2. Study Area

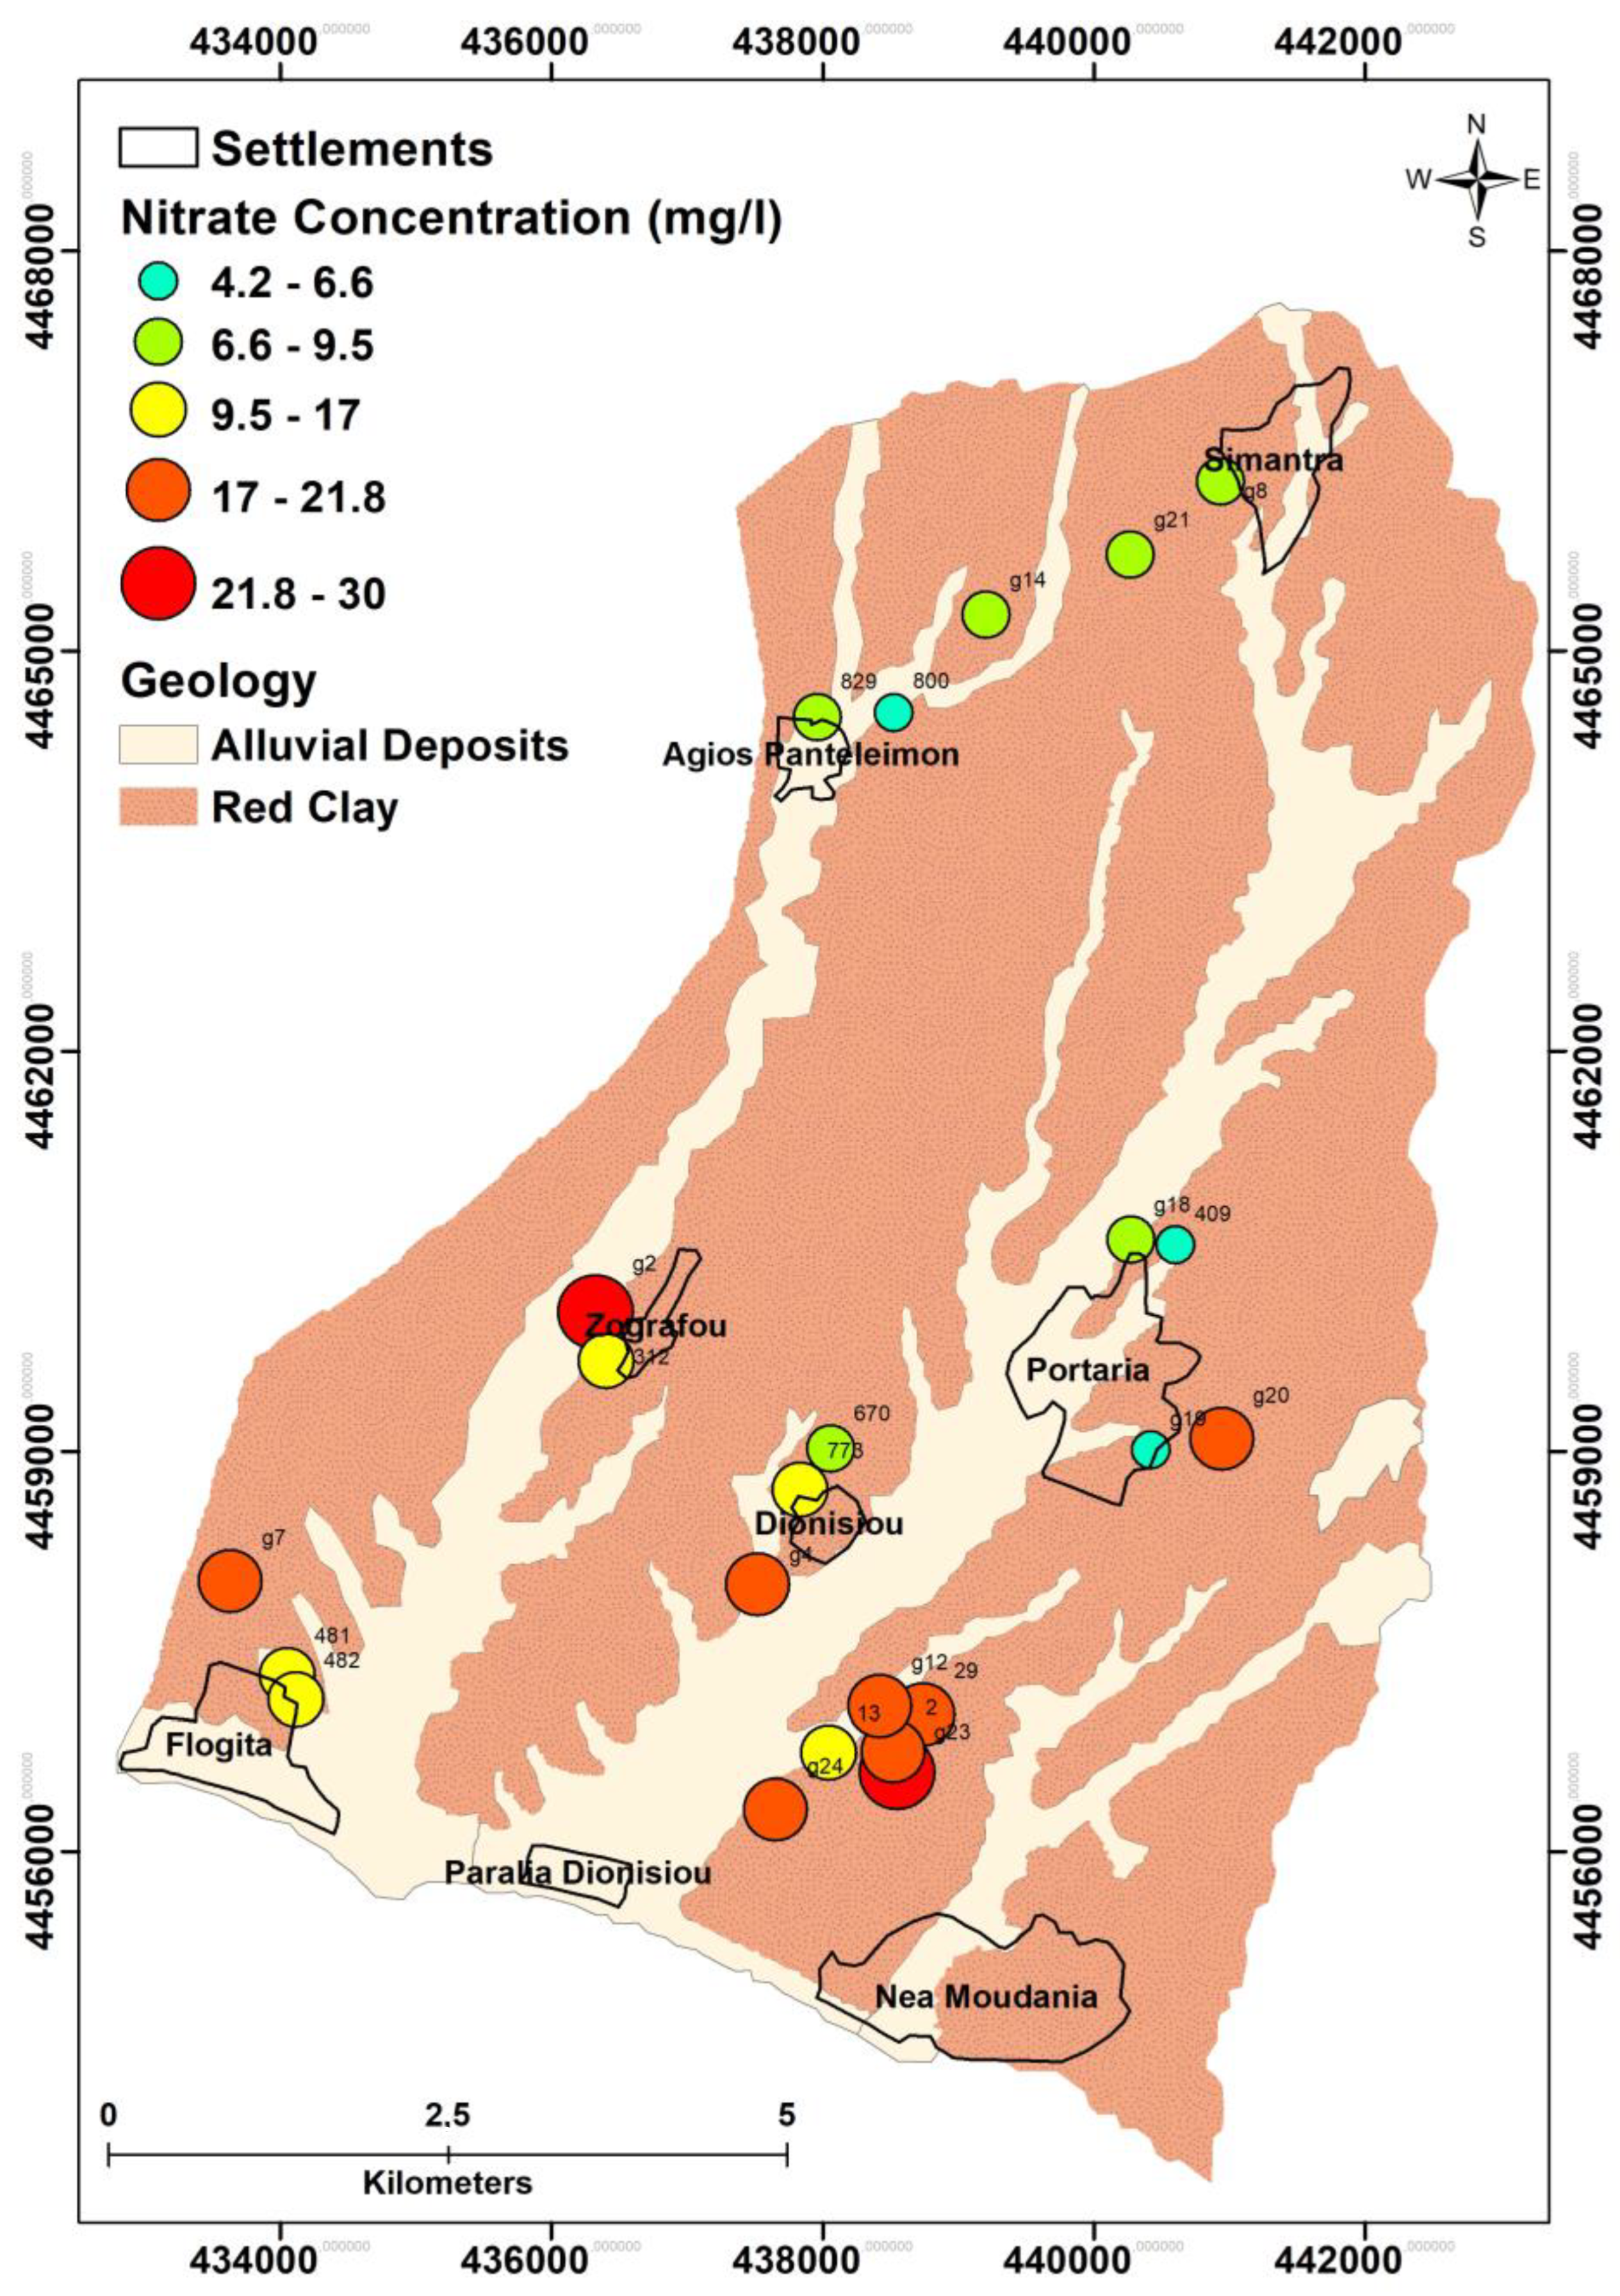
The watershed of Nea Moudania (Figure 1) is located in the southwestern part of the Chalkidiki peninsula, in the Region of Central Macedonia, Northern Greece, and it is a constituent of a larger area which is known as Kalamaria Plain. This coastal alluvial basin occupies an area of approximately 78 km2, and it belongs, administratively, to the municipalities of Nea Propontida and Polygyros. Morphologically, the average altitude is relatively low (approximately 200 m above sea level) and features a topography with gentle slopes (mean soil slope approximately 2%). This area forms the primary agricultural land of Chalkidiki [51]. The climate is typical thermo-Mediterraneanand is characterized by high temperature and aridity during the summer months, while the winters are mild and wet. The mean annual precipitation is approximately 420 mm [51]. The watershed of the Nea Moudania basin belongs to the Peonia geological subzone, which is part of the Axios geotectonic zone [52]. The Nea Moudania aquifer is covered mainly by Neogene (upper Pliocene-middle Pleistocene) sediments, which cover the pre-Neogene bedrock formations. The Neogene sediments consist of alternated beds of red silty clay with fine-grained quartz and mica intercalated by sandstones, sands, marl, silts, and conglomerate lances. The pre-Neogene bedrock consists of recrystallized bluish limestone, greenish-brown two-mica gneiss and muscovite gneiss. Moreover, the study area comprises Quaternary formations, such as alluvial deposits (sands, gravels, conglomerates and clay), coastal deposits (beach ridges) and lagoon deposits (sands and clay sand) [53]. Hydrogeological interest is primarily concentrated on the recent deposits due to their considerable capacity for water storage and their substantial thickness [54]. On the contrary, the pre-Neogene bedrock formations are considered impermeable with limited fractured zones; therefore, they do not exhibit hydrogeological interest.
The fairly flat topography and the favorable regional climate conditions make the study basin an important agricultural area. Indeed, approximately 80% of the total area is extensively cultivated and irrigated, and there is also a notable presence of touristic and urban development [55]. The area has a permanent population of approximately 16,000 inhabitants, whilst the maximum population, mostly during the summer season, surpasses 40,000 people [56]. Water demand for irrigation and domestic purposesis high, especially during the period spanning from May to September. Moreover, the combination of surface water scarcity and generally inadequate yearly rainfall renders groundwater the only viable source of water [57]. However, this fact has caused a noteworthy decrease in the groundwater level throughout the area. In addition to that, since the 1990s, overexploitation via numerous deep wells has led to quantitative issues. Another major challenge over the years is the qualitative deterioration of the aquifer due to the intensive agricultural activities that result innitrate pollution and seawater intrusion. Undoubtedly, the implementation of a sustainable approach to managing water resources is henceforth absolutely necessary to ensure the quantitative and qualitative protection of the Nea Moudania aquifer.

3. Methodology

In the present study, (i) the specific vulnerability was evaluated by using the modified-DRASTIC (Pesticide DRASTIC-LU), the modified-SINTACS (Nitrate SINTACS-LU), as well as the Nitrate Vulnerability (NV) index in Nea Moudania aquifer. The aforementioned methods were applied in a Geographic Information System (GIS) environment by converting all the data and maps to a raster dataset with a cell size of 40 × 40 m. Furthermore, (ii) sensitivity analysis was conducted in order to compare the effectiveness with the theoretical weight of each parameter. Finally, (iii) validation of the three applied models was made by using nitrate concentration so as to select the optimal model based on the coefficient of determination (R2). Nitrate concentration in groundwater is mainly due to agricultural activities in the area. Notably, nitrate concentration in groundwater is considered to be one of the most significant pre-indicators of water quality destructors [58].

3.1. DRASTIC-LU Method

DRASTIC is consideredthe most popular, reliable, cost-effective and widely accepted method for groundwater vulnerability assessment (intrinsic and specific) [58,59]. It is an overlay index method initially developed in 1987 by the US Environmental Protection Agency (EPA) and the American Water Works Association (AWWA).
The DRASTIC method utilizes seven significant hydrogeological parameters which predominantly control groundwater flow and pollution, namely, depth to water (D), net recharge (R), aquifer media (A), soil media (S), topography (T), impact of the vadose zone (I) and hydraulic conductivity (C). The applicability of the method is contingent upon the following assumptions: (i) pollution sources occur at the ground surface, (ii) pollutants seep into the aquifer by precipitation, (iii) pollutants have the same mobility as water, (iv) the hydrogeological unit must be at least 0.40 km2 [6,60].
In this methodology, the assigned weight for each parameter ranges between 1 and 5, according to its importance. The weight of the least important parameter is equal to 1, whereas of the most important is equal to 5. The weights and ratings are based on the Delphi technique [61]. Standard DRASTIC is used for intrinsic groundwater vulnerability, whilst Pesticide DRASTIC is adopted in agricultural areas with extensive use of pesticides and fertilizers (nitrate pollution), and thus, they have a different weight classification [18,62]. Furthermore, each parameter has a rating that ranges from 1 to 10, depending on its relative importance on pollution potential (Table 1). The final Pesticide DRASTIC Index (DI) is calculated using the following Equation (1). The Pesticide DRASTIC Index ranges from 26 to 256. The study area was divided into the following vulnerability classes: very low (<80), low (80–120), moderate (120–160), high (160–200) and very high (>200).
DI = DrDw + RrRw + ArAw + SrSw + TrTw + IrIW + CrCw
where D, R, A, S, T, I, and C indicate the seven parameters of the method, w represents the weight of each parameter and r is the corresponding rating.
Based on the Pesticide DRASTIC, the modified Pesticide DRASTIC uses an additional parameter in its calculations, namely, Land Use (LU). Τhe incorporation of Land Use, especially in agricultural areas with the intensive application of fertilizers and pesticides, can enhance the efficiency and reliability of the method [63,64]. Particularly in agricultural lands, due to irrigation water application, there is an increasing possibility of groundwater pollution. The modified DRASTIC index (Pesticide DRASTIC-LU) is calculated using the following Equation (2). In this study, the assigned weight for the Land Use parameter is 5 [34,48] (Table 1).
Pesticide DRASTIC-LU = DrDw + RrRw + ArAw + SrSw + TrTw + IrIW + CrCw + LUrLUw

3.2. Nitrate Vulnerability (NV) Index (Multiplicative Model)

The Nitrate vulnerability index is an adaptation of the DRASTIC-LU method and was proposed by Martinez-Bastida et al. [45] to assess the risk of nitrate pollution in Central Spain. The objective of this method is to achieve greater performance in the assessment of specific vulnerability to nitrate pollution and enhance reliability and precision in comparison to the standard DRASTIC-LU. It is a multiplicative method, which involves an additional parameter known as the “potential risk associated with Land Use” (LU) and is based on the real impact of each land use. The method is calculated according to the following Equation (3):
NV index = (DrDw + RrRw + ArAw + SrSw + TrTw + IrIW + CrCw) × LU
where LU refers to the potential risk associated with land use, and the rest of the parameters are the same as in Equation (1). LU ratings range from 0.1 to 1.0 (Table 2). The assigned ratings and weights proposed [45] are based on experts’ opinions, and therefore, they include human subjectivity. The lowest rating (0.1) corresponds to large natural areas with insignificant anthropogenic influence, whereas the highest rating (1.0) to intensively cultivated agricultural areas [46]. The NV index ranges from 26 to 256, such as the Pesticide DRASTIC index. The specific vulnerability ranges established for the NV are shown in Table 3 [45].

3.3. SINTACS-LU Method

The SINTACS method was proposed by Civita [21] for the particularities of Italy, as well as other Mediterranean regions, and employs the same parameters as the DRASTIC method. The method includes the following parameters: depth to water (Soggiacenza), effective infiltration (Infiltrazione), unsaturated zone (Non saturo), soil media (Tipologia della copertura), aquifer media (Acquifero), hydraulic conductivity (Conducibilità idraulica) and topographic slope (Superficie topografica). These parameters can be calculated as weighted sums using Equation (4) [32]. Despite utilizing identical hydrogeological parameters as the DRASTIC method, SINTACS employs distinct ratings (from 1 to 10) and weights (from 1 to 5) for each parameter (Table 4). In the present study, the parameters were assigned with weights specifically for nitrate environmental scenarios.
SINTACS = SrSw + IrIw + NrNw + TrTw + ArAw + CrCw + SrSw
where S, I, N, T, A, C and S indicate the seven parameters of the method, w represents the weight of each parameter and r is the corresponding rating.
Although land use has a significant impact on the infiltration of pollutants, it has not been included in the conventional SINTACS method as a parameter [65]. Therefore, in this research, due to the fact that intensive agricultural activities exist, the inclusion of land use as an additional parameter was indispensable. Moreover, in agricultural areas with nitrate pollution, land use inclusion can enhance the efficiency and accuracy of the standard SINTACS method [50]. The vulnerability classes and the corresponding ranges are given in Table 5. The SINTACS-LU method is calculated using the following Equation (5):
SINTACS-LU = SrSw + IrIw + NrNw + TrTw + ArAw + CrCw + SrSw + LUrLUw
Due to the fact that the three groundwater vulnerability methods employ different classes and ranges, their values were normalized to critically correlate them with nitrate concentration values using the following Equation (6):
Xnorm = [(X − Xmin)/(Xmax − Xmin)] × 100
where Xnorm is the normalized data, Xmax is the maximum index value and Xmin is the minimum index value.

3.4. Sensitivity Analysis

In this study, the single-parameter sensitivity analysis, introduced by Napolitano and Fabbri [33], was performed in order to appraise the contribution of each parameter on the final vulnerability measure by comparing its theoretical weight with the real (effective) weight. This test provides credible information and determines the significance of subjectivity elements in the vulnerability methods [61,67]. The effective weights for all parameters were calculated using the following Equation (7).
W = P r P w V × 100
where W indicates the effective weight of each parameter, Pr and Pw refer to the rating value and the weight of each parameter, and V denotes the overall vulnerability index. When the effective (real) weight of a parameter is higher, compared with the theoretical one, it indicates that it has greater importance on the final results of the groundwater vulnerability model [68].

3.5. Preparation of Vulnerability Assessment Parameters

3.5.1. Depth to Water

This parameter plays an important role in groundwater quality degradation and denotes the perpendicular distance between the water table and the ground surface [18]. Areas having higher values of depth to groundwater are less vulnerable to pollution because pollutants are required to travel long distances to reach the water table. In this study, water level data from 42 observation wells were used during the spring period, and they were interpolated using the inverse distance weighted (IDW) method in the spatial analyst tool of ArcGIS [40,41,64,69,70,71]. The ranges for this parameter, with their corresponding ratings (values in parentheses), were classified into five categories, according to [38,72]: 0–10 m (10), 10–20 m (7), 20–30 m (5), 30–40 m (3) and >40 m (1) (Figure 2). Generally, in the southern part of the basin, the aquifer is considered relatively shallow; hence, these areas are more susceptible to pollution. On the contrary, higher values (>40 m) were observed in the central and northern parts of the aquifer, and the depth to water parameter was assigned with 1.

3.5.2. Net Recharge

Net recharge corresponds to the amount of water that infiltrates through the soil into the ground surface and reaches the water table [64]. Infiltrated water plays a crucial role inthe transportation of surface pollutants into groundwater and within the aquifer. Obviously, an area with high recharge values is more prone to pollution potential [73]. Recharge was estimated using the Piscopo method, which integrates three important factors, such as slope, rainfall and soil permeability [59,74,75,76].
Recharge value = Slope + Rainfall + Soil permeability
The estimation of the slope map was conducted through the utilization of the Digital Elevation Model (ASTER-DEM) in a raster file format with 30 m spatial resolution. Rainfall, according to previous research, was estimated at approximately 420 mm/year [51]. Soil permeability data were obtained from the results of a soil survey (0–30 cm of soil samples) in the study area, which are included in the Greek soil database [77]. The area mostly consists of clay loam in the northern part (very low permeability), clay to silty loam in the central (slow permeability) and loam to sandy loam in the southern part (moderate to mod-high permeability). Net recharge index values were evaluated by integrating the weighed grids of the above three maps (Equation (8)). Table 6 shows the respective ratings for this method. Recharge was finally assigned with 5 for the southern part and with 3 for the rest of the study area.

3.5.3. Aquifer Media

This parameter describes the characteristics of the saturated zone, which controls pollutant movement and attenuation processes [68]. The aquifer media depends on the permeability of its constituent materials; pollution potential increases as permeability increases. When pollutants reach the aquifer, they get dispersed in groundwater, and as a result, they get diluted [50]. Based on the lithological profiles of 16 available boreholes, the major materials of the aquifer media with their corresponding ratings were clay with sand (4), clay with gravels (5) and sand with gravel (8) (Figure 3).

3.5.4. Soil Media

Soil media characterizes the outermost weathered layer of the vadose zone, which controls the amount of rainfall water that can infiltrate into groundwater, depending on soil porosity and permeability [42]. The grain size of soil media plays an important role in the mobility of possible pollutants. Soil map was derived from research about soil geographic data and delineation of agricultural zones, funded by the Greek Ministry of Agricultural Development and Food [75]. The study area mostly consists of the following materials with their corresponding ratings: clay loam (3) and silty loam (4) in the northern and central parts, which reduces the soil permeability and the potential vulnerability, whereas, in the southern part, it consists of silty loam (4), loam (5) and sandy loam (6), which increases the possible risk of pollution (Figure 4).

3.5.5. Topography

Topography expresses the ground slope variability of the land surface and plays an important role in the movement of groundwater [18]. Particularly, areas with low slopes have higher vulnerability potential because water infiltration is high, enhancing pollutants propagation to the aquifer [78]. Conversely, in hilly areas with steep slopes, due to higher chances of run-off flow, infiltration is reduced and, therefore, groundwater vulnerability is smaller [37]. The topography of the study area was extracted from the digital elevation model ASTER DEM, and the slope map was created using a spatial analyst tool in ArcGIS (Figure 5). In general, the area is characterized by flat terrain and the slope percentage ranges between 0% and 24%. Specifically, the slope of almost 80% of the total area ranged between 0% and 6% and was assigned 9 and 10, accordingly. Thence, the gentle slope on most of the area signifies the significant effect of topography on groundwater vulnerability.

3.5.6. Vadose Zone

It is defined as the unsaturated or partially saturated zone between the soil cover and the water table [18]. The materials of this zone affect the speed of propagation of pollutants and control pollutant attenuation because different debilitation processes occur in this area, such as dispersal and chemical reactions [42]. This parameter was generated using the lithological data from 16 wells, and then it was categorized according to their capacity to allow and transmit water. The northern part of the study area basically comprisedred clay and was assigned the lowest rating. However, in the southern part, the impact of this factor on aquifer vulnerability is more profound because the area comprises alluvial deposits, namely sand and gravel, with some clay.

3.5.7. Hydraulic Conductivity

Hydraulic conductivity regulates the ability of aquifer materials to transmit groundwater. Consequently, it regulates pollutants’ flow direction and speed [59]. Higher hydraulic conductivity values portend higher groundwater pollution potential [79]. In previous research, the Cooper–Jacob and the recovery test methods were employed to groundwater level data in order to estimate the hydrogeological parameters of the studied aquifer, namely hydraulic conductivity, transmissivity and storativity [55,57,80,81]. Results showed that the hydraulic conductivity ranged from about 1 × 10⁻⁶ m/s to 2 × 10⁻⁵ m/s, and its values were considered slightly low [55,57,80,81].

3.5.8. Land Use

Land use is a prime factor that can be used as an additional parameter for vulnerability mapping in modified DRASTIC and modified SINTACS [34]. It describes the natural and anthropogenic activities occurring on the soil surface. Different land use types, namely agricultural, urban and industrial, can considerably affect groundwater quantity and quality [63]. For instance, the extensive use of fertilizers and pesticides in agricultural land is responsible for the serious problem of nitrate pollution within the groundwater, leading to water quality degradation [26,62]. In this study, the land use map was classified based on the classes of Corine Land Cover 2012, and its ratings have been assigned according to Table 1 and can be seen in Figure 6. The predominant land use of the study area is covered by agricultural land, and the ratings were accordingly assigned as follows: non-irrigated arable land covers 29.89% of the total area and was assigned with 5, fruit trees and berry plantations cover 26.49% and was assigned with 6, complex cultivation patterns cover 19.26% and was assigned with 9, whereas olive groves cover 16.61% and was assigned with 6.

4. Results and Discussion

4.1. Groundwater Vulnerability Assessment Methods

4.1.1. Pesticide DRASTIC-LU Vulnerability Assessment

The results obtained from the Pesticide DRASTIC-LU method are shown in Figure 7. According to this method, the ranges varied from 75 to 210, and the study area was divided into the following classes [82,83]: very low (<80), low (80–120), moderate (120–160), high (160–200) and very high (>200). In terms of spatial coverage, the Pesticide DRASTIC-LU vulnerability map distribution showed that about 0.22% and 30.18% of the area fell under the very low and low class, respectively, whereas 44.89% was occupied by moderate class, 24.07% and 0.5% of the total area were classified as high and very high vulnerability, accordingly.
Particularly, it is evident from Figure 7 that the areas of high and very high vulnerability were primarily concentrated in the southern and southwestern parts of the study area and alongside the coastline. This can be attributed to a combination of factors, including the predominance of shallow water table zones, flat topography, higher recharge values and soil permeability (sandy loam presence increases porosity) compared to the northern part. Moreover, the inclusion of land use parameters reveals that the occurrence of complex cultivation patterns in the southwestern area reinforces groundwater vulnerability potential. On the contrary, the northern part of the area exhibited reduced vulnerability, as the topography is slightly steeper, the groundwater table is deeper (>40 m), the vadose zone is thicker and less permeable (clay and silty clay occurrence decrease the porosity), and also because the agricultural activities, such as olive groves, non-irrigated arable land and agricultural land with significant areas of natural vegetation, are less intensive. The central part of the study area was classified as having a moderate level of vulnerability.

4.1.2. Nitrate SINTACS-LU Vulnerability Map

The final Nitrate SINTACS-LU index (Figure 8) varied from 105 to 197 and was categorized into three vulnerability types [48,66]: moderate (105–140), high (140–186) and very high (186–197), which covered a 33.10%, 61.93% and 4.97% of the total area, respectively.
This vulnerability map revealed that the most vulnerable part (very high class) of the study area was the southwestern. Similar to the Pesticide DRASTIC-LU model results, this part is characterized by intensive agricultural activities (complex cultivation patterns), a relatively shallow aquifer and a sandy loam soil texture. The high vulnerability class demarcated an area of almost 62% and was predominantly concentrated in the southeastern and central parts of the basin, whereas the northern part of the area showed moderate vulnerability. It should be mentioned that this method did not manage to detect any very low and low vulnerability zone.

4.1.3. Nitrate Vulnerability (NV) Index Map

The groundwater vulnerability results from the Nitrate NV index model varied from 15 to 180 and are shown in Figure 9. The area was divided into four vulnerability classes: very low (<70), low (70–110), moderate (110–150) and high (150–180).
In particular, the high-vulnerability area accounted for 5.32% of the total area. It was mainly distributed in the south and southwestern part of the Nea Moudania aquifer, a region with intense anthropogenic activities, a gentle slope and a shallow water table. The moderate vulnerability class covered 41.09% of the total area and expanded from the south to the center of the aquifer. The class with low vulnerability accounted for 30.26% of the study area and corresponded to the central and northern parts of the area. The very low vulnerability class was principally located in the northern region of the area, covering 23.34% of the study basin and is associated with a clayey loam soil texture, as well as an unsaturated zone of clay-type lithology that reduces the chances of the aquifer pollution.
Furthermore, a critical comparison between the modified methods is valuable because it exhibits the similarities and dissimilarities of the vulnerability maps, providing a helpful tool for researchers to choose which method is the most suitable. Particularly, the results indicate that all three methods display a relatively accurate and reliable depiction of the groundwater vulnerability condition. Table 7 summarizes the area distribution of the aforementioned groundwater vulnerability methods applied in the Nea Moudania aquifer. The very low vulnerability class covers 23% of the total area in the Nitrate NV index, whilst the other two methods do not attribute any area in this class. The low vulnerability class covers exactly the same area (30%) in Pesticide DRASTIC-LU and Nitrate NV index methods, whereas the Nitrate SINTACS-LU does not cover any area in this class. Regarding the moderate vulnerability, again, Pesticide DRASTIC-LU and Nitrate NV index methods show pretty much the same results (≈43%), whilst the Nitrate SINTACS-LU covers a comparatively lower area. Moreover, the Nitrate SINTACS-LU covers a significantly larger high vulnerability area (≈62%) compared to the other two methods (24% and 5%, respectively). Finally, the Nitrate SINTACS-LU method indicates that 5% of the study area belongs to the very high vulnerability class.
The underlying uncertainties of the derived three vulnerability maps could be summarized as follows: (1) the methods do not take into consideration any temporal effects, such as seasonal groundwater level fluctuations or seasonal climate change, (2) uncertainty in the parameters’ weights without significant consideration of the regional hydrogeological characteristics of a study area, (3) limited data available regarding the hydrogeological and hydrochemical characteristics of the groundwater in the study area.

4.2. Single-Parameter Effect of Weight-Rating Factors on Pesticide DRASTIC-LU and Nitrate SINTACS-LU Methods

The single-parameter sensitivity analysis was carried out for the eight input parameters of the Pesticide DRASTIC-LU and Nitrate SINTACS-LU methods. The effective (real) weight of the eight parameters of the methods is a function of the assigned (theoretical) weight and the reciprocal influence with the other parameters of each method [68].
The Pesticide DRASTIC-LU parameters weights displayed some deviations compared to the theoretical weights (Table 8). Results reveal that the land use parameter is the most influencing parameter in this method, having an effective weight value (21.08%) considerably higher than the theoretical one (16.13%) [84]. This is because this method can detect areas that are mostly affected by anthropogenic activities, such as agriculture. Land use parameter is followed by the topography (16.84%) and the impact of the vadose zone (16.45%), which both parameters have a greater impact on vulnerability assessment and significantly higher effective weight values, compared to their theoretical ones, 9.68% and 12.90%, respectively [85]. In particular, the mean effective value of topography has almost doubled. Moreover, the aquifer media has an effective weight (12.65%) higher than the theoretical one (9.68%) [67,83]. Nonetheless, depth to water, recharge and hydraulic conductivity have lower effective weights (6.75%, 10.37% and 1.37%, respectively) compared with their theoretical ones, revealing a lesser influence on groundwater vulnerability [48]. The influence of soil media is pretty much the same (14.50%), as the effective weight has almost a similar value to the theoretical. Generally, the results of Pesticide DRASTIC-LU reveal the significance of the parameters on groundwater vulnerability as follows LU > T > I > S > A > R > D > C, compared with the theoretical LU > D > S > R > I > A > T > C.
In Nitrate SINTACS-LU, the most effective parameter, likewise with Pesticide DRASTIC-LU, is land use, having a mean value equal to 20.17% instead of the theoretical 16.13% (Table 9). In fact, the largest part of the area is covered by agricultural land and is intensively cultivated and irrigated; thus, it is considered a foremost source of pollution. Additionally, the topography, the unsaturated zone and the aquifer media also have relatively high effective weights (16.43, 15.74 and 8.07%, respectively). Notably, these results are also in accordance with the results of the Pesticide DRASTIC-LU. On the other hand, other parameters, such as depth to water, infiltration, soil media and hydraulic conductivity, represented lower effective weights (13.25, 9.83, 13.87 and 2.65%, respectively) compared with their theoretical ones. The impact of parameters contribution for this method is the following: LU > S (topography) > N > T > S (depth to water) > I > A > C.
In general, the results of the single parameter sensitivity analysis showed that there were substantial differences between the theoretical and the effective weights for the Pesticide DRASTIC-LU and the Nitrate SINTACS-LU methods. In both methods, the most effective parameter was land use, followed by the topography and the impact of the vadose zone, whilst the least effective parameter was the hydraulic conductivity because of its low value in the study area [31,86]. Furthermore, the Nitrate SINTACS-LU exhibited a higher vulnerability grade compared to the other two methods. This might be due to the different ratings and weights assigned to the hydrogeological parameters, as well as the different vulnerability classes of each method. For instance, the high vulnerability class in Pesticide DRASTIC-LU ranges between 160 and 200, whereas in Nitrate SINTACS-LU, the same class ranges between 140 and 186.

4.3. Methods Validation

Validation is a noteworthy process that verifies the results obtained from the aforementioned vulnerability assessment models so as to measure which one is the most accurate and appropriate for the Nea Moudania aquifer [42,60,86]. The study employed the coefficient of determination (R2) to assess the precision of the data by examining the correlation between nitrate concentration and groundwater vulnerability indexes. Nitrate was selected as a representative groundwater pollutant, as it only occurs naturally only in very low concentrations in groundwater (1–3 mg/L) [41,64,87]. Hence, its origin is anthropogenic and is associated with intensive agricultural activity, nitrogen fertilizer application as well as urbanization [88]. Generally, higher correlation coefficient values with nitrate concentration data indicate better applicability and efficiency of a vulnerability model.
In the present study, nitrate concentration values obtained from 23 groundwater sampling points (Figure 10) were used to validate the efficacy of the three groundwater vulnerability models. Specifically, nitrate concentration values ranges between 4.2 and 30 mg/L, with a mean value of 15 mg/L [89,90]. Results of the R2 for the Pesticide DRASTIC-LU, the Nitrate SINTACS-LU and the Nitrate NV index were 0.67, 0.66 and 0.69, respectively (Figure 11). All three methods provided a significant positive coefficient of determination for a specific pollutant (nitrate) in the agricultural area of Nea Moudania, validating the models’ results. Notwithstanding, it is noteworthy that the Nitrate NV index exhibited a slightly better correlation, thereby rendering it the most suitable and effective method for assessing groundwater vulnerability in the study area.

5. Conclusions

In this study, three different GIS-based modified groundwater vulnerability assessment methods, namely the Pesticide DRASTIC-LU, the Nitrate SINTACS-LU and the Nitrate NV index were implemented in order to evaluate and identify different groundwater vulnerability zones in the porous aquifer of Nea Moudania, Greece. All three methods deploy eight geological and hydrogeological parameters, which predominantly affect the vulnerability of the porous aquifer. Particularly, the areas with the highest vulnerability potential are mainly distributed in the southern and southwestern parts of the study basin. This is attributed to the shallow groundwater depth, the intense anthropogenic activities, such as agriculture and the topography, which is characterized by gentle slopes. Conversely, the northern region of the Nea Moudania aquifer is identified as a low groundwater vulnerability zone, where the topography is slightly steeper, the groundwater table is generally deeper, the vadose zone is thicker and the constituent materials are less permeable, as well as because the agricultural activities are less intensive. Thereafter, a single-parameter sensitivity analysis was performed, revealing the importance of the land use and the topography parameters in vulnerability delineation, emphasizing the necessity for accurate, detailed and representative pertaining to these parameters. On the contrary, the least effective parameter is hydraulic conductivity because of its relatively low value in the study area. As a consequence, the utilization of sensitivity analysis proves to be a handy tool for revising the parameter weights, helping to obtain reasonable results according to the specific hydrogeological conditions of an area. Furthermore, the water quality parameter, namely nitrate NO3 concentration, has been adopted to validate the aquifer vulnerability maps by employing the coefficient of determination (R2). In the Nea Moudania aquifer, the most accurate and suitable method for groundwater vulnerability evaluation was found to be the Nitrate NV index (R2 = 0.69), having scored a marginally superior correlation in comparison to the other two methods. Hereupon, the Pesticide DRASTIC-LU and the Nitrate SINTACS-LU also provided a noteworthy positive coefficient of determination, 0.67 and 0.66, respectively. The aforementioned results may serve as a guideline for the sustainable and effective groundwater management and protection of the Nea Moudania porous aquifer, assisting policymaking authorities in decision-making at a regional scale. Therefore, the design and systematic maintenance of a groundwater quality monitoring network on a regular basis, particularly in highly vulnerable zones, is crucial for the prevention of further groundwater quality deterioration, and thus, it is highly recommended. Furthermore, it is an urgent need to reduce the pumping flow rates of the irrigation wells (regulate the amount of water withdrawal) and enforce strict regulations on agricultural activities, as well as reschedule the general pumping strategy to attenuate groundwater depletion in the studied aquifer. Additionally, the implementation of sustainable agricultural practices, such as precision irrigation and optimal crop allocation and water-saving irrigation methods, is recommended. Moreover, the adoption of advanced technologies, such as Geographic Information Systems (GIS) and remote sensing, can facilitate the systematic monitoring of groundwater level and quality, the identification of potential sources of pollution and the planning of recharge activities. Finally, new data collection, such as groundwater level data, precipitation data, land use changes and hydrochemical data, could enhance the performance and reliability of the groundwater vulnerability assessment methods, ensuring the sustainability of the study area’s aquifer.

Author Contributions

Conceptualization, M.C.K. and D.K.K.; methodology, M.C.K. and D.K.K.; software, M.C.K.; validation, M.C.K. and D.K.K.; formal analysis, M.C.K.; investigation, M.C.K.; resources, M.C.K.; data curation, M.C.K.; writing—original draft preparation, M.C.K.; writing—review and editing, M.C.K., D.K.K., P.E.G. and N.T.; visualization, M.C.K. and D.K.K.; supervision, D.K.K. All authors have read and agreed to the published version of the manuscript.

Funding

This research received no external funding.

Institutional Review Board Statement

Not applicable.

Informed Consent Statement

Not applicable.

Data Availability Statement

Not applicable.

Conflicts of Interest

The authors declare no conflict of interest.

References

  1. Gorelick, S.M.; Zheng, C. Global change and the groundwater management challenge. Water Resour. Res. 2015, 51, 3031–3051. [Google Scholar] [CrossRef]
  2. Shekhar, S.; Pandey, A.C. Delineation of groundwater potential zone in hard rock terrain of India using remote sensing, geographical information system (GIS) and analytic hierarchy process (AHP) techniques. Geocarto Int. 2014, 30, 402–421. [Google Scholar] [CrossRef]
  3. Aslam, R.A.; Shrestha, S.; Pandey, V.P. Groundwater vulnerability to climate change: A review of the assessment methodology. Sci. Total Environ. 2018, 612, 853–875. [Google Scholar] [CrossRef] [PubMed]
  4. Gupta, T.; Kumari, R. Assessment of groundwater nitrate vulnerability using DRASTIC and modified DRASTIC in upper catchment of Sabarmati basin. Environ. Earth Sci. 2023, 82, 216. [Google Scholar] [CrossRef]
  5. Green, T.R.; Taniguchi, M.; Kooi, H.; Gurdak, J.J.; Allen, D.M.; Hiscock, K.M.; Treidel, H.; Aureli, A. Beneath the surface of global change: Impacts of climate change on groundwater. J. Hydrol. 2011, 405, 532–560. [Google Scholar] [CrossRef] [Green Version]
  6. Saidi, S.; Bouri, S.; Ben Dhia, H.; Anselme, B. Assessment of groundwater risk using intrinsic vulnerability and hazard mapping: Application to Souassi aquifer, Tunisian Sahel. Agric. Water Manag. 2011, 98, 1671–1682. [Google Scholar] [CrossRef]
  7. Ncibi, K.; Chaar, H.; Hadji, R.; Baccari, N.; Sebei, A.; Khelifi, F.; Hamed, Y. A GIS-based statistical model for assessing groundwater susceptibility index in shallow aquifer in Central Tunisia (Sidi Bouzid basin). Arab. J. Geosci. 2020, 13, 98. [Google Scholar] [CrossRef]
  8. Taylor, R.G.; Todd, M.C.; Kongola, L.; Maurice, L.; Nahozya, E.; Sanga, H.; MacDonald, A.M. Evidence of the dependence of groundwater resources on extreme rainfall in East Africa. Nat. Clim. Chang. 2012, 3, 374–378. [Google Scholar] [CrossRef] [Green Version]
  9. Gardner, K.K.; Vogel, R.M. Predicting ground water nitrate concentration from land use. Ground Water 2005, 43, 343–352. [Google Scholar] [CrossRef] [Green Version]
  10. Puckett, L.J.; Tesoriero, A.J.; Dubrovsky, N.M. Nitrogen Contamination of Surficial Aquifers—A Growing Legacy. Environ. Sci. Technol. 2011, 45, 839–844. [Google Scholar] [CrossRef]
  11. Abera, K.A.; Gebreyohannes, T.; Abrha, B.; Hagos, M.; Berhane, G.; Hussien, A.; Belay, A.S.; Van Camp, M.; Walraevens, K. Vulnerability Mapping of Groundwater Resources of Mekelle City and Surroundings, Tigray Region, Ethiopia. Water 2022, 14, 2577. [Google Scholar] [CrossRef]
  12. Kumar, P.; Thakur, P.K.; Bansod, B.K.S.; Debnath, S.K. Groundwater: A regional resource and a regional governance. Environ. Dev. Sustain. 2018, 20, 1133–1151. [Google Scholar] [CrossRef]
  13. Zhang, Q.; Li, P.; Lyu, Q.; Ren, X.; He, S. Groundwater contamination risk assessment using a modified DRATICL model and pollution loading: A case study in the Guanzhong Basin of China. Chemosphere 2021, 291, 132695. [Google Scholar] [CrossRef]
  14. Busico, G.; Mastrocicco, M.; Cuoco, E.; Sirna, M.; Tedesco, D. Protection from natural and anthropogenic sources: A new rating methodology to delineate “Nitrate Vulnerable Zones”. Environ. Earth Sci. 2019, 78, 104. [Google Scholar] [CrossRef]
  15. Oke, S.A. Regional Aquifer Vulnerability and Pollution Sensitivity Analysis of Drastic Application to Dahomey Basin of Nigeria. Int. J. Environ. Res. Public Health 2020, 17, 2609. [Google Scholar] [CrossRef] [Green Version]
  16. Soyaslan, İ.İ. Assessment of groundwater vulnerability using modified DRASTIC-Analytical Hierarchy Process model in Bucak Basin, Turkey. Arab. J. Geosci. 2020, 13, 1127. [Google Scholar] [CrossRef]
  17. Mimi, Z.A.; Mahmoud, N.; Madi, M.A. Modified DRASTIC assessment for intrinsic vulnerability mapping of karst aquifers: A case study. Environ. Earth Sci. 2011, 66, 447–456. [Google Scholar] [CrossRef]
  18. Aller, L.; Bennett, T.; Lehr, J.H.; Petty, R.J.; Hacket, G. DRASTIC: A standardized system for evaluating groundwater pollution potential using hydrogeologic settings. In US Environmental Protection Agency Report (EPA/600/2-87/035); Robert, S., Ed.; Kerr Environmental Research Laboratory: Ada, OK, USA, 1987; p. 455. [Google Scholar]
  19. Foster, S.S.D. Fundamental concepts in aquifer vulnerability, pollution risk and protection strategy. In Vulnerability of Soil and Groundwater to Pollutants; Van Duijvenbooden, W., Van Waegeningh, H.G., Eds.; Committee on Hydrological Research: The Hague, The Netherlands, 1987; Volume 38, pp. 69–86. [Google Scholar]
  20. Van Stempvoort, D.; Ewert, L.; Wassenaar, L. Aquifer vulnerability index: A GIS compatible method for groundwater vulnerability mapping. Can. Water Resour. J. 1993, 18, 25–37. [Google Scholar] [CrossRef] [Green Version]
  21. Civita, M. Le Carte Della Vulnerabilita Degli Acquiferi Allinquinamiento: Teoria e Pratica [Contamination Vulnerability Mapping of the Aquifer: Theory and Practice]; Quaderni di Tecniche di Protezione Ambientale: Pitagora, Italy, 1994. [Google Scholar]
  22. Ribeiro, L. SI: A New Index of Aquifer Susceptibility to Agricultural Pollution; Internal report; ERSHA/CVRM, Instituto Superior Técnico: Lisboa, Portugal, 2000; 12p. [Google Scholar]
  23. Gonçalves, V.; Albuquerque, A.; Almeida, P.G.; Cavaleiro, V. DRASTIC Index GIS-Based Vulnerability Map for the Entre-os-Rios Thermal Aquifer. Water 2022, 14, 2448. [Google Scholar] [CrossRef]
  24. Goldscheider, N. The Concept of Groundwater Vulnerability. In COST Action 620—Vulnerability and Risk Mapping for the Protection of Carbonate (Karst) Aquifers, Final Report; Zwahlen, F., Ed.; European Commission: Brussels, Belgium, 2003; pp. 5–9. [Google Scholar]
  25. Aydi, A. Evaluation of groundwater vulnerability to pollution using a GIS-based multi-criteria decision analysis. Groundw. Sustain. Dev. 2018, 7, 204–211. [Google Scholar] [CrossRef]
  26. Wu, H.; Chen, J.; Qian, H. A modified DRASTIC model for assessing contamination risk of groundwater in the northern suburb of Yinchuan, China. Environ. Earth Sci. 2016, 75, 483. [Google Scholar] [CrossRef]
  27. Boufekane, A.; Yahiaoui, S.; Meddi, H.; Meddi, M.; Busico, G. Modified DRASTIC index model for groundwater vulnerability mapping using geostatistic methods and GIS in the Mitidja plain area (Algeria). Environ. Forensics 2022, 23, 539–556. [Google Scholar] [CrossRef]
  28. Kumar, P.; Bansod, B.K.S.; Debnath, S.K.; Thakur, P.K.; Ghanshyam, C. Index-based groundwater vulnerability mapping models using hydrogeological settings: A critical evaluation. Environ. Impact Assess. Rev. 2015, 51, 38–49. [Google Scholar] [CrossRef]
  29. Jesiya, N.P.; Gopinath, G. A Cust. Fuzzy AHP—GIS Based DRASTIC-L Model Intrinsic Groundw. Vulnerability Assess. Urban Peri-Urban Phreatic Aquifer Clusters. Groundw. Sustain. Dev. 2019, 8, 654–666. [Google Scholar] [CrossRef]
  30. Canora, F.; Muzzillo, R.; Sdao, F. Groundwater Vulnerability Assessment in the Metaponto Coastal Plain (Basilicata, Italy). Water 2022, 14, 1851. [Google Scholar] [CrossRef]
  31. Kirlas, M.C.; Karpouzos, D.Κ.; Georgiou, P.E.; Katsifarakis, K.L. A comparative study of groundwater vulnerability methods in a porous aquifer in Greece. Appl. Water Sci. 2022, 12, 123. [Google Scholar] [CrossRef]
  32. Goyal, D.; Haritash, A.K.; Singh, S.K. A comprehensive review of groundwater vulnerability assessment using index-based, modelling, and coupling methods. J. Environ. Manag. 2021, 296, 113161. [Google Scholar] [CrossRef]
  33. Napolitano, P.; Fabbri, A. Single-parameter sensitivity analysis for aquifer vulnerability assessment using DRASTIC and SINTACS. Appl. Geogr. Inf. Syst. Hydrol. Water Resour. Manag. 1996, 235, 559–566. [Google Scholar]
  34. Secunda, S.; Collin, M.L.; Melloul, A.J. Groundwater vulnerability assessment using a composite model combining DRASTIC with extensive agricultural land use in Israel’s Sharon region. J. Environ. Manag. 1998, 54, 39–57. [Google Scholar] [CrossRef]
  35. Thirumalaivasan, D.; Karmegam, M.; Venugopal, K. AHP-DRASTIC: Software for specific aquifer vulnerability assessment using DRASTIC model and GIS. Environ. Model. Assess. 2003, 18, 645–656. [Google Scholar] [CrossRef]
  36. Jang, W.; Engel, B.; Harbor, J.; Theller, L. Aquifer Vulnerability Assessment for Sustainable Groundwater Management Using DRASTIC. Water 2017, 9, 792. [Google Scholar] [CrossRef] [Green Version]
  37. Saida, S.; Tarik, H.; Abdellah, A.; Farid, H.; Hakim, B. Assessment of Groundwater Vulnerability to Nitrate Based on the Optimised DRASTIC Models in the GIS Environment (Case of Sidi Rached Basin, Algeria). Geosciences 2017, 7, 20. [Google Scholar] [CrossRef] [Green Version]
  38. Khan, R.; Jhariya, D.C. Assessment of Groundwater Pollution Vulnerability Using GIS Based Modified DRASTIC Model in Raipur City, Chhattisgarh. J. Geol. Soc. India 2019, 93, 293–304. [Google Scholar] [CrossRef]
  39. Gharakezloo, Y.N.; Nikoo, M.R.; Karimi-Jashni, A.; Mooselu, M.G. A hybrid statistical decision-making optimization approach for groundwater vulnerability considering uncertainty. Environ. Sci. Pollut. Res. 2022, 29, 8597–8612. [Google Scholar] [CrossRef]
  40. Lakshminarayanan, B.; Ramasamy, S.; Anuthaman, S.N.; Karuppanan, S. New DRASTIC framework for groundwater vulnerability assessment: Bivariate and multi-criteria decision-making approach coupled with metaheuristic algorithm. Environ. Sci. Pollut. Res. 2022, 29, 4474–4496. [Google Scholar] [CrossRef]
  41. Saranya, T.; Saravanan, S. Evolution of a hybrid approach for groundwater vulnerability assessment using hierarchical fuzzy-DRASTIC models in the Cuddalore Region, India. Environ. Earth Sci. 2021, 80, 179. [Google Scholar] [CrossRef]
  42. Sresto, M.A.; Siddika, S.; Haque, M.N.; Saroar, M. Groundwater vulnerability assessment in Khulna district of Bangladesh by integrating fuzzy algorithm and DRASTIC (DRASTIC-L) model. Model. Earth Syst. Environ. 2022, 8, 3143–3157. [Google Scholar] [CrossRef]
  43. Kirlas, M.C.; Karpouzos, D.Κ.; Georgiou, P.E.; Katsifarakis, K.L.; Theodossiou, N. Groundwater vulnerability assessment in Nea Moudania (Chalkidiki) aquifer, using the DRASTIC and AHP-DRASTIC methods. In Proceedings of the 15th Conference of the Hellenic Hydrotechnical Association (H.H.A.), Thessaloniki, Greece, 3 June 2022. [Google Scholar]
  44. Barbulescu, A. Assessing Groundwater Vulnerability: DRASTIC and DRASTIC-Like Methods: A Review. Water 2020, 12, 1356. [Google Scholar] [CrossRef]
  45. Martínez-Bastida, J.J.; Arauzo, M.; Valladolid, M. Intrinsic and specific vulnerability of groundwater in central Spain: The risk of nitrate pollution. Hydrogeol. J. 2010, 18, 681–698. [Google Scholar] [CrossRef] [Green Version]
  46. Baghapour, M.A.; Fadaei Nobandegani, A.; Talebbeydokhti, N.; Bagherzadeh, S.; Nadiri, A.A.; Gharekhani, M.; Chitsazan, N. Optimization of DRASTIC method by artificial neural network, nitrate vulnerability index, and composite DRASTIC models to assess groundwater vulnerability for unconfined aquifer of Shiraz Plain, Iran. J. Environ. Health Sci. Eng. 2016, 14, 13. [Google Scholar] [CrossRef] [Green Version]
  47. Machiwal, D.; Jha, M.K.; Singh, V.P.; Mohan, C. Assessment and mapping of groundwater vulnerability to pollution: Current status and challenges. Earth-Sci. Rev. 2018, 185, 901–927. [Google Scholar] [CrossRef]
  48. Noori, R.; Ghahremanzadeh, H.; Kløve, B.; Adamowski, J.F.; Baghvand, A. Modified-DRASTIC, modified-SINTACS and SI methods for groundwater vulnerability assessment in the southern Tehran aquifer. J. Environ. Sci. Health 2018, 54 Pt A, 89–100. [Google Scholar] [CrossRef]
  49. Eftekhari, M.; Akbari, M. Evaluation of the SINTACS-LU model capability in the analysis of aquifer vulnerability potential in semi-arid regions. J. Appl. Res. Water Wastewater 2020, 7, 111–119. [Google Scholar] [CrossRef]
  50. Jesudhas, C.J.; Chinnasamy, A.; Muniraj, K.; Sundaram, A. Assessment of vulnerability in the aquifers of rapidly growing sub-urban: A case study with special reference to land use. Arab. J. Geosci. 2021, 14, 60. [Google Scholar] [CrossRef]
  51. Siarkos, I.; Latinopoulos, P. Modeling seawater intrusion in overexploited aquifers in the absence of sufficient data: Application to the aquifer of Nea Moudania, northern Greece. Hydrogeol. J. 2016, 24, 2123–2141. [Google Scholar] [CrossRef]
  52. Svigkas, N.; Loupasakis, C.; Papoutsis, I.; Kontoes, C.; Alatza, S.; Tzampoglou, P.; Tolomei, C.; Spachos, T. InSAR Campaign Reveals Ongoing Displacement Trends at High Impact Sites of Thessaloniki and Chalkidiki, Greece. Remote Sens. 2020, 12, 2396. [Google Scholar] [CrossRef]
  53. Syridis, G. Lithostromatographical, Biostromatographical and Paleostromatographical Study of Neogene-Quaternary formation of Chalkidiki Peninsula. Ph.D. Thesis, School of Geology, Aristotle University of Thessaloniki, Thessaloniki, Greece, 1990. (In Greek). [Google Scholar]
  54. Panteli, N.M.; Theodossiou, N. Analysis of groundwater level measurements—Application in the Moudania aquifer in Greece. Eur. Water 2016, 55, 79–89. [Google Scholar]
  55. Kirlas, M.C. Assessment of porous aquifer hydrogeological parameters using automated groundwater level measurements in Greece. J. Groundw. Sci. Eng. 2021, 9, 269–278. [Google Scholar] [CrossRef]
  56. Kirlas, M.C. Hydrogeological parameters determination and investigation of their variability in Nea Moudania aquifer, Greece. MSc Thesis, School of Civil Engineering, Faculty of Engineering, Aristotle University of Thessaloniki, Thessaloniki, Greece, 2017. [Google Scholar] [CrossRef]
  57. Kirlas, M.C.; Katsifarakis, K.L. Evaluation of automated groundwater level measurements for transmissivity and storativity calculation. J. Water Supply Res. Technol.-AQUA 2020, 69, 332–344. [Google Scholar] [CrossRef] [Green Version]
  58. Chamanehpour, E.; Sayadi, M.H.; Yousefi, E. The potential evaluation of groundwater pollution based on the intrinsic and the specific vulnerability index. Groundw. Sustain. Dev. 2020, 10, 100313. [Google Scholar] [CrossRef]
  59. Sarkar, M.; Pal, S.C. Application of DRASTIC and Modified DRASTIC Models for Modeling Groundwater Vulnerability of Malda District in West Bengal. J. Indian Soc. Remote Sens. 2021, 49, 1201–1219. [Google Scholar] [CrossRef]
  60. Hamza, S.M.; Ahsan, A.; Imteaz, M.A.; Rahman, A.; Mohammad, T.A.; Ghazali, A.H. Accomplishment and subjectivity of GIS-based DRASTIC groundwater vulnerability assessment method: A review. Environ. Earth Sci. 2014, 73, 3063–3076. [Google Scholar] [CrossRef]
  61. Gogu, R.C.; Hallet, V.; Dassargues, A. Comparison of aquifer vulnerability assessment techniques. Application to the Neblon river basin (Belgium). Environ. Geol. 2003, 44, 881–892. [Google Scholar] [CrossRef]
  62. Albuquerque, T.; Roque, N.; Rodrigues, J.; Antunes, M.; Silva, C. DRASTICAI, a New Index for Groundwater Vulnerability Assessment—A Portuguese Case Study. Geosciences 2021, 11, 228. [Google Scholar] [CrossRef]
  63. Brindha, K.; Elango, L. Cross comparison of five popular groundwater pollution vulnerability index approaches. J. Hydrol. 2015, 524, 597–613. [Google Scholar] [CrossRef]
  64. Elmeknassi, M.; El Mandour, A.; Elgettafi, M.; Himi, M.; Tijani, R.; El Khantouri, F.A.; Casas, A. A GIS-based approach for geospatial modeling of groundwater vulnerability and pollution risk mapping in Bou-Areg and Gareb aquifers, northeastern Morocco. Environ. Sci. Pollut. Res. 2021, 28, 51612–51631. [Google Scholar] [CrossRef]
  65. Easwer, V.; Kolanuvada, S.R.; Devarajan, T.; Moorthy, P.; Natarajan, L.; Chokkalingam, L.; Roy, P.D. Vulnerability mapping of the Paravanar sub-basin aquifer (Tamil Nadu, India) in SINTACS model for efficient land use planning. Environ. Res. 2022, 204, 112069. [Google Scholar] [CrossRef]
  66. Civita, M.; De Maio, M. SINTACS: Unsistema Parametrico per la Valutazione e la Cartografia Delle Vulnerabilità Degli Acquiferiall’inquinamento; Metodologia e automatizzazione, Pitagora Editrice: Bologna, Italy, 1997. [Google Scholar]
  67. Muhammad, A.M.; Zhonghua, T.; Dawood, A.S.; Earl, B. Evaluation of local groundwater vulnerability based on DRASTIC index method in Lahore, Pakistan. Geofísica Int. 2015, 54, 67–81. [Google Scholar] [CrossRef] [Green Version]
  68. Babiker, I.S.; Mohamed, M.A.A.; Hiyama, T.; Kato, K. A GIS-based DRASTIC model for assessing aquifer vulnerability in Kakamigahara Heights, Gifu Prefecture, central Japan. Sci. Total Environ. 2005, 345, 127–140. [Google Scholar] [CrossRef]
  69. Tirkey, P.; Gorai, A.K.; Iqbal, J. AHP-GIS based DRASTIC model for groundwater vulnerability to pollution assessment: A case study of Hazaribag District. Int. J. Environ. Prot. 2013, 2, 20–31. [Google Scholar]
  70. Shahab, A.; Shihua, Q.; Rad, S.; Keita, S.; Khan, M.; Adnan, S. Groundwater vulnerability assessment using GIS-based DRASTIC method in the irrigated and coastal region of Sindh province, Pakistan. Hydrol. Res. 2018, 50, 319–338. [Google Scholar] [CrossRef] [Green Version]
  71. Gonçalves, V.; Albuquerque, A.; Carvalho, P.; Almeida, P.; Cavaleiro, V. Groundwater Vulnerability Assessment to Cemeteries Pollution through GIS-Based DRASTIC Index. Water 2023, 15, 812. [Google Scholar] [CrossRef]
  72. Sener, E.; Sener, S.; Davraz, A. Assessment of aquifer vulnerability based on GIS and DRASTIC methods: A case study of the Senirkent-Uluborlu Basin (Isparta, Turkey). Hydrogeol. J. 2009, 17, 2023–2035. [Google Scholar] [CrossRef]
  73. Maqsoom, A.; Aslam, B.; Alwetaishi, M.; Awais, M.; Hassan, U.; Maqsoom, S.; Alaloul, W.S.; Musarat, M.A.; Zerouali, B.; Hussein, E.E. A GIS-Based Groundwater Contamination Assessment Using Modified DRASTIC Geospatial Technique. Water 2021, 13, 2868. [Google Scholar] [CrossRef]
  74. Piscopo, G. Groundwater Vulnerability Map Explanatory Notes—Castlereagh Catchment; NSW Department of Land and Water Conservation: Parramatta, Australia, 2001.
  75. Chitsazan, M.; Akhtari, Y. A GIS-based DRASTIC Model for Assessing Aquifer Vulnerability in Kherran Plain, Khuzestan, Iran. Water Resour. Manag. 2009, 23, 1137–1155. [Google Scholar] [CrossRef]
  76. Ghazavi, R.; Ebrahimi, Z. Assessing groundwater vulnerability to contamination in an arid environment using DRASTIC and GOD models. Int. J. Environ. Sci. Technol. 2015, 12, 2909–2918. [Google Scholar] [CrossRef] [Green Version]
  77. Misopolinos, N.; Silleos, N.; Kosmas, K.; Bilas, G.; Karapetsas, N.; Dionisiou, N. Development of an integrated system for soil geographic data and delineation of agricultural zones in Greece. Funded by Payment and Control Agency for Guidance and Guarantee Community Aid (OPEKEPE) of the Greek Ministry of Agricultural Development and Food. 2015. [Google Scholar]
  78. Lahjouj, A.; Hmaidi, A.E.; Essahlaoui, A.; Alam, M.J.B.; Siddiquee, M.S.A.; Bouhafa, K. Groundwater Vulnerability Assessment Through a Modified DRASTI-LU Framework: Case Study of Saiss Basin in Morocco. Earth Syst. Environ. 2022, 6, 885–902. [Google Scholar] [CrossRef]
  79. Rahman, A. A GIS based DRASTIC model for assessing groundwater vulnerability in shallow aquifer in Aligarh, India. Appl. Geogr. 2008, 28, 32–53. [Google Scholar] [CrossRef]
  80. Latinopoulos, P.; Theodosiou, N.; Papageorgiou, A.; Xefteris, A.; Fotopoulou, E.; Mallios, Z. Investigation of water resources in the basin of Moudania, Chalkidiki. In Proceedings of the 9th Conference of Hellenic Hydrotechnical Association, Thessaloniki, Greece, 2–5 April 2003; pp. 401–408. (In Greek). [Google Scholar]
  81. Kirlas, M.C.; Nagkoulis, N. Effects of pumping flow rates on the estimation of hydrogeological parameters. J. Hydroinform. 2023, 25, 611–627. [Google Scholar] [CrossRef]
  82. Corniello, A.; Ducci, D.; Napolitano, P. Comparison between parametric methods to evaluate aquifer pollution vulnerability using GIS: An example in the “Piana Campana”, southern Italy. In Engineering Geology and the Environment; Marinos, P.G., Koukis, G.C., Tsiambaos, G.C., Stournaras, G.C., Eds.; Balkema: Rotterdam, The Netherlands, 1997; pp. 1721–1726. [Google Scholar]
  83. Saha, D.; Alam, F. Groundwater vulnerability assessment using DRASTIC and Pesticide DRASTIC models in intense agriculture area of the Gangetic plains, India. Environ. Monit. Assess. 2014, 186, 8741–8763. [Google Scholar] [CrossRef]
  84. Garewal, S.K.; Vasudeo, A.D.; Landge, V.S.; Ghare, A.D. A GIS-based Modified DRASTIC (ANP) method for assessment of groundwater vulnerability: A case study of Nagpur city, India. Water Qual. Res. J. 2017, 52, 121–135. [Google Scholar] [CrossRef]
  85. Armanuos, A.M.; Allam, A.; Negm, A.M. Assessment of Groundwater Vulnerability to Pollution in Western Nile Delta Aquifer, Egypt. Int. Water Technol. J. 2020, 10, 18–40. [Google Scholar]
  86. Jenifer, M.A.; Jha, M.K. Comparative evaluation of GIS-based models for mapping aquifer vulnerability in hard-rock terrains. Environ. Earth Sci. 2018, 77, 672. [Google Scholar] [CrossRef]
  87. Hamed, M.H.; Dara, R.N.; Kirlas, M.C. Groundwater vulnerability assessment using a GIS-based DRASTIC method in Erbil Dumpsite area (Kani Qirzhala), Central Erbil Basin, North Iraq. Res. Sq. Platf. LLC 2022. [Google Scholar] [CrossRef]
  88. Thapa, R.; Gupta, S.; Guin, S.; Kaur, H. Sensitivity analysis and mapping the potential groundwater vulnerability zones in Birbhum district, India: A comparative approach between vulnerability models. Water Sci. 2018, 32, 44–66. [Google Scholar] [CrossRef] [Green Version]
  89. Latinopoulos, P. Development of Water Resources Management Plan for Water Supply and Irrigation (in Greek); Research Project, Final Report Prepared for the Municipality of Moudania; Aristotle University of Thessaloniki: Thessaloniki, Greece, 2003. [Google Scholar]
  90. Siarkos, I. Developing Amethodological Framework Using Mathematical Simulation Models in order to Investigate the Operation of Coastal Aquifer Systems: Application in the Aquifer of Nea Moudania. Ph.D. Thesis, Aristotle University of Thessaloniki, Thessaloniki, Greece, 2015. (In Greek). [Google Scholar]
Figure 1. Location and geological map of the study area.
Environments 10 00095 g001
Figure 2. The assigned ratings (1 to 10) for the parameter depth to water.
Environments 10 00095 g002
Figure 3. Aquifer media of the study area.
Environments 10 00095 g003
Figure 4. Soil map of the study area.
Environments 10 00095 g004
Figure 5. Topography of the study area.
Environments 10 00095 g005
Figure 6. Land Use ratings of the study area.
Environments 10 00095 g006
Figure 7. Pesticide DRASTIC-LU vulnerability map.
Environments 10 00095 g007
Figure 8. Nitrate SINTACS-LU vulnerability map.
Environments 10 00095 g008
Figure 9. Nitrate NV Index.
Environments 10 00095 g009
Figure 10. Location and concentration of nitrate samples.
Environments 10 00095 g010
Figure 11. Relationship between nitrate concentration and the normalized vulnerability indexes.
Environments 10 00095 g011
Table 1. Weight, ranges and ratings of DRASTIC-LU parameters.
DRASTIC ParameterRange/TypeRatingPesticide
Weight
D (m)0–10105
10–207
20–305
30–403
>401
R3–514
5–73
7–95
AClay with sand43
Clay with gravel5
Sand and gravel8
SClay loam35
Silty loam4
Loam5
Sandy loam6
T (%)0–2103
2–69
6–125
12–183
>181
ISilt/clay34
Sandy clay4
Sand, gravel and silt7
Sand and gravel8
C (m/day)0.04074–4.07412
LUComplex cultivation patterns95
Fruit trees and berry plantations, olive groves, road network6
Agriculture land with significant areas of natural vegetation, non-irrigated arable land, pastures, discontinuous urban fabric5
Table 2. Ranges and ratings applied to the potential risk associated with Land Use as a source of nitrate pollution for NV index.
RangeLU
Irrigated field crops1.0
Urban areas0.8
Uncultivated land and semi-natural areas0.3
Forests and natural areas0.2
Table 3. NV index vulnerability ranges.
VulnerabilityRanges
Very low<70
Low70–110
Moderate110–150
High150–190
Very high>190
Table 4. Ranges, ratings and weights of SINTACS parameters.
SINTACS ParametersRangeRatingWeight
S (m)1–495
4–68
6–87
8–106
10–205
>204
I (mm)60–7535
NCoarse alluvial deposits84
Sand, gravel and silt7
Sandy clay4
Silt/Clay3
TClay loam35
Silt loam4
Loam5
Sandy loam6
ASand and gravel82
Clay with gravel5
Clay with sand4
C (m/day)0.1–0.4322
S (%)0–2103
3–49
5–68
7–97
10–126
13–155
16–184
19–213
22–252
>261
LUComplex cultivation patterns95
Fruit trees and berry plantations, olive groves, road network6
Agriculture land with significant areas of natural vegetation, non-irrigated arable land, pastures, discontinuous urban fabric5
Table 5. Vulnerability index rating classes for SINTACS method [66].
Vulnerability ClassesRanges
Very low26–80
Low80–105
Medium105–140
High140–186
Very high186–210
Extremely high210–260
Table 6. Net recharge rating according to Piscopo method.
Slope Rainfall Soil Permeability Recharge Value
Range (%)FactorRange (mm/year)FactorRangeFactorRangeRating
<24>8504High511–1310
2–103700–8503Mod-high49–118
10–332500–7002Moderate37–95
>331<5001Slow25–73
Very slow13–51
Table 7. Percentage of aquifer vulnerability in three methods.
Groundwater Vulnerability Methods
Vulnerability ClassesPesticide DRASTIC-LUNitrate SINTACS-LUNitrate NV Index
Very low0.22%0.00%23.34%
Low30.18%0.00%30.26%
Moderate44.89%33.10%41.09%
High24.07%61.93%5.32%
Very high0.50%4.97%0.00%
Table 8. Statistics of single-parameter sensitivity analysis for Pesticide DRASTIC-LU.
ParameterTheoretical WeightTheoretical Weight (%)Effective Weight (%)
MeanMinMaxSD
D516.136.753.4334.286.17
R412.9010.372.7413.712.19
A39.6812.658.2316.451.64
S516.1314.5010.2820.572.05
T39.6816.842.0620.563.70
I412.9016.458.2321.942.74
C26.451.371.371.370.00
LU516.1321.0817.1430.852.57
Table 9. Statistics of single-parameter sensitivity analysis for Nitrate SINTACS-LU.
ParameterTheoretical WeightTheoretical Weight (%)Effective Weight (%)
MeanMinMaxSD
S516.1313.2513.1229.523.28
I516.139.849.849.840.00
N412.9015.747.8720.992.62
T516.1313.879.8419.681.97
A26.458.075.2510.501.05
C26.452.622.622.620.00
S39.6816.431.9719.683.54
LU516.1320.1716.4029.522.62
Disclaimer/Publisher’s Note: The statements, opinions and data contained in all publications are solely those of the individual author(s) and contributor(s) and not of MDPI and/or the editor(s). MDPI and/or the editor(s) disclaim responsibility for any injury to people or property resulting from any ideas, methods, instructions or products referred to in the content.

