
Assessment of Dispersed Oil Sorption in Oily Wastewater onto Hydrophobized/Oleophilized Autoclaved Aerated Concrete (AAC) Grains

1
Graduate School of Science and Engineering, Saitama University, 255 Shimo-okubo, Sakura-ku, Saitama 3388570, Japan
2
Innovative Solid Waste Solutions (Waso), Hanoi University of Civil Engineering, No. 55 Giai Phong Street, Hai Ba Trung District, Hanoi 11616, Vietnam
*
Author to whom correspondence should be addressed.
Environments 2023, 10(6), 92; https://doi.org/10.3390/environments10060092
Submission received: 13 March 2023
/
Revised: 23 May 2023
/
Accepted: 24 May 2023
/
Published: 27 May 2023
(This article belongs to the Special Issue Recent Advances in Technologies for Water and Wastewater Treatment)
Abstract
:The discharge of untreated oily wastewater into the environment has serious impacts on human health, living nature, and ecosystems and leads to significant economic losses. Many engineering techniques have been proposed and applied to treat oily wastewater, but limited studies have investigated low-cost and effective techniques using by-products and waste/scrap materials from the construction industry. Materials to treat oily wastewater are needed not only to mitigate environmental pollution but also to promote the reuse and recycling of industrial by-products, especially in developing countries. This study, therefore, examined the sorption capacity of dispersed oil in wastewater (dispersed soybean oil in water; initial oil concentrations, Ci = 10–1000 mg/L; oil droplet size in water <2 μm) onto the hydrophobized/oleophilized autoclaved porous aerated concrete (AAC) grains made from waste scrap in Vietnam by using batch sorption tests in the laboratory. The AAC grains (sizes 0.106–0.25, 0.25–0.85, and 0.85–2.00 mm) were hydrophobized/oleophilized using oleic and stearic acids (coating concentrations of 1.0, 5.0, and 10 g/kg), and two sands (0.18–2.00 and 0.30–2.00 mm) were used as control samples. The results showed that the hydrophobized/oleophilized AAC grains had high sorption capacity for dispersed oil (i.e., high oil removal efficiency) compared to the control sands. Especially, the removal of AAC grains coated with stearic acid was >80% in high oil concentration solutions (Ci = 100 and 1000 mg/L), indicating that the hydrophobized/oleophilized AAC grains have high potential as useful adsorbents to trap dispersed oil in oily wastewater. Moreover, adsorption isotherms were drawn to examine the sorption characteristics of dispersed oil onto AAC grains. For all tested samples, the sorption of dispersed oil increased linearly with increasing equilibrium concentration. The commonly used Langmuir model, on the other hand, did not capture the measured isotherms.
1. Introduction
The improper discharge and treatment of oily wastewater cause water pollution. In particular, developing countries with rapid urbanization, industrialization, and population growth face severe water pollution from oily wastewater, seriously affecting human health and natural ecosystems [1,2,3]. For example, Vietnam (one of the growing, developing countries) reports that improper treatment of oily wastewater and oil spills from human activities and industry have caused severe water pollution throughout the country, with the total amount of oil and grease exceeding environmental standards [4,5,6]; see also Table A1, Table A2 and Table A3 in the Appendix A. Therefore, urgent action is required to conserve the water environment and sustainable development [1,2,3].
The treatment of oily wastewater is required worldwide, and the allowable concentration of fats and oils must be regulated before the treated wastewater is released into the environment. The Water Pollution Prevention Act (1970) of Japan, for example, limits the maximum permissible levels of treated water discharge to 5 mg/L for mineral oil and 30 mg/L for animal and vegetable oils. In Vietnam, on the other hand, the permissible levels of surface water, groundwater, seawater, and others range between 0.05–1.0 mg/L, and the permissible levels of animal and vegetable oils and grease in domestic wastewater and specific wastewater from industrial and service sectors range between 5–30 mg/L depending on the destination of the discharge (see national standards shown in Table A1 of the Appendix A; note that the oil and wastewater standards in Vietnam are similar to those in Japan [7,8,9,10,11,12,13,14,15,16,17,18]).
Now, many technologies have been developed and applied to treat oily wastewater [19,20,21,22]. Among them, oil/water separation technologies that use hydrophobic and lipophilic membranes, meshes, and grains as filtration and adsorption materials have been intensively developed due to their high treatment performance and cost-effectiveness, e.g., [23]. Since the oil/water separation technology does not require centralized wastewater collection systems or large numbers of water treatment tanks and ponds, it can be incorporated into small-scale decentralized wastewater treatment systems with fixed-bed filtration tanks and floating filtration devices for domestic wastewater in rural areas (small number of households) generated from food processing factories and craft production villages in developing countries including Vietnam [24]. The oil/water separation technique, however, mainly targets treating oil and grease in wastewater existing in the forms such as free and floating oil [25,26,27,28]. Limited studies have been conducted to treat the dispersed oil in wastewater (the typical size of oil droplet ranges in the scale of μm to nm), and the adsorption capacity and mechanism of dispersed oil in water onto adsorbent grains have not been fully examined [29,30,31,32,33,34,35,36].
In Vietnam, moreover, construction and demolition waste (CDW) has not been fully reused and recycled and is mostly dumped without any treatment [37,38,39]. Among CDW, autoclaved aerated concrete (AAC) has a unique pore structure consisting of inner pores (μm to nm scale) and inter-pores (mm to μm scale) [40,41,42,43,44,45]. It has been reported that crushed AAC grains act as good sorbents for the simultaneous removal of Cd2+ and Pb2+ in wastewater [46,47]. In addition, the AAC grains, as well as stearic acid coated (i.e., hydrophobized/oleophilized) AAC grains, showed high performance of oil and removal chemical oxygen demand (COD) in the filtration flow system in the laboratory [48]. These suggest that the AAC grains may act as effective adsorbents to treat dispersed oil in wastewater.
This study, therefore, aimed to assess the sorption capacity of dispersed oil onto AAC grains as well as hydrophobized/oleophilized AAC grains coated with oleic and stearic acids using batch sorption tests in the laboratory. For comparing the sorption capacity of AAC grains, commercially-available filtration sands were also used as control samples. Moreover, the applicability of typical adsorption isotherm models (Langmuir, Freundlich, and linear) was examined against the measured data from batch sorption tests.
2. Materials and Methods
2.1. AAC Grains and Sands
AAC scrap was obtained from Viglacera Joint Stock Company, Bac Ninh Province, Vietnam (21°11′50.8″ N, 106°00′42.8″ E) [49]. These were crushed into 10 mm or fewer grains, and the grains were gently washed with a low-foaming neutral detergent and thoroughly rinsed with distilled water. The AAC grains were then air-dried and sieved into three particle size fractions: 0.106–0.250 mm, 0.250–0.850 mm, and 0.850–2.00 mm [50]. For comparison with test data for AAC grains, two commercially available grains of control sands of particle size fractions: 0.18–2.00 mm and 0.30–2.00 mm (Nippon Genryo Material Co., Ltd., Kanagawa, Japan) meeting Japanese filtration standards [51] were also used in this study.
2.2. Hydrophobic Agents and Coating
Two hydrophobic agents (HA), stearic acid and oleic acid (SA and OA), were chosen to hydrophobized/oleophilized coat the grains tested in this study [48,52,53,54,55,56]. OA (Chemical formula: CH3(CH2)7CH/CH(CH2)7COOH molar mass: 282.46 g/mol, density: 0.895 g/cm3) (Kanto Chemical, Tokyo, Japan) and SA (Chemical formula: CH3(CH2)16COOH, molar mass: 284.47 g/mol, density: 0.940 g/cm3) (Fuji Film Wako Pure Chemicals, Tokyo, Japan) were used. Both OA and SA are materials that are harmless to humans and the environment and are inexpensive in Vietnam.
2.3. Dispersed Oil
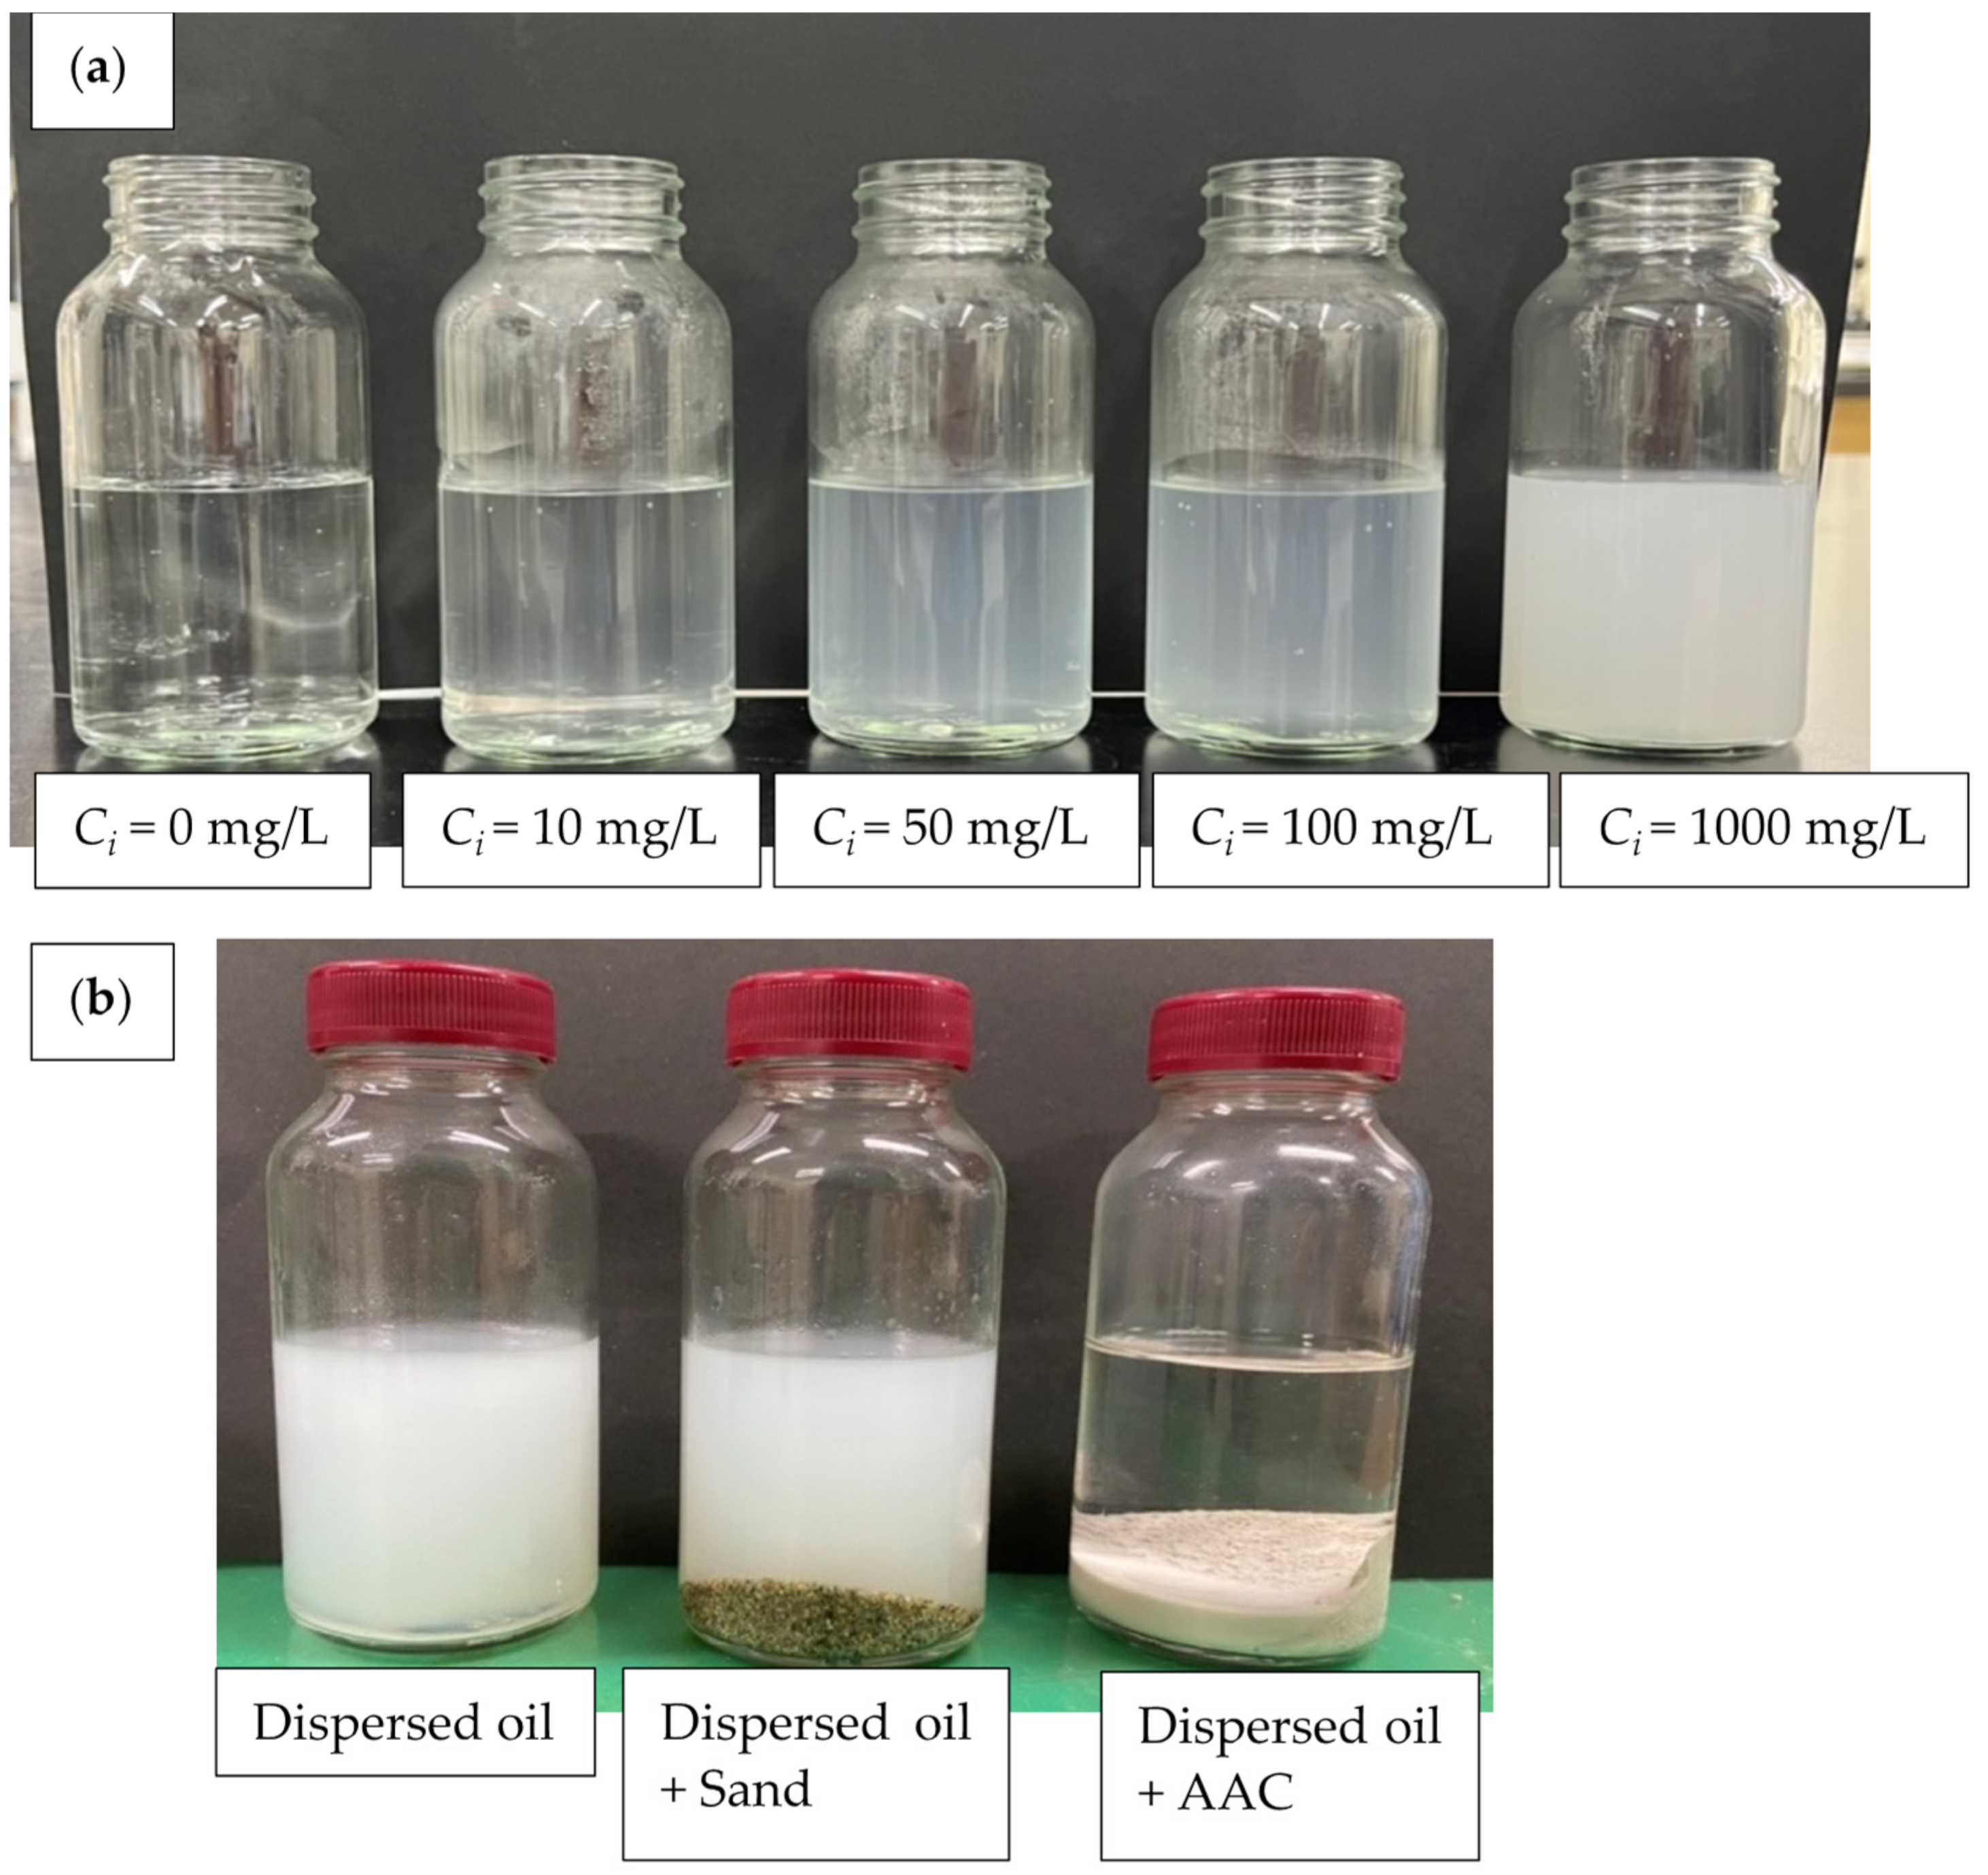
This study used soybean oil (Wako 1st Grade; Fujifilm Wako Pure Chemicals Corporation, Tokyo, Japan), a domestic oil commonly consumed in Vietnam, and liquid at room temperature [57]. Figure 1a shows an image of dispersed oil (soybean oil) after treatment with ultrasonic oil in water at each initial concentration (Ci = 0, 10, 50, 100, 1000 mg/L). In this study, dispersed oil was targeted, so soybean oil was dispersed with an ultrasonic device (UP400st, Hielscher, Germany).
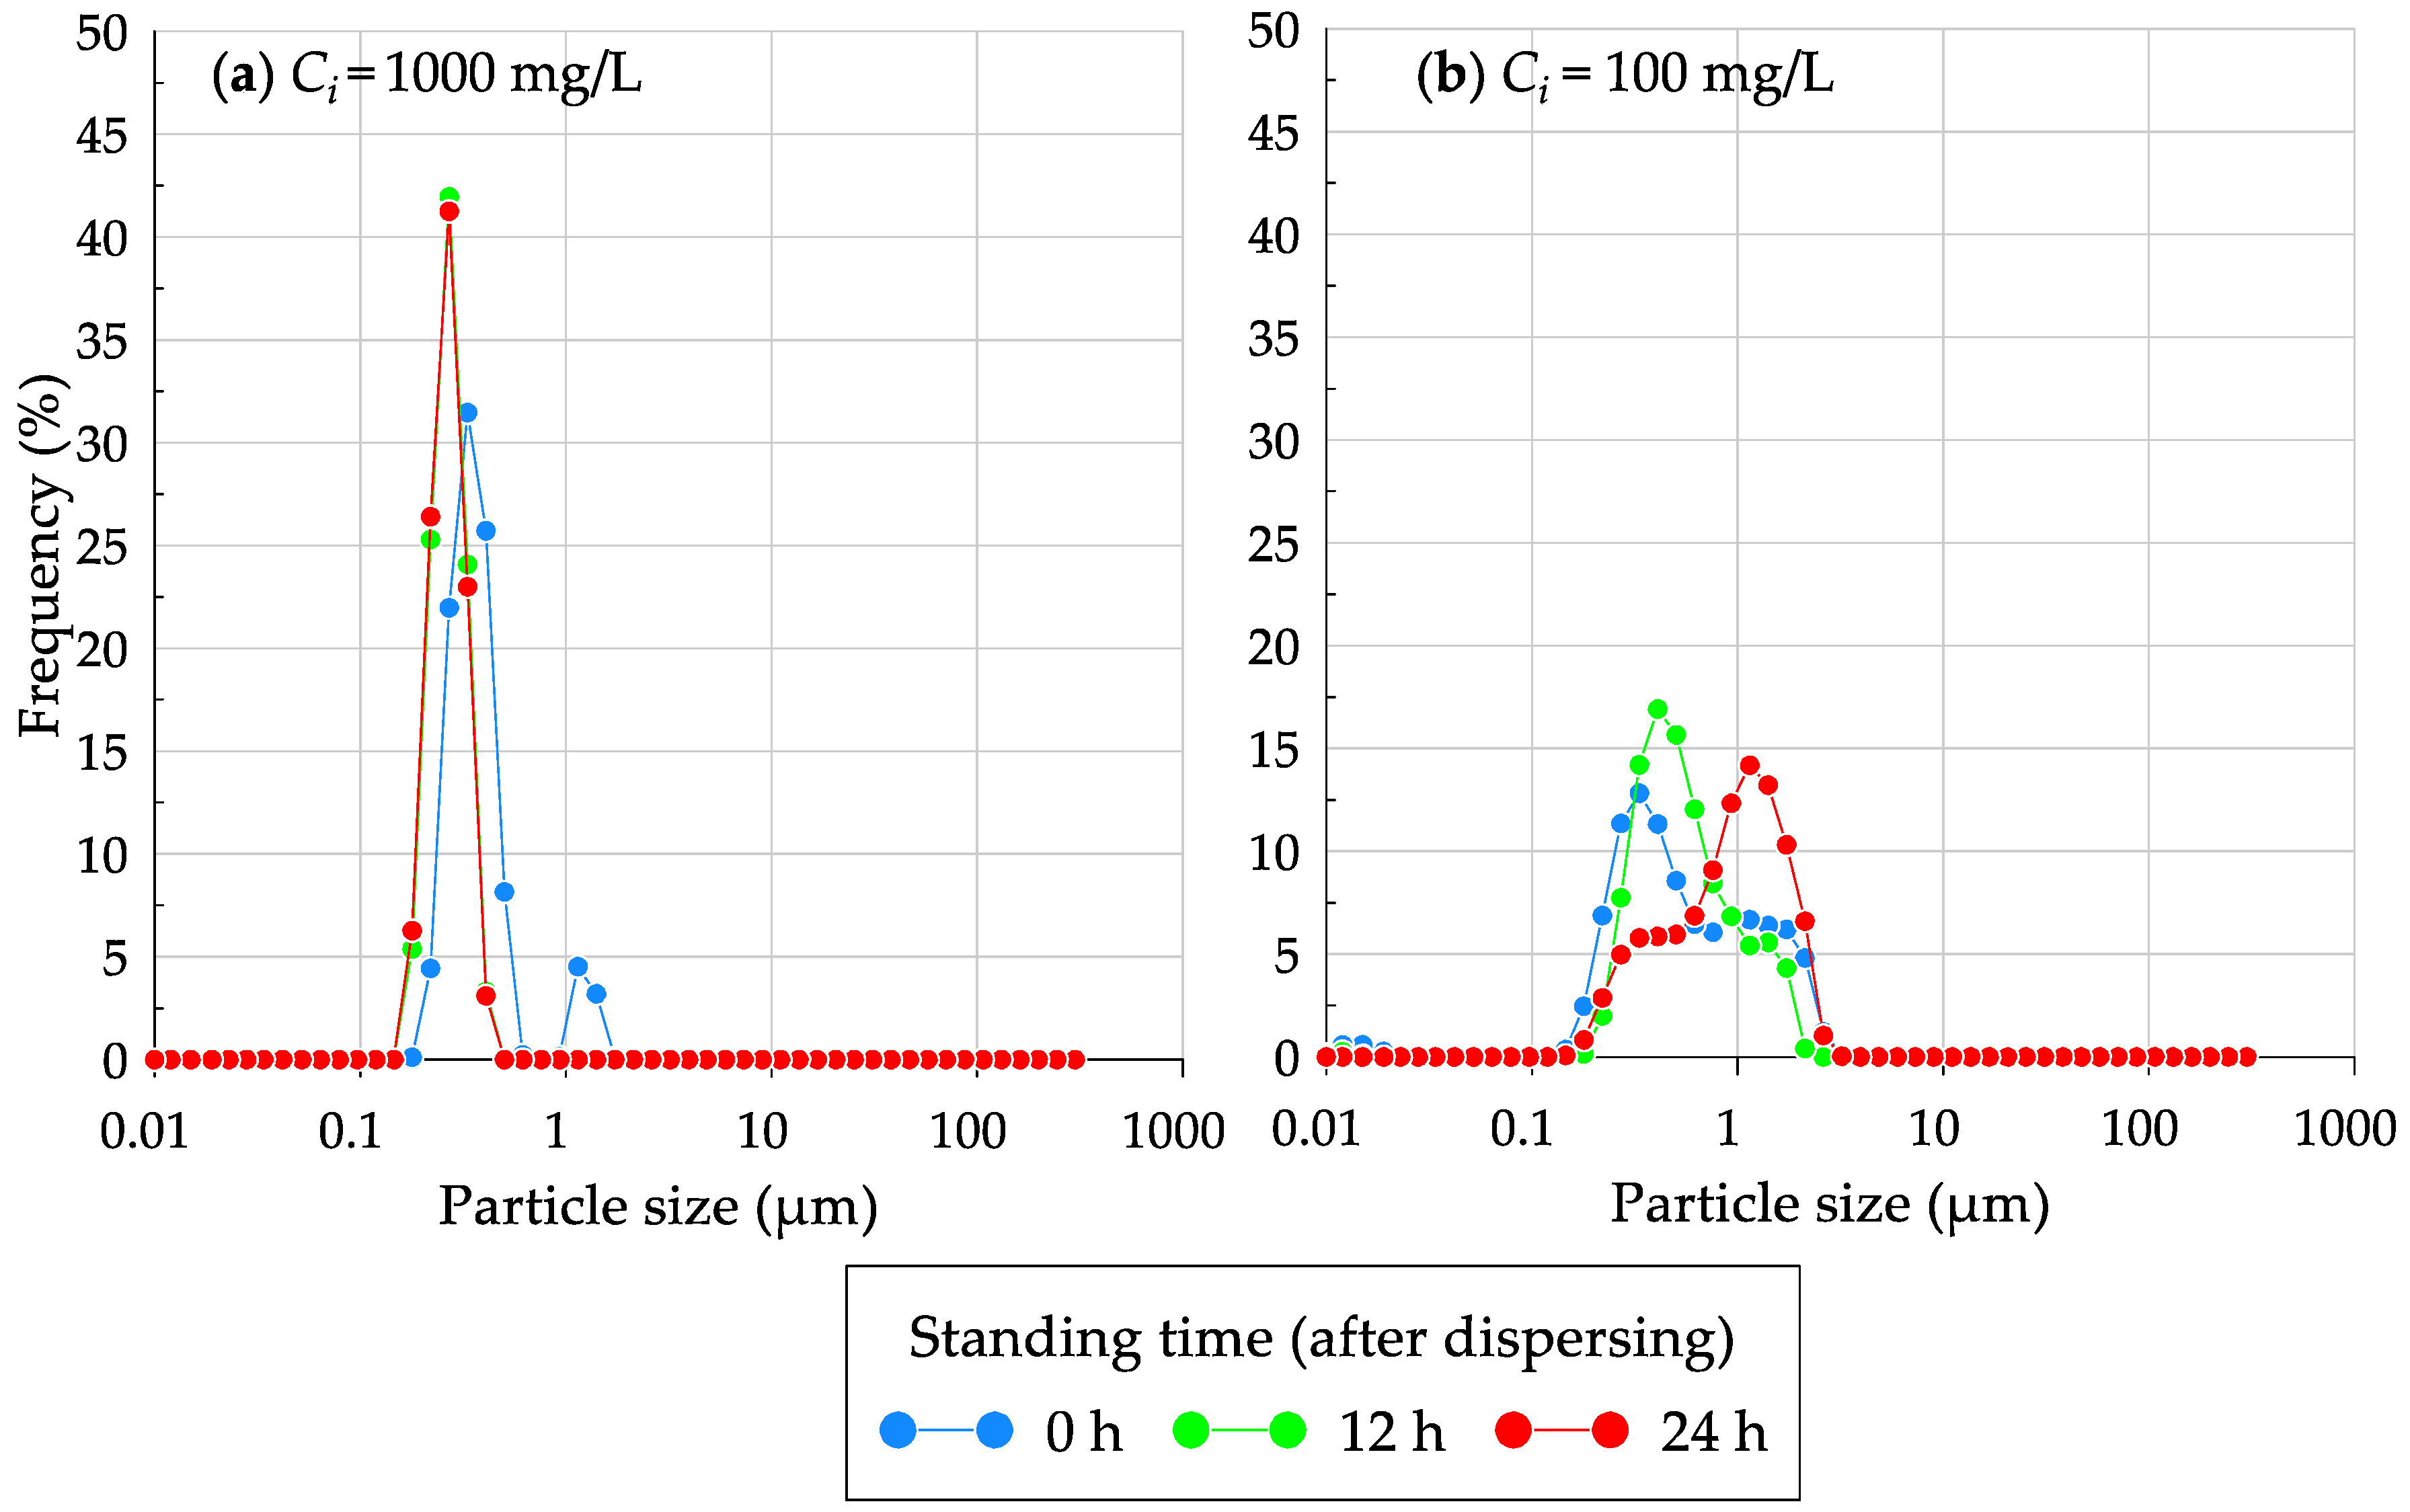
Figure 2 shows the particle size distributions of dispersed oil in water measured by a laser diffraction nanoparticle size distribution analyzer (SALD–7100, Shimadzu, Kyoto, Japan). For both Ci = 1000 mg/L and Ci = 100 mg/L, dispersed oil had stable particle sizes for 24 h. In addition, the most frequent particle size was about 0.1–1.0 μm.
2.4. Batch Sorption Test
Batch sorption tests were carried out following protocols of the OECD (2000) [58]. The horizontal shaking speed was modified from 100 rpm/min to 20 rpm/min in this study to avoid the peeling of the coated hydrophobic agents (the same as ASTM F726–99 [59]). The liquid–solid ratio (L/S) was set to 10, and the horizontal shaking times were set to 1, 3, 6, 12, 24, and 48 h at 20 °C. Before and after the batch test of tested samples are shown in Figure 1b.
2.5. Analysis
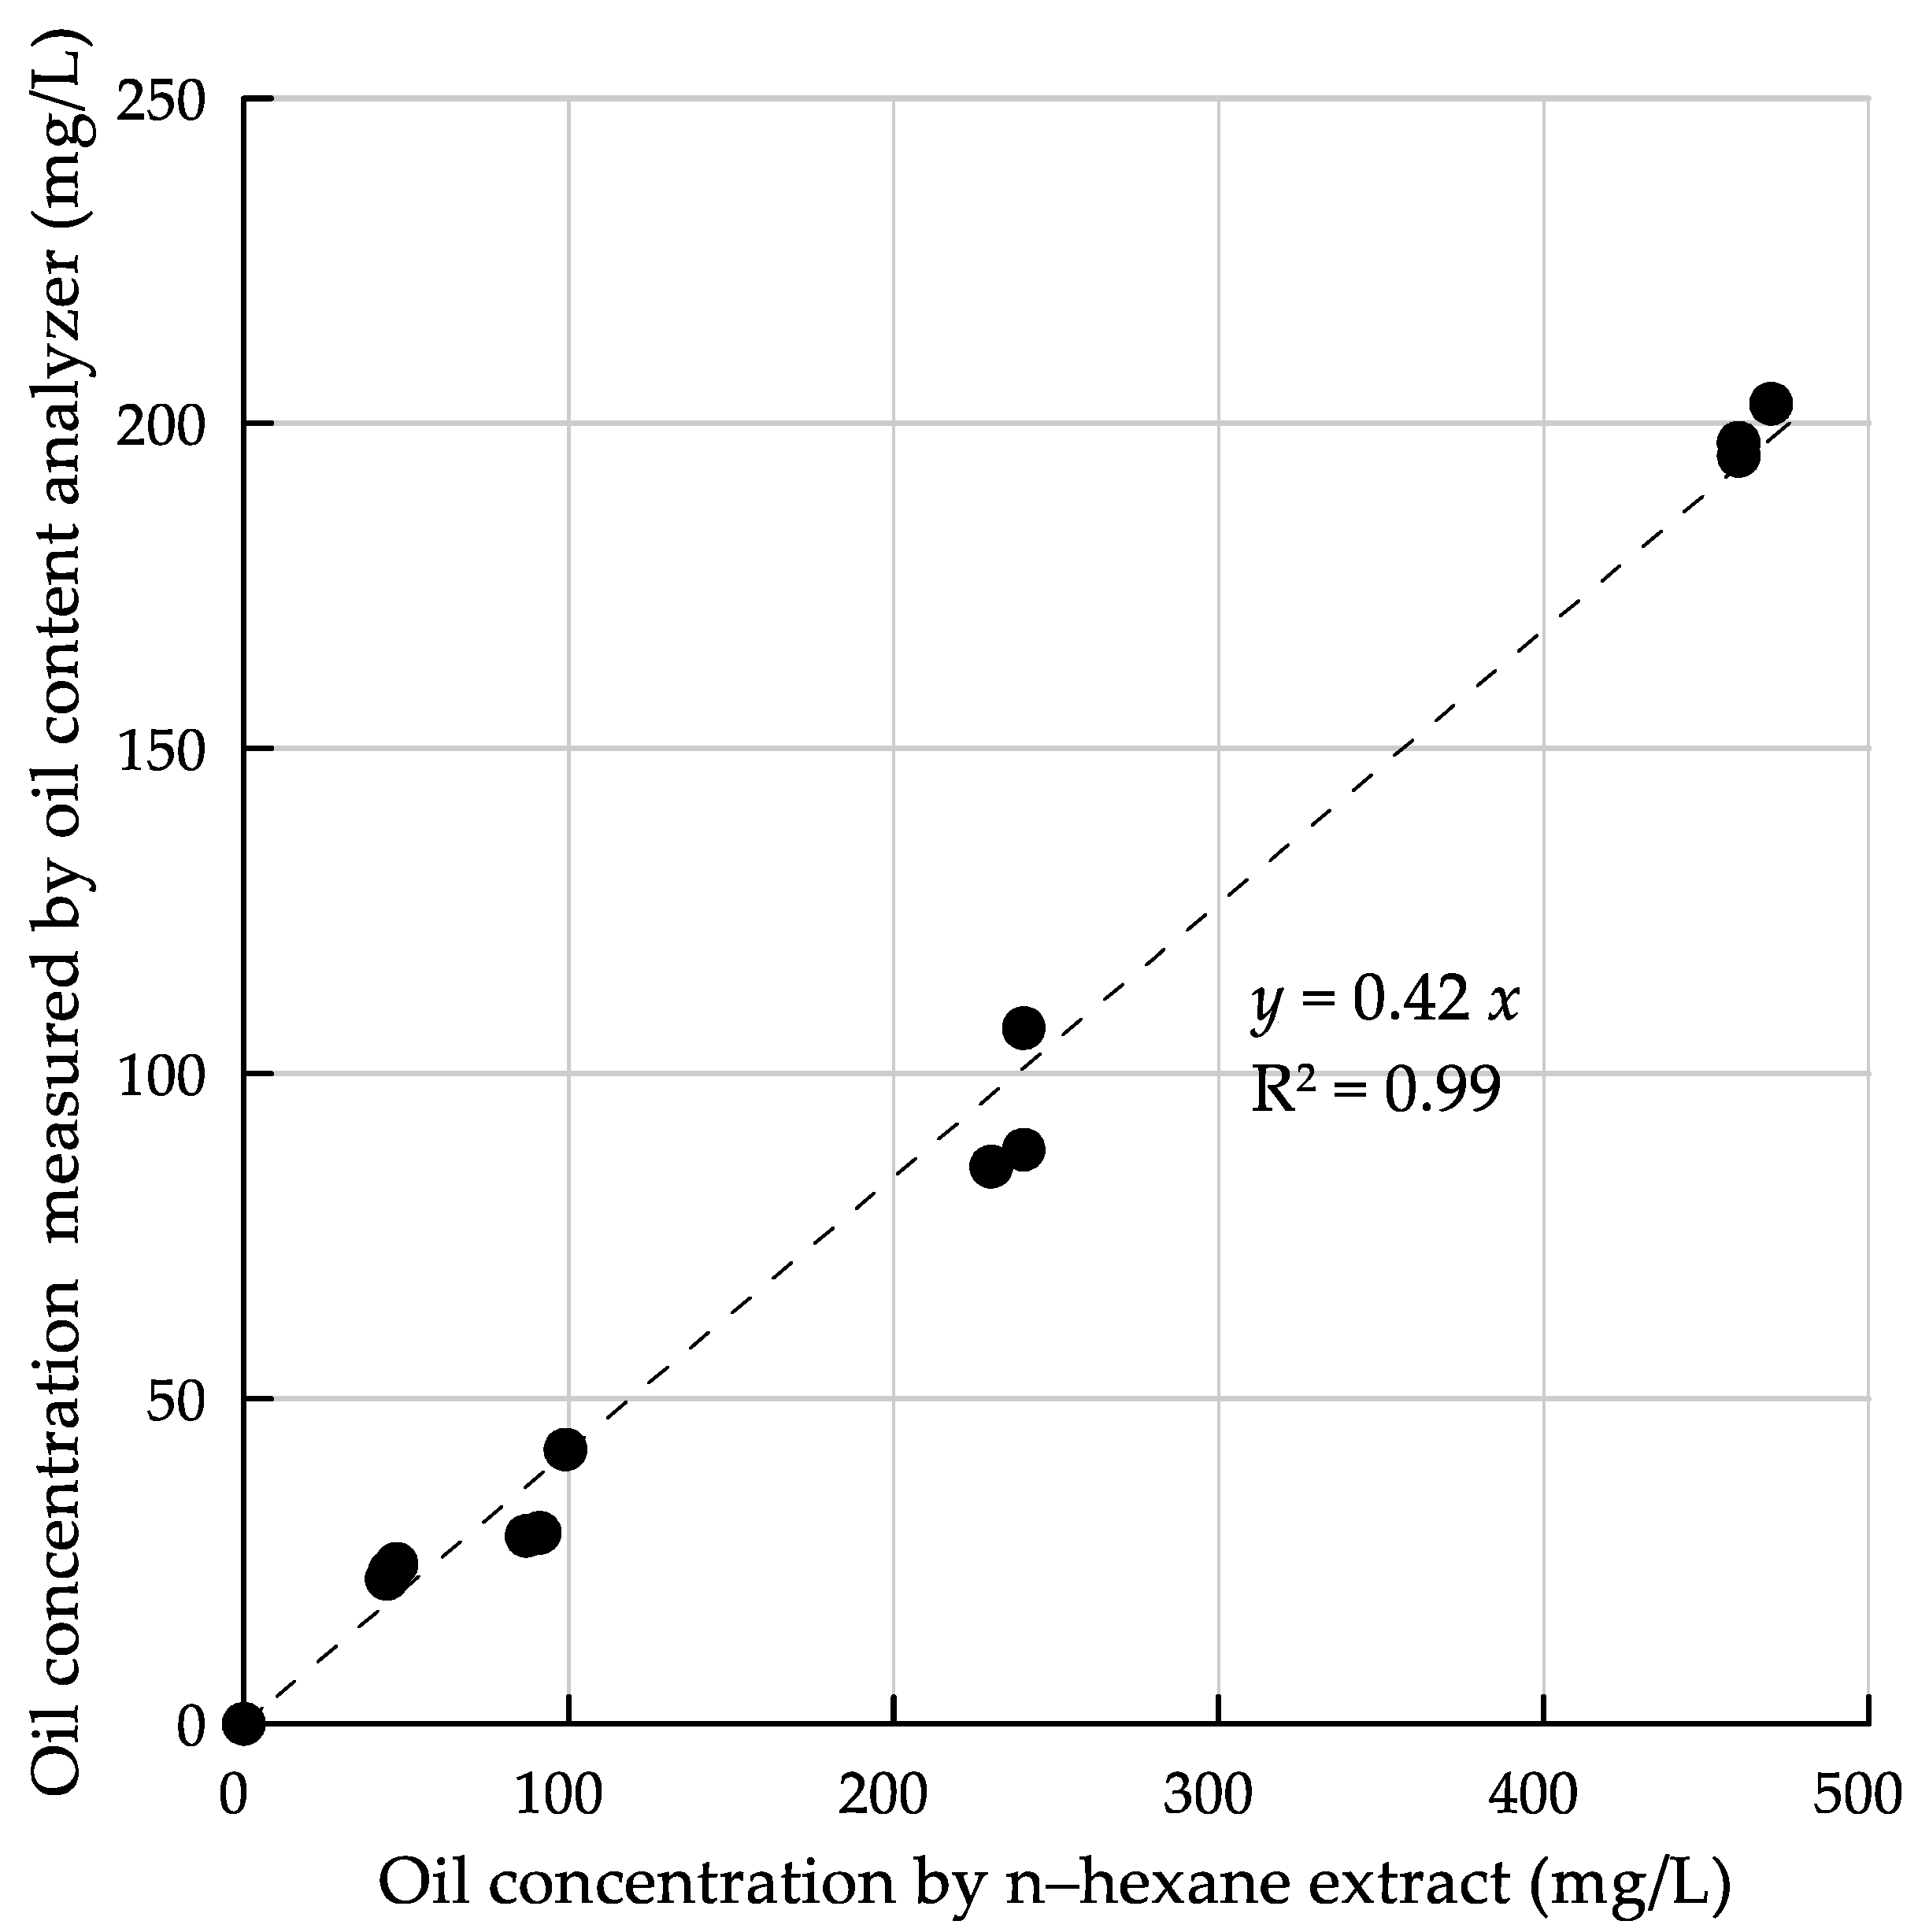
The oil concentration of the separated oil in water was measured by an oil content analyzer (OCMA–505–H, Horiba, Kyoto, Japan). Figure 3 compares the oil concentration of the n–hexane extract and the oil concentration measured by the oil content analyzer. A good linear relationship could be seen, so the actual value of the oil concentration was taken as the value obtained by multiplying the output value of the oil concentration meter by the linear regression equation in this study (y = 0.42x; R2 = 0.99).
Using this relationship, the equilibrium concentration Ce can be set for the measured oil concentration C from Equation (1) in the case of OA, SA = 0 g/kg:
Ce = C/0.42
In the case of OA, SA = 1, 2, 5, 10 g/kg:
where C0 is the oil concentration of Ci = 0 mg/L when OA and SA are 1, 2, 5, and 10 g/kg. Using the measured Ci and Ce, the removal percentage of dispersed oil in water (R, %) was calculated by Equation (3):
Ce = (C − C0)/0.42
R = 100 × (Ci − Ce)/Ci
The oil sorption amount at equilibrium (mg/g) was obtained in Equation (4):
where V is the sorbate volume (=100 mL of dispersed oil in water), and ms is the sorbent amount (=10 g of AAC grains or sand).
qe = (Ci − Ce)V/1000 × ms
3. Results and Discussions
3.1. Effects of Shaking Time on Removal of Dispersed Oil in Water
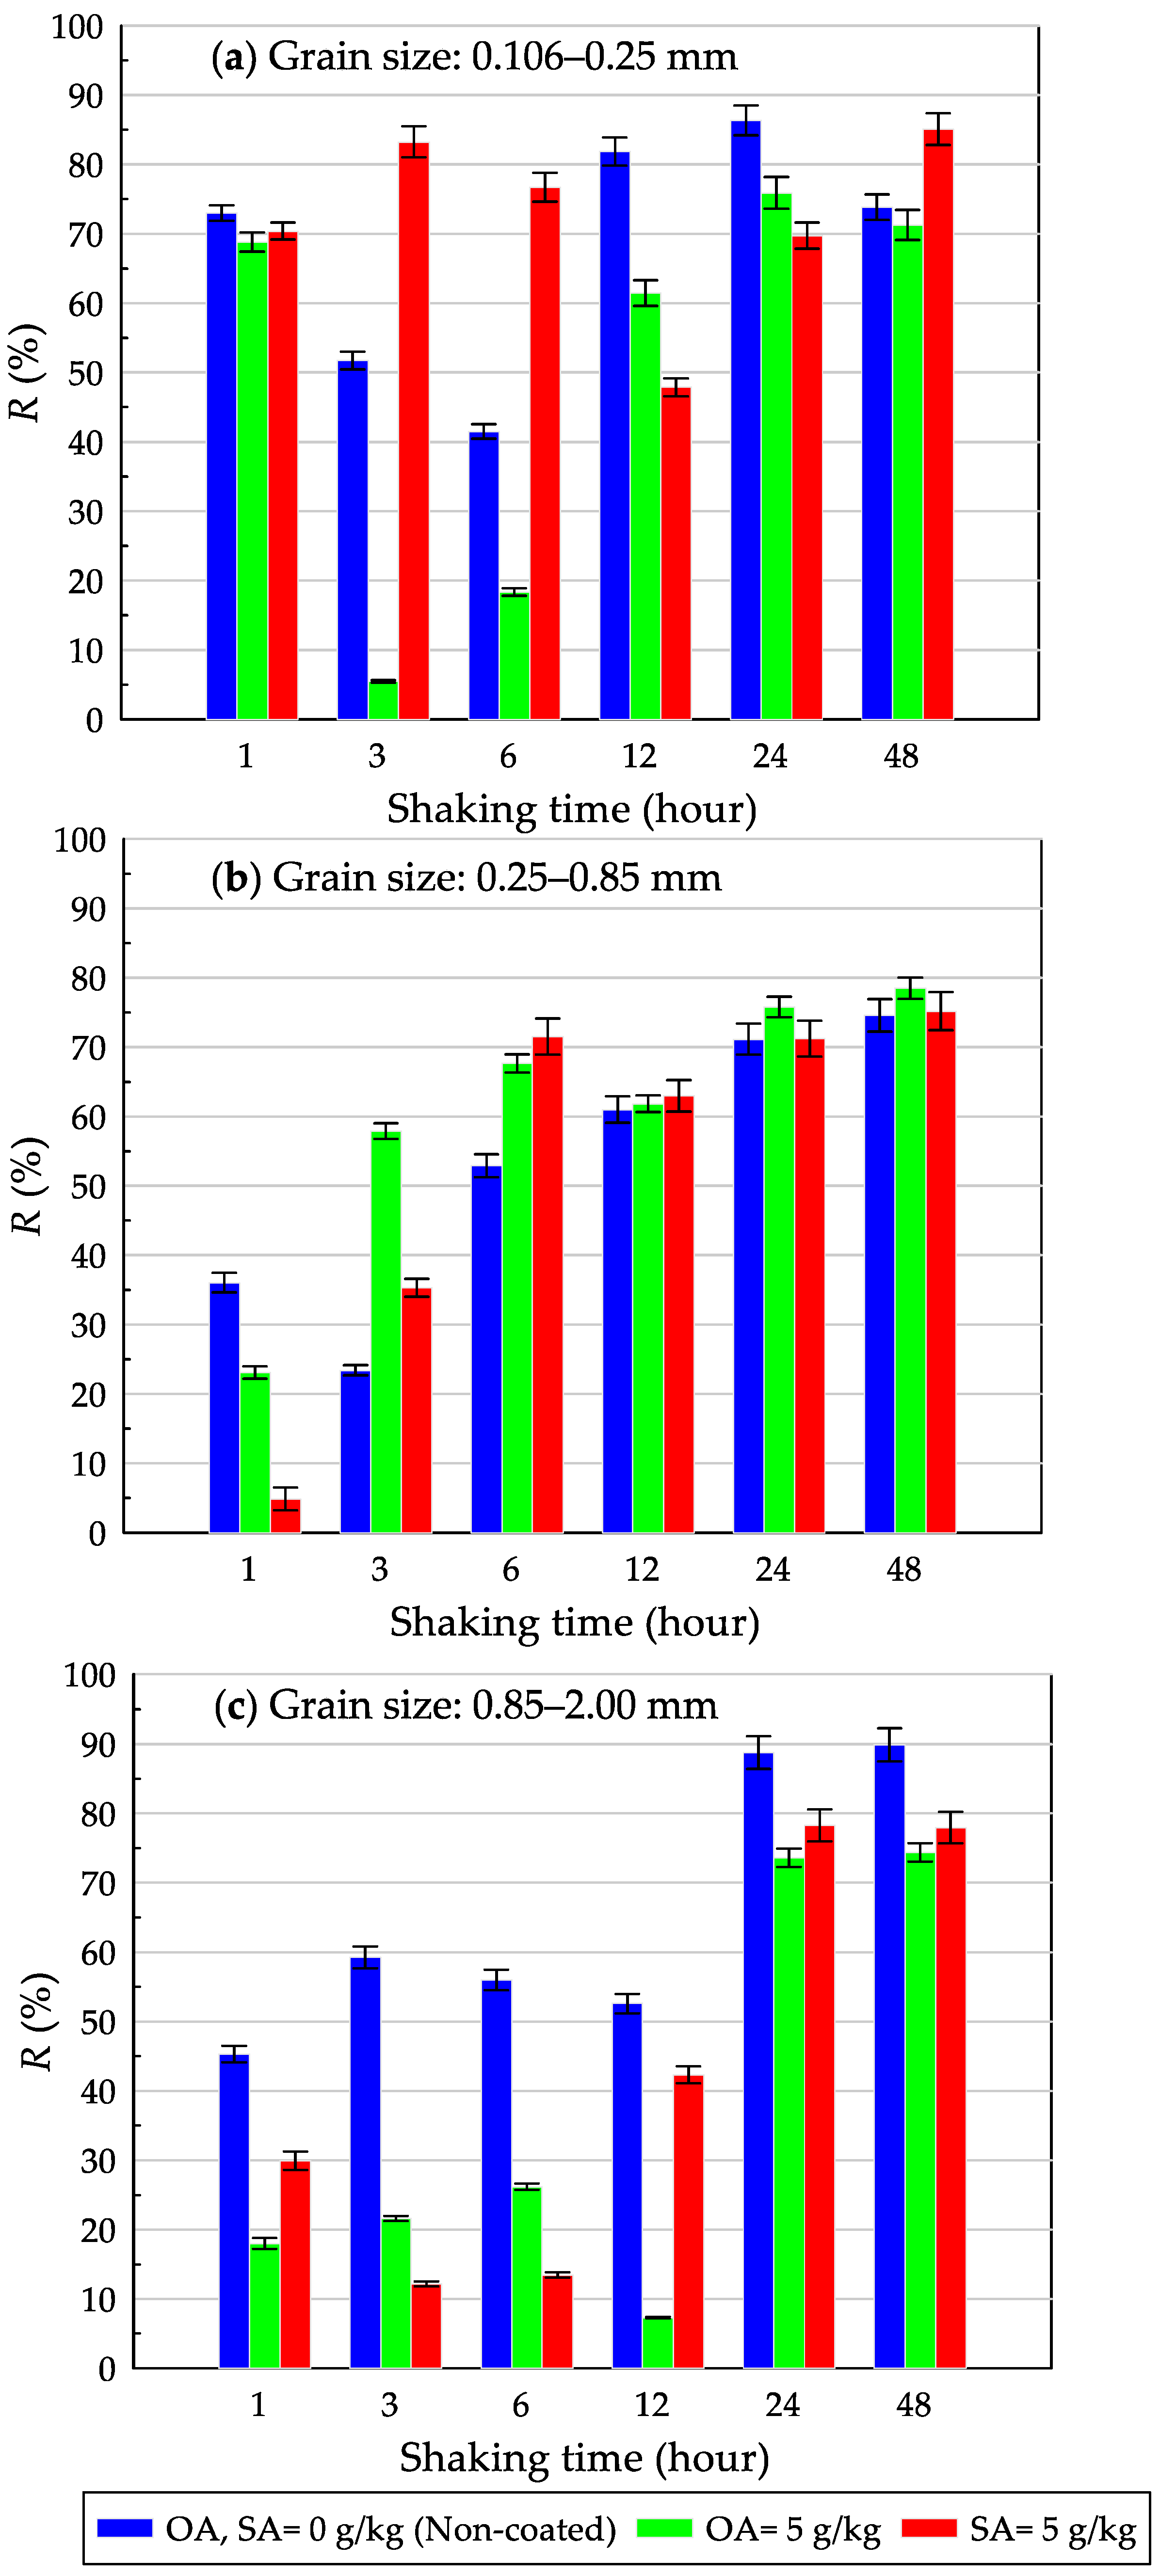
Figure 4 shows the effect of shaking time on the removal of dispersed oil, R (%), for tested AAC grains with different sizes at Ci = 1000 mg/L. Although some variations in measured R values for all tested samples (non–coated, OA–, and SA–coated) were observed, the R values mostly increased with increased shaking time and became stable at 24 h of shaking. This suggests that the sorption process of dispersed oil onto AAC grains (especially 0.250–0.850 and 0.850–2.00 mm in Figure 4b,c) depends on the contact time to some extent and that 24 h of shaking time would be suitable to examine the sorption capacity of tested AAC grains.
3.2. Effect of Initial Dispersed Oil Concentration on Removal Percent of Dispersed Oil
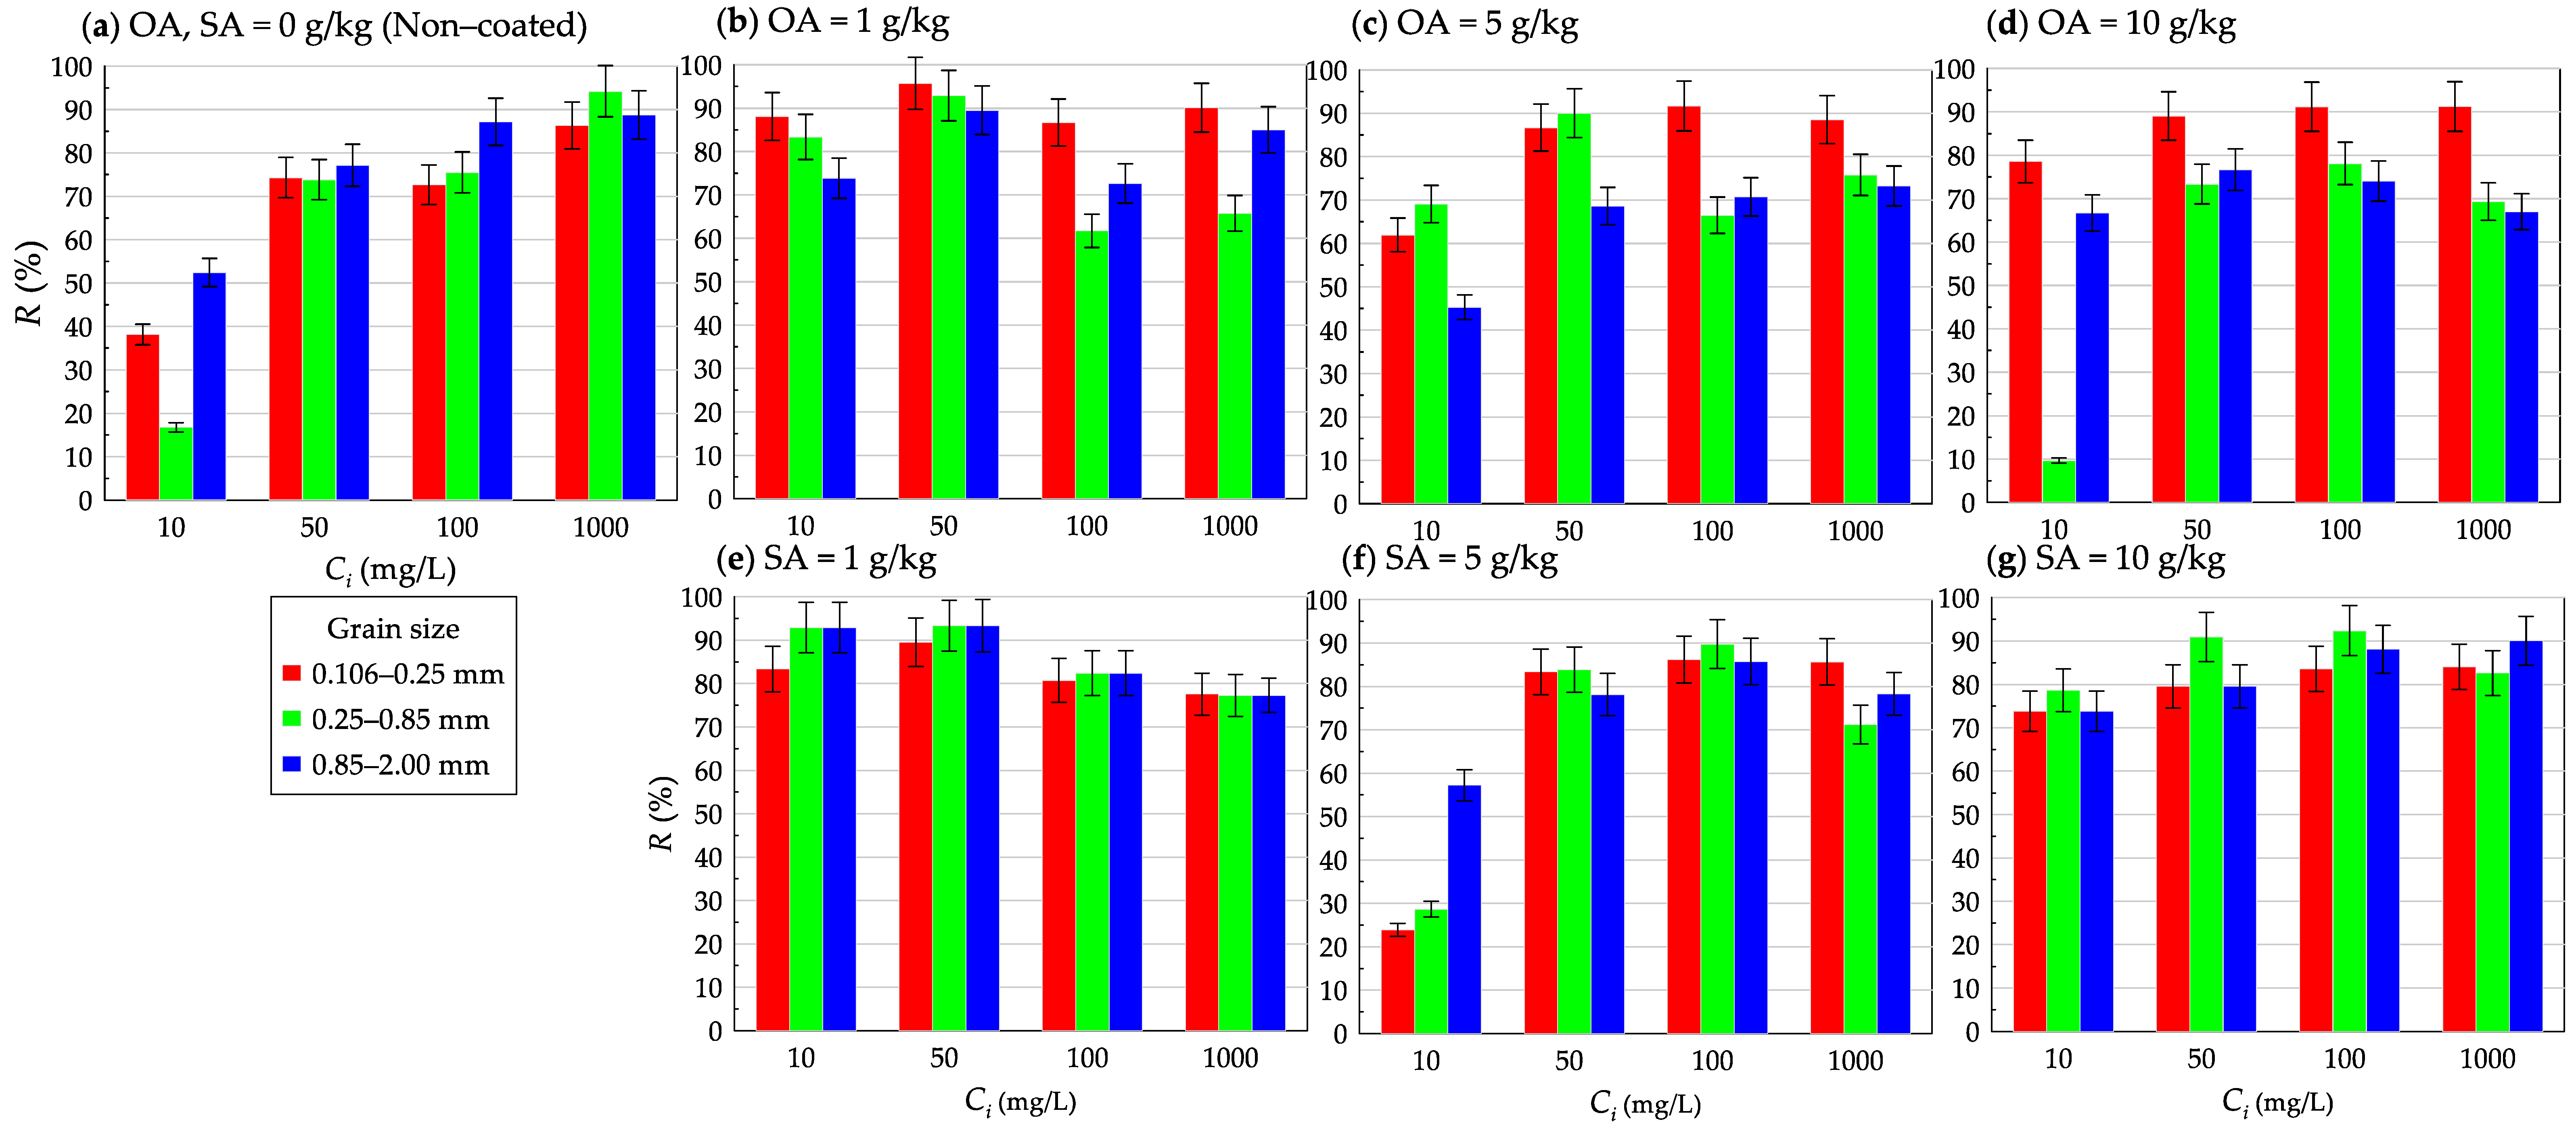
Measured R values for all tested AAC grains with different coating percent (OA/SA = 0 (non–coated), 1, 5, and 10%) at Ci = 10, 50, 100, and 1000 mg/kg are shown in Figure 5. Overall, the grain size of AAC did not affect the measured R values for tested uncoated, OA–coated, and SA–coated samples in this study. For low Ci solutions such as 10 and 50 mg/L, AAC grains coated with OA = 1 g/kg (Figure 5b) and SA = 1 g/kg (Figure 5e) removed dispersed oil well, and measured R values became >80% irrespective of grain size. For high Ci solutions such as 100 and 1000 mg/L, on the other hand, high SA–coated AAC grains (10 g/kg in Figure 5g) gave high R values of >80%. It is interesting that non–coated AAC grains also removed the high-concentration dispersed oil solution (Ci = 1000 mg/L) well, and the R values became > 80% (Figure 5a).
Based on the measured R values in this study, the coating of hydrophobic/oleophilic agents yields both positive and negative effects on AAC grains (adsorbents) from the viewpoint of removal of dispersed oil in water. As shown by Matsuno and Kawamoto, the coating of AAC grains with hydrophobic/oleophilic agents reduces the specific surface area of AAC grains and affects the hydrophobicity/oleophilicity of AAC grain surface in water [56]. Moreover, the affinity between dispersed oil and the hydrophobized/oleophilized AAC grain surface depended on the initial dispersed oil concentration, resulting in suitable coating conditions that gave high R values. This strongly suggests that suitable coating should be examined against the concentration of the target oily wastewater.
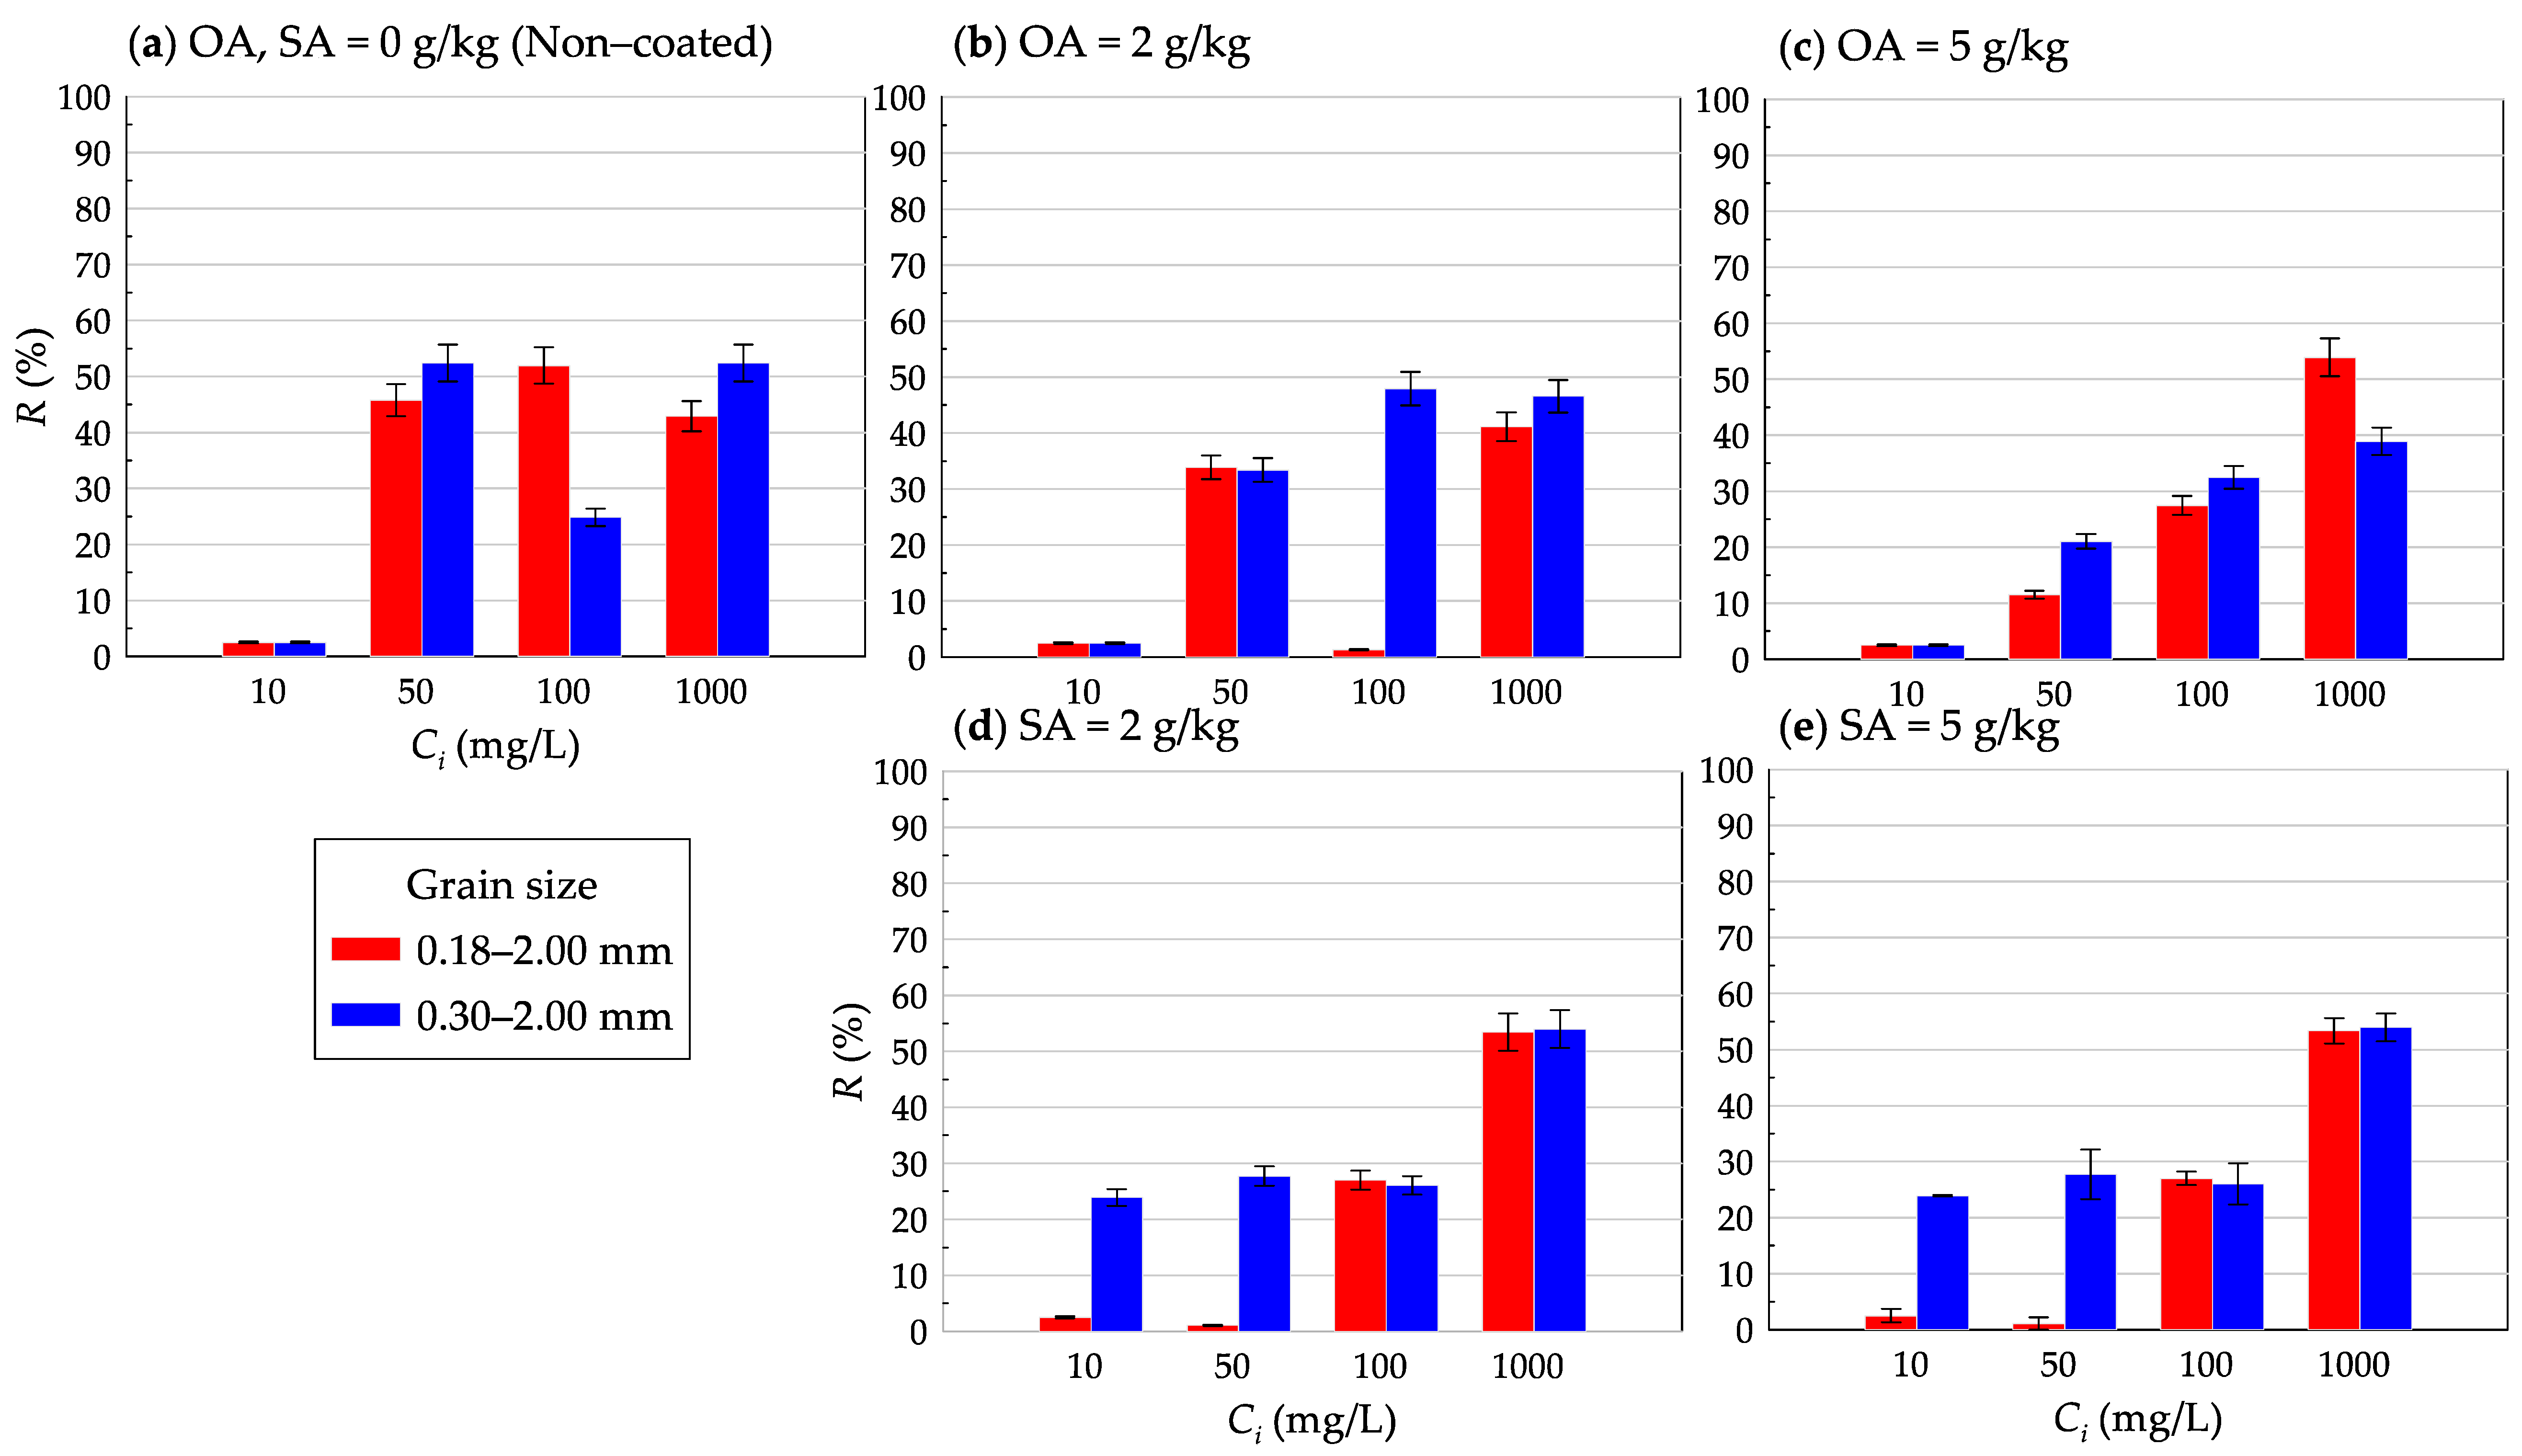
Figure 6, for reference, shows the measured R values of control sands with different sizes at Ci = 10, 50, 100, and 1000 mg/L. The measured R values were lower than those from AAC grains (Figure 5) in the whole range of Ci. Especially, the coating of hydrophobic/oleophilic agents for sands did not contribute to the removal of dispersed oil at the low concentration of Ci = 10 mg/L (i.e., R values became <5%).
3.3. Application of Adsorption Isotherm Models to Characterize the Dispersed Oil Sorption onto AAC Grains
In order to understand the sorption properties of dispersed oil in water onto AAC grains, adsorption isotherm models, the Langmuir model [60], the Freundlich model [61], and a simple linear model commonly used to characterize the adsorption process and mechanism of dissolved ions and metals onto adsorbents were applied. The Langmuir model described the relationship between Ce and qe:
where qmax (mg/g) is the maximum adsorption capacity, and b (L/mg) is the Langmuir constant related to binding strength. The Freundlich model is described as follows:
where KF (mg/g) is the Freundlich constant and 1/n is the adsorption intensity factor or surface heterogeneity. A simple linear adsorption model is described:
where Kd is the linear adsorption coefficient (L/mg).
Ce/qe = 1/(bqmax) + Ce/qmax
qe = KFCe1/n
qe = KdCe
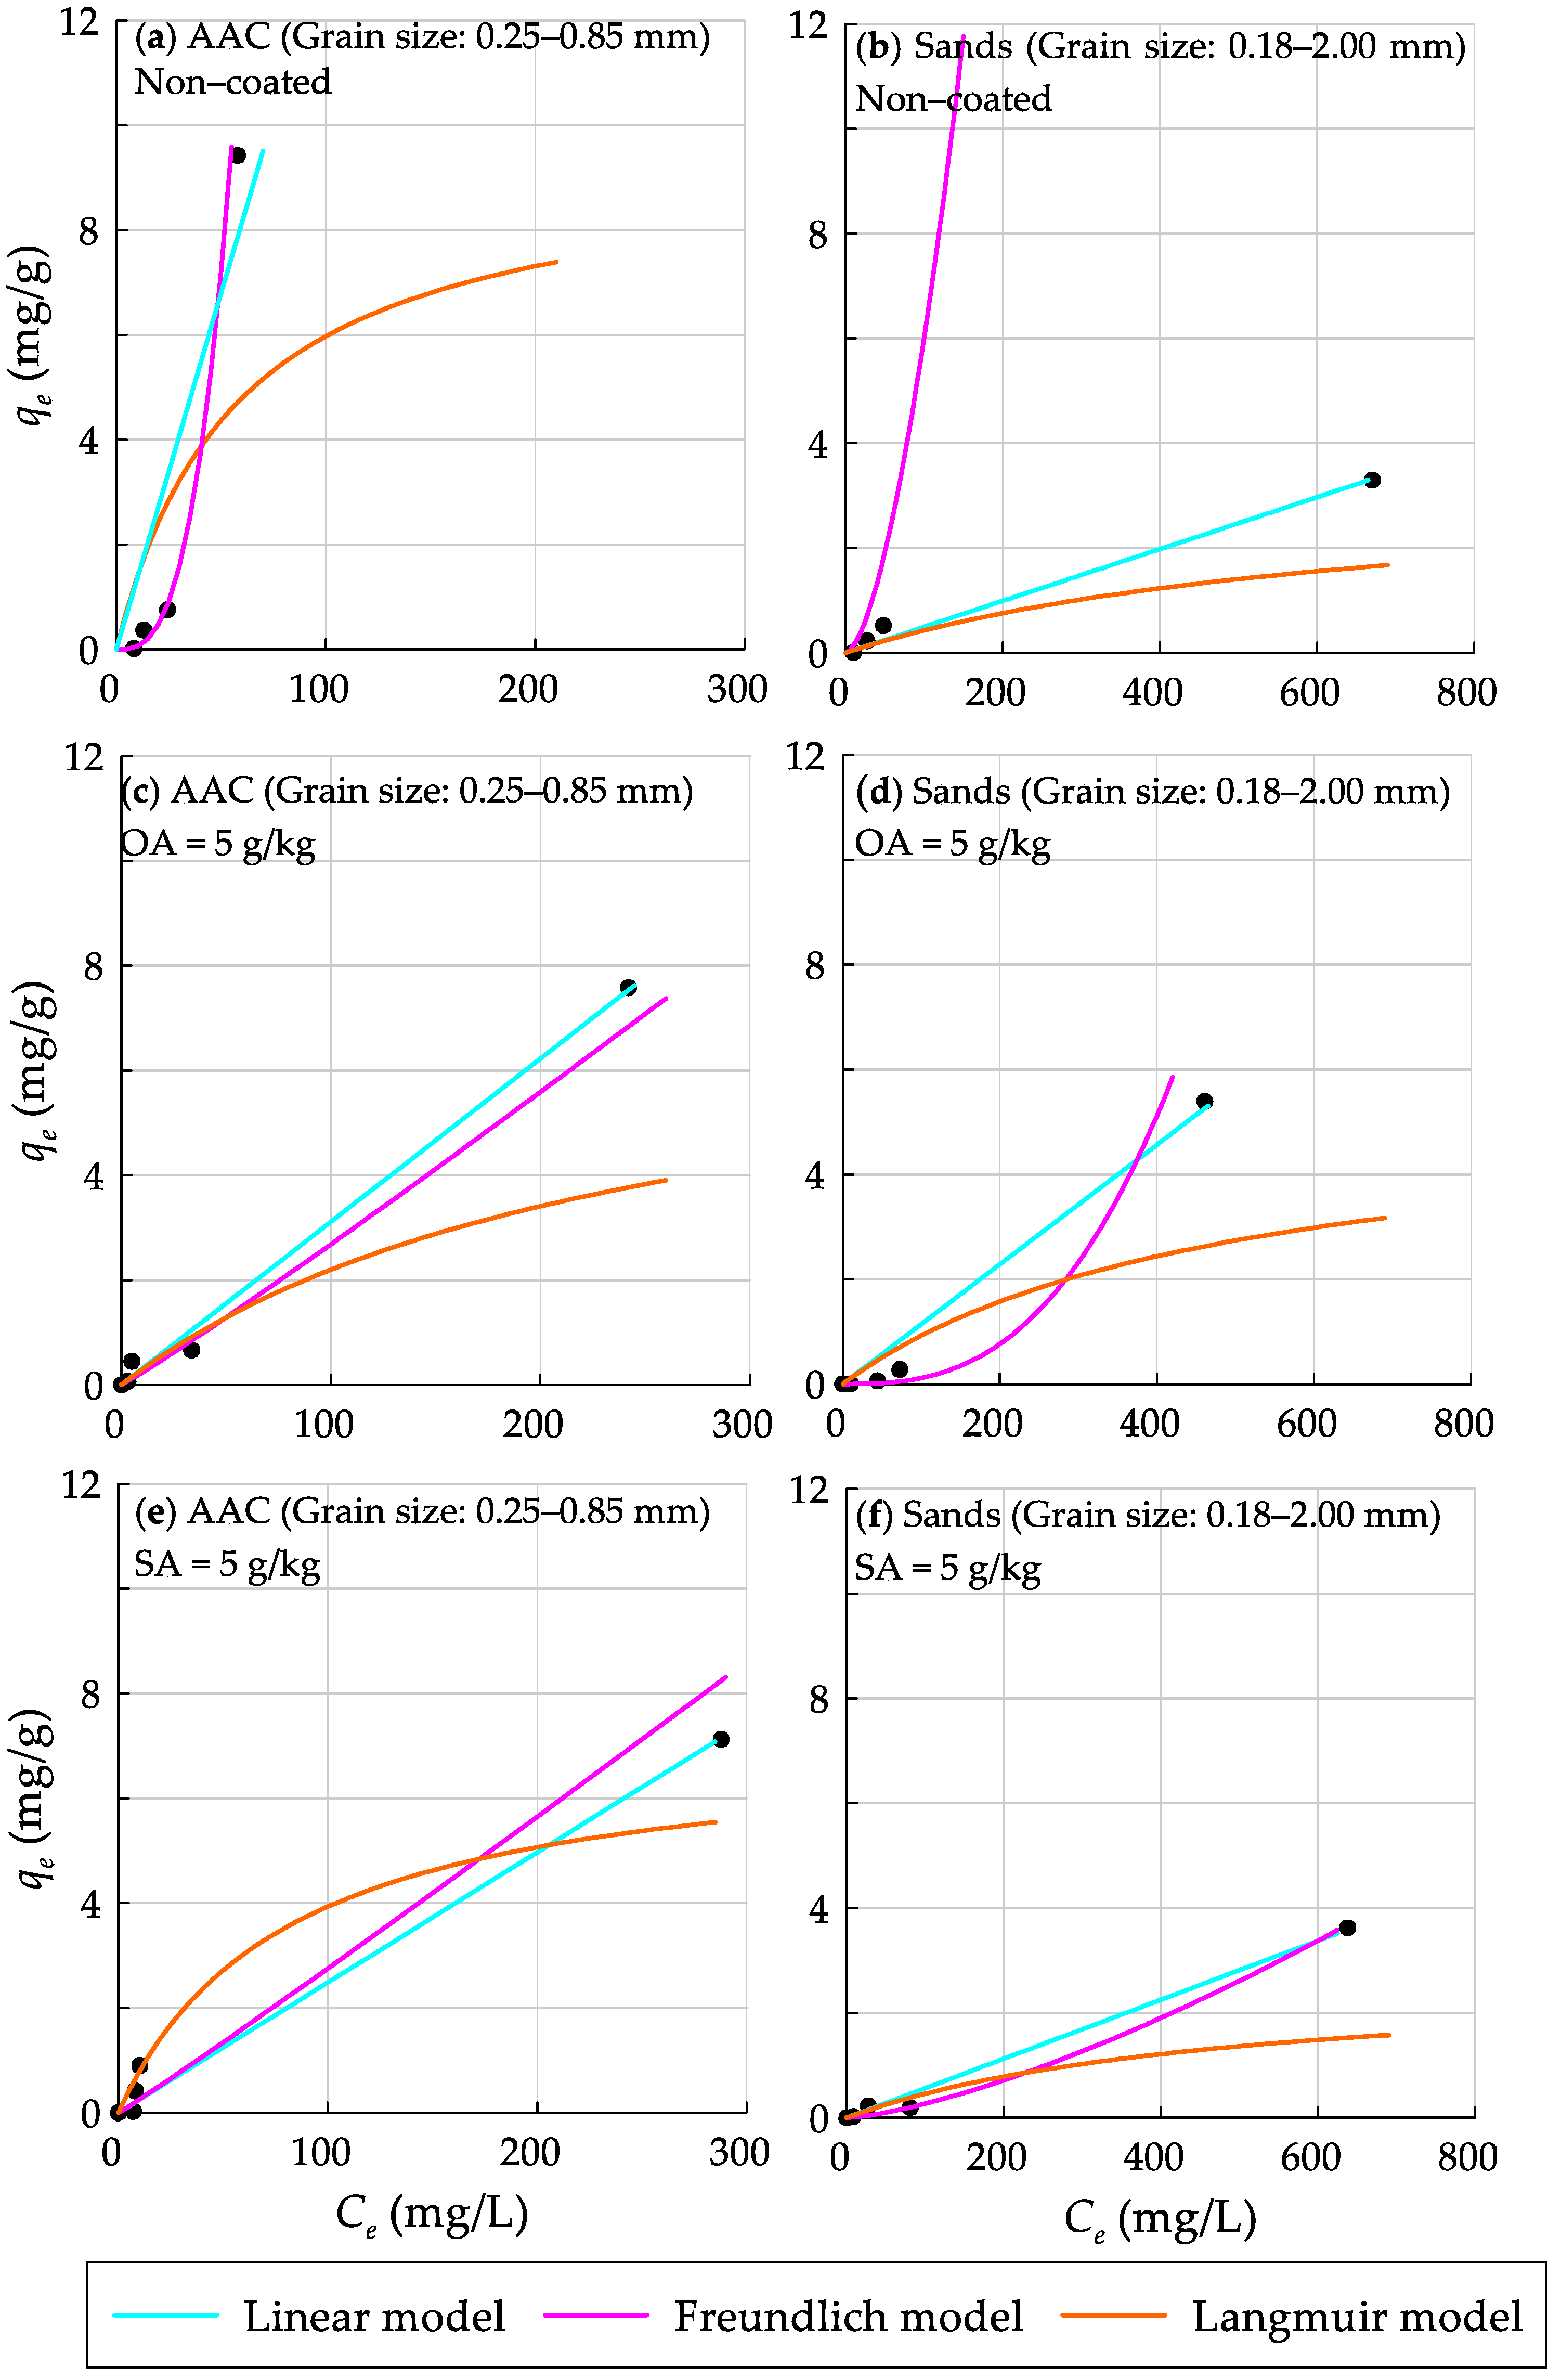
The fitted parameters for adsorption isotherms models are summarized in Table 1, and the measured relationship between Ce and qe for non–coated AAC grains, non–coated Sands, AAC grains coated at OA/SA = 5 g/kg, and Sands coated at OA/SA = 5 g/kg are exemplified in Figure 7.
It can be seen that the Langmuir model did not capture the measured relationship between Ce, qe, and qmax values were given (shown in Figure 7), indicating that the sorption of dispersed oil onto AAC grains did not follow the basic adsorption concept of dissolved ions (i.e., a saturation of adsorption site) and surface chemical reactions (e.g., formation of surface complexation). Both the Freundlich and linear models, on the other hand, captured the Ce and qe relationships well. However, the Freundlich model did not capture the measured relationships of SA–coated AAC grains with 5 g/kg in this study (e.g., Figure 7e). Thus, the simple linear model performed the best among the models (R2 values became mostly 0.99), and the fitted Kd values became a good indicator to characterize the sorption ability of dispersed oil in water onto both non-coated and coated AAC grains with hydrophobic/oleophilic agents. In addition, it is interesting that non–coated AAC grains 0.25–0.85 mm gave the highest value of 0.136 among fitted Kd values (Table 1). This may support choosing a suitable grain size for treating oily wastewater because we did not observe a clear difference in measured R values among three grain size samples (Figure 5). For reference, the measured relationship between qe to Ce for sands is shown in Figure 7b,d,f. It can be seen that only the linear model captured the relationships well.
Some previous studies examined the applicability of oil sorption onto adsorbents based on adsorption isotherm models (Langmuir and Freundlich) and reported the adsorption parameters [34,62,63] that are given in Table 1. Those studies showed good applicability of Langmuir and Freundlich models and determined the parameters such as qmax and KF. In this study, on the other hand, those models that assume monolayer and/or multilayer adsorption of dissolved ions onto the surface of the adsorbent were not applicable to measured data. This strongly implies the adsorption mechanisms of dispersed oil onto porous AAC grains were more complicated, probably due to the accessibility of dispersed oil (<2 μm) to micro-scale pores of AAC grains and the affinity of dispersed oil to cementitious AAC grain surface. Moreover, the inapplicability of adsorption isotherm models (Langmuir and Freundlich models in this study might be attributed to the emulsification of dispersed oil in water, and the oil emulsion made the adsorption mechanisms more complicated.
4. Conclusions
The study examined the applicability of hydrophobized/oleophilized AAC grains to treat dispersed oil in water. Based on the tested results from batch experiments, low-coated AAC grains with OA and SA (1 g/kg) removed from dispersed oil well (approximately R > 80%) for low oil concentration solutions, and high SA-coated AAC grains (10 g/kg) gave high removal efficiency (approximately R > 80%) for high oil concentration solutions. Typical adsorption isotherm models for dissolved ions, such as Langmuir, Freundlich, and a linear model, were adapted to measured data. It was observed that the sorbed dispersed oil increased linearly with increasing equilibrium concentration for all tested samples, while the Langmuir and Freundlich models did not capture the measured isotherms. This implies that the sorption mechanism of dispersed oil onto porous AAC grains was supposed to be complicated due to the accessibility and affinity of dispersed oil (<2 μm) to micropores of cementitious AAC grain surface.
Author Contributions
Conceptualization, A.M. and K.K.; data curation, A.M. and K.K.; formal analysis, A.M. and K.K.; funding acquisition, K.K.; investigation, A.M. and K.K.; methodology, A.M. and K.K.; project administration, K.K.; resources, A.M. and K.K.; software, A.M. and K.K.; supervision, K.K.; validation, K.K.; visualization, A.M. and K.K.; writing—original draft, A.M.; writing—review and editing, A.M. and K.K. All authors have read and agreed to the published version of the manuscript.
Funding
This research was supported by the project of the Japan Science and Technology Agency (JST), Japan International Cooperation Agency (JICA) on Science and Technology Research Partnership for Sustainable Development (SATREPS) (no. JPMJSA1701).
Institutional Review Board Statement
Not applicable.
Informed Consent Statement
Not applicable.
Data Availability Statement
The data presented in this study are available on request from the corresponding author.
Acknowledgments
We thank the members of Hanoi University of Civil Engineering and former students at Saitama University for their support of the sample preparation in Vietnam and laboratory work.
Conflicts of Interest
The authors declare no conflict of interest.
Abbreviations
The following abbreviations are used in this manuscript:
| AAC | Autoclaved aerated concrete |
| Ce | Equilibrium concentration of dispersed oil in water |
| Ci | Initial concentration of dispersed oil in water |
| HA | Hydrophobic agents |
| OA | Oleic acid |
| qe | Oil sorption amount at equilibrium (mg/g) |
| R | Removal percentage (%) of dispersed oil in water |
| SA | Stearic acid |
Appendix A
Table A1 summarizes National standards of emission limits for oil and grease, and Table A2 shows some reported values of oil and grease concentrations in water and wastewater in Vietnam. Among surface waters, the Ha Thanh River has a very high measured value of 250 mg/L. The source of pollution in this area is not shown. For coastal water, the maximum was 1.3 mg/L, and all values were below 1.0 mg/L. Some domestic wastewater showed high values of up to 140 mg/L. Regarding industrial wastewater, the landfill leachate showed a very high value of 3.79 × 10⁴ mg/L, causing environmental problems [64,65,66,67,68,69,70,71,72].
Table A3 shows reported values of oil pollution loads and oil spills in Vietnam. Oil leaks from crude oil exploitation. A total of 9.2 × 10⁴ tons is estimated to flow into the coastal and marine environment. This is the high environmental impact of the oil spill, with oil pollution loads approaching 7.72 × 10⁵ tons/year, which significantly impacts the environment and the economy. Total financial losses caused by a significant oil spill in 2001 were estimated at 250 billion VND (17 million USD), while costs for cleaning up polluted waters and beaches reached 60 billion VND (4 million USD). The oil pollution load of the river has a value of 3.45 × 10⁴ kg/day in the southern Ho Chi Minh City area. The northern Cau River basin and Cau Bay basin had values of 66 tons/day and 6.34 kg/day. This is less than that in the southern part of the country. The source of these contaminants appears to be domestic wastewater [4,64,65,73,74,75].
Table A4 shows various information on wastewater in Vietnam, such as BOD and COD [24,64,72,73,76,77,78]. Since no concentration and river flow data were available for BOD and COD, it is difficult to say for sure, but it can be said that they are causing significant pollution loads. Concentrations of BOD and COD after sewage treatment were also measured at the sewage treatment plant in Hanoi in this study, with BOD = 4.0 mg/L and COD = 8.0 mg/L. When n-hexane extract (mineral oils) and the concentration of n-hexane extract (animal and vegetable oils) were also measured, no oil concentration was detected. Further, according to Do Nam Thang, the percentage of the waste is higher in domestic wastewater than in industrial wastewater [77], and it can be said that there are issues with their treatment.

Table A1.
National technical regulations of oil and grease concentrations in Vietnam.
| Act Name | Parameter | Environmental Standards (mg/L) | Analysis Method | |||
|---|---|---|---|---|---|---|
| Environmental standards: Surface water, groundwater, seawater, and others | ||||||
| QCVN 08–MT:2015/BTNMT [7] | Total oil and grease | Domestic use | Irrigation | TCVN 7875: 2008 5 [8] SMEWW 5520B: 2012 [9] | ||
| A1 1 | A2 1 | B1 1 | B2 1 | |||
| 0.3 | 0.5 | 1.0 | 1.0 | |||
| QCVN 10–MT:2015/BTNMT [10] | Total mineral oil and grease | Area of aquaculture and conservation | Beach and water sport area | Other areas | TCVN 7875: 2008 5 [8] SMEWW 5520B: 2012 [9] SMEWW 5520C: 2012 [11] | |
| 0.5 | 0.5 | 0.5 | ||||
| QCVN 38:2011/BTNMT [12] | Total mineral oil and grease | 0.05 | ||||
| Emission limits: Domestic and industrial wastewater | ||||||
| QCVN 14:2008/BTNMT [13] | Animal and vegetable oil and grease | A 2 | B 2 | EPA Method 1664: 2010 [14] | ||
| 10 | 20 | |||||
| QCVN 40:2011/BTNMT [15] | Total mineral oil and grease | A 2 | B 2 | TCVN 7875: 2008 5 [8] EPA Method 1664: 2010 [14] | ||
| 5 | 10 | |||||
| Emission limits: Specific wastewater from industries and service sectors | ||||||
| QCVN 14:2008/BTNMT [13] | Animal and vegetable oil and grease | A 3 | B 3 | EPA Method 1664: 2010 5 [14] | ||
| 10 | 20 | |||||
| QCVN 29:2010/BTNMT [16] | Mineral oil (Total hydrocarbon) | A 4 | B 4 | TCVN 7875: 2008 5 [8] | ||
| Warehouse | Car wash | Stations | ||||
| 5 | 15 | 18 | 30 | |||
| QCVN 52:2013/BTNMT [17] | Total mineral oil | A 3 | B 3 | TCVN 7875: 2008 5 [8] SMEWW 5520C: 2012 [11] | ||
| 5 | 10 | |||||
| QCVN 11–MT:2015/BTNMT [18] | Total animal and vegetable oil | A 3 | B 3 | TCVN 7875: 2008 5 [8] | ||
| 10 | 20 | SMEWW 5520C: 2012 [11] | ||||
1 A1: Good for domestic uses and other purposes (A2, B1, and B2); A2: Good for domestic uses with prior suitable treatment, protection of aquatic habitats, and other purposes (B1 and B2); B1: Good for irrigation and agricultural uses; B2: Others (water transport and low priority of water treatment). 2 A: Effluents reach water sources used for domestic purposes; B: Effluents reach water sources used for other purposes. 3 A: Effluents reach water sources used for drinking purposes; B: Effluents reach water sources used for other purposes. 4 A: Effluents reach water sources used for aquaculture and aquatic conservation; B: Effluents reach water sources used for other purposes. 5 Analysis methods with equivalent or higher accuracy than those of the listed standards can be accepted. N/D: Not detected.
Table A2.
Reported values of oil and grease content in water and wastewater in Vietnam.
| Location | Province/ Prefecture or City | Year | Oil and Grease (mg/L) | Remarks | Reference |
|---|---|---|---|---|---|
| Surface water | |||||
| Cau River | Thai Nguyen/Thai Nguyen | 2004, 2005 | 0.02–0.16 | 6 monitoring points | MONRE, WB and DANIDA (2006) [64] |
| Dong Nai River | Hoa An/Cao Bang | 2000–2006 | 0.025–0.029 | ||
| Saigon River | Binh Phuoc/Binh Duong, etc. | 2000–2006 | 0.025–0.12 | ||
| Saigon–Nha Be River | Thu Dau Mot/Binh Duong, etc. | N/D | 0.0–0.3 | 5 monitoring points | IGES (2007) [65] |
| Ha Thanh River | Quy Nhon/Binh Dinh | 2016 | 27–250 | Ha Thanh Bridge, Canal, Channel | Binh Dinh PPC (2016) [66] |
| Ditch | Quy Nhon/Binh Dinh | 2019 | 15 | An upstream ditch of Bau Sen Lake | Nguyen et al. (2020) [67] |
| Coastal water | |||||
| Red and Mekong River | 1996–2001 | >0.05–2.4 | MONRE (2003) [4] | ||
| Coastal zone (1) | Rach Gia/Kien Giang: | 1997–2015 | 0.12–0.79 | Rach Gia monitoring station | Le and Pham (2017) [68] |
| Coastal zone (2) | Nha Trang/Khanh Hoa | 2013–2017 | 0.35–0.55 | Nha Trang monitoring station | Pham (2018) [69] |
| Coastal zone (3) | Khanh Hoa/Trung binh, etc. | 2010–2018 | 0.007–0.65 | 4 monitoring stations | Pham (2019) [70] |
| Coastal zones | Hue/Thua Thien Hue, etc. | 2011–2015 | 0.012–1.3 | Total of 16 monitoring stations | MONRE (2015) [71] |
| Domestic wastewater | |||||
| In and Out of WWTP | Quy Nhon/Binh Dinh | 2016 | 0.8–160 | Nearby Dam, Nhon Binh, Bau Luc | Binh Dinh PPC (2016) [66] |
| In and Out of WTF | Hai Ba Trung/Hanoi | 2016 | 2.0–14.6 | WTF for condominium in Hanoi | JICA (2019) [72] |
| Industrial wastewater | |||||
| Landfill leachate | Tuy Phuoc/Binh Dinh | 2016 | 3.79 × 10⁴ | Long My waste landfill | Binh Dinh PPC (2016) [66] |
| Wastewater from construction site | Quy Nhon/Binh Dinh | 2016 | 200 | Cleaning and washing of equipment and materials at a bridge construction site | |
Table A3.
Reported values of oil pollution loads and oil spills in Vietnam.
| Location | Year | Type and Sources | Oil Pollution Loads/Oil Spills | Descriptions and Other Remarks | Reference |
|---|---|---|---|---|---|
| East sea | 1995–2002 | Oil spills | Approx. 7.72 × 10⁵ tons/year | Oil leaks from crude oil exploitation. A total of 9.2 × 10⁴ tons is estimated to flow into the coastal and marine environment. Total financial losses caused by a major oil spill in 2001 were estimated at 250 billion VND (17 million USD), while costs for cleaning up polluted waters and beaches reached 60 billion VND (4 million USD). | ADB (2006) [73]; MONRE, WB and DANIDA (2003) [4] |
| Dong Nai River basin | 2004 | Domestic wastewater: HCMC 5 provinces | 3.45 × 10⁴ kg/day 90–4.1 × 10³ kg/day | MONRE, WB and DANIDA (2006) [64] | |
| Cau River basin | 2005 | Domestic wastewater from 6 provinces | 66 tons/day | ||
| Cau Bay River basin | 2013 | 48 enterprises at Long Bien District, Hanoi | 6.34 kg/day | JICA (2013) [74] | |
| HCMC | 2000 | Industrial wastewater | Major industrial contributors are oil refining, chemical, and food processing industries (20–30% of the total industrial wastewater discharges into river systems in Vietnam from HCMC) | ADB (2000) [75] |
Table A4.
Information on other pollution loads in Vietnam.
| Location | Year | Type and Sources | Oil Pollution Loads/Oil Spills | Descriptions and Other Remarks | Reference |
|---|---|---|---|---|---|
| Craft village | 2002 | Tra Co cassava processing village Bao Loc silk village | (BOD5 kg/day, COD kg/day) 218–379, 145–544 | Pollution loads of SS, TN, TP, CN andNH4+ | MONRE, WB and DANIDA (2006) [64] |
| Whole country | 2003 | (Volume of wastewater) Total | (m3/year) 896 × 106 | ADB, GEF, UNEP (2006) [73]; WWF (2018) [76] | |
| Whole country: Industrial zones | 2005 | (Load of pollutants) HCMC, Dong Nai, Binh Duong, BR–VT | (BOD5 kg/day, COD kg/day) 2.24 × 10²–1.28 × 10⁴, 1.06 × 10³–4.68 × 10⁴ | Pollution loads of TSS, TN, TP, and wastewater volume | MONRE, WB and DANIDA (2006) [64] |
| Hanoi | 2005 | (Wastewater discharge from industrial sectors) Chemical factories, Textile and dyeing, Foodstuff companies, Mechanical factories | (m3/day) 3.73 × 10³–2.65 × 10⁴ | MONRE, WB and DANIDA (2006) [64] | |
| Food processing villages | 2005 | (Wastewater discharge) Phu Do rice noodle, Vu Hai rice noodle, Ninh Hong rice noodle, Tan Do wine, etc. | (BOD5 tons/year, COD tons/year) 10–53, 15–1.3 × 10⁴ | MONRE (2008) [24] | |
| Red River Delta | 2006 | (Wastewater discharge) Food processing, husbandry, slaughtering Weaving, dyeing, leather processing, etc. | (COD tons/year) ~1.5 × 10⁴ ~1.5 × 10³ | MONRE (2008) [24] | |
| Nhue–Day River | 2006 | (Proportion of wastewater discharge) Domestic, Industrial, Farming and husbandry, etc. | 4–56% | MONRE, WB and DANIDA (2006) [64] | |
| Hanoi, Hai Phong HCMC | 2009 | (Wastewater discharge) Domestic wastewater, Industrial wastewater, etc. | (BOD5 tons/day) 0.3–214 | Nguyen et al. (2020) [67] | |
| Hanoi, Hai Phong Da Nang, HCMC | 2010 | Share of pollution load on the sum of domestic and industrial wastewater. Domestic wastewater and Industrial wastewater | 15–85% | 1 | Do and Nguyen (2014) [77] |
| Hanoi, Hai Phong Da Nang, HCMC | 2010 2019 | Wastewater discharge into canals from agricultural activities Domestic wastewater discharge rate and amount | (BOD5 tons/day, COD tons/day) 17–193, 26–305 | Pollution loads of SS, TSS are also given. | VEA (2012) [78] |
| Whole country | 2019 | Domestic wastewater discharge rate and amount. Upper: Urban area Lower: Rural area | 150 L/capita/day (4.66 × 10⁶ m3/day) 80 L/capital/day (4.85 × 10⁶ m3/day) | Blackwater 93–94%, Graywater 6–7% (Hanoi, Hai Phong) | JICA (2019) [72] |
1 90% of domestic wastewater not treated. The capacities of wastewater treatment plants in big cities only meet about 30% of the demand.
References
- Walker, A.H. Chapter 1—Oil Spills and Risk Perceptions. In Oil Spill Science and Technology, 2nd ed.; Fingas, M., Ed.; Gulf Professional Publishing: Boston, MA, USA, 2017; pp. 1–70. [Google Scholar]
- Huynh, B.Q.; Kwong, L.H.; Kiang, M.V.; Chin, E.T.; Mohareb, A.M.; Jumaan, A.O.; Basu, S.; Geldsetzer, P.; Karaki, F.M.; Re hkopf, D.H. Public health impacts of an imminent Red Sea oil spill. Nat. Sustain. 2021, 4, 1084–1091. [Google Scholar] [CrossRef] [PubMed]
- Murawski, S.A.; Ainsworth, C.H.; Gilbert, S.; Hollander, D.J.; Paris, C.B.; Schlüter, M.; Wetzel, D.L. Introduction to the Volume. In Scenarios and Responses to Future Deep Oil Spills: Fighting the Next War; Murawski, S.A., Ainsworth, C.H., Gilbert, S., Hollander, D.J., Paris, C.B., Schlüter, M., Wetzel, D.L., Eds.; Springer International Publishing: Berlin/Heidelberg, Germany, 2020; pp. 4–15. [Google Scholar]
- Ministry of Natural Resources Environment Vietnam (MoNRE); World Bank; DANIDA. Vietnam Environment Monitor 2003: Water; World Bank: Hanoi, Vietnam, 2003.
- Asia Pro Eco Programme. The Risks and Consequences of Oil Pollution in Vietnam and Guidelines on Bioremediation of Oil Spills; European Commission: Bremen, Germany, 2006. [Google Scholar]
- Institute for Global Environmental Strategies (IGES). Water Resources Management in Ho Chi Minh City. In Sustainable Groundwater Management in Asian Cities: A Final Report of Research on Sustainable Water Management Policy; Institute for Global Environmental Strategies: Hayama, Japan, 2006; p. 97. [Google Scholar]
- QCVN 08-MT:2015/BTNMT National Technical Regulation on Surface Water Quality. 2015. Available online: https://cem.gov.vn/storage/documents/5d6f3ecb26484qcvn-08-mt2015btnmt.pdf (accessed on 25 January 2023).
- TCVN 7875: 2008 Water—Determination of Oil and Grease—Partition-Infrared Method. 2008. Available online: https://vanbanphapluat.co/data/2017/08/289065_tcvn7875-2008.pdf (accessed on 5 January 2023).
- American Water Works Association; Water Environment Federation. 5520B Oil and Grease by Partition-Gravimetric Method; The partition-gravimetric method is recommended for liquid samples. In Standard Methods for the Examination of Water and Wastewater; American Public Health Association: Washington, DC, USA, 2012. [Google Scholar]
- QCVN 10-MT:2015/BTNMT National Technical Regulation on Marinewater Quality-2015. 2015. Available online: http://vea.gov.vn/Quy%20chun%20Vit%20Nam/QCVN%2010-MT-2015-BTNMT.pdf (accessed on 5 January 2023).
- American Water Works Association; Water Environment Federation. 5520C Oil and Grease by Partition-Infrared Method. In Standard Methods for the Examination of Water and Wastewater; American Public Health Association: Washington, DC, USA, 2012. [Google Scholar]
- QCVN 38:2011/BTNMT National Technical Regulation on Surface Water Quality for Protection of Aquatic Lifes. 2011. Available online: https://faolex.fao.org/docs/pdf/vie205179.pdf (accessed on 10 January 2023).
- QCVN 14: 2008/BTNMT National Technical Regulation on Domestic Wastewater. 2008. Available online: http://vea.gov.vn/Quy%20chun%20Vit%20Nam/QCVN%2014-2008-BTNMT.pdf (accessed on 10 January 2023).
- Environmental Protection Agency (US EPA). Method 1664, Revision B: n-Hexane Extractable Material (HEM; Oil and Grease) and Silica Gel Treated n-Hexane Extractable Material (SGT-HEM; Non-Polar Material) by Extraction and Gravimetry; Environmental Protection Agency (US EPA): Washington, DC, USA, 2010. [Google Scholar]
- QCVN 40:2011/BTNMT National Technical Regulation on Industrial Wastewater. 2011. Available online: https://emas.tdtu.edu.vn/sites/emas/files/EMAS/Văn%20bản%20pháp%20luật/qcvn-40-nước-thải-cn.pdf (accessed on 11 January 2023).
- QCVN 29:2010/BTNMT National Technical Regulation On the Effluent of Petroleum Terminal and Stations. 2010. Available online: http://vea.gov.vn/Quy%20chun%20Vit%20Nam/QCVN%2029-2010-BTNMT.pdf (accessed on 3 January 2023).
- QCVN 52:2013/BTNMT National Technical Regulation on Wastewater of Steel Industry. 2013. Available online: https://circabc.europa.eu/sd/a/c1026ee2-028a-4f2b-8a26-18667b751727/National%20Technical%20Regulation%20on%20Wastewater%20of%20Steel%20Industry.pdf (accessed on 10 January 2023).
- QCVN 11-MT:2015/BTNMT National Technical Regulation on the Effluent of Aquatic Products Processing Industry. 2015. Available online: http://www.gree-vn.com/pdf/QCVN-11-MT-2015-BTNMT-nuoc-thai-che-bien-thuy-san.pdf (accessed on 4 January 2023).
- Wang, B.; Liang, W.; Guo, Z.; Liu, W. Biomimetic super-lyophobic and super-lyophilic materials applied for oil/water separa tion: A new strategy beyond nature. Chem. Soc. Rev. 2015, 44, 336–361. [Google Scholar] [CrossRef] [PubMed]
- Yong, J.; Huo, J.; Chen, F.; Yang, Q.; Hou, X. Oil/water separation based on natural materials with super-wettability: Recent advances. Phys. Chem. Chem. Phys. 2018, 20, 25140–25163. [Google Scholar] [CrossRef] [PubMed]
- Hassanshahian, M.; Emtiazi, G.; Caruso, G.; Cappello, S. Bioremediation (bioaugmentation/biostimulation) trials of oil polluted seawater: A mesocosm simulation study. Mar. Environ. Res. 2014, 95, 28–38. [Google Scholar] [CrossRef]
- Cheng, Y.; Wang, L.; Faustorilla, V.; Megharaj, M.; Naidu, R.; Chen, Z. Integrated electrochemical treatment systems for facil itating the bioremediation of oil spill contaminated soil. Chemosphere 2017, 175, 294–299. [Google Scholar] [CrossRef]
- Pintor, A.M.A.; Vilar, V.J.P.; Botelho, C.M.S.; Boaventura, R.A.R. Oil and grease removal from wastewaters: Sorption treatment as an alternative to state-of-the-art technologies. A critical review. Chem. Eng. J. 2016, 297, 229–255. [Google Scholar] [CrossRef]
- Ministry of Natural Resources Environment Vietnam (MoNRE). National State of Environment 2008 Vietnam Craft Village Environment; Ministry of Natural Resources Environment Vietnam: Hanoi, Vietnam, 2008.
- Waterworks Bureau City of Kawasaki Japan. Oil and Public Sewage Systems; Waterworks Bureau City of Kawasaki Japan: Kawasaki, Japan, 2020. [Google Scholar]
- You, Z.; Xu, H.; Sun, Y.; Zhang, S.; Zhang, L. Effective treatment of emulsified oil wastewater by the coagulation-flotation process. RSC Adv. 2018, 8, 40639–40646. [Google Scholar] [CrossRef]
- Medeiros, A.D.L.M.d.; Silva Junior, C.J.G.d.; Amorim, J.D.P.d.; Durval, I.J.B.; Costa, A.F.d.S.; Sarubbo, L.A. Oily WastewaterTreatment: Methods, Challenges, and Trends. Processes 2022, 10, 743. [Google Scholar] [CrossRef]
- Stewart, M.; Arnold, K. Chapter 1—Crude Oil Treating Systems. In Emulsions and Oil Treating Equipment; Stewart, M., Arnold, K., Eds.; Gulf Professional Publishing: Burlington, VT, USA, 2009; pp. 1–80. [Google Scholar]
- Oliveira, L.; Saleem, J.; Bazargan, A.; Duarte, J.; McKay, G.; Meili, L. Sorption as a rapidly response for oil spill accidents: A material and mechanistic approach. J. Hazard. Mater. 2021, 407, 124842. [Google Scholar] [CrossRef]
- Torres, C.E.I.; Quezada, T.E.S.; Kharissova, O.V.; Kharisov, B.I.; de la Fuente, M.I.G. Carbon-based aerogels and xerogels: Synthesis, properties, oil sorption capacities, and DFT simulations. J. Environ. Chem. Eng. 2021, 9, 104886. [Google Scholar] [CrossRef]
- Al-Majed, A.A.; Adebayo, A.R.; Hossain, M.E. A sustainable approach to controlling oil spills. J. Environ. Manag. 2012, 113, 213–227. [Google Scholar] [CrossRef]
- El Gheriany, I.A.; El Saqa, F.A.; El Razek Amer, A.A.; Hussein, M. Oil spill sorption capacity of raw and thermally modified orange peel waste. Alex. Eng. J. 2020, 59, 925–932. [Google Scholar] [CrossRef]
- Akihiro, M.; Muhammad, J.Z.; Takeshi, S.; Thanh, D.H.T.; Thanh, H.P.; Viet, N.T.T.; Ken, K. Oil/water separation techniques using hydrophobized/oleophilized grains: A review of recent studies. GEOMATE J. 2021, 20, 28–34. [Google Scholar]
- Gong, Z.; Alef, K.; Wilke, B.M.; Li, P. Activated carbon adsorption of PAHs from vegetable oil used in soil remediation. J. Hazard. Mater. 2007, 143, 372–378. [Google Scholar] [CrossRef]
- Liu, L.; Wang, L.; Song, W.; Yang, L.; Yin, L.; Xia, S.; Wang, H.; Strong, P.J.; Song, Z. Crude oil removal from aqueous solution using raw and carbonized Xanthoceras sorbifolia shells. Environ. Sci. Pollut. Res. Int. 2018, 25, 29325–29334. [Google Scholar] [CrossRef]
- Jain, S.N.; Garud, V.B.; Dawange, S.D.; Sonawane, D.D.; Shaikh, E.R. Sesame (Sesamum indicum) oil cake—Industrial waste biomass for sequestration of Basic Blue 26 from aqueous media. Biomass Convers. Biorefinery 2020, 12, 3783–3793. [Google Scholar] [CrossRef]
- Van, T.N.; Ton, K.T.; Thanh, H.D.T.; Viet, N.T.T.; Hoang, G.N.; Tien, D.N.; Yugo, I.; Tomonori, I.; Ken, K. Current status of construction and demolition waste management in vietnam: Challenges and opportunities. GEOMATE J. 2018, 15, 23–29. [Google Scholar]
- Giang, N.H.; Tan, N.H.; Quang, N.T.; Hien, N.X.; Kawamoto, K. Sustainable management and technologies for recycled con struction demolition waste in Vietnam. IOP Conf. Ser. Mater. Sci. Eng. 2020, 869, 032040. [Google Scholar] [CrossRef]
- Nguyen, H.G.; Nguyen, D.T.; Nghiem, H.T.; Tran, V.C.; Kato, A.; Matsuno, A.; Isobe, Y.; Kawasaki, M.; Kawamoto, K. Current Management Condition and Waste Composition Characteristics of Construction and Demolition Waste Landfills in Hanoi of Vietnam. Sustainability 2021, 13, 10148. [Google Scholar] [CrossRef]
- Alexanderson, J. Relations between structure and mechanical properties of autoclaved aerated concrete. Cem. Concr. Res. 1979, 9, 507–514. [Google Scholar] [CrossRef]
- Nguyen Trong, L.; Asamoto, S.; Matsui, K. Sorption isotherm and length change behavior of autoclaved aerated concrete. Cem. Concr. Compos. 2018, 94, 136–144. [Google Scholar] [CrossRef]
- Akihiro, M.; Shin, I.; Lam, N.T.; Tien, D.N.; Tuan, N.V.; Giang, N.H.; Ken, K. Comparison of macropore structures and networks of autoclaved aerated concrete blocks using micro-focus X-ray computed tomography. GEOMATE J. 2020, 19, 160–165. [Google Scholar]
- Aroni, S. Autoclaved Aerated Concrete—Properties, Testing and Design; CRC Press: Boca Raton, FL, USA, 2014. [Google Scholar]
- Tada, S. Microstructural approach to properties of moist cellular concrete. In Autoclaved Aerated Concrete-Moisture and Properties; Elsevier Science Ltd.: Amsterdam, The Netherlands, 1983. [Google Scholar]
- Wittmann, F.H. Autoclaved Aerated Concrete Moisture and Properties; Elsevier Scientific Publishing Co.: New York, NK, USA, 1983. [Google Scholar]
- Kumara, G.M.P.; Kawamoto, K.; Saito, T.; Hamamoto, S.; Asamoto, S. Evaluation of Autoclaved Aerated Concrete Fines for Removal of Cd(II) and Pb(II) from Wastewater. J. Environ. Eng. 2019, 145, 04019078. [Google Scholar] [CrossRef]
- Kumara, G.M.P.; Kawamoto, K. Steel Slag and Autoclaved Aerated Concrete Grains as Low-Cost Adsorbents to Remove Cd2+ and Pb2+ in Wastewater: Effects of Mixing Proportions of Grains and Liquid-to-Solid Ratio. Sustainability 2021, 13, 10321. [Google Scholar] [CrossRef]
- Dang, H.T.T.; Le, C.Q.; Tran, S.H.; Kawamoto, K.; Tran, N.T.V.; Huyen, P.T. Application of Autoclaved Aerated Concrete Grains Coated with Stearic Acid for Removal of Oil from Water. Water Air Soil Pollut. 2022, 233, 530. [Google Scholar] [CrossRef]
- Thai, H.N.; Kawamoto, K.; Nguyen, H.G.; Sakaki, T.; Komatsu, T.; Moldrup, P. Measurements and Modeling of Thermal Con ductivity of Recycled Aggregates from Concrete, Clay Brick, and Their Mixtures with Autoclaved Aerated Concrete Grains. Sustainability 2022, 14, 2417. [Google Scholar] [CrossRef]
- JIS Z 8801-1: 2019; Test Sieves—Part 1: Test Sieves of Metal Wire Cloth. Japanese Standards Association: Tokyo, Japan, 2019.
- JWWA A 103-1: 2006-2; Filter Sand for Water Supply. Japan Water Works Association: Tokyo, Japan, 2006; p. 18.
- Subedi, S.; Kawamoto, K.; Jayarathna, L.; Vithanage, M.; Moldrup, P.; Wollesen de Jonge, L.; Komatsu, T. Characterizing Time-Dependent Contact Angles for Sands Hydrophobized with Oleic and Stearic Acids. Vadose Zone J. 2012, 11, vzj2011-0055. [Google Scholar] [CrossRef]
- Wijewardana, N.S.; Kawamoto, K.; Moldrup, P.; Komatsu, T.; Kurukulasuriya, L.C.; Priyankara, N.H. Characterization of wa ter repellency for hydrophobized grains with different geometries and sizes. Environ. Earth Sci. 2015, 74, 5525–5539. [Google Scholar] [CrossRef]
- Leelamanie, D.A.L.; Karube, J.; Yoshida, A. Characterizing water repellency indices: Contact angle and water drop penetration time of hydrophobized sand. Soil Sci. Plant Nutr. 2008, 54, 179–187. [Google Scholar] [CrossRef]
- Karatza, Z.; Buckman, J.; Medero, G.M.; Beckett, C.T.S. Evolution of meniscus structures in hydrophobic granular systems. J. Hydrol. 2021, 603, 126954. [Google Scholar] [CrossRef]
- Matsuno, A.; Kawamoto, K. Hydrophobicity/Oleophilicity of Autoclaved Aerated Concrete (AAC) Grains Coated with Oleic and Stearic Acids for Application as Oil/Water Separating Filtration and Adsorbent Materials in Vietnam. Environments 2022, 9, 101. [Google Scholar] [CrossRef]
- The Chemical Daily. 15710 Chemical Products; The Chemical Daily Co., Ltd.: Tokyo, Japan, 2010. [Google Scholar]
- Organization for Economic Co-Operation and Development Publications (OECD). Guidelines for the Testing of Chemicals; Organization for Economic Co-Operation and Development Publications: Paris, France, 2000. [Google Scholar]
- ASTM F726-99; Standard Test Method for Sorbent Performance of Adsorbents. ASTM Committee on Standards: West Conshohocken, PA, USA, 1998.
- Langmuir, I. The adsorption of gases on plane surfaces of glass, mica and platinum. J. Am. Chem. Soc. 1918, 40, 1361–1403. [Google Scholar] [CrossRef]
- Freundlich, H. Kapillarchemie: Eine Darstellung der Chemie der Kolloide und Verwandter Gebiete; Akademische Verlagsgesellschaft: New York, NY, USA, 1922. [Google Scholar]
- Huang, J.; Yan, Z. Adsorption Mechanism of Oil by Resilient Graphene Aerogels from Oil-Water Emulsion. Langmuir 2018, 34, 1890–1898. [Google Scholar] [CrossRef]
- Jing, H.; Lu, S.; Ji, L.; Li, S.; Zhu, B.; Guo, J.; Sun, J.; Cai, L.; Wang, Y. Magnetic Wakame-Based Biochar/Ni Composites with Enhanced Adsorption Performance for Diesel. J. Renew. Mater. 2022, 10, 3147–3165. [Google Scholar] [CrossRef]
- Ministry of Natural Resources Environment Vietnam (MoNRE); World Bank; DANIDA. Vietnam Environment Monitor 2006: Water Quality in Vietnam with a Focus on the Cau, Nhue-Day and Dong Nai River Basins; World Bank: Hanoi, Vietnam, 2006.
- Institute for Global Environmental Strategies (IGES). Water Resources Management in Ho Chi Minh City. In Sustainable Groundwater Management in Asian Cities: A Final Report of Research on Sustainable Water Management Policy; Institute for Global Environmental Strategies: Hayama, Japan, 2007; p. 69. [Google Scholar]
- Binh Dinh Provincial People’s Committee (PPC). Environmental and Social Impact Assessment Report on Coastal Cities Sustainable Environment Project (CCSEP): Quy Nhon City Sub-Project; World Bank Group: Washington, DC, USA, 2016.
- Nguyen, H.A. Wastewater management and treatment in urban areas in Viet Nam. In Proceedings of the 1st International Workshop on Water Environment Partnership in Asia (WEPA), Hanoi, Vietnam, 8–9 March 2010; pp. 211–215. [Google Scholar]
- Vinh, L.T.; Tam, P.H. Water quality at Rach Gia monitoring station (1997–2015). Vietnam J. Mar. Sci. Technol. 2017, 17, 222–231. [Google Scholar] [CrossRef]
- Pham, H.T. Coastal Seawater Quality from Data at South Vietnam Monitoring Stations during 2013–2017. VNU J. Sci. Earth Environ. Sci. 2018, 34, 2. [Google Scholar] [CrossRef]
- Pham, H.T. The Variation Trend of Environmental Quality at Corals in Coastal Areas of Khanh Hoa during 2010–2018. VNU J. Sci. Earth Environ. Sci. 2019, 35, 4. [Google Scholar] [CrossRef]
- Ministry of Natural Resources Environment Vietnam (MoNRE). Báo Cáo Hiện Trạng Môi Trường Quốc gia Giai Đoạn 2011–2015 (Vietnamese); Ministry of Natural Resources Environment Vietnam: Hanoi, Vietnam, 2015.
- Japan International Cooperation Agency (JICA). Final Report on JICA Survey on Examination of Monitoring Methodology for Indicator of SDG 6.3.1 in Vietnam; Japan International Cooperation Agency: Tokyo, Japan, 2019.
- Asian Development Bank (ADB); Global Environment Facility (GEF); United Nation Environment Programme (UNEP). Vietnam National Environmental Performance Assessment (EPA) Report, National Performance Assessment and Subregional Strategic Environment Framework in the Greater Mekong Subregion; Asian Development Bank: Mandaluyong, Philippines, 2006. [Google Scholar]
- Japan International Cooperation Agency (JICA). Project Completion Report on the Project for Strengthening Capacity of Water Environmental Management in Vietnam; Japan International Cooperation Agency: Tokyo, Japan, 2013.
- Asian Development Bank (ADB). Environments in Transition: Cambodia, Lao, Thailand, Vietnam; Asian Development Bank: Manila, Philippines, 2000; p. 41. [Google Scholar]
- WWF. WWF REPORT 2018 Textile and Garment Sector in Vietnam: Water Risks and Solutions; WWF: Gland, Switzerland, 2018. [Google Scholar]
- Do Nam Thang, N.T.C. Recent development of water environmental management in Vietnam. Water Environment Partnership in Asia (WEPA). In Proceedings of the Seminar on Current Situation and Future Prospect of Water Environment Governance in Asia, Tokyo, Japan, 23 January 2014. [Google Scholar]
- Vietnam Environment Administration (VEA). Báo Cáo Môi Trường Quốc gia 2012—Môi Trường Nước Mặt; Vietnam Environment Administration: Hanoi, Vietnam, 2012.
Figure 1.
(a) Dispersed oil (soybean oil) after ultrasonic mixing. (b) Before and after batch sorption test of dispersed oil (Ci = 1000 mg/L).
Figure 1.
(a) Dispersed oil (soybean oil) after ultrasonic mixing. (b) Before and after batch sorption test of dispersed oil (Ci = 1000 mg/L).

Figure 2.
Particle size distributions of the dispersed oil in water.

Figure 3.
Relationship between oil concentration measured by oil concentration analyzer and normal hexane measurement.
Figure 3.
Relationship between oil concentration measured by oil concentration analyzer and normal hexane measurement.

Figure 4.
Measured removal percentage of dispersed oil in water (R, %) values for AAC grains with different shaking times at Ci = 1000 mg/L: (a) 0.106–0.25 mm, (b) 0.25–0.85 mm, (c) 0.85–2.00 mm. Error bars indicate standard deviations of measured data.
Figure 4.
Measured removal percentage of dispersed oil in water (R, %) values for AAC grains with different shaking times at Ci = 1000 mg/L: (a) 0.106–0.25 mm, (b) 0.25–0.85 mm, (c) 0.85–2.00 mm. Error bars indicate standard deviations of measured data.

Figure 5.
Measured removal percentage of dispersed oil in water (R, %) for AAC grains with different sizes and different coating conditions at Ci = 10, 50, 100, and 1000 mg/kg. Error bars indicate standard deviations of measured data.
Figure 5.
Measured removal percentage of dispersed oil in water (R, %) for AAC grains with different sizes and different coating conditions at Ci = 10, 50, 100, and 1000 mg/kg. Error bars indicate standard deviations of measured data.

Figure 6.
Measured removal percentage of dispersed oil in water (R, %) for sands with different sizes and different coating conditions at Ci = 10, 50, 100, and 1000 mg/kg. Error bars indicate standard deviations of measured data.
Figure 6.
Measured removal percentage of dispersed oil in water (R, %) for sands with different sizes and different coating conditions at Ci = 10, 50, 100, and 1000 mg/kg. Error bars indicate standard deviations of measured data.

Figure 7.
Relationship between qe and Ce for AAC grains and Sands.

Table 1.
Measured and reported parameters for adsorption isotherm models.
| Langmuir | Freundlich | Linear | ||||||||||
|---|---|---|---|---|---|---|---|---|---|---|---|---|
| Sample | Particle Size (mm) | Coating (g/kg) | qmax (mg/g) | b (L/mg) | R2 | 1/n | KF (mg/g) | R2 | Kd (L/mg) | R2 | Target Oil | Ref. |
| AAC | 0.106–0.25 | 0 | 8.6 | 7.3 × 10⁻³ | 0.97 | 1.7 | 3.0 × 10⁻³ | 0.99 | 6.1 × 10⁻² | 0.99 | Soybean oil * | This Study |
| 0.25–0.85 | 9.4 | 1.7 × 10⁻² | 0.86 | 3.0 | 6.3 × 10⁻⁵ | 0.99 | 1.4 × 10⁻¹ | 0.94 | ||||
| 0.85–2.00 | 8.9 | 8.9 × 10⁻³ | 0.99 | 1.5 | 8.6 × 10⁻³ | 0.99 | 7.8 × 10⁻² | 0.99 | ||||
| 0.106–0.25 | OA = 1 | 9.0 | 1.0 × 10⁻² | 0.98 | 0.92 | 1.2 × 10⁻¹ | 0.99 | 9.1 × 10⁻² | 0.99 | |||
| 0.25–0.85 | 6.6 | 2.9 × 10⁻³ | 0.96 | 0.70 | 8.9 × 10⁻² | 0.98 | 1.9 × 10⁻² | 0.99 | ||||
| 0.85–2.00 | 8.5 | 6.7 × 10⁻³ | 0.85 | 1.0 | 4.0 × 10⁻² | 0.99 | 5.6 × 10⁻² | 0.99 | ||||
| 0.106–0.25 | OA = 5 | 8.9 | 8.7 × 10⁻³ | 0.81 | 1.3 | 2.6 × 10⁻² | 0.99 | 7.7 × 10⁻² | 0.99 | |||
| 0.25–0.85 | 7.6 | 4.1 × 10⁻³ | 0.93 | 1.1 | 2.1 × 10⁻² | 0.99 | 3.1 × 10⁻² | 0.99 | ||||
| 0.85–2.00 | 7.3 | 3.7 × 10⁻³ | 0.94 | 1.4 | 3.6 × 10⁻³ | 0.99 | 2.7 × 10⁻² | 0.99 | ||||
| 0.106–0.25 | OA = 10 | 9.1 | 8.5 × 10⁻³ | 0.82 | 3.0 | 8.3 × 10⁻⁶ | 0.99 | 1.0 × 10⁻¹ | 0.99 | |||
| 0.25–0.85 | 6.9 | 3.0 × 10⁻³ | 0.96 | 2.1 | 4.2 × 10⁻⁵ | 0.99 | 2.3 × 10⁻² | 0.99 | ||||
| 0.85–2.00 | 6.7 | 2.8 × 10⁻³ | 0.96 | 1.6 | 7.8 × 10⁻⁴ | 0.99 | 2.0 × 10⁻² | 0.99 | ||||
| 0.106–0.25 | SA = 1 | 7.8 | 4.5 × 10⁻³ | 0.92 | 0.89 | 6.9 × 10⁻² | 0.99 | 3.5 × 10⁻² | 0.99 | |||
| 0.25–0.85 | 7.7 | 4.4 × 10⁻³ | 0.93 | 0.73 | 1.4 × 10⁻¹ | 0.99 | 3.4 × 10⁻² | 0.99 | ||||
| 0.85–2.00 | 6.3 | 6.2 × 10⁻² | 0.39 | 0.60 | 1.8 × 10⁻¹ | 0.99 | 1.7 × 10⁻² | 0.99 | ||||
| 0.106–0.25 | SA = 5 | 8.6 | 6.9 × 10⁻³ | 0.86 | 1.6 | 4.5 × 10⁻³ | 0.99 | 6.0 × 10⁻² | 0.99 | |||
| 0.25–0.85 | 7.1 | 1.2 × 10⁻² | 0.75 | 1.0 | 2.3 × 10⁻² | 0.99 | 2.5 × 10⁻² | 0.99 | ||||
| 0.85–2.00 | 7.8 | 4.6 × 10⁻³ | 0.74 | 1.2 | 2.0 × 10⁻² | 0.99 | 3.6 × 10⁻² | 0.99 | ||||
| 0.106–0.25 | SA = 10 | 8.4 | 6.3 × 10⁻³ | 0.87 | 1.2 | 2.8 × 10⁻² | 0.99 | 5.3 × 10⁻² | 0.99 | |||
| 0.25–0.85 | 8.3 | 1.3 × 10⁻² | 0.73 | 0.95 | 7.6 × 10⁻² | 0.99 | 4.8 × 10⁻² | 0.99 | ||||
| 0.85–2.00 | 9.0 | 1.0 × 10⁻² | 0.78 | 1.3 | 2.3 × 10⁻² | 0.99 | 9.0 × 10⁻² | 0.99 | ||||
| Sands | 0.18–2.00 | 0 | 3.3 | 1.5 × 10⁻³ | 0.99 | 1.5 | 2.0 × 10⁻² | 0.99 | 4.9 × 10⁻³ | 0.99 | Soybean oil * | This Study |
| 0.30–2.00 | 5.2 | 2.1 × 10⁻³ | 0.97 | 1.7 | 5.6 × 10⁻³ | 0.99 | 1.1 × 10⁻² | 0.99 | ||||
| 0.18–2.00 | OA = 2 | 4.1 | 1.7 × 10⁻³ | 0.96 | 1.8 | 1.8 × 10⁻⁵ | 0.99 | 6.8 × 10⁻³ | 0.98 | |||
| 0.30–2.00 | OA = 5 | 4.7 | 1.8 × 10⁻³ | 0.98 | 2.0 | 3.3 × 10⁻⁵ | 0.99 | 8.7 × 10⁻³ | 0.99 | |||
| 0.18–2.00 | OA = 2 | 5.4 | 2.1 × 10⁻³ | 0.96 | 2.8 | 3.7 × 10⁻⁷ | 0.99 | 1.1 × 10⁻² | 0.99 | |||
| 0.30–2.00 | OA = 5 | 3.9 | 1.6 × 10⁻³ | 0.98 | 2.2 | 5.9 × 10⁻⁶ | 0.99 | 6.3 × 10⁻³ | 0.99 | |||
| 0.18–2.00 | OA = 2 | 5.3 | 2.1 × 10⁻³ | 0.96 | 2.1 | 1.2 × 10⁻⁵ | 0.99 | 1.1 × 10⁻² | 0.99 | |||
| 0.30–2.00 | OA = 5 | 5.4 | 2.2 × 10⁻³ | 0.96 | 1.4 | 6.7 × 10⁻⁴ | 0.99 | 1.1 × 10⁻² | 0.99 | |||
| 0.18–2.00 | SA = 2 | 3.6 | 1.5 × 10⁻³ | 0.98 | 1.4 | 4.0 × 10⁻⁴ | 0.99 | 5.6 × 10⁻³ | 0.99 | |||
| 0.30–2.00 | SA = 5 | 4.0 | 1.7 × 10⁻³ | 0.99 | 1.3 | 1.4 × 10⁻³ | 0.98 | 6.7 × 10⁻³ | 0.99 | |||
| Graphite powders | <0.03 | Activated carbons | 25 | 3.9 × 10⁻³ | 0.9 | 0.82 | 0.16 | 0.77 | – | – | Diesel oil * | Huang et al. (2018) [62] |
| Activated carbons | 0.5–2.0 | 0 | 16–86 | 7.0 × 10⁻³ −1.0 × 10⁻² | 0.94–0.99 | 0.18–0.5 | 0.4–5.0 | 0.93–0.99 | – | – | Vegetable oil | Gong et al. (2007) [34] |
| Wakame | – | Biochar /Ni | 8.65–116.5 | 0.113–0.481 | 0.964–0.999 | 0.03–0.1 | 3.45–7.21 | 0.806–0.965 | – | – | Diesel oil | Jing et al. (2022) [63] |
* Dispersed or Emulsified oil.
Disclaimer/Publisher’s Note: The statements, opinions and data contained in all publications are solely those of the individual author(s) and contributor(s) and not of MDPI and/or the editor(s). MDPI and/or the editor(s) disclaim responsibility for any injury to people or property resulting from any ideas, methods, instructions or products referred to in the content. |
© 2023 by the authors. Licensee MDPI, Basel, Switzerland. This article is an open access article distributed under the terms and conditions of the Creative Commons Attribution (CC BY) license (https://creativecommons.org/licenses/by/4.0/).
Share and Cite
MDPI and ACS Style
Matsuno, A.; Kawamoto, K. Assessment of Dispersed Oil Sorption in Oily Wastewater onto Hydrophobized/Oleophilized Autoclaved Aerated Concrete (AAC) Grains. Environments 2023, 10, 92. https://doi.org/10.3390/environments10060092
AMA Style
Matsuno A, Kawamoto K. Assessment of Dispersed Oil Sorption in Oily Wastewater onto Hydrophobized/Oleophilized Autoclaved Aerated Concrete (AAC) Grains. Environments. 2023; 10(6):92. https://doi.org/10.3390/environments10060092
Chicago/Turabian StyleMatsuno, Akihiro, and Ken Kawamoto. 2023. "Assessment of Dispersed Oil Sorption in Oily Wastewater onto Hydrophobized/Oleophilized Autoclaved Aerated Concrete (AAC) Grains" Environments 10, no. 6: 92. https://doi.org/10.3390/environments10060092
Note that from the first issue of 2016, this journal uses article numbers instead of page numbers. See further details here.