
How the Presence of CO2 Absorption Promoters and Composition of the Choline Chloride/Amine/Molecular Solvent Mixtures Influence Its Thermophysical Properties and Ability to Absorb Carbon Dioxide
 , , , ,
  , , , and
Abstract
:1. Introduction
2. Experimental Section
2.1. Materials
2.2. Mixture Preparation
2.3. Viscosity and Density Measurements
2.4. CO2 Absorption Capacity
3. Results and Discussion
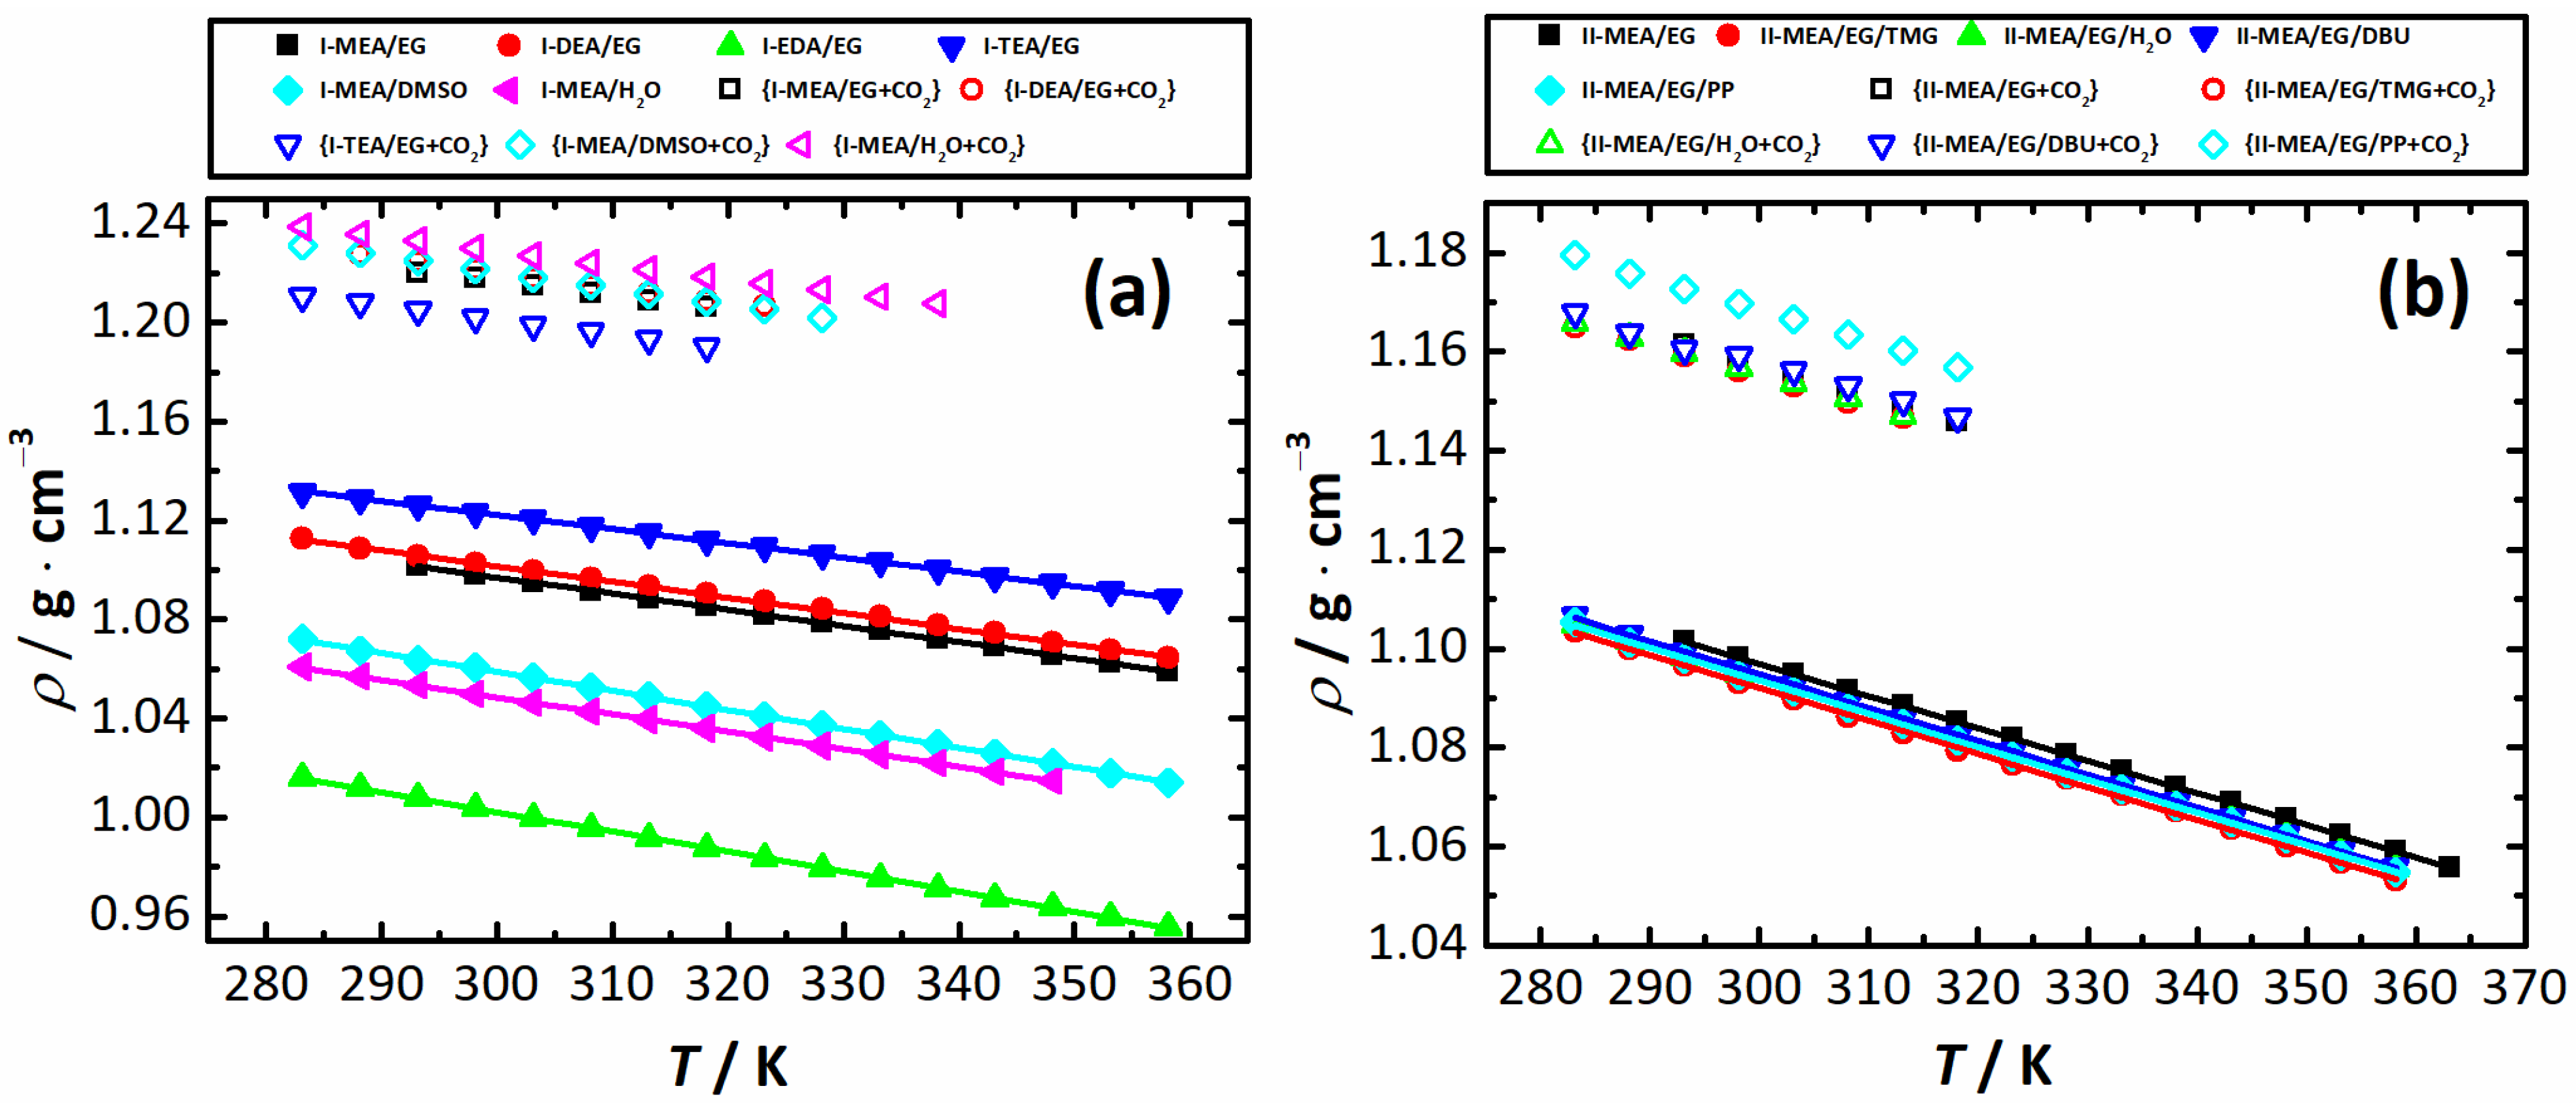
3.1. Density
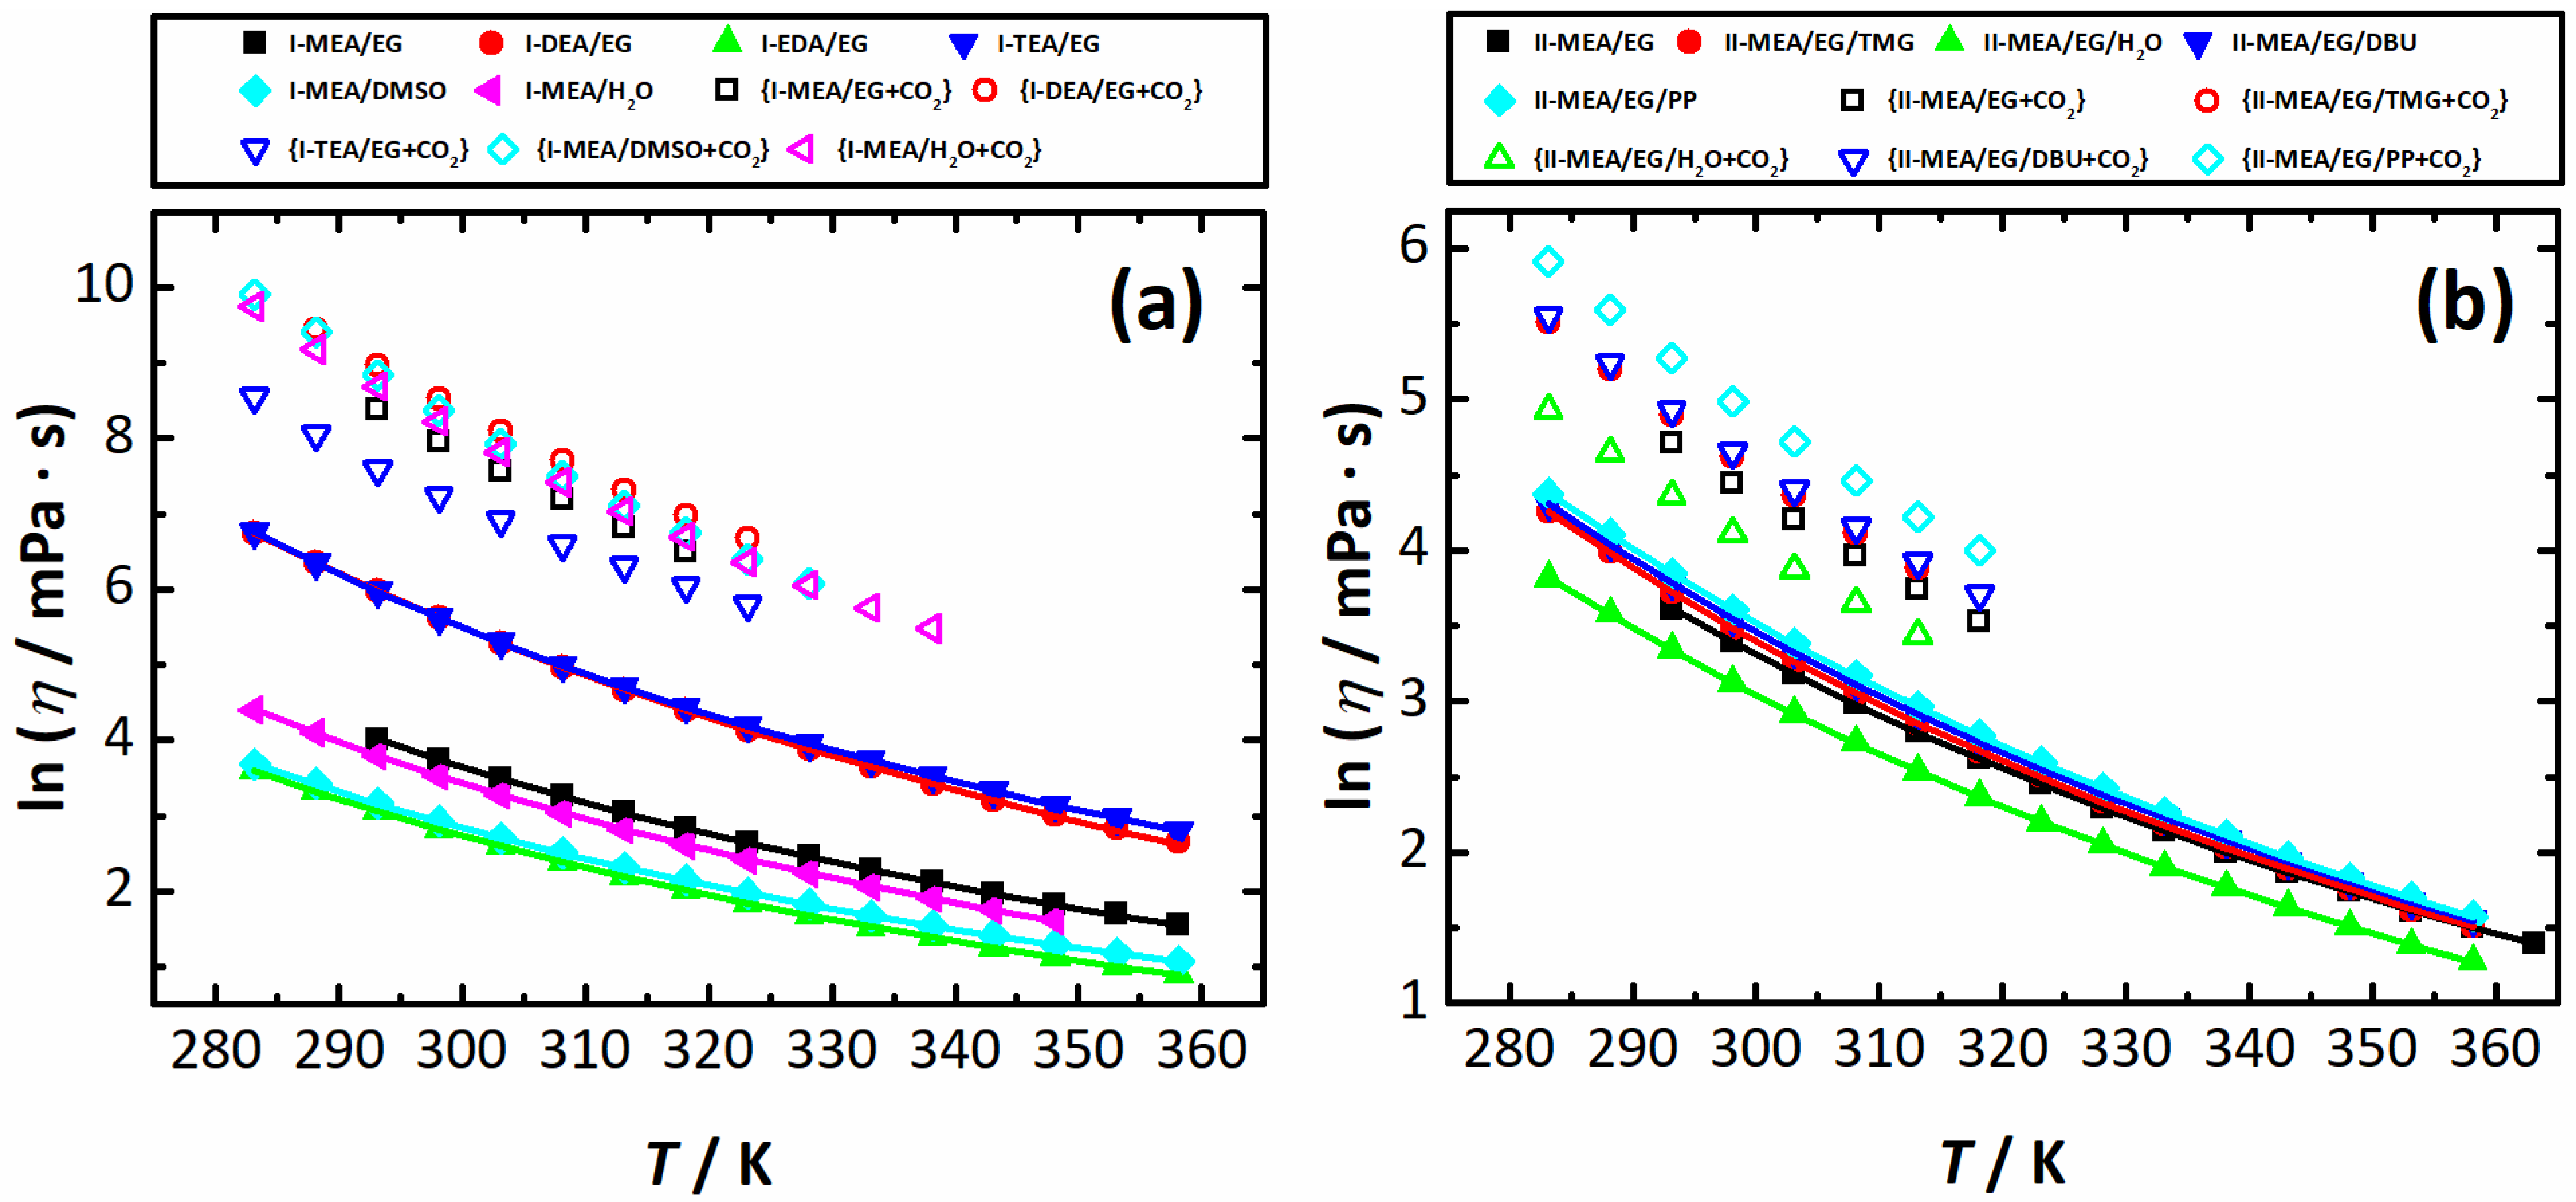
3.2. Viscosity
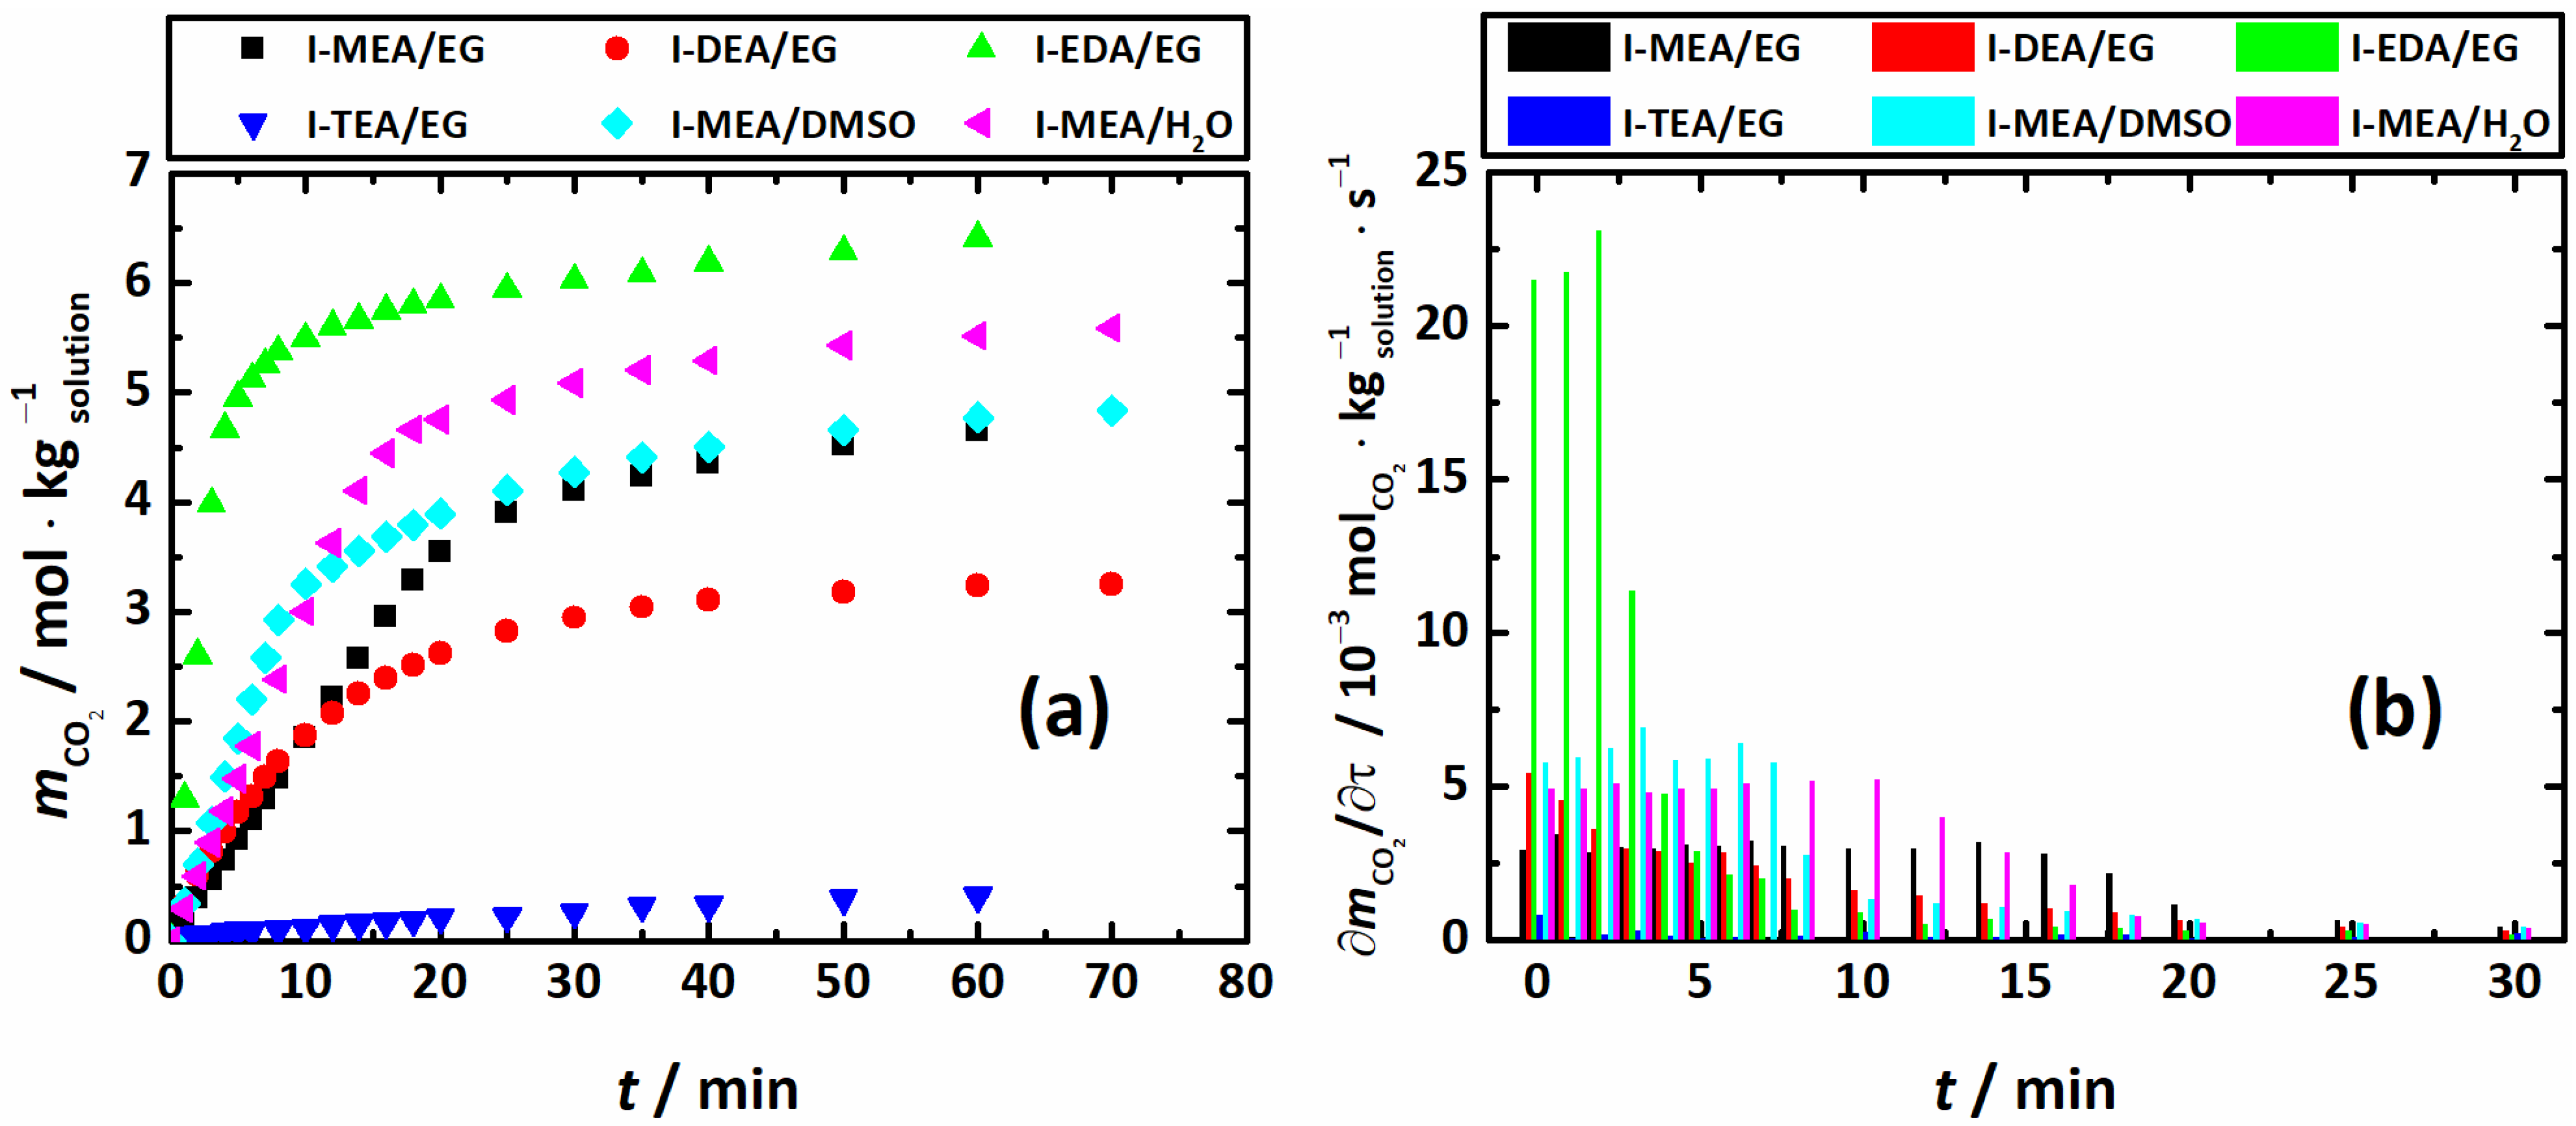
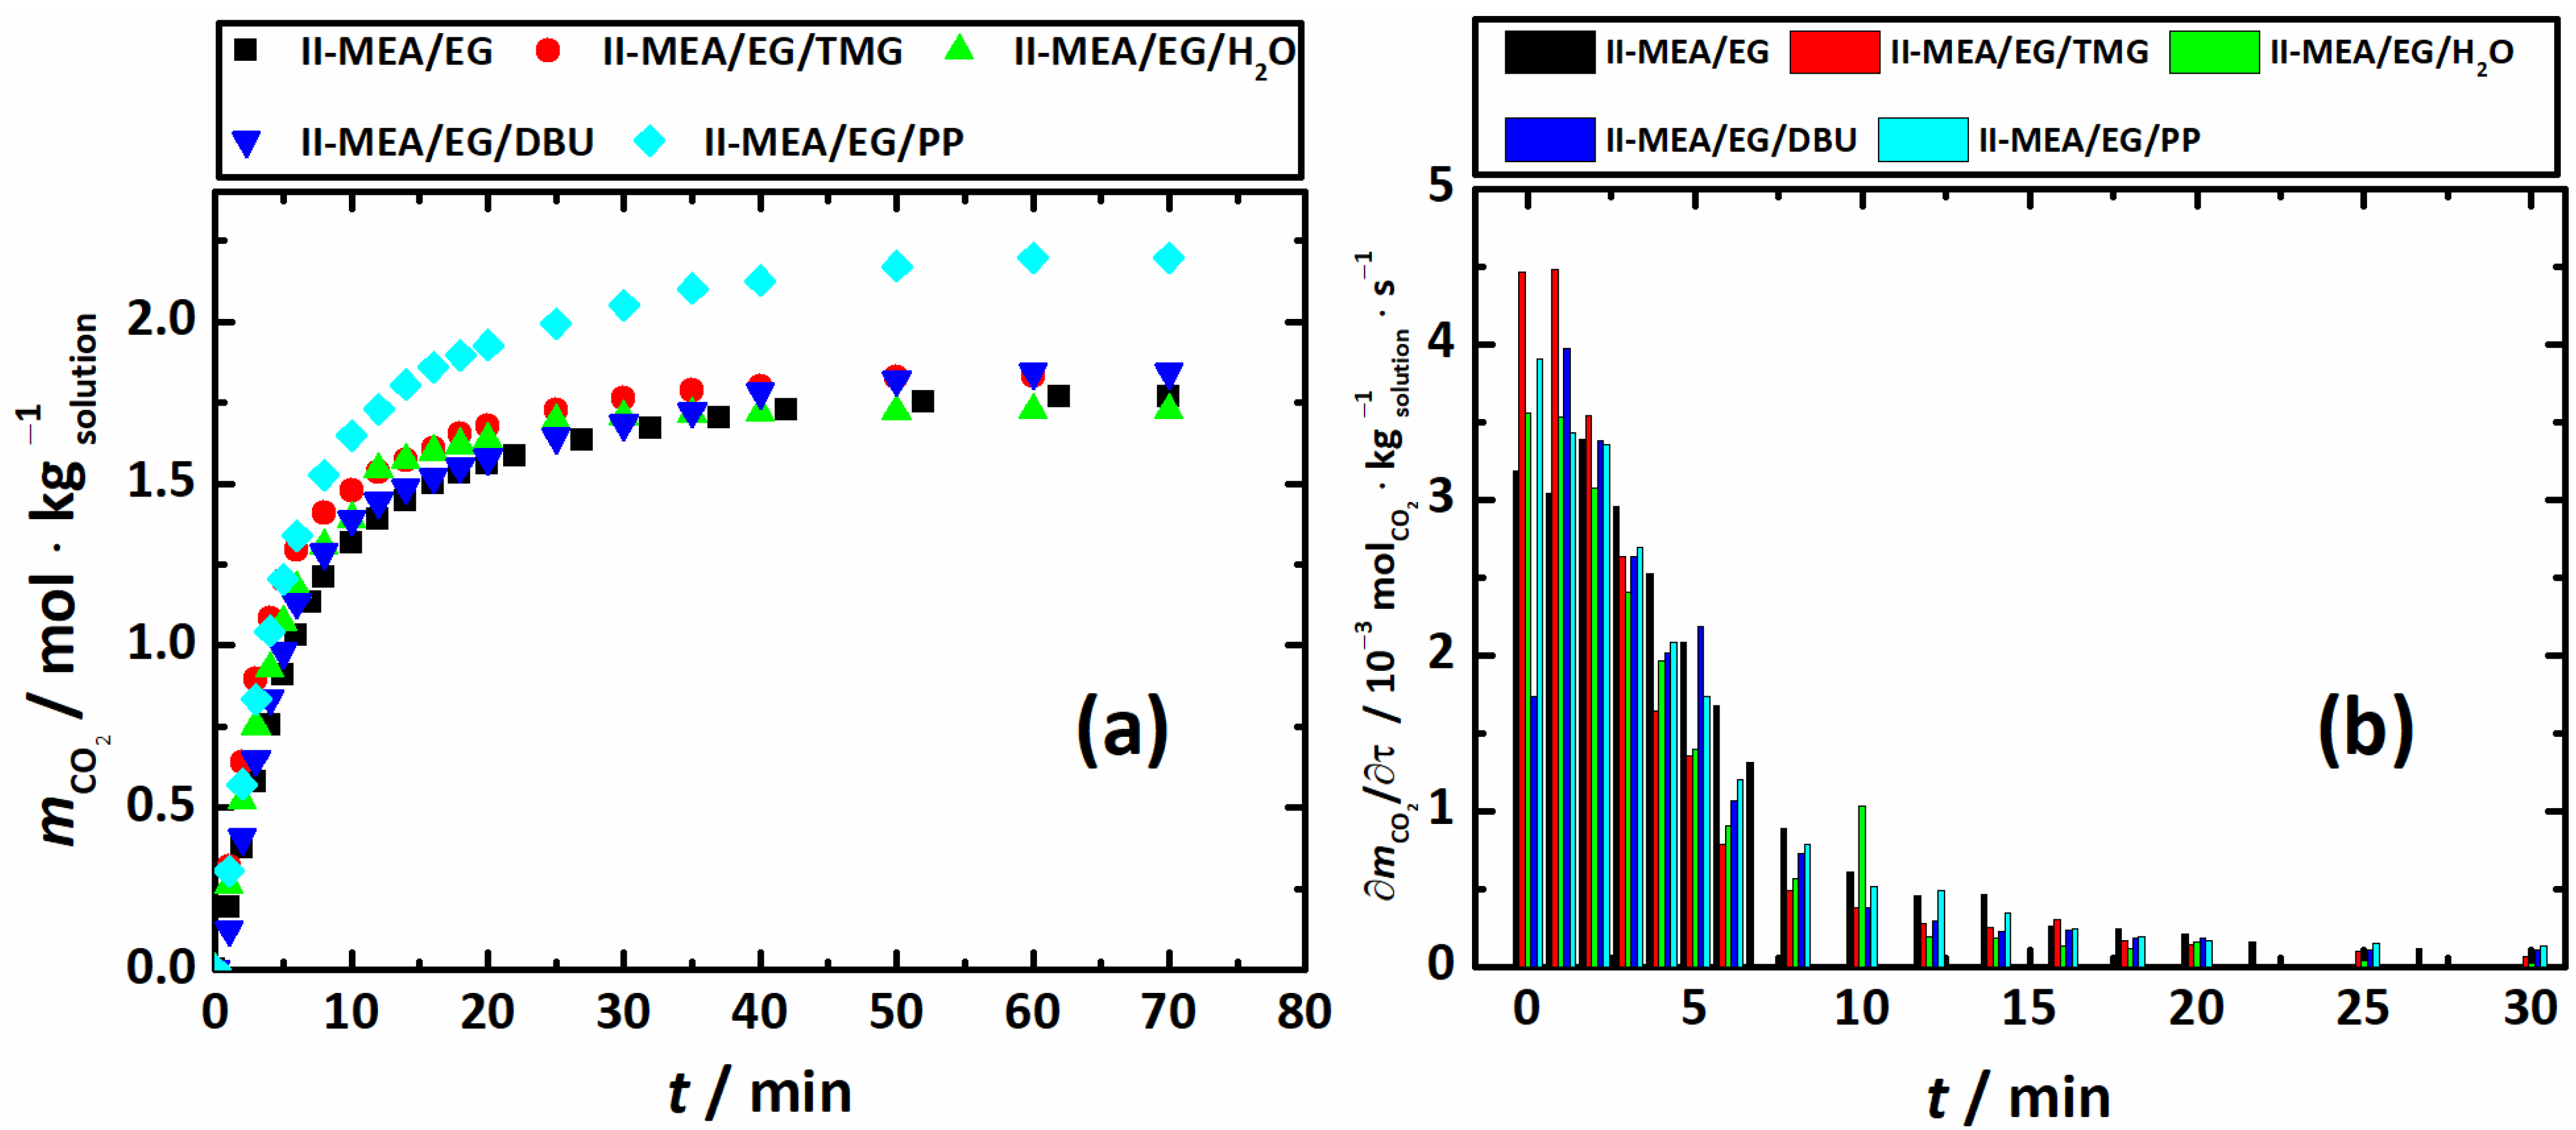
3.3. CO2 Absorption
4. Conclusions
Supplementary Materials
Author Contributions
Funding
Data Availability Statement
Conflicts of Interest
References
- Wang, X.; Song, C. Carbon Capture From Flue Gas and the Atmosphere: A Perspective. Front. Energy Res. 2020, 8, 265. [Google Scholar] [CrossRef]
- Sanz-Pérez, E.S.; Murdock, C.R.; Didas, S.A.; Jones, C.W. Direct Capture of CO2 from Ambient Air. Chem. Rev. 2016, 116, 11840–11876. [Google Scholar] [CrossRef]
- Metz, B.; Davidson, O.; De Coninck, H.C.; Loos, M.; Meyer, L. IPCC Special Report on Carbon Dioxide Capture and Storage; Cambridge University Press: Cambridge, UK, 2005; ISBN 0521685516. [Google Scholar]
- Ghanbari, T.; Abnisa, F.; Wan Daud, W.M.A. A Review on Production of Metal Organic Frameworks (MOF) for CO2 Adsorption. Sci. Total Environ. 2020, 707, 135090. [Google Scholar] [CrossRef] [PubMed]
- Zhenhong, B.A.N.; Kokkeong, L.A.U.; Mohdshariff, A. Physical Absorption of CO2 Capture: A Review. Adv. Mater. Res. 2014, 917, 134–143. [Google Scholar] [CrossRef]
- Abd, A.A.; Naji, S.Z.; Hashim, A.S.; Othman, M.R. Carbon Dioxide Removal through Physical Adsorption Using Carbonaceous and Non-Carbonaceous Adsorbents: A Review. J. Environ. Chem. Eng. 2020, 8, 104142. [Google Scholar] [CrossRef]
- Kazarina, O.V.; Petukhov, A.N.; Vorotyntsev, A.V.; Atlaskina, M.E.; Atlaskin, A.A.; Kazarin, A.S.; Golovacheva, A.A.; Sedova, N.A.; Markov, A.N.; Suvorov, S.S.; et al. The Way for Improving the Efficiency of Ammonia and Carbon Dioxide Absorption of Choline Chloride: Urea Mixtures by Modifying a Choline Cation. Fluid Phase Equilib. 2023, 568, 113736. [Google Scholar] [CrossRef]
- Kazarina, O.V.; Petukhov, A.N.; Nagrimanov, R.N.; Vorotyntsev, A.V.; Atlaskina, M.E.; Atlaskin, A.A.; Kazarin, A.S.; Golovacheva, A.A.; Markin, Z.A.; Markov, A.N.; et al. The Role of HBA Structure of Deep Eutectic Solvents Consisted of Ethylene Glycol and Chlorides of a Choline Family for Improving the Ammonia Capture Performance. J. Mol. Liq. 2023, 373, 121216. [Google Scholar] [CrossRef]
- Kazarina, O.V.; Agieienko, V.N.; Petukhov, A.N.; Vorotyntsev, A.V.; Atlaskina, M.E.; Atlaskin, A.A.; Kryuchkov, S.S.; Markov, A.N.; Nyuchev, A.V.; Vorotyntsev, I.V. Deep Eutectic Solvents Composed of Urea and New Salts of a Choline Family for Efficient Ammonia Absorption. J. Chem. Eng. Data 2022, 67, 138–150. [Google Scholar] [CrossRef]
- Kazarina, O.V.; Agieienko, V.N.; Nagrimanov, R.N.; Atlaskina, M.E.; Petukhov, A.N.; Moskvichev, A.A.; Nyuchev, A.V.; Barykin, A.V.; Vorotyntsev, I.V. A Rational Synthetic Approach for Producing Quaternary Ammonium Halides and Physical Properties of the Room Temperature Ionic Liquids Obtained by This Way. J. Mol. Liq. 2021, 344, 117925. [Google Scholar] [CrossRef]
- Yu, C.; Huang, C.; Tan, C. A Review of CO2 Capture by Absorption and Adsorption. Aerosol Air Qual. Res. 2012, 12, 745–769. [Google Scholar] [CrossRef]
- Atlaskina, M.E.; Atlaskin, A.A.; Kazarina, O.V.; Petukhov, A.N.; Zarubin, D.M.; Nyuchev, A.V.; Vorotyntsev, A.V.; Vorotyntsev, I.V. Synthesis and Comprehensive Study of Quaternary-Ammonium-Based Sorbents for Natural Gas Sweetening. Environments 2021, 8, 134. [Google Scholar] [CrossRef]
- Atlaskin, A.A.; Kryuchkov, S.S.; Smorodin, K.A.; Markov, A.N.; Kazarina, O.V.; Zarubin, D.M.; Atlaskina, M.E.; Vorotyntsev, A.V.; Nyuchev, A.V.; Petukhov, A.N.; et al. Towards the Potential of Trihexyltetradecylphosphonium Indazolide with Aprotic Heterocyclic Ionic Liquid as an Efficient Absorbent for Membrane-Assisted Gas Absorption Technique for Acid Gas Removal Applications. Sep. Purif. Technol. 2021, 257, 117835. [Google Scholar] [CrossRef]
- Borho, S.K.I.; Schmidt, J.J.M.S. Review: CO2 Capturing Methods of the Last Two Decades. Int. J. Environ. Sci. Technol. 2022. [Google Scholar] [CrossRef]
- Font-palma, C.; Cann, D.; Udemu, C. Review of Cryogenic Carbon Capture Innovations and Their Potential Applications. C 2021, 7, 58. [Google Scholar] [CrossRef]
- Hafeez, S.; Safdar, T.; Pallari, E.; Manos, G.; Aristodemou, E.; Zhang, Z. CO2 Capture Using Membrane Contactors: A Systematic Literature Review. Front. Chem. Sci. Eng. 2021, 15, 720–754. [Google Scholar] [CrossRef]
- He, X. A Review of Material Development in the Field of Carbon Capture and the Application of Membrane-Based Processes in Power Plants and Energy-Intensive Industries. Energy. Sustain. Soc. 2018, 8, 34. [Google Scholar] [CrossRef]
- Vorotyntsev, I.V.; Atlaskin, A.A.; Trubyanov, M.M.; Petukhov, A.N.; Gumerova, O.R.; Akhmetshina, A.I.; Vorotyntsev, V.M. Towards the Potential of Absorbing Pervaporation Based on Ionic Liquids for Gas Mixture Separation. Desalin. Water Treat. 2017, 75, 305–313. [Google Scholar] [CrossRef]
- Abu-Zahra, M.R.M.; Schneiders, L.H.J.; Niederer, J.P.M.; Feron, P.H.M.; Versteeg, G.F. CO2 Capture from Power Plants: Part I. A Parametric Study of the Technical Performance Based on Monoethanolamine. Int. J. Greenh. Gas Control 2007, 1, 37–46. [Google Scholar] [CrossRef]
- Luis, P. Use of Monoethanolamine (MEA) for CO2 Capture in a Global Scenario: Consequences and Alternatives. Desalination 2016, 380, 93–99. [Google Scholar] [CrossRef]
- El Hadri, N.; Quang, D.V.; Goetheer, E.L.V.; Abu Zahra, M.R.M. Aqueous Amine Solution Characterization for Post-Combustion CO2 Capture Process. Appl. Energy 2017, 185, 1433–1449. [Google Scholar] [CrossRef]
- Ko, Y.G.; Shin, S.S.; Choi, U.S. Primary, Secondary, and Tertiary Amines for CO2 Capture: Designing for Mesoporous CO2 Adsorbents. J. Colloid Interface Sci. 2011, 361, 594–602. [Google Scholar] [CrossRef] [PubMed]
- Cui, D.; Yan, S.; Guo, X.; Chu, F. Advance in Post-Combustion CO2 Capture with Alkaline Solution: A Brief Review. Energy Procedia 2012, 14, 1515–1522. [Google Scholar] [CrossRef]
- Puxty, G.; Rowland, R.; Allport, A.; Yang, Q.; Bown, M.; Burns, R.; Maeder, M.; Attalla, M. Carbon Dioxide Postcombustion Capture: A Novel Screening Study of the Carbon Dioxide Absorption Performance of 76 Amines. Environ. Sci. Technol. 2009, 43, 6427–6433. [Google Scholar] [CrossRef] [PubMed]
- Chowdhury, F.A.; Yamada, H.; Higashii, T.; Goto, K.; Onoda, M. CO2 Capture by Tertiary Amine Absorbents: A Performance Comparison Study. Ind. Eng. Chem. Res. 2013, 52, 8323–8331. [Google Scholar] [CrossRef]
- Leites, I.L. Thermodynamics of CO2 Solubility in Mixtures Monoethanolamine with Organic Solvents and Water and Commercial Experience of Energy Saving Gas Purification Technology. Energy Convers. Manag. 1998, 39, 1665–1674. [Google Scholar] [CrossRef]
- Barzagli, F.; Lai, S.; Mani, F.; Stoppioni, P. Novel Non-Aqueous Amine Solvents for Biogas Upgrading. Energy Fuels 2014, 28, 5252–5258. [Google Scholar] [CrossRef]
- Zhang, J.; Misch, R.; Tan, Y.; Agar, D.W. Novel Thermomorphic Biphasic Amine Solvents for CO2 Absorption and Low-Temperature Extractive Regeneration. Chem. Eng. Technol. 2011, 34, 1481–1489. [Google Scholar] [CrossRef]
- Heldebrant, D.J.; Koech, P.K.; Glezakou, V.A.; Rousseau, R.; Malhotra, D.; Cantu, D.C. Water-Lean Solvents for Post-Combustion CO2 Capture: Fundamentals, Uncertainties, Opportunities, and Outlook. Chem. Rev. 2017, 117, 9594–9624. [Google Scholar] [CrossRef]
- Bougie, F.; Pokras, D.; Fan, X. Novel Non-Aqueous MEA Solutions for CO2 Capture. Int. J. Greenh. Gas Control 2019, 86, 34–42. [Google Scholar] [CrossRef]
- Hwang, K.S.; Park, S.W.; Park, D.W.; Oh, K.J.; Kim, S.S. Absorption of Carbon Dioxide into Diisopropanolamine Solutions of Polar Organic Solvents. J. Taiwan Inst. Chem. Eng. 2010, 41, 16–21. [Google Scholar] [CrossRef]
- Kang, M.K.; Jeon, S.B.; Cho, J.H.; Kim, J.S.; Oh, K.J. Characterization and Comparison of the CO2 Absorption Performance into Aqueous, Quasi-Aqueous and Non-Aqueous MEA Solutions. Int. J. Greenh. Gas Control 2017, 63, 281–288. [Google Scholar] [CrossRef]
- Chen, S.; Chen, S.; Fei, X.; Zhang, Y.; Qin, L. Solubility and Characterization of CO2 in 40 Mass % N -Ethylmonoethanolamine Solutions: Explorations for an Efficient Nonaqueous Solution. Ind. Eng. Chem. Res. 2015, 54, 7212–7218. [Google Scholar] [CrossRef]
- Barbarossa, V.; Barzagli, F.; Mani, F.; Lai, S.; Stoppioni, P.; Vanga, G. Efficient CO2 Capture by Non-Aqueous 2-Amino-2-Methyl-1-Propanol (AMP) and Low Temperature Solvent Regeneration. RSC Adv. 2013, 3, 12349–12355. [Google Scholar] [CrossRef]
- Bihong, L.; Kexuan, Y.; Xiaobin, Z.; Zuoming, Z.; Guohua, J. 2-Amino-2-Methyl-1-Propanol Based Non-Aqueous Absorbent for Energy-Efficient and Non-Corrosive Carbon Dioxide Capture. Appl. Energy 2020, 264, 114703. [Google Scholar] [CrossRef]
- Guo, H.; Li, C.; Shi, X.; Li, H.; Shen, S. Nonaqueous Amine-Based Absorbents for Energy Efficient CO2 Capture. Appl. Energy 2019, 239, 725–734. [Google Scholar] [CrossRef]
- Kollau, L.J.B.M.; Vis, M.; Van Den Bruinhorst, A.; Esteves, A.C.C.; Tuinier, R. Quantification of the Liquid Window of Deep Eutectic Solvents. Chem. Commun. 2018, 54, 13351–13354. [Google Scholar] [CrossRef]
- Kovács, A.; Neyts, E.C.; Cornet, I.; Wijnants, M.; Billen, P. Modeling the Physicochemical Properties of Natural Deep Eutectic Solvents. ChemSusChem 2020, 13, 3789–3804. [Google Scholar] [CrossRef]
- Amoroso, R.; Hollmann, F.; Maccallini, C. Choline Chloride-Based DES as Solvents/Catalysts/Chemical Donors in Pharmaceutical Synthesis. Molecules 2021, 26, 6286. [Google Scholar] [CrossRef]
- Mannu, A.; Cardano, F.; Fin, A.; Baldino, S.; Prandi, C. Choline Chloride-Based Ternary Deep Band Gap Systems. J. Mol. Liq. 2021, 330, 115717. [Google Scholar] [CrossRef]
- Mannu, A.; Cardano, F.; Baldino, S.; Fin, A. Behavior of Ternary Mixtures of Hydrogen Bond Acceptors and Donors in Terms of Band Gap Energies. Materials 2021, 14, 3418. [Google Scholar] [CrossRef]
- Hansen, B.B.; Spittle, S.; Chen, B.; Poe, D.; Zhang, Y.; Klein, J.M.; Horton, A.; Adhikari, L.; Zelovich, T.; Doherty, B.W.; et al. Deep Eutectic Solvents: A Review of Fundamentals and Applications. Chem. Rev. 2021, 121, 1232–1285. [Google Scholar] [CrossRef] [PubMed]
- Pelaquim, F.P.; Barbosa Neto, A.M.; Dalmolin, I.A.L.; Costa, M.C. da Gas Solubility Using Deep Eutectic Solvents: Review and Analysis. Ind. Eng. Chem. Res. 2021, 60, 8607–8620. [Google Scholar] [CrossRef]
- Marcus, Y. Gas Solubilities in Deep Eutectic Solvents. Monatshefte fur Chemie 2018, 149, 211–217. [Google Scholar] [CrossRef]
- Fourmentin, S.; Gomes, M.C. Deep Eutectic Solvents for Medicine, Gas Solubilization and Extraction of Natural Substances; Lichtfouse, E., Fourmentin, S., Gomes, M.C., Eds.; Springer Nature Switzerland AG: Cham, Switzerland, 2021; ISBN 978-3-030-53068-6. [Google Scholar]
- Mahi, M.R.; Mokbel, I.; Négadi, L.; Jose, J. CO2 Capture Using Deep Eutectic Solvent and Amine (MEA) Solution. In Cutting Edge for Carbon Capture Utilization and Storage; Whiley: New York, NY, USA, 2017; pp. 309–316. ISBN 9781119363804. [Google Scholar]
- Adeyemi, I.; Abu-Zahra, M.R.M.; Alnashef, I. Experimental Study of the Solubility of CO2 in Novel Amine Based Deep Eutectic Solvents. Energy Procedia 2017, 105, 1394–1400. [Google Scholar] [CrossRef]
- Li, Z.; Wang, L.; Li, C.; Cui, Y.; Li, S.; Yang, G.; Shen, Y. Absorption of Carbon Dioxide Using Ethanolamine-Based Deep Eutectic Solvents. ACS Sustain. Chem. Eng. 2019, 7, 10403–10414. [Google Scholar] [CrossRef]
- Pasha, M.; Zhang, H.; Shang, M.; Li, G.; Su, Y. CO2 Absorption with Diamine Functionalized Deep Eutectic Solvents in Microstructured Reactors. Process Saf. Environ. Prot. 2022, 159, 106–119. [Google Scholar] [CrossRef]
- Cheng, J.; Wu, C.; Gao, W.; Li, H.; Ma, Y.; Liu, S.; Yang, D. CO2 Absorption Mechanism by the Deep Eutectic Solvents Formed by Monoethanolamine-Based Protic Ionic Liquid and Ethylene Glycol. Int. J. Mol. Sci. 2022, 23, 1893. [Google Scholar] [CrossRef]
- Zhang, N.; Huang, Z.; Zhang, H.; Ma, J.; Jiang, B.; Zhang, L. Highly Efficient and Reversible CO2 Capture by Task-Specific Deep Eutectic Solvents. Ind. Eng. Chem. Res. 2019, 58, 13321–13329. [Google Scholar] [CrossRef]
- Kazarina, O.V.; Agieienko, V.N.; Petukhov, A.N.; Vorotyntsev, A.V.; Kazarin, A.S.; Atlaskina, M.E.; Atlaskin, A.A.; Markov, A.N.; Golovacheva, A.A.; Vorotyntsev, I. V Monoethanolamine + Ethylene Glycol + Choline Chloride: An Effect of the Mixture Composition on the CO2 Absorption Capacity, Density and Viscosity. J. Chem. Eng. Data 2022, 67, 2899–2912. [Google Scholar] [CrossRef]
- Bhawna; Pandey, A.; Pandey, S. Superbase-Added Choline Chloride-Based Deep Eutectic Solvents for CO2 Capture and Sequestration. ChemistrySelect 2017, 2, 11422–11430. [Google Scholar] [CrossRef]
- Fu, H.; Hou, Y.; Sang, H.; Mu, T.; Lin, X.; Peng, Z.; Li, P.; Liu, J. Carbon Dioxide Capture by New DBU-Based DES: The Relationship between Ionicity and Absorptive Capacity. AIChE J. 2021, 67, e17244. [Google Scholar] [CrossRef]
- Jiang, B.; Ma, J.; Yang, N.; Huang, Z.; Zhang, N.; Tantai, X.; Sun, Y.; Zhang, L. Superbase/Acylamido-Based Deep Eutectic Solvents for Multiple-Site Efficient CO2 Absorption. Energy and Fuels 2019, 33, 7569–7577. [Google Scholar] [CrossRef]
- Yan, H.; Zhao, L.; Bai, Y.; Li, F.; Dong, H.; Wang, H.; Zhang, X.; Zeng, S. Superbase Ionic Liquid-Based Deep Eutectic Solvents for Improving CO2 Absorption. ACS Sustain. Chem. Eng. 2020, 8, 2523–2530. [Google Scholar] [CrossRef]
- Chirico, R.D.; Frenkel, M.; Magee, J.W.; Diky, V.; Muzny, C.D.; Kazakov, A.F.; Kroenlein, K.; Abdulagatov, I.; Hardin, G.R.; Acree, W.E.; et al. Improvement of Quality in Publication of Experimental Thermophysical Property Data: Challenges, Assessment Tools, Global Implementation, and Online Support. J. Chem. Eng. Data 2013, 58, 2699–2716. [Google Scholar] [CrossRef]
- Huertas, J.I.; Gomez, M.D.; Giraldo, N.; Garzón, J. CO2 Absorbing Capacity of MEA. J. Chem. 2015, 2015, 965015. [Google Scholar] [CrossRef]
- Deng, D.; Gao, B.; Zhang, C.; Duan, X.; Cui, Y.; Ning, J. Investigation of Protic NH4SCN-Based Deep Eutectic Solvents as Highly Efficient and Reversible NH3 Absorbents. Chem. Eng. J. 2019, 358, 936–943. [Google Scholar] [CrossRef]
- Li, K.; Fang, H.; Duan, X.; Deng, D. Efficient Uptake of NH3 by Dual Active Sites NH4SCN-Imidazole Deep Eutectic Solvents with Low Viscosity. J. Mol. Liq. 2021, 339, 116724. [Google Scholar] [CrossRef]
- Lee, J.I.; Otto, F.D.; Mather, A.E. Equilibrium Between Carbon Dioxide and Aqueous Monoethanolamine Solutions. J. Appl. Chem. Biotechnol. 1976, 26, 541–549. [Google Scholar] [CrossRef]
- Jou, F.-Y.; Mather, A.E.; Otto, F.D. The Solubility of CO2 in a 30 Mass Percent Monoethanolamine Solution. Can. J. Chem. Eng. 1995, 73, 140–147. [Google Scholar] [CrossRef]
- Shen, K.P.; Li, M.H. Solubility of Carbon Dioxide in Aqueous Mixtures of Monoethanolamine with Methyldiethanolamine. J. Chem. Eng. Data 1992, 37, 96–100. [Google Scholar] [CrossRef]
- Shaukat, S.; Buchner, R. Densities, Viscosities [from (278.15 to 318.15) K], and Electrical Conductivities (at 298.15 K) of Aqueous Solutions of Choline Chloride and Chloro-Choline Chloride. J. Chem. Eng. Data 2011, 56, 4944–4949. [Google Scholar] [CrossRef]
- Hawrylak, B.; Burke, S.E.; Palepu, R. Partial Molar and Excess Volumes and Adiabatic Compressibilities of Binary Mixtures of Ethanolamines with Water. J. Solution Chem. 2000, 29, 575–594. [Google Scholar] [CrossRef]
- Mjalli, F.S.; Murshid, G.; Al-Zakwani, S.; Hayyan, A. Monoethanolamine-Based Deep Eutectic Solvents, Their Synthesis and Characterization. Fluid Phase Equilib. 2017, 448, 30–40. [Google Scholar] [CrossRef]
- Agieienko, V.; Buchner, R. A Comprehensive Study of Density, Viscosity, and Electrical Conductivity of (Choline Chloride + Glycerol) Deep Eutectic Solvent and Its Mixtures with Dimethyl Sulfoxide. J. Chem. Eng. Data 2021, 66, 780–792. [Google Scholar] [CrossRef]
- Wang, X.; Yang, F.; Gao, Y.; Liu, Z. Volumetric Properties of Binary Mixtures of Dimethyl Sulfoxide with Amines from (293.15 to 363.15) K. J. Chem. Thermodyn. 2013, 57, 145–151. [Google Scholar] [CrossRef]
- Choi, J.H.; Oh, S.G.; Kim, Y.E.; Yoon, Y.I.; Nam, S.C. Carbon Dioxide Absorption Characteristics of Aqueous Alkanolamine Using Nuclear Magnetic Resonance Spectroscopy. Environ. Eng. Sci. 2012, 29, 328–334. [Google Scholar] [CrossRef]
- Gonzalez-Garza, D.; Rivera-Tinoco, R.; Bouallou, C. Comparison of Ammonia, Monoethanolamine, Diethanolamine and Methyldiethanolamine Solvents to Reduce CO2 Greenhouse Gas Emissions. Chem. Eng. Trans. 2009, 18, 279–284. [Google Scholar] [CrossRef]
- Liu, X.; Ao, Q.; Shi, S.; Li, S. CO2 Capture by Alcohol Ammonia Based Deep Eutectic Solvents with Different Water Content. Mater. Res. Express 2022, 9, 015504. [Google Scholar] [CrossRef]
- Zhou, S.; Chen, X.; Nguyen, T.; Voice, A.K.; Rochelle, G.T. Aqueous Ethylenediamine for CO2 Capture. ChemSusChem 2010, 3, 913–918. [Google Scholar] [CrossRef]
- Tao, M.; Gao, J.; Zhang, P.; Zhang, W.; Liu, Q.; He, Y.; Shi, Y. Biogas Upgrading by Capturing CO2 in Non-Aqueous Phase-Changing Diamine Solutions. Energy Fuels 2017, 31, 6298–6304. [Google Scholar] [CrossRef]


| Chemical | CAS No. | Abbr. | Molar Mass a | Supplier | Mass Purity b | Initial Water Content a,c | Purification | Drying |
|---|---|---|---|---|---|---|---|---|
| 2-aminoethanol | 141-43-5 | MEA | 61.08 | «Oka-Sintez» Ltd. (Dzerzhinsk, Russia) | >99.3 | 4000 | Vacuum distillation | Activated 3 Å molecular sieves |
| bis-(2-hydroxyethyl)amine | 111-42-2 | DEA | 105.14 | «Oka-Sintez» Ltd. (Dzerzhinsk, Russia) | >99.2 | 4000 | Vacuum distillation | |
| 1,2-diaminoethane | 107-15-3 | EDA | 60.10 | Sigma Aldrich | >99.5 | 5000 | ||
| tris-(2-hydroxyethyl)-amine | 102-71-6 | TEA | 149.19 | «Oka-Sintez» Ltd. (Dzerzhinsk, Russia) | >99.0 | 2000 | Vacuum distillation | |
| water | 7732-18-5 | H2O | 18.02 | Millipore Milli-Q | ||||
| dimethyl sulfoxide | 67-68-5 | DMSO | 78.13 | Komponent Reaktiv (Moscow, Russia) | >99.9 | 1000 | ||
| N,N,N′,N′-tetramethyl-guanidine | 80-70-6 | TMG | 115.18 | Sigma Aldrich | >99.0 | 2000 | ||
| 1,8-diazabicyclo[5.4.0]-undec-7-ene | 6674-22-2 | DBU | 152.24 | Sigma Aldrich | 99.0 | 1500 | ||
| 1,4-diazacyclohexane | 110-85-0 | PP | 86.14 | Sigma Aldrich | >99.0 | 1300 | ||
| (2-hydroxyethyl) trimethylammonium chloride | 67-48-1 | ChCl | 139.62 | Acros Organics | 99 | 6000 | Recrystallization | |
| 1,2-ethanediol | 107-21-1 | EG | 62.07 | Komponent Reaktiv (Moscow, Russia) | >99.6 | 700 | Activated 3 Å molecular sieves | |
| ammonium thiocyanate | 1762-95-4 | NH4SCN | 76.12 | Komponent Reaktiv (Moscow, Russia) | 99 | 260 | Recrystallization | Drying under reduced pressure |
| glycerol | 56-81-5 | Gly | 92.09 | Komponent Reaktiv (Moscow, Russia) | >99.6 | 600 | Activated 3 Å molecular sieves | |
| nitrogen | 7727-37-9 | N2 | 28.01 | Monitoring (St. Petersburg, Russia) | 99.9999 | |||
| carbon dioxide | 124-38-9 | CO2 | 44.01 | Monitoring (St. Petersburg, Russia) | 99.9999 | |||
| ammonia | 7664-41-7 | NH3 | 17.03 | Ltd. «Horst»(Moscow, Russia) | 99.99999 |
| Series I: x1 = 0.667, x2 = 0.222, and x3 = 0.111 | ||||
| Mixture abbreviation | Amine | Amine structure | Molecular solvent | |
| I-MEA/EG | MEA |  | EG | |
| I-DEA/EG | DEA |  | EG | |
| I-EDA/EG | EDA |  | EG | |
| I-TEA/EG | TEA |  | EG | |
| I-MEA/DMSO | MEA |  | DMSO | |
| I-MEA/H2O | MEA |  | H2O | |
| Series II: x1 = 0.222, x2 = 0.667, and x3 = 0.111 | ||||
| Mixture abbreviation | Amine | Molecular solvent | Additive name | Additive structure |
| II-MEA/EG | MEA | EG | ||
| II-MEA/EG/TMG | MEA | EG | TMG |  |
| II-MEA/EG/H2O | MEA | EG | H2O |  |
| II-MEA/EG/DBU | MEA | EG | DBU |  |
| II-MEA/EG/PP | MEA | EG | PP |  |
| System | a0 (g·cm−3) | 104 a1 (g·cm−3·K−1) | 104 σfit (g·cm−3) | r2 |
|---|---|---|---|---|
| Series I: x1 = 0.667, x2 = 0.222, and x3 = 0.111 | ||||
| I-MEA/EG | 1.2707 ± 0.0003 | −6.995 ± 0.008 | 0.65 | 0.99994 |
| I-DEA/EG | 1.292 ± 0.002 | −6.34 ± 0.05 | 1.32 | 0.99973 |
| I-EDA/EG | 1.2434 ± 0.0005 | −8.04 ± 0.02 | 1.57 | 0.99994 |
| I-TEA/EG | 1.2892 ± 0.0009 | −7.68 ± 0.03 | 2.56 | 0.99982 |
| I-MEA/DMSO | 1.2594 ± 0.0003 | −7.03 ± 0.01 | 0.78 | 0.99998 |
| I-MEA/H2O | 1.2944 ± 0.0009 | −5.74 ± 0.03 | 2.59 | 0.99967 |
| Series II: x1 = 0.222, x2 = 0.667, and x3 = 0.111 + 5 wt. % of additive | ||||
| II-MEA/EG | 1.2927 ± 0.0002 | −6.524 ± 0.007 | 0.57 | 0.99994 |
| II-MEA/EG/TMG | 1.291 ± 0.001 | −6.63 ± 0.04 | 3.55 | 0.99953 |
| II-MEA/EG/H2O | 1.2903 ± 0.0002 | −6.549 ± 0.007 | 0.68 | 0.99998 |
| II-MEA/EG/DBU | 1.2966 ± 0.0005 | −6.73 ± 0.01 | 1.35 | 0.99993 |
| II-MEA/EG/PP | 1.2931 ± 0.0007 | −6.65 ± 0.02 | 2.15 | 0.99983 |
| x2 | r2 | ||||
|---|---|---|---|---|---|
| Series I: x1 = 0.667, x2 = 0.222, and x3 = 0.111 + 5 wt. % | |||||
| I-MEA/EG | −3.53 ± 0.05 | 1012 ± 17 | 159 ± 1 | 2.96 | 0.99989 |
| I-DEA/EG | −4.9 ± 0.1 | 1590 ±36 | 146± 2 | 6.77 | 0.99998 |
| I-EDA/EG | −3.43 ± 0.07 | 839 ± 21 | 164 ± 2 | 5.55 | 0.99996 |
| I-TEA/EG | −2.99 ± 0.06 | 775 ± 18 | 167 ± 2 | 5.05 | 0.99997 |
| I-MEA/DMSO | −3.69 ± 0.07 | 1000 ± 21 | 160 ± 2 | 3.88 | 0.99998 |
| I-MEA/H2O | −3.58 ± 0.04 | 1249 ± 13 | 162 ± 1 | 3.21 | 0.99999 |
| Series II: x1 = 0.222, x2 = 0.667, and x3 = 0.111 + 5 wt. % of additive | |||||
| II-MEA/EG | −3.40 ± 0.08 | 1057 ± 30 | 142 ± 3 | 3.87 | 0.99997 |
| II-MEA/EG/TMG | −3.41 ± 0.09 | 1026 ± 31 | 149 ± 2 | 6.03 | 0.99996 |
| II-MEA/EG/H2O | −3.64 ± 0.08 | 1078 ± 28 | 139 ± 2 | 4.64 | 0.99997 |
| II-MEA/EG/DBU | −3.60 ± 0.04 | 1105 ± 14 | 144 ± 1 | 2.49 | 0.99999 |
| II-MEA/EG/PP | −3.83 ± 0.05 | 1183 ± 19 | 139 ± 1 | 3.08 | 0.99999 |
Disclaimer/Publisher’s Note: The statements, opinions and data contained in all publications are solely those of the individual author(s) and contributor(s) and not of MDPI and/or the editor(s). MDPI and/or the editor(s) disclaim responsibility for any injury to people or property resulting from any ideas, methods, instructions or products referred to in the content. |
© 2023 by the authors. Licensee MDPI, Basel, Switzerland. This article is an open access article distributed under the terms and conditions of the Creative Commons Attribution (CC BY) license (https://creativecommons.org/licenses/by/4.0/).
Share and Cite
Kazarina, O.V.; Golovacheva, A.A.; Markin, Z.A.; Petukhov, A.N.; Kazarin, A.S.; Atlaskin, A.A.; Sazanova, T.S.; Markov, A.N.; Kapinos, A.A.; Barysheva, A.V.; et al. How the Presence of CO2 Absorption Promoters and Composition of the Choline Chloride/Amine/Molecular Solvent Mixtures Influence Its Thermophysical Properties and Ability to Absorb Carbon Dioxide. Environments 2023, 10, 88. https://doi.org/10.3390/environments10050088
Kazarina OV, Golovacheva AA, Markin ZA, Petukhov AN, Kazarin AS, Atlaskin AA, Sazanova TS, Markov AN, Kapinos AA, Barysheva AV, et al. How the Presence of CO2 Absorption Promoters and Composition of the Choline Chloride/Amine/Molecular Solvent Mixtures Influence Its Thermophysical Properties and Ability to Absorb Carbon Dioxide. Environments. 2023; 10(5):88. https://doi.org/10.3390/environments10050088
Chicago/Turabian StyleKazarina, Olga V., Anna A. Golovacheva, Zakhar A. Markin, Anton N. Petukhov, Alexander S. Kazarin, Artem A. Atlaskin, Tatyana S. Sazanova, Artyom N. Markov, Alexander A. Kapinos, Alexandra V. Barysheva, and et al. 2023. "How the Presence of CO2 Absorption Promoters and Composition of the Choline Chloride/Amine/Molecular Solvent Mixtures Influence Its Thermophysical Properties and Ability to Absorb Carbon Dioxide" Environments 10, no. 5: 88. https://doi.org/10.3390/environments10050088