
Resilience Appraisal of Water Resources System under Climate Change Influence Using a Probabilistic-Nonstationary Approach


1
Department of Civil and Environmental Engineering, Colorado State University, 400 Isotope Dr, Fort Collins, CO 80521, USA
2
Iraqi Ministry of Water Resources, Planning and Follow Up Directorate, Baghdad 10013, Iraq
*
Author to whom correspondence should be addressed.
Environments 2023, 10(5), 87; https://doi.org/10.3390/environments10050087
Submission received: 14 March 2023
/
Revised: 4 May 2023
/
Accepted: 6 May 2023
/
Published: 14 May 2023
(This article belongs to the Special Issue Environmental Risk and Climate Change II)
Abstract
:The planning and management of water resources are being impacted by climate change, and are in need of comprehensive adaptation strategies to respond to future projections. The goal of this study is to support those strategies with a new decision-making paradigm that employs a probabilistic-nonstationary hydroclimatic scenario to examine the long-term system resilience for multiple dam objectives. The modified approach to examine resilience was applied, and uses a bottom-up approach with a modified resilience concept to achieve the long-term operation targets. The approach integrates Global Circulation Models (GCMs) with a statistical weather generator (SWG) to produce a range of future scenarios. Then, the system response is evaluated against those scenarios. The study utilizes a pre-developed SWG to synthesize different trajectories by altering three weather variables: the precipitation amount, temperature mean, and wind-speed magnitude. The proposed has four staged phases: (1) identification of the future climate exposure using different GCMs; (2) future water supply estimation for scenarios using hydrological models; (3) future water demand estimation for scenarios of all system stakeholders; and (4) evaluation of system performance resilience for the dam operational purposes. The Diyala River Basin in Iraq was selected as a case study, to apply the suggested paradigm. The analysis of the GCM outputs revealed that the rainfall mean varies between −37% and +31%; temperature mean varies between +0.4 °C and 5.1 °C; and the mean wind speed varies between −22% and 11%. Based on these ranges, the future climate trajectories were simulated. According to the examination of the system’s response to those weather changes, the precipitation is the most effective parameter, followed by the temperature change, and lastly the wind speed. Furthermore, the findings show that the existing system operating rules are reliable in terms of flood protection but vulnerable in terms of drought management. The analysis of system resilience to manage the drought was found to be 0.74 for the future trajectories, while it was 0.91 for flood protection. This indicates that project managers should prioritize the drought and water scarcity management, due to climate change impact and upstream country development. The study also shows that the suggested resilience paradigm is capable of measuring the negative effects of climate change and able to provide long-term adaptation guidance for water resources management.
1. Introduction
The most significant environmental risk in the world today is climate change, which alters not just the quantity and quality of water across place and time, but also the regularity of floods and droughts. Given the complexity of reservoir operations for fulfilling demand and protecting against flooding, uncertainty has developed about the reservoir’s capacity to operate, since climatic fluctuations have an effect on terrestrial hydrological processes [1]. Conflicts between the supply and demand continue to arise, particularly in multi-objective water resources management. As a result, the evaluation of risk caused by the consequences of climate change is turning into a major concern for hydrologist and scientists, and is necessary in the planning and management of water resources.
In addition, the validation of stationarity in long-term climatic statistics is becoming an increasingly difficult task in the planning and management of water resources. It can subvert the assumptions upon which the system was historically built and operated, due to changes in the probabilistic behavior of hydrologic variables that were previously assumed to be stationary. This may lead to the need for new approaches to be developed, in order to mitigate the risk, for example [2,3,4,5]; i.e., the systems that were designed according to the stationary assumption, in which the future statistical characteristics are equivalent to the historical data, are subject to vulnerable performance [6,7]. This provides the impetus to examine alternatives (or adaptations) to improve the system performance under climate variations, and to provide the best use of existing infrastructure, since the cost of upgrading to cope with the climate variations is high [6,8,9].
In addition to this, water resources management is predicated on the notion that a drought event may be assigned a chance of occurring and an associated return period. This is the case, despite the long-recognized shortcomings of event frequency estimating methodologies [10], and especially in light of the rising consequences of climate change, which are projected to cause nonlinear effects on hydrology that will be experienced most strongly at the extremes [11].
In order to address the growing number of unknown factors, a wide variety of experimental frameworks and methods are now being created and evaluated for possible application in the water business. System robustness is a term that is often used to define the extent or rate of the hypothetical conditions under which a water supply system maintains a satisfactory level of performance.
There has been a significant amount of work put into the development of methodologies for assessing the effects of climate change and selecting appropriate adaptations. These strategies may be broken down into two primary categories: top-down and bottom-up methods. The top-down methodology, also known as the traditional technique, involves comparing the functioning of the water resources system to a series of discrete climate projections obtained from the outputs of the Global Climate Model (GCM). These scenarios are then entered into a hydrological model to determine potential outcomes for the future water supply. The functionality of a water resources system is then evaluated, based on a selection of those potential outcomes. The use of GCM scenarios restricts decision-making capabilities, since these models can only simulate limited, discrete cases of climate variability, which results in judgments that are fraught with uncertainty. Therefore, evaluating the risks and examining the exact degree of undesirable system performances is less useful [5,7,12,13]. Furthermore, general circulation models are spatially coarse, in order to capture the high-intensity precipitation that occurs at fine spatial scales, which leads to difficult selection in the case of an adaptation strategy [14].
Using a statistical weather generator (SWG) to construct a wide range of future scenarios, including some that are beyond the limitations of the GCMs, a bottom-up strategy has been devised as a means of overcoming this obstacle. In order to develop the supply scenarios that correspond to these scenarios, hydrological models are used to implement the scenarios.
After this, the system’s reaction is analyzed in light of those potential outcomes [8,10,15]. This approach provides a view of the insights regarding the performance of the system in relation to climate changes, which enables better testing and selection of the most robust alternative management [8,10]. In addition, Moody and Brown [16], Steinschneider et al. [17], and Taner et al. [18] integrated the scenarios created by the SWG with the scenarios generated by the GCM. This allowed for the estimation of the likelihood of the occurrence of each scenario generated by the SWG. With the help of this weighing process, improved identification may be achieved for the robust alternative management.
The most recent analysis, on the other hand, uses the method of including resilience in the planning of the water resource system, which indicates that it will promote adaptation techniques that are targeted at strengthening the system’s resilience. However, there is not yet a universally accepted quantitative definition of resilience, and there is a need for more research. In the context of WRM issues, research has been carried out to investigate the possibility of using resilience as a performance-measuring criterion. Matrosov et al. [19] and Paton et al. [6] defined resilience as the average amount of time a system is constrained in some way temporarily. Fowler et al. [20] computed it as a percentage of the entire amount of time in the system’s future that it will be operating in an unacceptable condition and the chance of a system recovering once it has reached an unacceptable condition. Others calculated resilience using different methods: the inverse of the mean value of the time the system spends in an unsatisfactory state; the maximum duration of an unsatisfactory state; and the duration of the 90th fractile of observed unsatisfactory periods. All three of these methods have their advantages and disadvantages. They came to the conclusion that the maximum duration measure was the most precise and easily understood evaluation of performance. Some researchers selected a direct maximum duration calculation as the resilience metric of choice because it enables and simplifies the quantification of resilience as well as its incorporation into a mathematical programming model. This metric was also the resilience metric of choice. They argued that a resilience definition based on a maximum value is more useful than one based on a mean. This is due to the fact that the presence of small inconsequential events can lower the mean value and present an inaccurate picture of actual overall system performance. A definition of resilience based on a maximum value is more useful than a definition of resilience based on a mean. Using resilience as a performance criterion has also been investigated in a number of other areas of the human, social, and ecological systems of science. It has been inferred that promoting resilience into systems (i.e., the ability to recover quickly from detrimental periods) can be an active and effective method of dealing with changes in climate that is distinguished by future unknowable risks.
In this study, we modified the resilience methodology described by Roach et al. [21], and combined it with the nonstationary decision-making framework developed by Waheed et al. [22]. Our goal was to quantify the impact that climate change will have on the water resources system in the Diyala river basin in Iraq. The incorporation of the bottom-up approach into this context by using a stochastic weather generator in conjunction with GCM ranges to generate a wide range of different scenarios which are even wider than the GCM ranges, in order to test the water system’s response, is the novel aspect of this study. This study was carried out with the intention of determining how well the bottom-up approach would work in this context. In addition to this, the wind-speed magnitude effect was considered in different aspects, primarily in the wind energy production, but it has not been identified in resilience application. As a result, the influence of the magnitude of the wind speed will be investigated in this study. This paradigm lends itself well to the use of the recently developed resilience-based multi-objective strategy for selecting the most effective adaptation options for water resources. As part of the continuous effort to adapt to the detrimental effects of climate change, the objective of this strategy is to provide assistance to the government in optimizing the functioning of their infrastructure. The objective of this study is to investigate the possibility of choosing the most effective option from a group of Pareto optimal alternatives, based on their resilience using a probabilistic method while assuming that the system is non-stationary.
The resilience-based approach and water resources simulation model created for this study are described, after presenting the quantitative case study. Then, the results and discussion obtained from this study are presented. followed by the final study conclusions.
2. Study Area and Previous Climate Change Studies in DRB
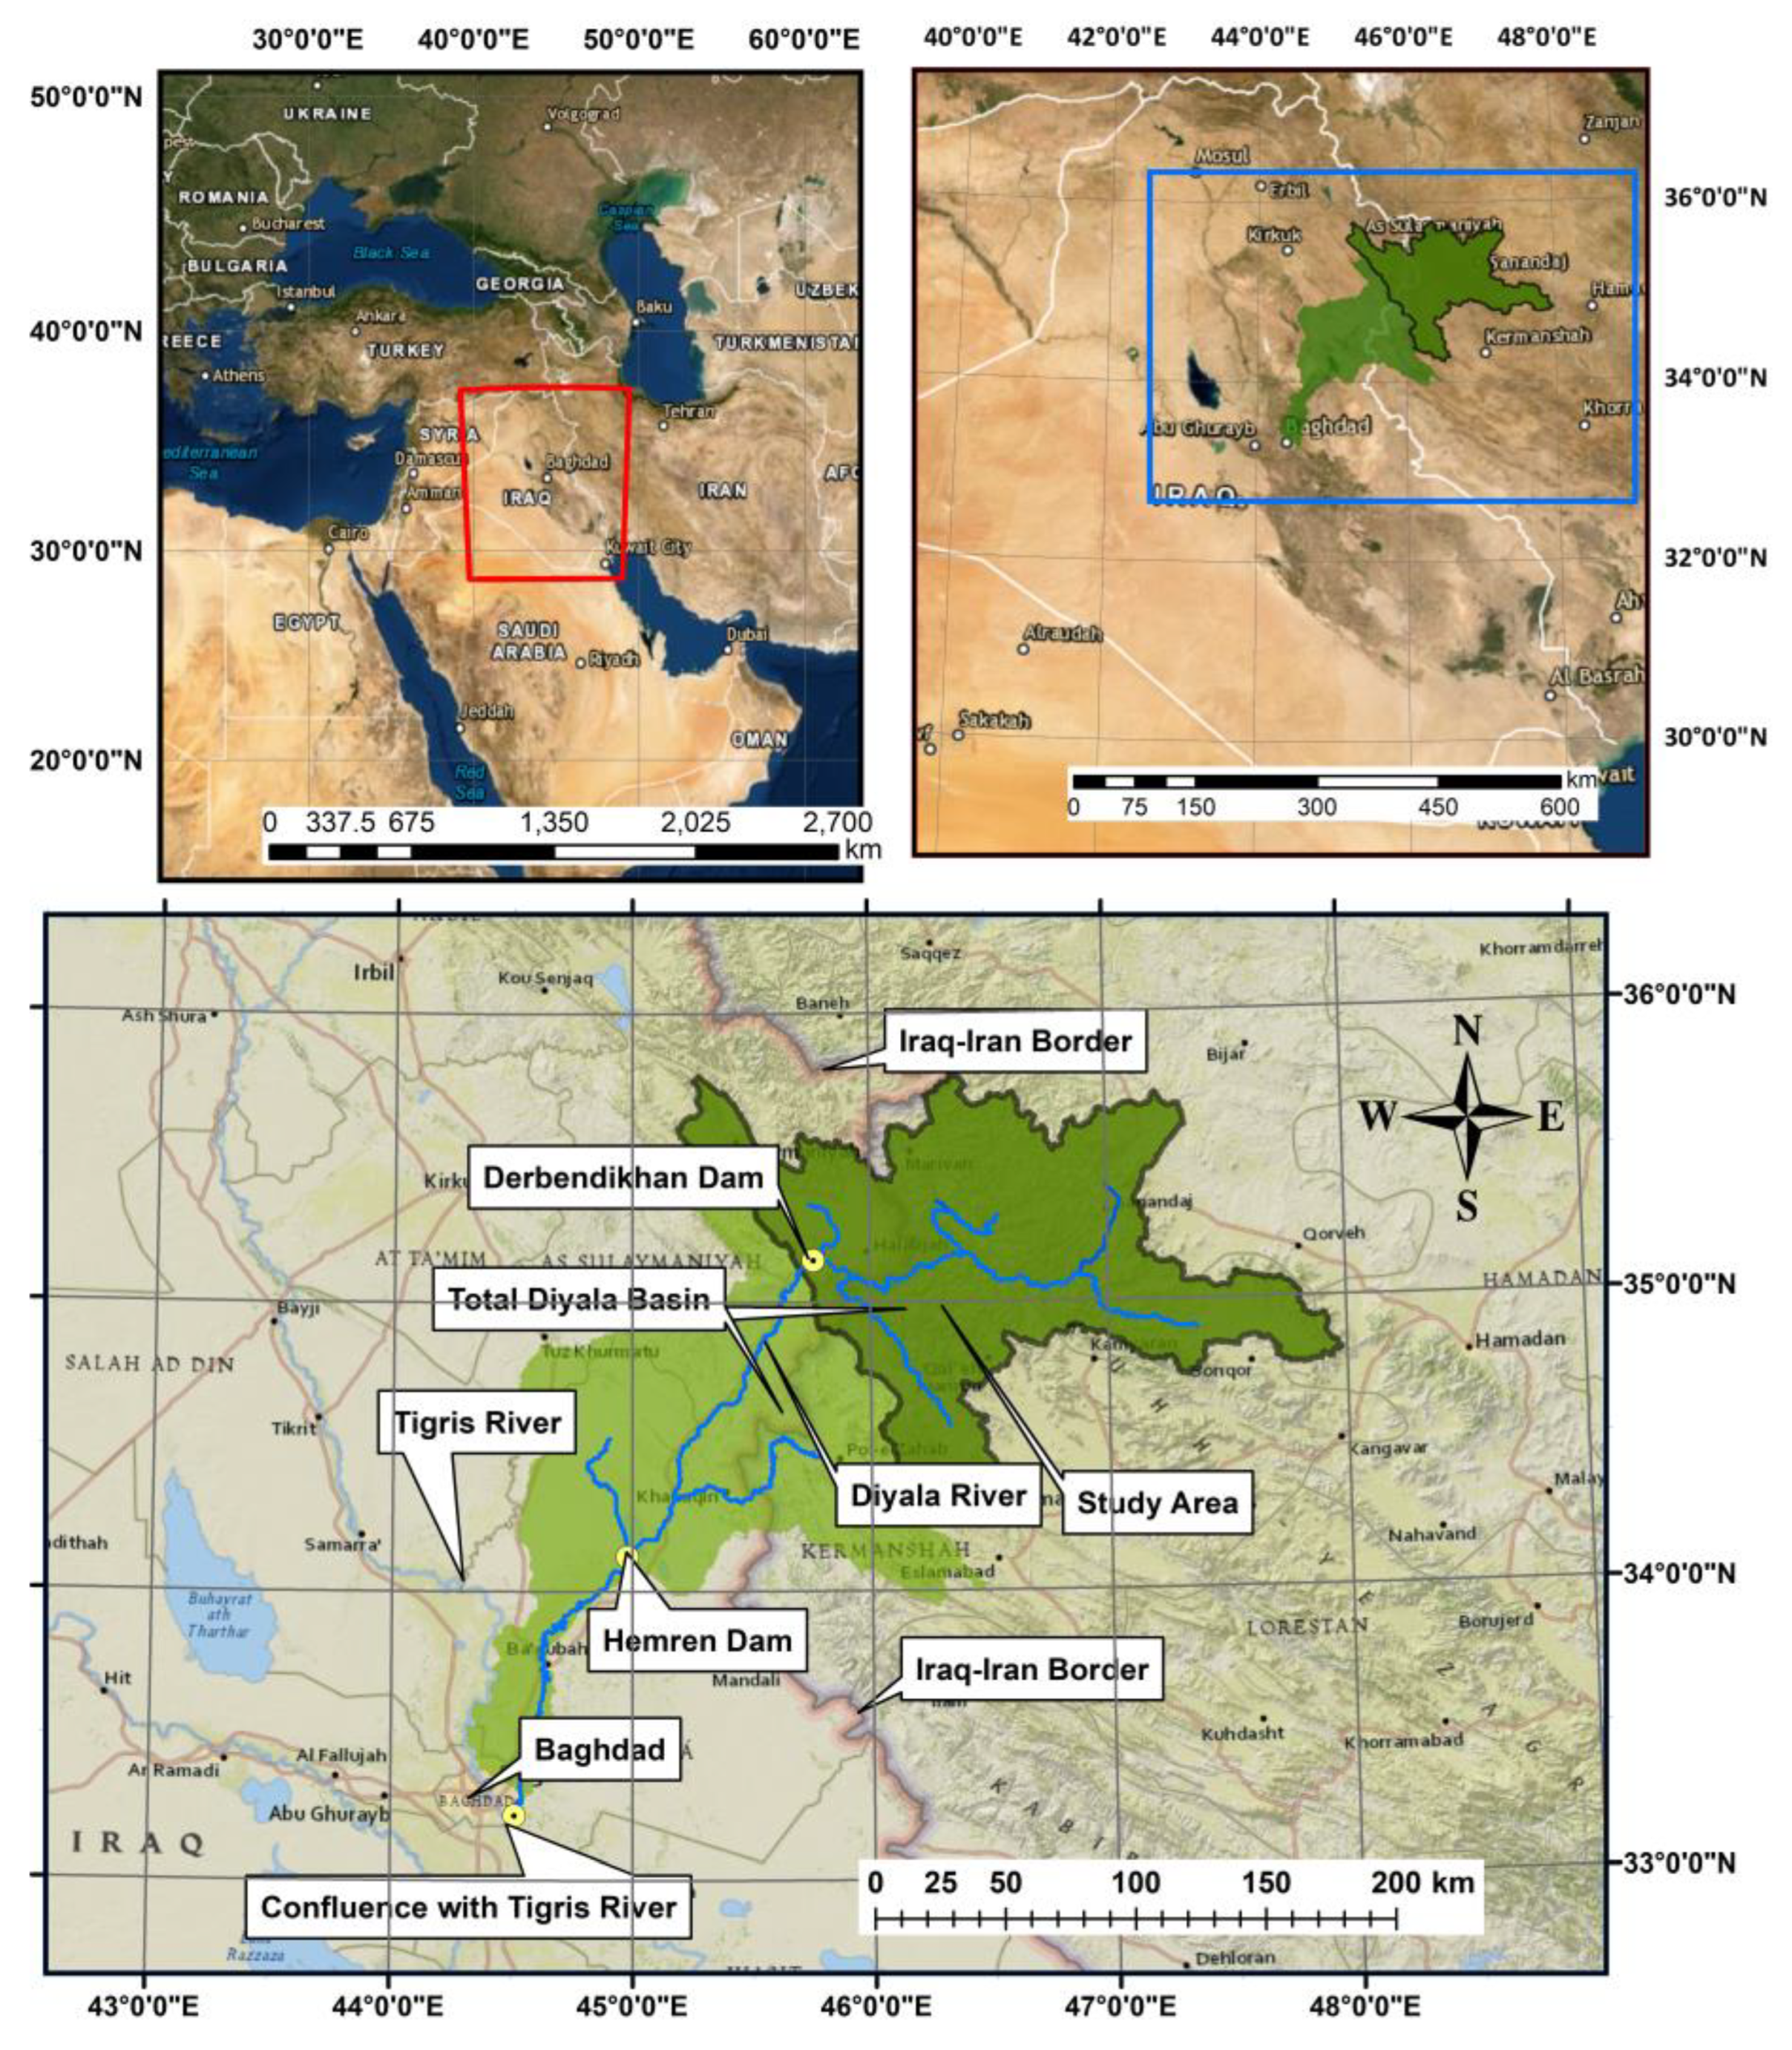
Iraq’s Diyala River is the third greatest tributary of the Tigris. It is a river that flows between Iran and Iraq. The river flows from the Zagros Mountains in Iran, through the Iran–Iraq border, and into the Tigris River, south of Baghdad. The whole length of the river is around 445 kilometers, with a total area of 32,600 square kilometers, of which 43% is located in Iraq. The basin lies between 33.216° North and 35.833° North, and 44.500° East and 46.833° East. The river’s primary tributaries are the Sirwan, Tanjeru, and Wand Rivers. Derbendikhan Dam and Hemrin Dam are being constructed in Iraq.
The Derbendikhan Dam, erected between 1956 and 1961 around 285 kilometers northeast of Baghdad (coordinates: 35°06′46″ N and 45°42′42″ E), is one of the largest dams in Iraq. It is a multi-purpose structure for drinking, irrigation, flood control, hydroelectric power production, and recreation; and the reservoir storage capacity is approximately 3 billion cubic meters. In this work, we investigate the functioning of the Derbendikhan dam by applying our goals for the upper portion of it. As illustrated in Figure 1, the overall length of the river until the Derbendikhan Dam is around 217 kilometers, and its basin area is approximately 16,760 square kilometers.
3. Methodology and Modified Framework
3.1. Resilience Approach
In the context of this research, resilience is defined as the greatest identified duration of time required for a water system to recover to normality from a water failure phase. This duration of time is then used to quantify system resilience from different weighted future trajectories, as described in the following section. A continuous stretch of time during which it is necessary to impose a temporary water restriction is what is meant here by a water failure (e.g., a temporary water-use ban in both flood and drought).
The water system that is being studied has a significant impact on the circumstances that are necessary for the occurrence of a water shortage period, and might be the drought period as well. When the water level in the reservoir system drops below an undesirable (threshold of operational role curve) level, a water deficit period is noted. This time is referred to as a water deficit. A water deficit period that is defined in this manner may be allowed to occur occasionally in order to manage the water supply system during times of drought, but it is considered unacceptable to have a reservoir that is empty, which would result in an unfulfilled water demand. The reasoning behind this decision is as follows: the amount of the water deficit threshold should be set to a suitable magnitude, so that the threshold that defines a water deficit, also known as the vulnerability of the system, may be pre-specified. However, in this technique, the frequency of deficit periods, which represents the dependability of the system, is not regulated, in order to investigate the influence of the optimization of the driving strategy by resilience alone. As for flood, it is defined when the water storage in the system is above the threshold (herein assumed to be the maximum dam level), given that the release in that period is at its maximum amount. This approach involves setting a target reliability for the system (here taken as a maximum allowable frequency of water deficit/flood periods recorded over a planning horizon) and then determining the water resources resilience.
In this study, a decision-making framework is used to investigate the system’s resilience, in order to investigate the effects that climate change will have on the system’s performance at the status quo. The Nonstationary-Probabilistic Decision-Making Resilience paradigm, referred to as NPDMR, was conceived of by Waheed et al. [22]. It was constructed using the bottom-up methodology. In the following section, a concise description of the NPDMR will be provided; however, the reader is encouraged to go to the primary work for further information.
3.2. NPDMR Framework
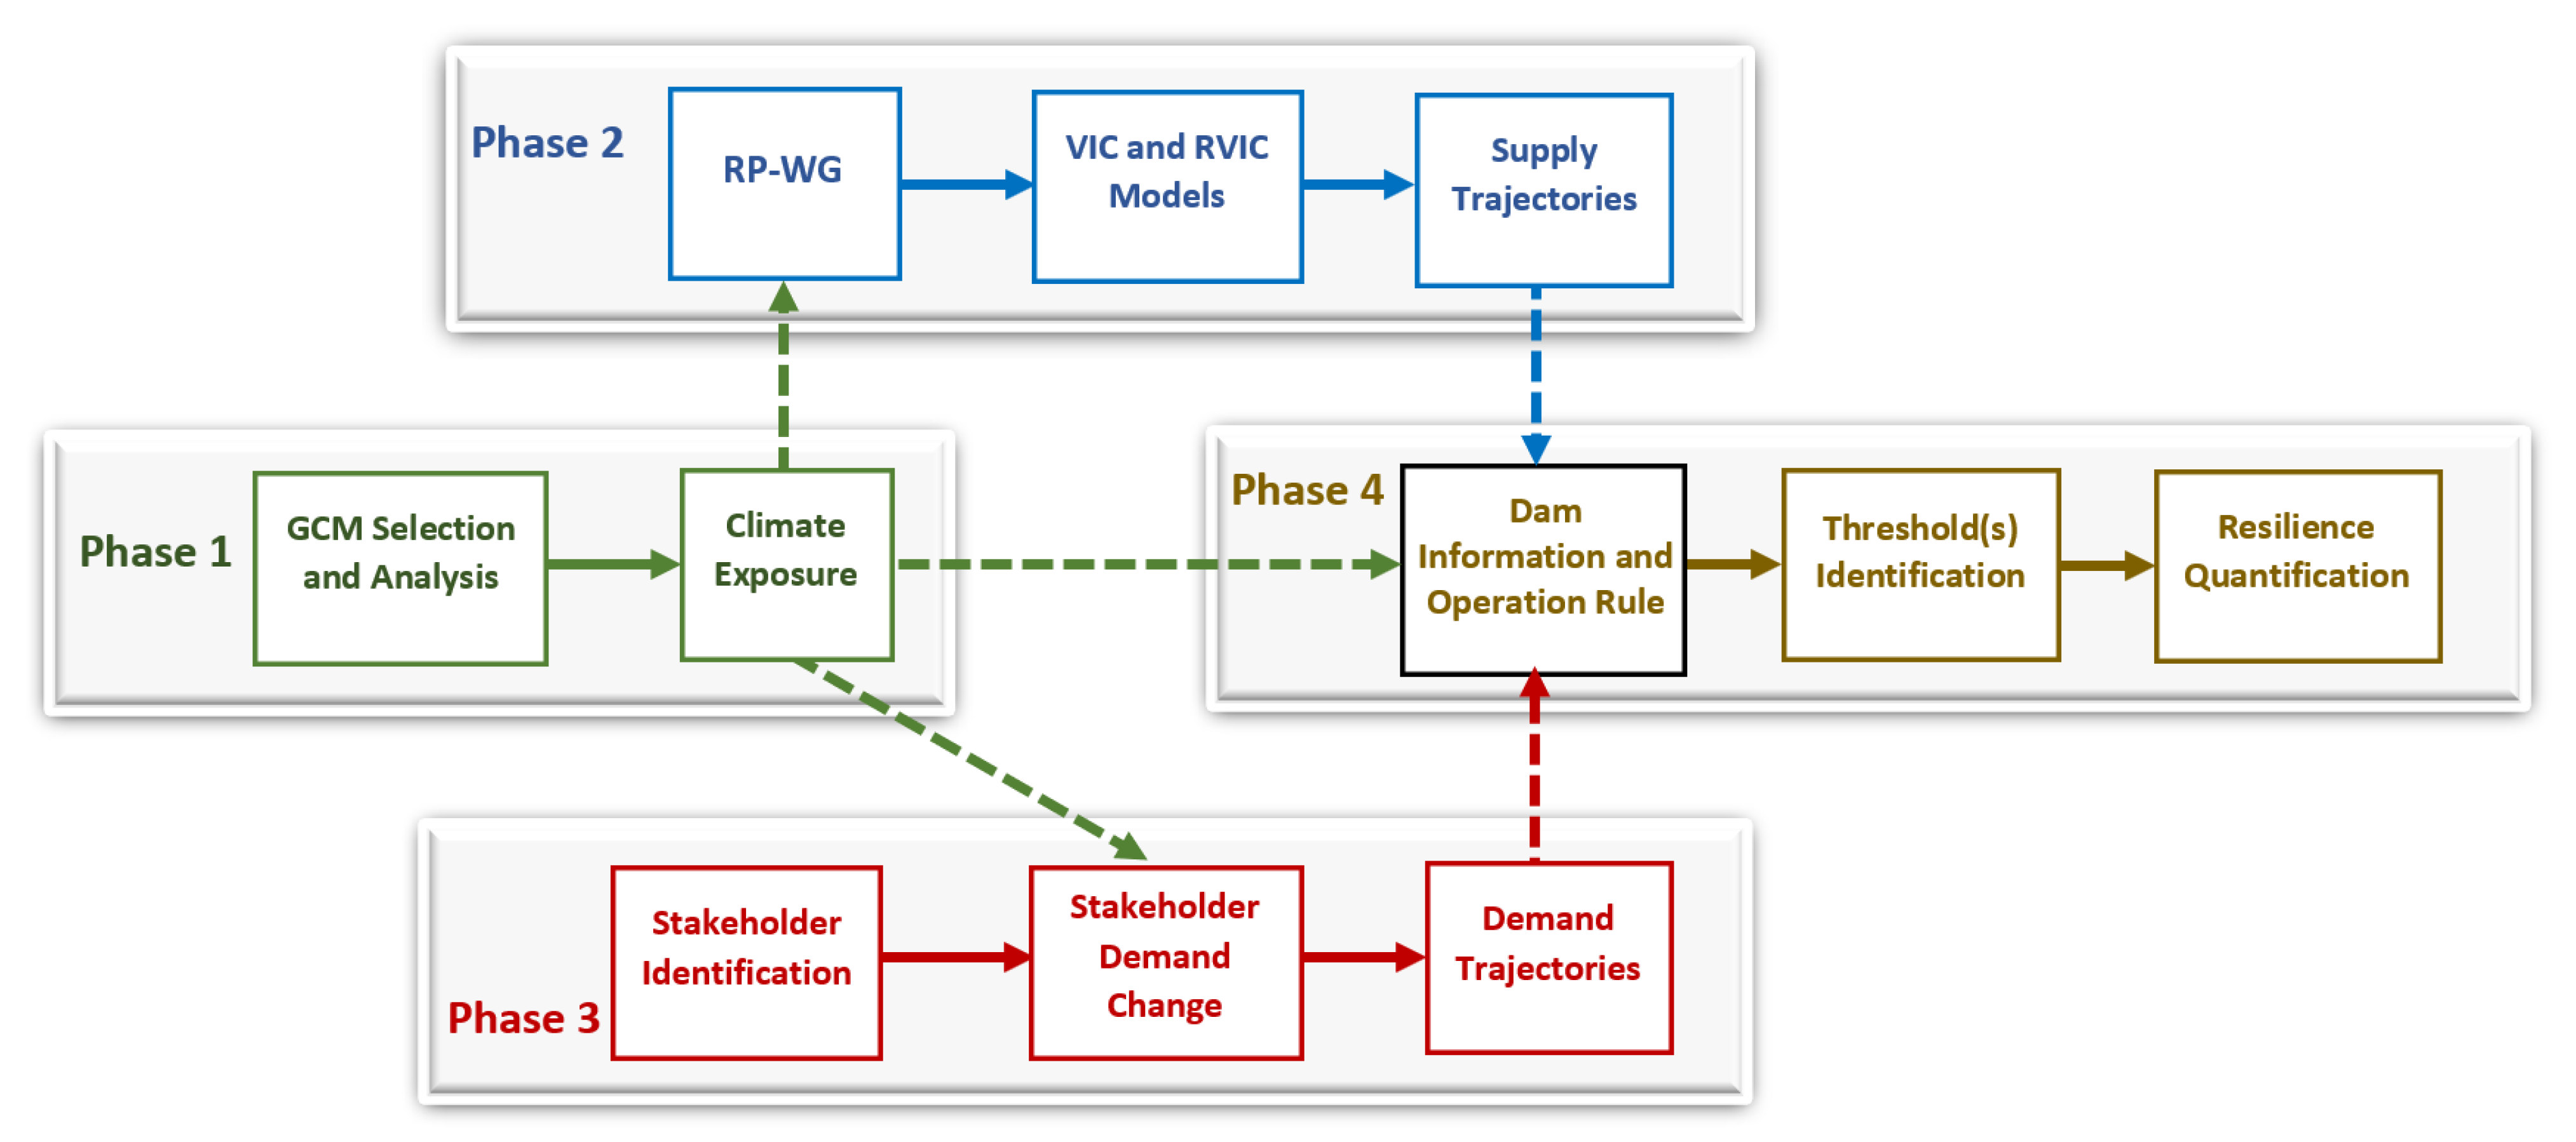
The NPDMR framework is organized in four stages, as elucidated in Figure 2. Stage 1 is designed to distinguish the future climate exposure in the study area, Θ = {θ1, θ2, … Θk}; Θ Ω. The climate exposure can be thought as the anticipated sets of hydro-climatological trajectories in the system, and can be obtained from analysis of the GCM outputs [5]. These exposures were calculated based on the outcomes of the GCM performed in the region. The recommended Coupled Model Intercomparison Project 5 (CMIP5) was analyzed for the period 2020 to 2100 as follows: CMCC, CSIRO-MK3.6.0, and CanESM2. This was carried out so that the insight from the GCM outputs could be obtained for the region. The total scenario number is 60, ranging from RCP 2.0 to 8.5; the reader should refer to Waheed et al. [22] for more details.
The purpose of phase 2 is to investigate the potential future water supply situations. Waheed et al. [24] suggested a stochastic weather generator, also known as an SWG, and verified it using data from the Diyala River basin. In this stage, the climate exposure from the previous stage is used to synthesis the future climate scenarios, based on the premise that the climate is nonstationary. After this, the climatic scenarios are used as input in hydrologic models, which results in the creation of streamflow timeseries. In order to accomplish this goal, Waheed et al. [25] created and validated two different hydrologic models: the variable infiltration capacity (VIC) model and the routing (RVIC) model. These stream flows serve as examples of potential water-supply situations for the Derbendikhan project, (S; ∀s = {s1, s2 … sk}). However, given the condition that most of the demand sectors depend on the surface water released from the dam, the direct abstraction from the groundwater was not included in this study.
In the third phase, the several possible future demand scenarios for the system are calculated. This is carried out by determining the demand stakeholder categories, which are the following: the demand per capita of the municipality, irrigation, the requirement of industry, and the requirement of the environment. After this, potential advancements in each sector are applied, while keeping in mind the influence that climate change would have on the required amount of water. After this, the potential demand scenarios for every conceivable climate impact are developed, (D; ∀s = {d1, d2 … dk}).
The objective of the construction of stage 4 is to determine how susceptible the system performance is to the influence of the climate. The following is a model of the system’s water balance, which can be found here:
where ST is the water storage in the reservoir, RE is the water release, R is the direct rainfall on the reservoir, E is the evaporation of the reservoir, SL is the seepage loss [all in m3], and t is the time index in months. Two main metrics were developed for in this study, to extend the paradigm to include the resilience term for both drought and flood conditions, according to the following system.
where STmax and REmax are the maximum storage (or the conservation/threshold level) and release of the reservoir, respectively. ResDrought and ResFlood are the resilience for each future trajectory (i,j) for the drought and flood aspects, respectively. W is a relative weight to each climate exposure J, distributed as a fat-tailed Cauchy distribution with internal climate iteration I assigned as uniform distribution, where K = J × I, as follows:
where and are the density and distribution function of the fat-tailed Cauchy distribution fitted to the analyzed GCM output in Stage 1.
3.3. SWG
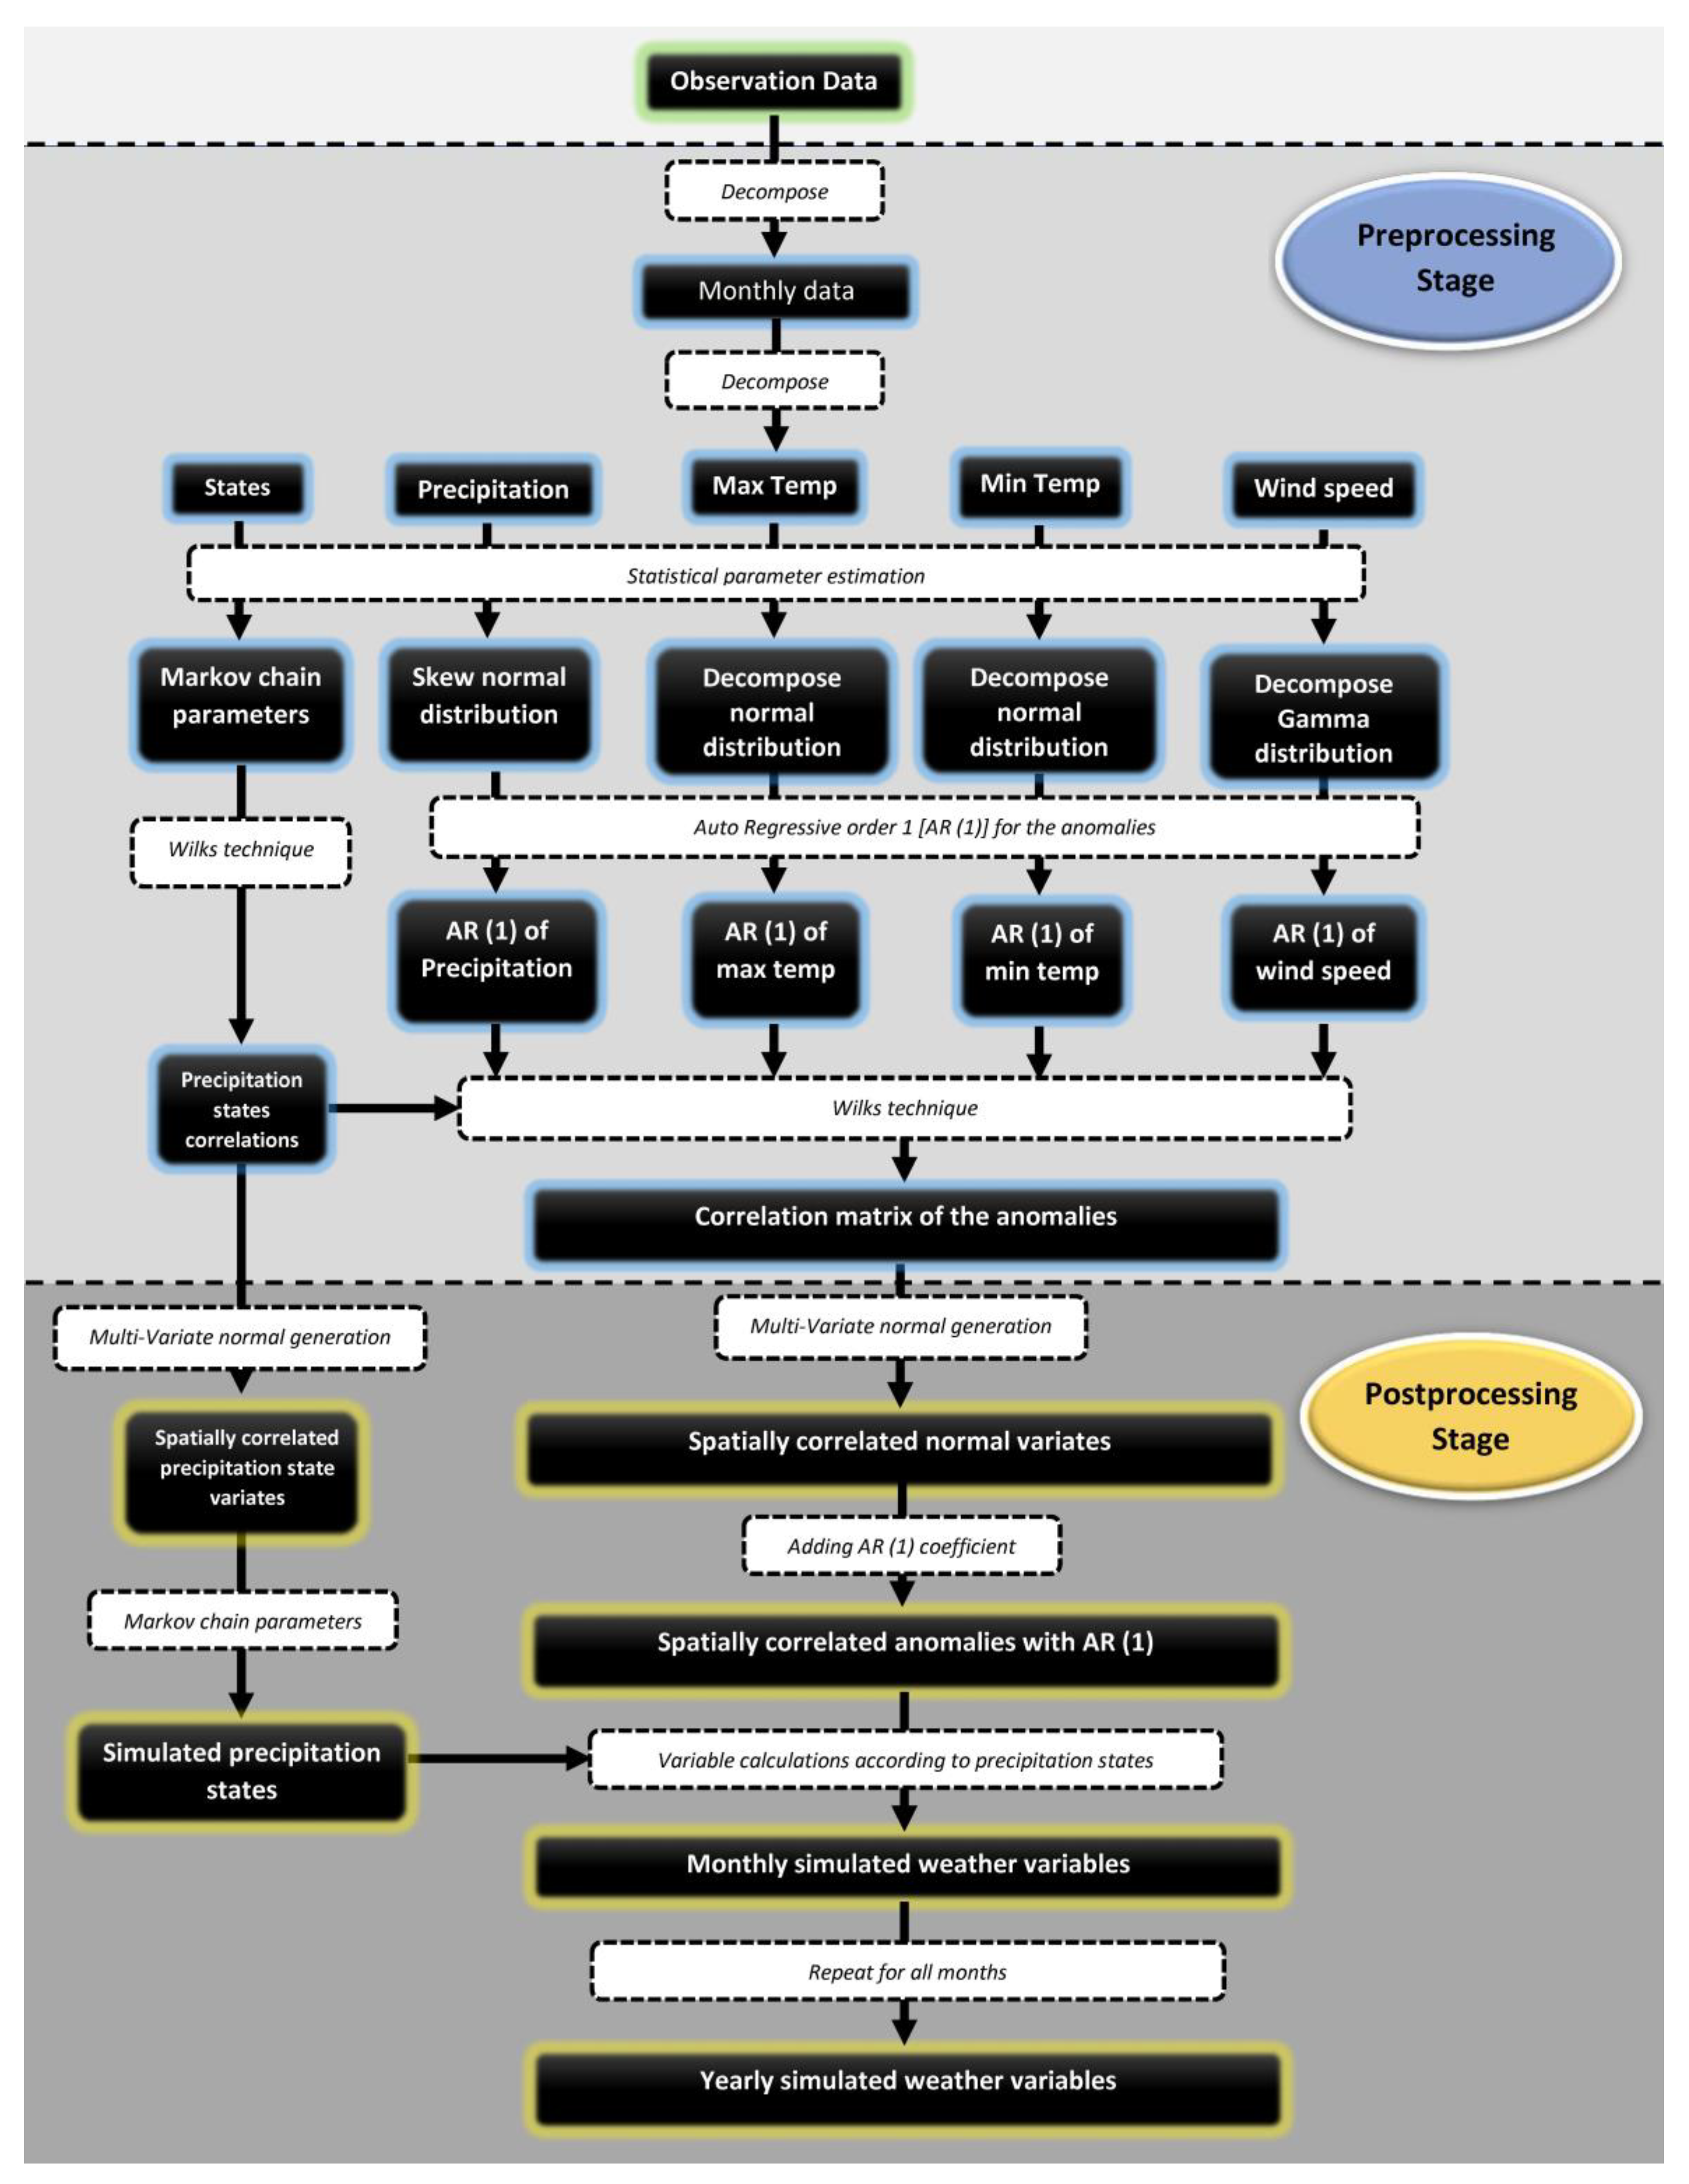
Waheed et al. [24] proposed the use of a novel SWG in order to examine the effects that climate change would have on water resource systems. It uses (1) a first-order, two-state Markov chain to produce precipitation states; (2) Wilks’ procedure to produce climate data, conserving data correlations at different nodes; and (3) statistical parameter alteration of the climate variables to project different climate exposure scenarios. All of these are based on a first-order, two-state Markov chain, to produce precipitation states. The performance of the SWG was validated in Iraq’s Diyala River Basin by simulating the statistical features of the observed variables and achieving a high level of agreement with those variables. The capacity of the SWR to accurately preserve the spatial, temporal, and cross correlations of the climate variables at all locations by making use of correlation templates is one of the most significant advantages of this method. The general model scheme is described in Figure 3.
3.4. Scenario Generation
The results of the GCM were examined and performed in the basin. According to the findings of their investigation, the following possible outcomes are proposed: (1) the mean changes in precipitation are −30, 0 and +30%; (2) the alterations in the precipitation coefficient of variation (CV) are −30, 0 and +30%; (3) the mean changes in temperature are 0, 3, and 6 Co; and (4) the precipitation coefficient of variation (CV) alterations are −30, 0 and +30%. (4) The mean changes in wind speed are −15%, 0%, and +15%, respectively. The total number of mutations, denoted by the letter J, is equal to 189, and is calculated as follows: in order to investigate the consequences of the internal climatic variability, five scenarios were developed and applied to the modification condition j. These resulted in a total number of climatic exposure scenarios that equal 945, which is 189 multiplied by 5. The resilience of the dam is evaluated using these 405 different scenarios, which account for both drought and flood conditions.
4. Results and Discussion
4.1. GCM Outputs
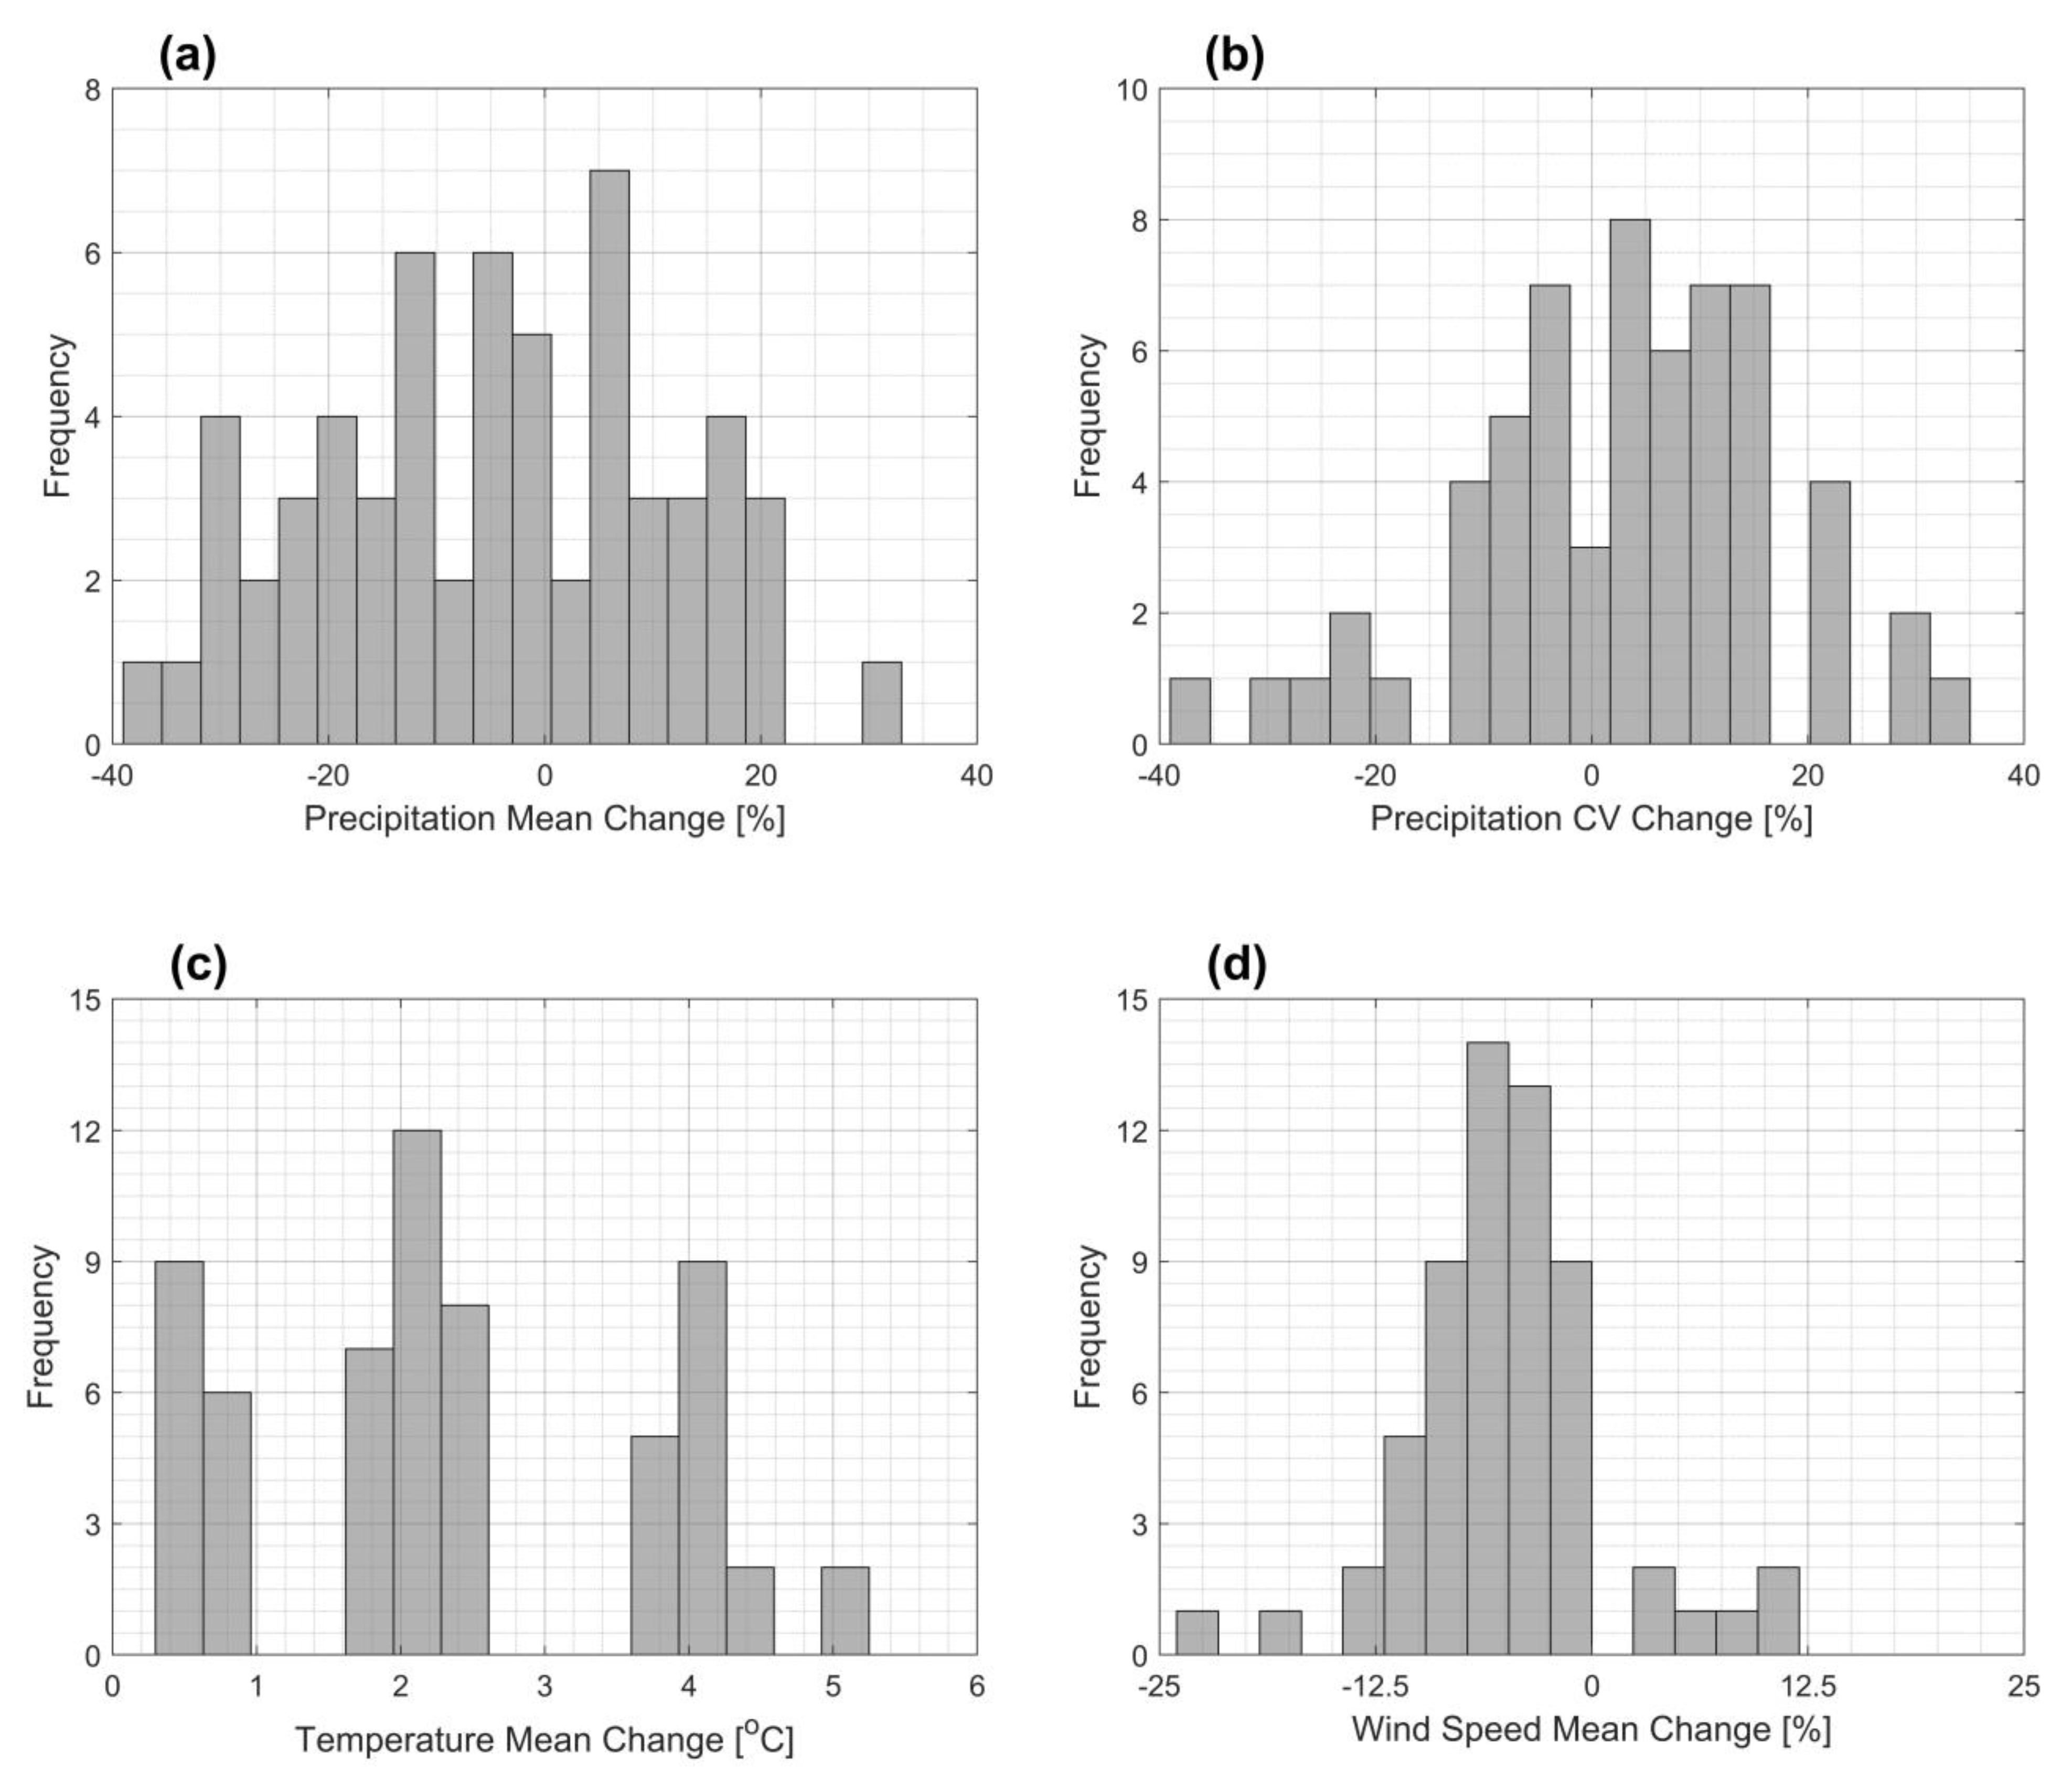
After applying EDC and taking a moving average over the past 30 years, the results of the studied CMIP5 ensemble of GCM outputs are shown in Figure 4. These outputs are from the three models that were chosen. It can be seen that the changes in precipitation mean ranged from −37.4% to +31.3% (with an average of −4.8%), while the changes in precipitation CV ranged from −38.2% to 34.0% (with an average of +2.5%), temperature mean ranged from +0.4 °C to +5.1 °C (with an average of +2.3 °C), and wind-speed magnitude mean ranged from −22.3% to 11.7% (average of −4.9).
These findings, on the other hand, are consistent with those found in previous research, which analyzed the impact of future change in a variety of regions around the globe. Turner et al. [10] examined the CMIP3 outputs in the Thomson and Yarra River Basins in Melbourne, Australia over a period of 30 years, centered on the year 2055, in comparison with the period of 30 years that spanned 1974 to 2004. The change in precipitation is from a decrease of 25 percent to an increase of 5 percent, and the temperature increase is from 0.5 degrees to 2.5 degrees Celsius higher. Whateley et al. [7] examined all of the GCM outputs for CMIP3 and CMIP5 in the Connecticut River Basin in the United States for the period 2025 to 2075, and compared them to the baseline period, which spanned the years 1950 to 1999. The change in precipitation was from −5 percent to 10 percent, and the temperature increase was from +1.5 degrees Celsius to +3.5 degrees Celsius. Steinschneider et al. [8] evaluated all of the outputs from the GCMs that were part of CMIP3 and CMIP5 in the Coralville Basin region in Iowa, United States, for the period 2041 to 2070, in comparison with the period between 1970 and 2000. The change in precipitation is from −15% to +20%, while the change in temperature is from +0.5 to +4 °C. Steinschneider et al. [17] examined multiple GCM outputs from CMIP3 in Belton Lake, which is located in Texas, United States, for the period 2041 to 2070, and compared the results to the baseline period, which was between 1971 and 2000. The mean change in precipitation ranged from −10% to +13.7%, while the precipitation coefficient of variation changed from −23% to +91%. Meanwhile, the temperature rise ranged from +1.6 to +3.3 degrees Celsius. Abbas et al. [26] studied the several GCM outputs of CMIP3 for the two time periods 2046 to 2064 and 2080 to 2100, and compared it with the baseline time period of 1980 to 2010 in the DRB. For the first period, the change in precipitation was from −26% to +40%, and the rise in temperature was from +1 to +2.7 Co. For the second period, the precipitation change was from −80% to +25%, and the increase in temperature was from +1.2 to +5.7 Co. The Vu Gia-Thu Bon River Basin in Vietnam was examined by Van Tra et al. [27], who studied certain GCM outputs there. According to the findings, there was a rise in temperature of 3.5 degrees Celsius, and a shift in precipitation which ranged from −20% to +20% Co. According to the findings of Pryor and Barthelmie [28], the change in mean wind speed from one decade to the next ranged from −30% to +30% in Europe and from −25% to +20 in the United States. Moemken et al. [29] discovered that the change in the mean wind speed was anywhere from a ten percent decrease to a fifteen percent increase throughout Europe over the period 2071–2100, when compared to the period 1970–2000.
According to the ranges that were found for each variable, the climatic exposure with the overall scenario number was generated.
4.2. Resilience Assessment
The bottom-up technique that was suggested was utilized in the process of analyzing the capability of the status quo system to control the occurrence of floods and droughts in relation to climate risk.
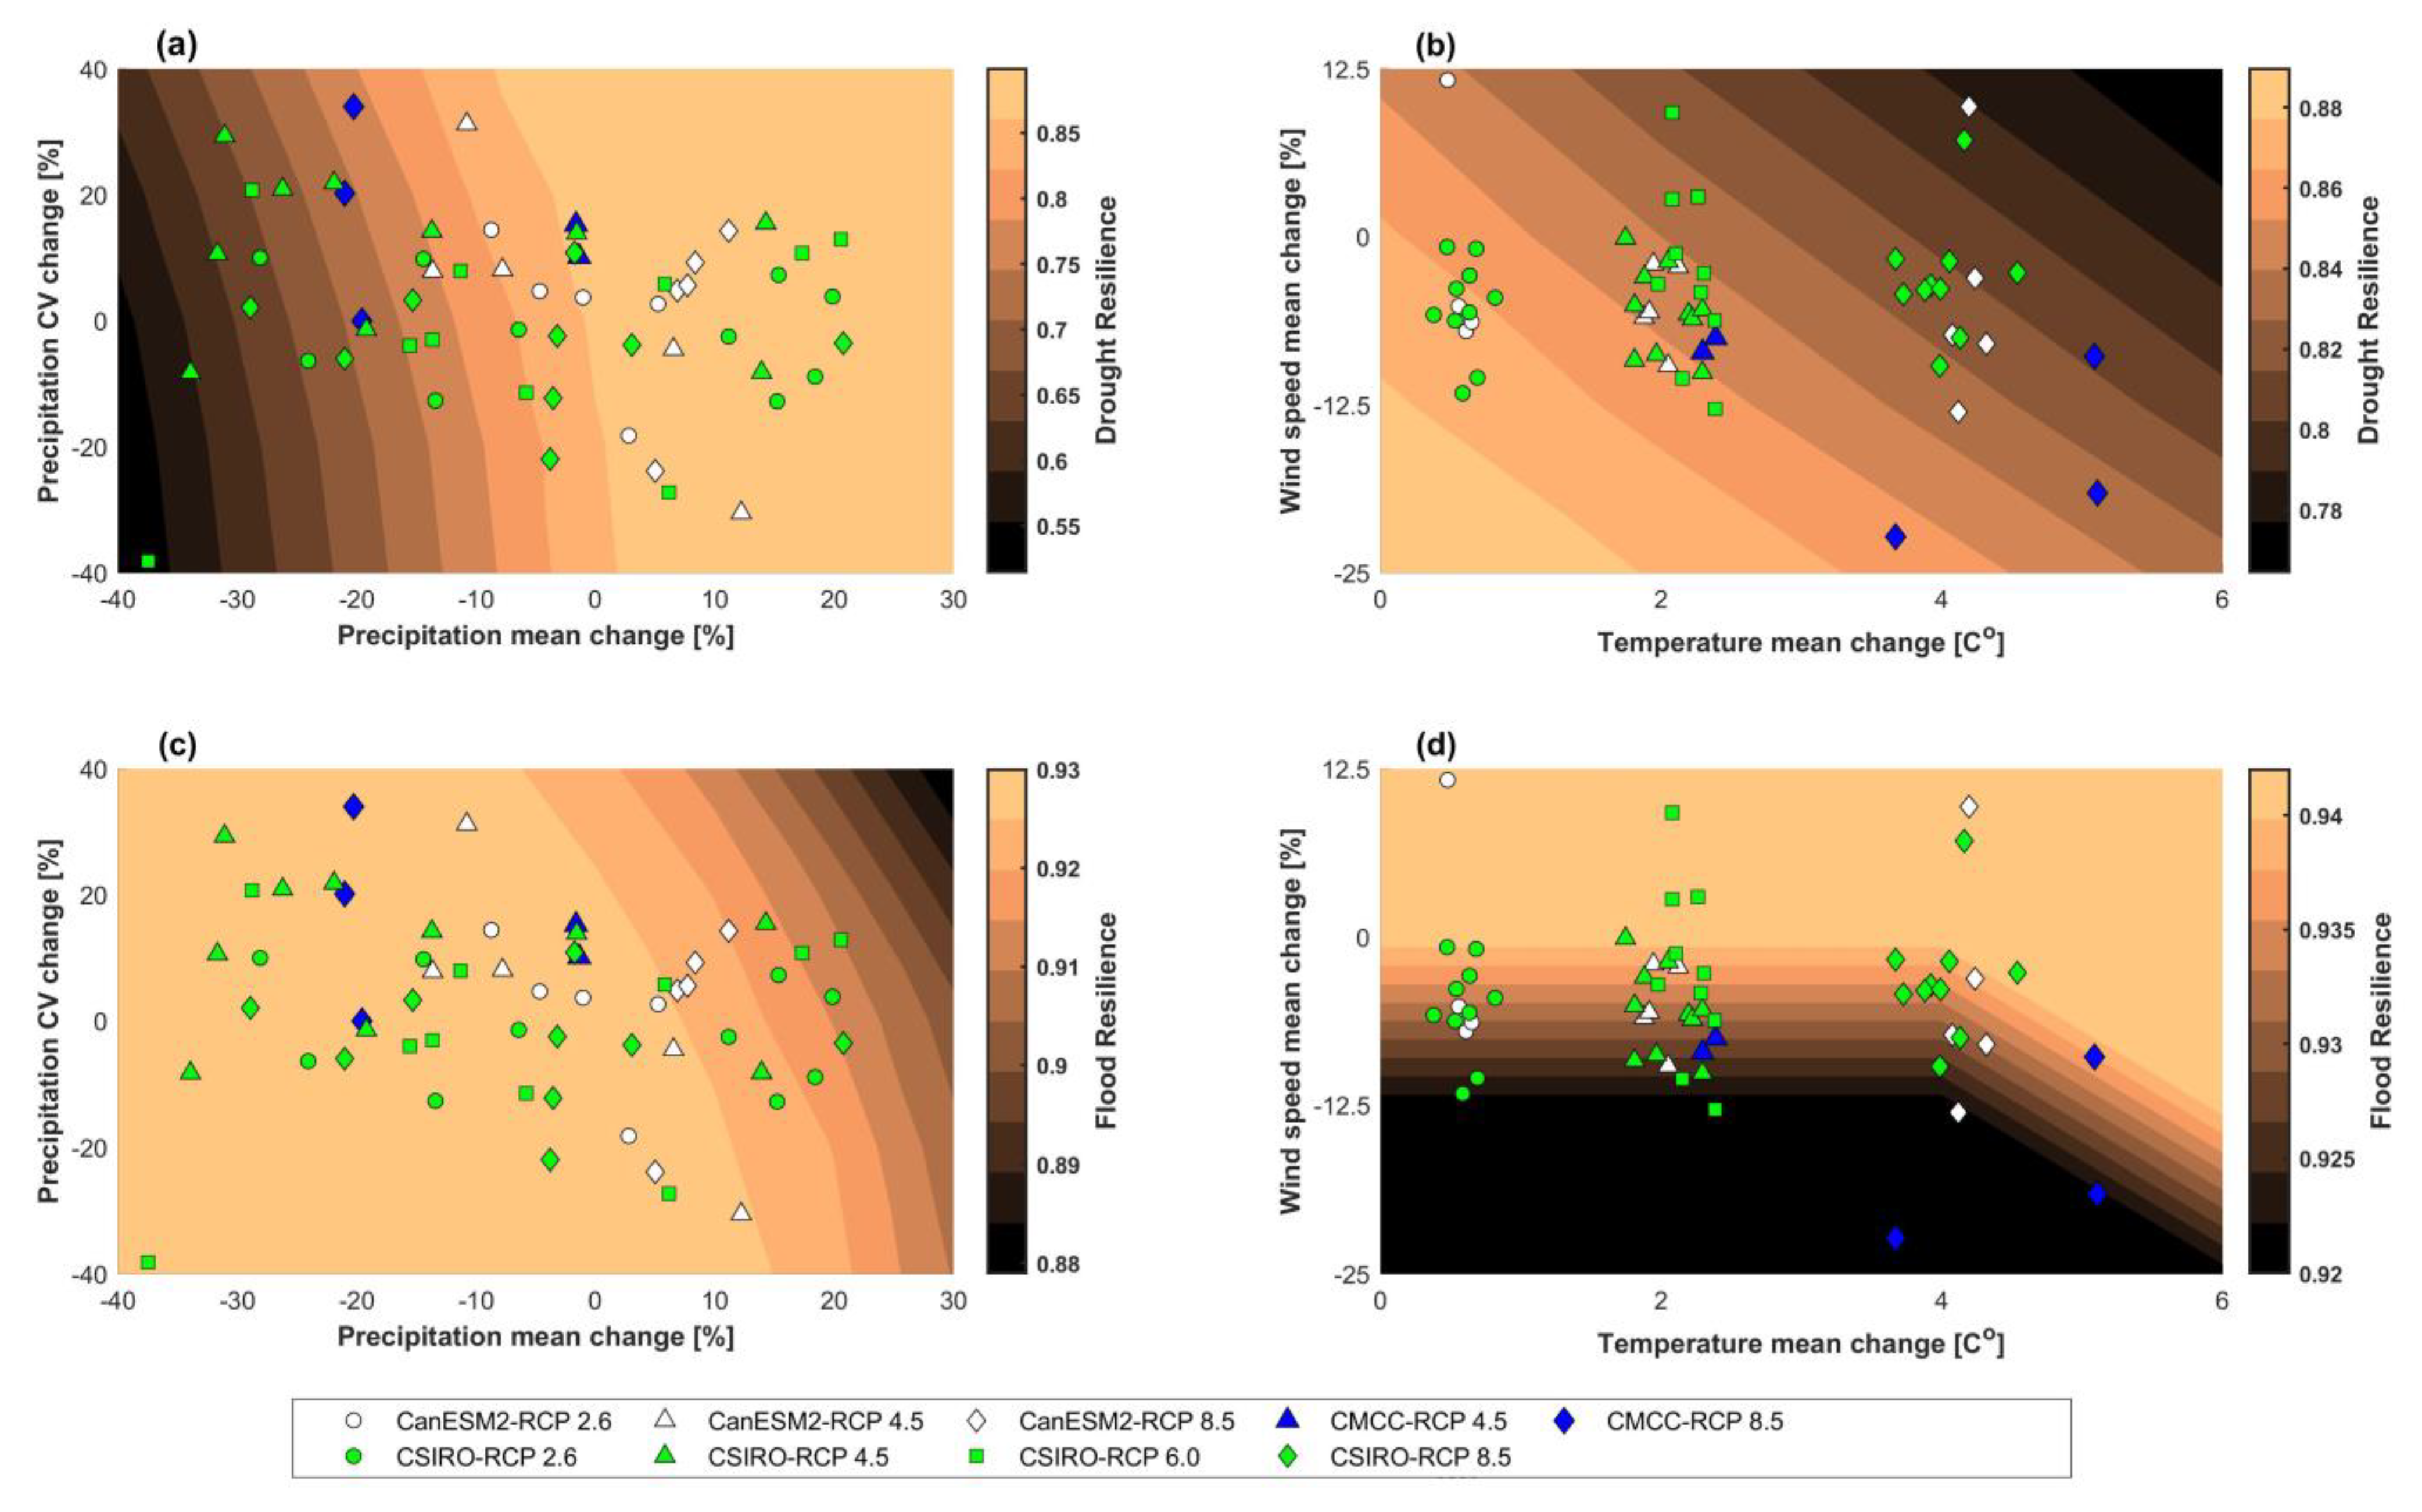
Figure 5 illustrates the findings of the resilience response surfaces of the status quo under the range of the climatic exposure for both drought and climate, according to Equations (3), (5) and (6). The change in the precipitation mean and the coefficient of variation are shown in a and c along the x-axis and the y-axis, respectively. The mean change in temperature is depicted along the x-axis in the symbol b, while the mean wind speed is depicted along the y-axis in the symbol d. After taking an average, the values that were obtained as a result of the internal climatic variability (I) are shown along the z-axis. In addition, the studied GCM outputs are shown as colored dots for the purpose of making it easier to compare the GCM outcomes with the system reaction. This one number may provide a wealth of valuable information and insights. First, the system is relatively sensitive to changes in mean precipitation, and these changes are quite abrupt in comparison to changes in any other variable. Drought and flood occurrences are both highly sensitive to variations in mean precipitation. This would imply that the mean change in precipitation is the most important factor in determining how the system reacts to either flood or drought hazards. The range of drought resilience is from 0.51 to 0.89, if there is no change in the other factors. When compared to droughts, it is interesting to note that the system is more sensitive to changes in the CV of precipitation during floods than during droughts; the ranges for flood resilience are between 0.87 and 0.93. As the amount of precipitation continues to decrease, shortage is anticipated for all stakeholders. In conjunction with a drop in supply, this is predicted to lead to a faster demand shortfall. This is due to the fact that the requirements for the demand were formed dependent on the supply. In contrast, flooding is most commonly caused by an increase in the amount of precipitation as a result of the increased rainfall that results from significant rainfall events.
However, the system is similarly sensitive to the coefficient of variation of the precipitation, albeit to a lesser extent than its mean. It is possible to think this way when increased daily precipitation variability occurs as a result of a CV increment. This would lead to more runoff being created in the upstream basin, which would induce an increase in flood incidence and deficit, albeit to a smaller degree. This indicates that the system is more capable of buffering out the impacts of variable precipitation in order to distribute the demand requirement than it is of providing flood protection. This could be due to the fact that the reservoir operation (see Equation (1)) and demand calculations were carried out on a monthly basis, whereas the runoff generation by VIC and RVIC is carried out on a daily basis. If this is the case, then this could explain why the precipitation variability has a greater influence on the supply, when compared to the demand. In light of this, CV is a less sensitive indicator for drought management, in comparison to flood risk.
In a manner parallel to the total quantity of precipitation, the system seems to be more sensitive to changes in the mean temperature during floods, in comparison to changes in temperature during droughts. The range of resistance to drought is between 0.91 and 0.94, and the range of resilience to flood is between 0.92 and 0.94. In a similar vein, the system is somewhat sensitive to changes in the mean wind speed during floods as opposed to droughts, when comparing the two. The magnitude of evapotranspiration is proportionally affected by changes in both temperature and the speed with which the wind is blowing. Additionally, when the temperature rises, there is less precipitation that may be frozen into snow. The availability of the runoff that was created would decrease as a result of the snow melting. As a result, because of the windy and warm conditions, there will be a significant rise in the demand for water, which, in conjunction with the decrease in the supply, will result in a shortfall occurring more quickly, particularly in the systems that have a large majority of irrigation projects.
As can be deduced from the information shown above, the most important factor in flood and drought occurrences is the variation in the amount of precipitation that falls, followed by the precipitation coefficient of variation, then the temperature change, and finally the wind speed. When considering draught control strategies, it is essential to take into account not just the average temperature but also the average wind speed. The findings of this study are comparable to those found in previous research [5,7,8,13,15,17,18].
In conclusion, we find that the entire system’s resilience to drought is 0.747 when we use Equation (2), and we find that the overall system’s resilience is 0.905 when we use Equation (6) for the long-term functioning of the system, up to 2100. According to the data, one may draw the following conclusion: in the long term, the operating dam is well maintained to retain appropriate performance against the flood occurrence and is capable of handling a broad variety of climate situations during the SDL. In contrast, the system that is now in place is fragile with regard to the management of drought. This indicates that it is of the highest necessity for those in charge of decision-making to devote special attention to drought and water shortages, in order to achieve sustainable water management. The findings that were acquired here show how the modified technique may be used to simplify a planning methodology, and they make it possible for decision makers to choose a strategy according to the final criteria that are most important to them.
5. Conclusions
This research offered a framework for decision-making as a means of assessing the current vulnerability of the system to the effects of long-term climate change and of gaining a better understanding of the nature of the risks involved. The purpose of the framework is to make it easier to determine the system’s resilience, with the end goal of reducing the predicted vulnerability in the future. In addition to that, the research offered a revised framework to determine the theoretical system resilience in conjunction with a bottom-up method. In doing this, the study is the first attempt to examine the influence of climate change on the decision-making process in Iraq by employing a bottom-up resilience case study.
Results obtained from the analysis of the GCM outputs show that the precipitation mean is subject to variation, from −37.4% to +31.3% (average of −4.8%); precipitation CV change varies from −38.2% to 34.0%; the mean temperature change increases from +0.4 to 5.1 °C; and the mean wind speed varies between −22% and 11%.
The status quo capability of the system to manage flood and drought occurrences against climate exposure was evaluated, and the results suggest that the system is sensitive for drought management but robust in flood protection for the long-term future climate exposure. A score of 0.747 was obtained for the overall drought resilience of the system, whereas a score of 0.905 was obtained for the overall resilience of the system. This suggests that the managers in charge of the project should devote their whole focus to the management of the drought and water shortage.
According to the findings of an examination of the system’s response to changes in the state of the weather variables, the precipitation mean is the most sensitive parameter, followed by the precipitation CV, then the temperature change, and finally the wind speed. The findings also indicate that taking wind speed into consideration throughout the decision-making process is essential, particularly when it comes to drought management.
Author Contributions
Conceptualization, S.Q.W., M.N.A. and N.S.G.; methodology, S.Q.W.; software, S.Q.W.; validation, S.Q.W.; formal analysis, S.Q.W., M.N.A. and N.S.G.; investigation, S.Q.W. and M.N.A.; resources, S.Q.W. and M.N.A.; data curation, S.Q.W.; writing—original draft preparation, S.Q.W. and M.N.A.; writing—review and editing, S.Q.W., M.N.A. and N.S.G.; visualization, S.Q.W. and M.N.A.; supervision, N.S.G. All authors have read and agreed to the published version of the manuscript.
Funding
This research received no external funding.
Data Availability Statement
Some or all data, models, or code used during the study were provided by a third party. The data implemented in this study can be shared and conjugated with approval from Iraqi Ministry of Water Resources. Direct requests for these materials may be made to the provider.
Acknowledgments
The authors are grateful to the Iraqi Ministry of Water Resources for assistance.
Conflicts of Interest
The authors declare no conflict of interest.
References
- Wang, K.; Shi, H.; Chen, J.; Li, T. An improved operation-based reservoir scheme integrated with Variable Infiltration Capacity model for multiyear and multipurpose reservoirs. J. Hydrol. 2019, 571, 365–375. [Google Scholar] [CrossRef]
- Solomon, S. (Ed.) Climate Change 2007—The Physical Science Basis: Working Group I Contribution to the Fourth Assessment Report of the IPCC; Cambridge University Press: Cambridge, UK, 2007; Volume 4. [Google Scholar]
- Milly, P.C.D.; Betancourt, J.; Falkenmark, M.; Hirsch, R.M.; Kundzewicz, Z.W.; Lettenmaier, D.P.; Stouffer, R.J. Stationarity is dead: Whither water management? Science 2008, 319, 573–574. [Google Scholar] [CrossRef] [PubMed]
- Stocker, T.F. Climate Change 2013: The Physical Science Basis; Cambridge University Press: Cambridge, UK, 2013. [Google Scholar]
- Culley, S.; Noble, S.; Yates, A.; Timbs, M.; Westra, S.; Maier, H.R.; Giuliani, M.; Castelletti, A. A bottom-up approach to identifying the maximum operational adaptive capacity of water resource systems to a changing climate. Water Resour. Res. 2016, 52, 6751–6768. [Google Scholar] [CrossRef]
- Paton, F.L.; Maier, H.R.; Dandy, G.C. Including adaptation and mitigation responses to climate change in a multiobjective evolutionary algorithm framework for urban water supply systems incorporating GHG emissions. Water Resour. Res. 2014, 50, 6285–6304. [Google Scholar] [CrossRef]
- Whateley, S.; Steinschneider, S.; Brown, C. A climate change range-based method for estimating robustness for water resources supply. Water Resour. Res. 2014, 50, 8944–8961. [Google Scholar] [CrossRef]
- Steinschneider, S.; McCrary, R.; Wi, S.; Mulligan, K.; Mearns, L.O.; Brown, C. Expanded decision-scaling framework to select robust long-term water-system plans under hydroclimatic uncertainties. J. Water Resour. Plan. Manag. 2015, 141, 04015023. [Google Scholar] [CrossRef]
- Giuliani, M.; Anghileri, D.; Castelletti, A.; Vu, P.N.; Soncini-Sessa, R. Large storage operations under climate change: Expanding uncertainties and evolving tradeoffs. Environ. Res. Lett. 2016, 11, 035009. [Google Scholar] [CrossRef]
- Turner, S.W.D.; Marlow, D.; Ekström, M.; Rhodes, B.G.; Kularathna, U.; Jeffrey, P.J. Linking climate projections to performance: A yield-based decision scaling assessment of a large urban water resources system. Water Resour. Res. 2014, 50, 3553–3567. [Google Scholar] [CrossRef]
- Allen, M.R.; Ingram, W.J. Constraints on future changes in climate and the hydrologie cycle. Nature 2002, 419, 224–232. [Google Scholar] [CrossRef]
- Hallegatte, S.; Shah, A.; Lempert, R.; Brown, C.; Gill, S. Investment decision making under deep uncertainty. Policy Res. Work. Pap. 2012, 6193, 1–41. [Google Scholar]
- Taner, M.Ü.; Ray, P.; Brown, C. Robustness-based evaluation of hydropower infrastructure design under climate change. Clim. Risk Manag. 2017, 18, 34–50. [Google Scholar] [CrossRef]
- Spence, C.M.; Brown, C.M. Nonstationary decision model for flood risk decision scaling. Water Resour. Res. 2016, 52, 8650–8667. [Google Scholar] [CrossRef]
- Zhang, E.; Yin, X.; Xu, Z.; Yang, Z. Bottom-up quantification of inter-basin water transfer vulnerability to climate change. Ecol. Indic. 2018, 92, 195–206. [Google Scholar] [CrossRef]
- Moody, P.; Brown, C. Robustness indicators for evaluation under climate change: Application to the upper Great Lakes. Water Resour. Res. 2013, 49, 3576–3588. [Google Scholar] [CrossRef]
- Steinschneider, S.; Wi, S.; Brown, C. The integrated effects of climate and hydrologic uncertainty on future flood risk assessments. Hydrol. Process. 2015, 29, 2823–2839. [Google Scholar] [CrossRef]
- Taner, M.Ü.; Ray, P.; Brown, C. Incorporating Multidimensional Probabilistic Information into Robustness-Based Water Systems Planning. Water Resour. Res. 2019, 55, 3659–3679. [Google Scholar] [CrossRef]
- Matrosov, E.S.; Padula, S.; Harou, J.J. Selecting portfolios of water supply and demand management strategies under uncertainty—Contrasting economic optimisation and ‘robust decision making’approaches. Water Resour. Manag. 2013, 27, 1123–1148. [Google Scholar] [CrossRef]
- Fowler, H.J.; Kilsby, C.G.; O’Connell, P.E. Modeling the impacts of climatic change and variability on the reliability, resilience, and vulnerability of a water resource system. Water Resour. Res. 2003, 39, 1222. [Google Scholar] [CrossRef]
- Roach, T.; Kapelan, Z.; Ledbetter, R. A resilience-based methodology for improved water resources adaptation planning under deep uncertainty with real world application. Water Resour. Manag. 2018, 32, 2013–2031. [Google Scholar] [CrossRef]
- Waheed, S.Q.; Grigg, N.S.; Ramirez, J.A. Nonstationary-probabilistic framework to assess the water resources system vulnerability: Long-term robust planning and timing. J. Water Resour. Plan. Manag. 2021, 147, 05021010. [Google Scholar] [CrossRef]
- Waheed, S.Q.; Alobaidy, M.N.; Grigg, N.S. Characterizing influence of hydrologic data correlations on climate change decision variables: Evidence from Diyala River Basin in Iraq. J. Hydrol. Eng. 2021, 26, 04021001. [Google Scholar] [CrossRef]
- Waheed, S.Q.; Grigg, N.S.; Ramirez, J.A. Development of a parametric regional multivariate statistical weather generator for risk assessment studies in areas with limited data availability. Climate 2020, 8, 93. [Google Scholar] [CrossRef]
- Waheed, S.Q.; Grigg, N.S.; Ramirez, J.A. Variable Infiltration Capacity Model Sensitivity, Parameter Uncertainty, and Data Augmentation for the Diyala River Basin in Iraq. J. Am. Soc. Civ. Eng. 2020, 25, 04020040. [Google Scholar] [CrossRef]
- Abbas, N.; Wasimi, S.A.; Al-Ansari, N. Impacts of Climate Change on Water Resources in Diyala River Basin, Iraq. J. Civ. Eng. Archit. 2016, 10, 1059–1074. [Google Scholar]
- Van Tra, T.; Thinh, N.X.; Greiving, S. Combined top-down and bottom-up climate change impact assessment for the hydrological system in the Vu Gia-Thu Bon River Basin. Sci. Total Environ. 2018, 630, 718–727. [Google Scholar]
- Pryor, S.C.; Barthelmie, R.J. Climate change impacts on wind energy: A review. Renew. Sustain. Energy Rev. 2010, 14, 430–437. [Google Scholar] [CrossRef]
- Moemken, J.; Reyers, M.; Feldmann, H.; Pinto, J.G. Wind speed and wind energy potentials in EURO-CORDEX ensemble simulations: Evaluation, bias-correction and future changes. EGU General Assembly Conference Abstracts. In Proceedings of the EGU General Assembly 2017, Vienna, Austria, 23–28 April 2017; Volume 19. [Google Scholar]
Figure 1.
Location of the study area in Iraq (adapted from Waheed et al. [23]).
Figure 1.
Location of the study area in Iraq (adapted from Waheed et al. [23]).

Figure 2.
The general steps of the NPDMs paradigm (adapted from Waheed et al. [24]).
Figure 2.
The general steps of the NPDMs paradigm (adapted from Waheed et al. [24]).

Figure 3.
The general model scheme of SWG used in this study (adapted from Waheed et al. [24]).
Figure 3.
The general model scheme of SWG used in this study (adapted from Waheed et al. [24]).

Figure 4.
The analyzed GCM outputs for the selected climate variables for the period 2020 to 2100. (a,b) are the precipitation mean and CV change, respectively. (c,d) are the mean change in temperature and wind speed magnitude, respectively.
Figure 4.
The analyzed GCM outputs for the selected climate variables for the period 2020 to 2100. (a,b) are the precipitation mean and CV change, respectively. (c,d) are the mean change in temperature and wind speed magnitude, respectively.

Figure 5.
Resilience response surfaces over climate exposure. (a,c) are the resilience response surfaces to precipitation mean change in x-axis and precipitation CV change in y-axis for drought and flood conditions, respectively. precipitation mean and CV change, respectively. (b,d) are the resilience response surfaces to temperature mean change in x-axis and wind speed magnitude change in y-axis for drought and flood conditions, respectively.

Disclaimer/Publisher’s Note: The statements, opinions and data contained in all publications are solely those of the individual author(s) and contributor(s) and not of MDPI and/or the editor(s). MDPI and/or the editor(s) disclaim responsibility for any injury to people or property resulting from any ideas, methods, instructions or products referred to in the content. |
© 2023 by the authors. Licensee MDPI, Basel, Switzerland. This article is an open access article distributed under the terms and conditions of the Creative Commons Attribution (CC BY) license (https://creativecommons.org/licenses/by/4.0/).
Share and Cite
MDPI and ACS Style
Waheed, S.Q.; Alobaidy, M.N.; Grigg, N.S. Resilience Appraisal of Water Resources System under Climate Change Influence Using a Probabilistic-Nonstationary Approach. Environments 2023, 10, 87. https://doi.org/10.3390/environments10050087
AMA Style
Waheed SQ, Alobaidy MN, Grigg NS. Resilience Appraisal of Water Resources System under Climate Change Influence Using a Probabilistic-Nonstationary Approach. Environments. 2023; 10(5):87. https://doi.org/10.3390/environments10050087
Chicago/Turabian StyleWaheed, Saddam Q., Maryam N. Alobaidy, and Neil S. Grigg. 2023. "Resilience Appraisal of Water Resources System under Climate Change Influence Using a Probabilistic-Nonstationary Approach" Environments 10, no. 5: 87. https://doi.org/10.3390/environments10050087
Note that from the first issue of 2016, this journal uses article numbers instead of page numbers. See further details here.