
Bioindication of Environmental Conditions Using Solar Park Vegetation


1
Department of Plant Biology, Faculty of AgriSciences, Mendel University in Brno, Zemědělská 1, 613 00 Brno, Czech Republic
2
Institute of Civil Engineering, Warsaw University of Life Sciences—SGGW, Nowoursynowska 159, 02 776 Warsaw, Poland
3
Department of Applied and Landscape Ecology, Faculty of AgriSciences, Mendel University in Brno, Zemědělská 1, 613 00 Brno, Czech Republic
*
Author to whom correspondence should be addressed.
Environments 2023, 10(5), 86; https://doi.org/10.3390/environments10050086
Submission received: 17 February 2023
/
Revised: 10 May 2023
/
Accepted: 11 May 2023
/
Published: 12 May 2023
Abstract
:Solar parks are currently considered a new source of carbon-free energy. At the same time, they encroach on our landscape and create new conditions for flora and fauna. Vegetation responds to changes in living conditions. The aim of this study was to evaluate the changes in soil conditions induced by solar parks using vegetation bioindicators. A vegetation assessment was carried out in a solar park located in the cadastral territory of the municipality of Unín (Czech Republic). Among the soil conditions observed, this study focused on soil moisture, pH, nitrogen availability, phosphorus availability, and salinity. A total of 77 taxa of vascular plants were identified. Based on the bioindication of vegetation, it can be concluded that there are changes in the conditions between sites under photovoltaic panels (PV) and between rows of PV panels. Under PV panels, species with extreme values of the monitored soil criteria have a higher representation. These species can tolerate salinity, deficiency, or excess nitrogen and phosphorus. Different conditions under PV panels lead to diversity in species composition. This results in significant fragmentation of solar couplet vegetation. However, extreme conditions may create room for invasive plant species to establish themselves. Thus, it is necessary to monitor changes in vegetation, especially under PV panels, in the following years. The characterization of environmental conditions based on vegetation biomonitoring shows the diversity of solar park conditions. Diverse conditions are also important for landscape fragmentation.
1. Introduction
Today’s world is powered by conventional fossil fuels, such as coal, gasoline, diesel, and natural gas. Fossil fuels are convenient to use, however, they also have their consequences, including the release of harmful NOX, SOX, and COX gases [1]. Recently, the increase in demand for energy, concerns about the state of the natural environment, and the shortage of fossil fuel resources—as well as the Ukraine-Russia conflict—have resulted in increased interest in alternative sources of clean and renewable energy [2,3]. In addition, the outbreak of military conflict has impacted supply chains and the availability of fossil fuels, which are particularly needed in the energy sector worldwide [4]. One way to solve this energy crisis is to increase the use of renewable energy as a power source. In the renewable energy sector, solar energy is one of the best alternative energy sources because it has less harmful effects on the surrounding environment. In terms of sustainability and quality, solar energy has the potential to meet current energy needs [1,5].
Solar energy is one of the most rapidly growing carbonless energy technologies. In 2016, the global increment of network capacity was made up of one-third of solar energy [6]. The capacity of solar energy is increasing and is assumed to increase by up to 50% between 2019 and 2024 [7]. Solar photovoltaics (PV) are pioneers in the transformation of the energy sector [7,8]. Solar energy can mitigate climate change by reducing greenhouse gas emissions generated by burning fossil fuels [9,10,11].
A large part of the PV capacity is represented by ground solar parks with PV modules assembled on supports and arranged in rows on land. In 2018, solar parks accounted for up to 70% of newly installed PV capacities worldwide [12]. Solar parks have been built across European countries, including Germany and the United Kingdom, and have become an increasingly common landscape feature [13]. Similarly, as in other extensive construction projects, there are various potential impacts on the environment that have been evaluated, including impacts on free-living organisms [14,15].
Solar parks are permanent sites that can affect local flora and fauna [16,17]. Short-term disturbances in living conditions for plants and animals during solar park construction usually stabilize after some time, thanks to which the site of the solar park can become a refuge for species from neighboring continually disturbed plots and provide food sources and places to hide from predators. This may have led to increased biodiversity [18].
However, the impact of the construction and operation of solar parks on local ecosystems has not been thoroughly investigated so far. It is, therefore, necessary to study the impacts of solar parks on the local environment to prevent the mitigation of climate change from being replaced by the degradation of local ecosystems owing to the development of solar parks [19]. Some authors have observed increased biodiversity thanks to solar parks, for example in Germany [20] and Great Britain [21]. In an agricultural landscape that is often intensively farmed and poor in species, solar parks can increase biodiversity [22]. Higher biodiversity can provide opportunities to enhance ecosystem functions and contribute to ecosystem stability [23,24]. Pollination is a critical ecosystem function [23,24]. Pollinators form a group of diverse animals, although a greater part of them is represented by insects and bees are particularly important [25]. Their activities preserve populations of wild-growing plant species, contribute to the stability of ecosystems, and ensure agricultural production [26].
The technical literature describes some effects of solar parks on local environments, such as climate change (air temperature, precipitation, and evapotranspiration), changes in soil properties (carbon cycle, microbial composition of soil communities), and changes in vegetation (productivity of plants and aerial biomass) which are particularly important for horticultural crops, as recently reported in wine grape [27,28,29,30,31]. If such changes occur, they induce a response in the vegetation composition of solar parks. Several studies have demonstrated correlations between environmental properties and the occurrence of several plant species [32,33,34,35]. The ecological amplitude (tolerance range) of plant communities is usually larger than that of individual species [36,37]. Bioindication by means of plants has been described for a range of site conditions, that is, climatic, soil, and hydrological but also those related to the intensity of human activities in the biosphere [38,39]. The significance of nitrogen (N) is often mentioned for the formation of vegetation composition and its changes [40] in connection with air pollution and the anthropogenic supply of N [41]. However, several studies have confirmed that changes in vegetation are induced by other nutrients and soil parameters [42,43].
Solar park vegetation is a basic component of new local ecosystems and provides valuable data on local environmental conditions. By analyzing the solar park vegetation composition, one can gain information about the local living conditions. The objectives of this study were to (i) determine the species composition of vegetation at different sites within the solar park; (ii) conduct biomonitoring using solar park vegetation; and (iii) determine the importance of the solar park to the local ecosystem and landscape.
2. Materials and Methods
2.1. Characteristics of the Territory
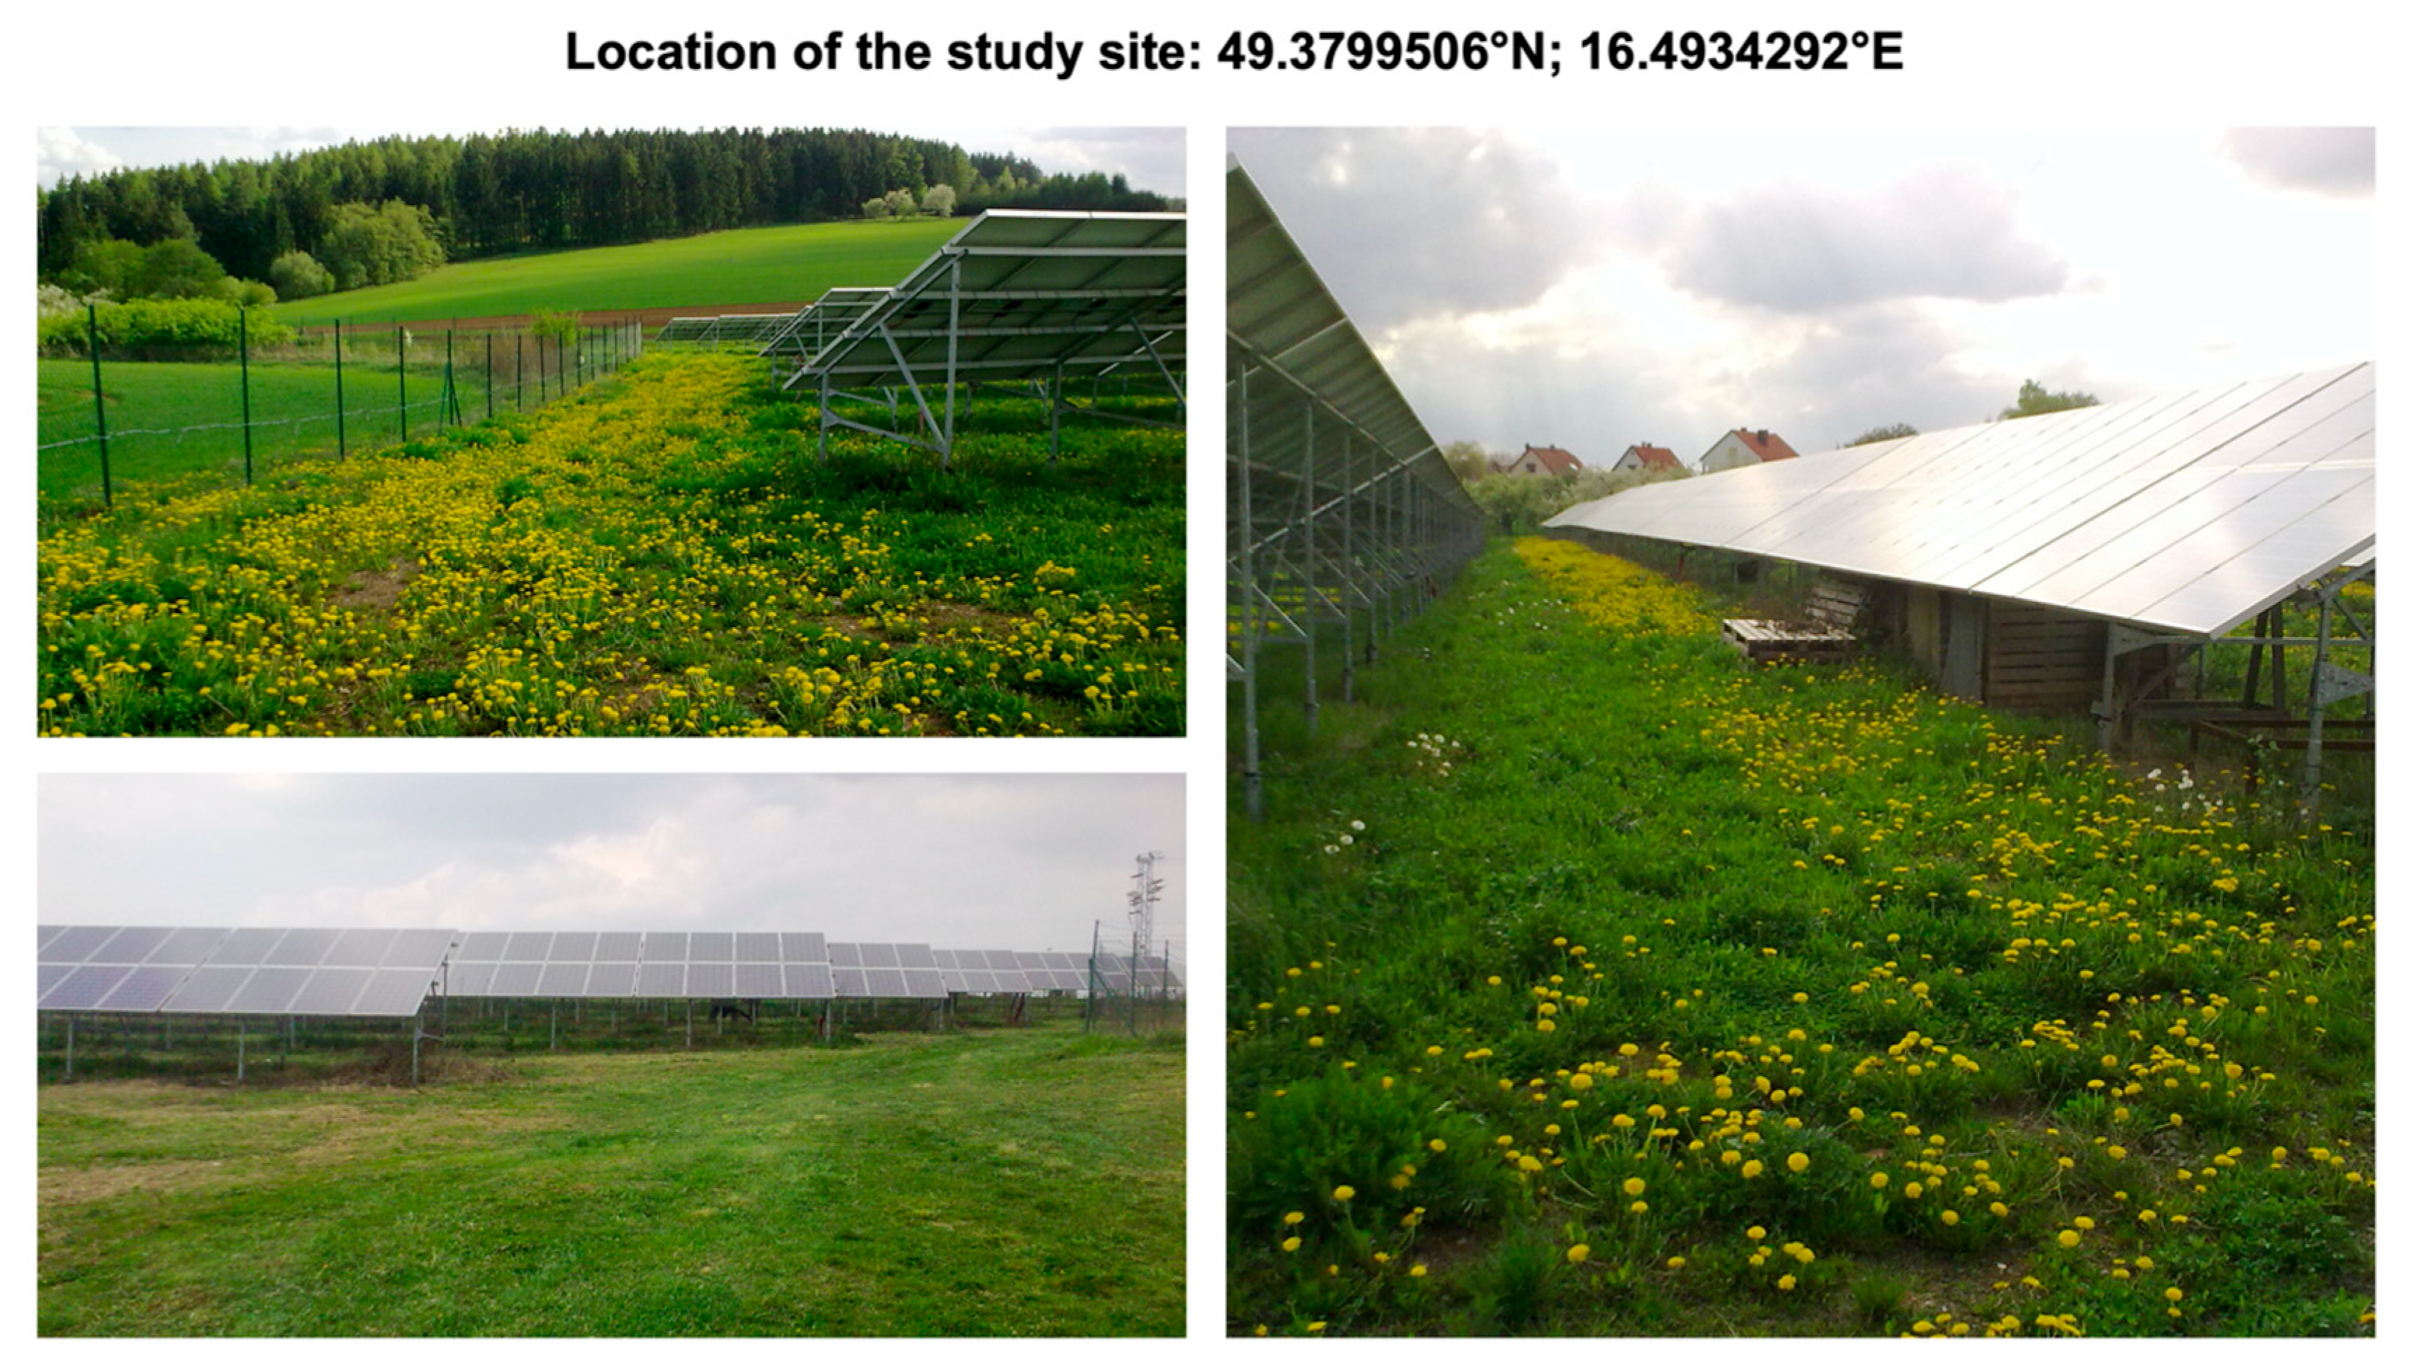
The solar park is situated in the cadastral area of Unín (South-Moravian Region, Czech Republic (CZ); GPS: 49.3799506° N; 16.4934292° E) (Figure 1). The area is in a mildly warm and moist climatic region with a mean annual temperature of 6–7 °C and total annual precipitation amount of 650–750 mm. The area is located in the territory of Boskovická brázda Furrow, at an altitude of 461 m. The soil unit is formed by Eurobasic to basic cambisols on sandstone, Permocarbon, and flysh. The moderately skeletal up to moderately heavier soil is oriented in a flat to medium slope to the southwest [44,45].
The solar park is on a land property of 4966 m2, which used to be farmland before the PV plant construction. In previous years, wheat, rapeseed, and barley were grown here. The photovoltaic power plant was built there in the second half of 2009, its installed capacity being 0.627 MW.
2.2. Methodology of Vegetation Assessment
Vegetation was assessed using the method of phytocoenological relevés, the size of which was 20 m2 (2 × 10 m). In the solar part, the relevés were recorded at different locations—between the PV panels and under the PV panels. At each location, three permanent plots were laid out, on which the relevés were recorded. The relevés were recorded on the same plots in 2016, 2017, and 2018, at all times in spring, summer, and autumn. All present vascular plant taxa (mainly species) were recorded, and their cover was estimated using a modified Braun-Blanquet nine-grade scale [46]. The taxonomic nomenclature of plants followed that of Kaplan et al. [47].
Vegetation between the PV panels is controlled by mowing and mulching. The frequency of management measures is adjusted so that the height of the vegetation does not reach the height of the panels and which are not shaded. Vegetation under the PV panels is controlled by mowing with the removal of biomass and the application of total herbicides.
In the study area, the cover values of different plant species were determined using multivariate analysis of ecological data. This analytical method was chosen based on the length of the gradients detected through Detrended Correspondence Analysis (DCA). The purpose of this study was to understand the relationships between different plant species and their environments.
Canonical Correspondence Analysis (CCA) was performed as part of the multivariate analysis. CCA helps identify the environmental variables most strongly associated with the distribution of plant species. Using both DCA and CCA, it was possible to gain a more comprehensive understanding of the plant community in the study area.
To establish statistical significance, a Monte Carlo test was conducted using 999 calculated permutations. This test is a non-parametric statistical method that can be used to analyze complex datasets, such as those obtained through multivariate analysis. It involves creating multiple random permutations of the data and calculating a test statistic for each. By comparing the actual test statistics to the distribution of test statistics obtained from the permutations, it was possible to determine whether the observed pattern was statistically significant.
Finally, the data were processed using the SW Canoco 4.0. This software is specifically designed to analyze multivariate ecological data and is widely used in ecological research. Using this software, it was possible to conduct a comprehensive and rigorous analysis of plant communities in the study area [48].
Based on the database compiled by Tyler et al. [49] criteria were chosen, characterizing 5 selected soil conditions. Plant species were used for the bioindication of local soil conditions.
The first criterion was soil moisture content, which is expressed as average and realized moisture content together with water conditions in the niche of plant species. The criterion is expressed by the bioindication scale of seven degrees: (i) Mo1 = very dry; (ii) Mo2 = dry; (iii) Mo3 = mildly dry; (iv) Mo4 = average moisture content, common water regime; (v) Mo5 = moderately moist, not occurring on extremely wet or dry niches; (vi) Mo6 = moist, not occurring on extremely dry niches; (vii) Mo7 = wet soils; (viii) Mo8 = wet and poorly aerated soils; (ix) Mo9 = temporarily flooded; (x) Mo10–Mo12 = permanently flooded.
The following criterion is soil reaction (pH) and it is a mean realized value of soil pH typical for the occurrence of plant species. In this criterion, a scale of eight degrees is used: (i) pH1 = on strongly acidic only (pH < 4.5); (ii) pH2 = moderately to strongly acidic; (iii) pH3 = moderately acidic (pH 4.5–5.5); (iv) pH4 = moderately acidic; (v) pH5 = mildly acidic (pH 5.5–6.5); (vi) pH6 = mildly acidic to neutral pH; (vii) pH7 = neutral to weakly alkaline (pH 6.5–7.5); (viii) pH8 = occurring only on alkaline soils (pH > 7.5).
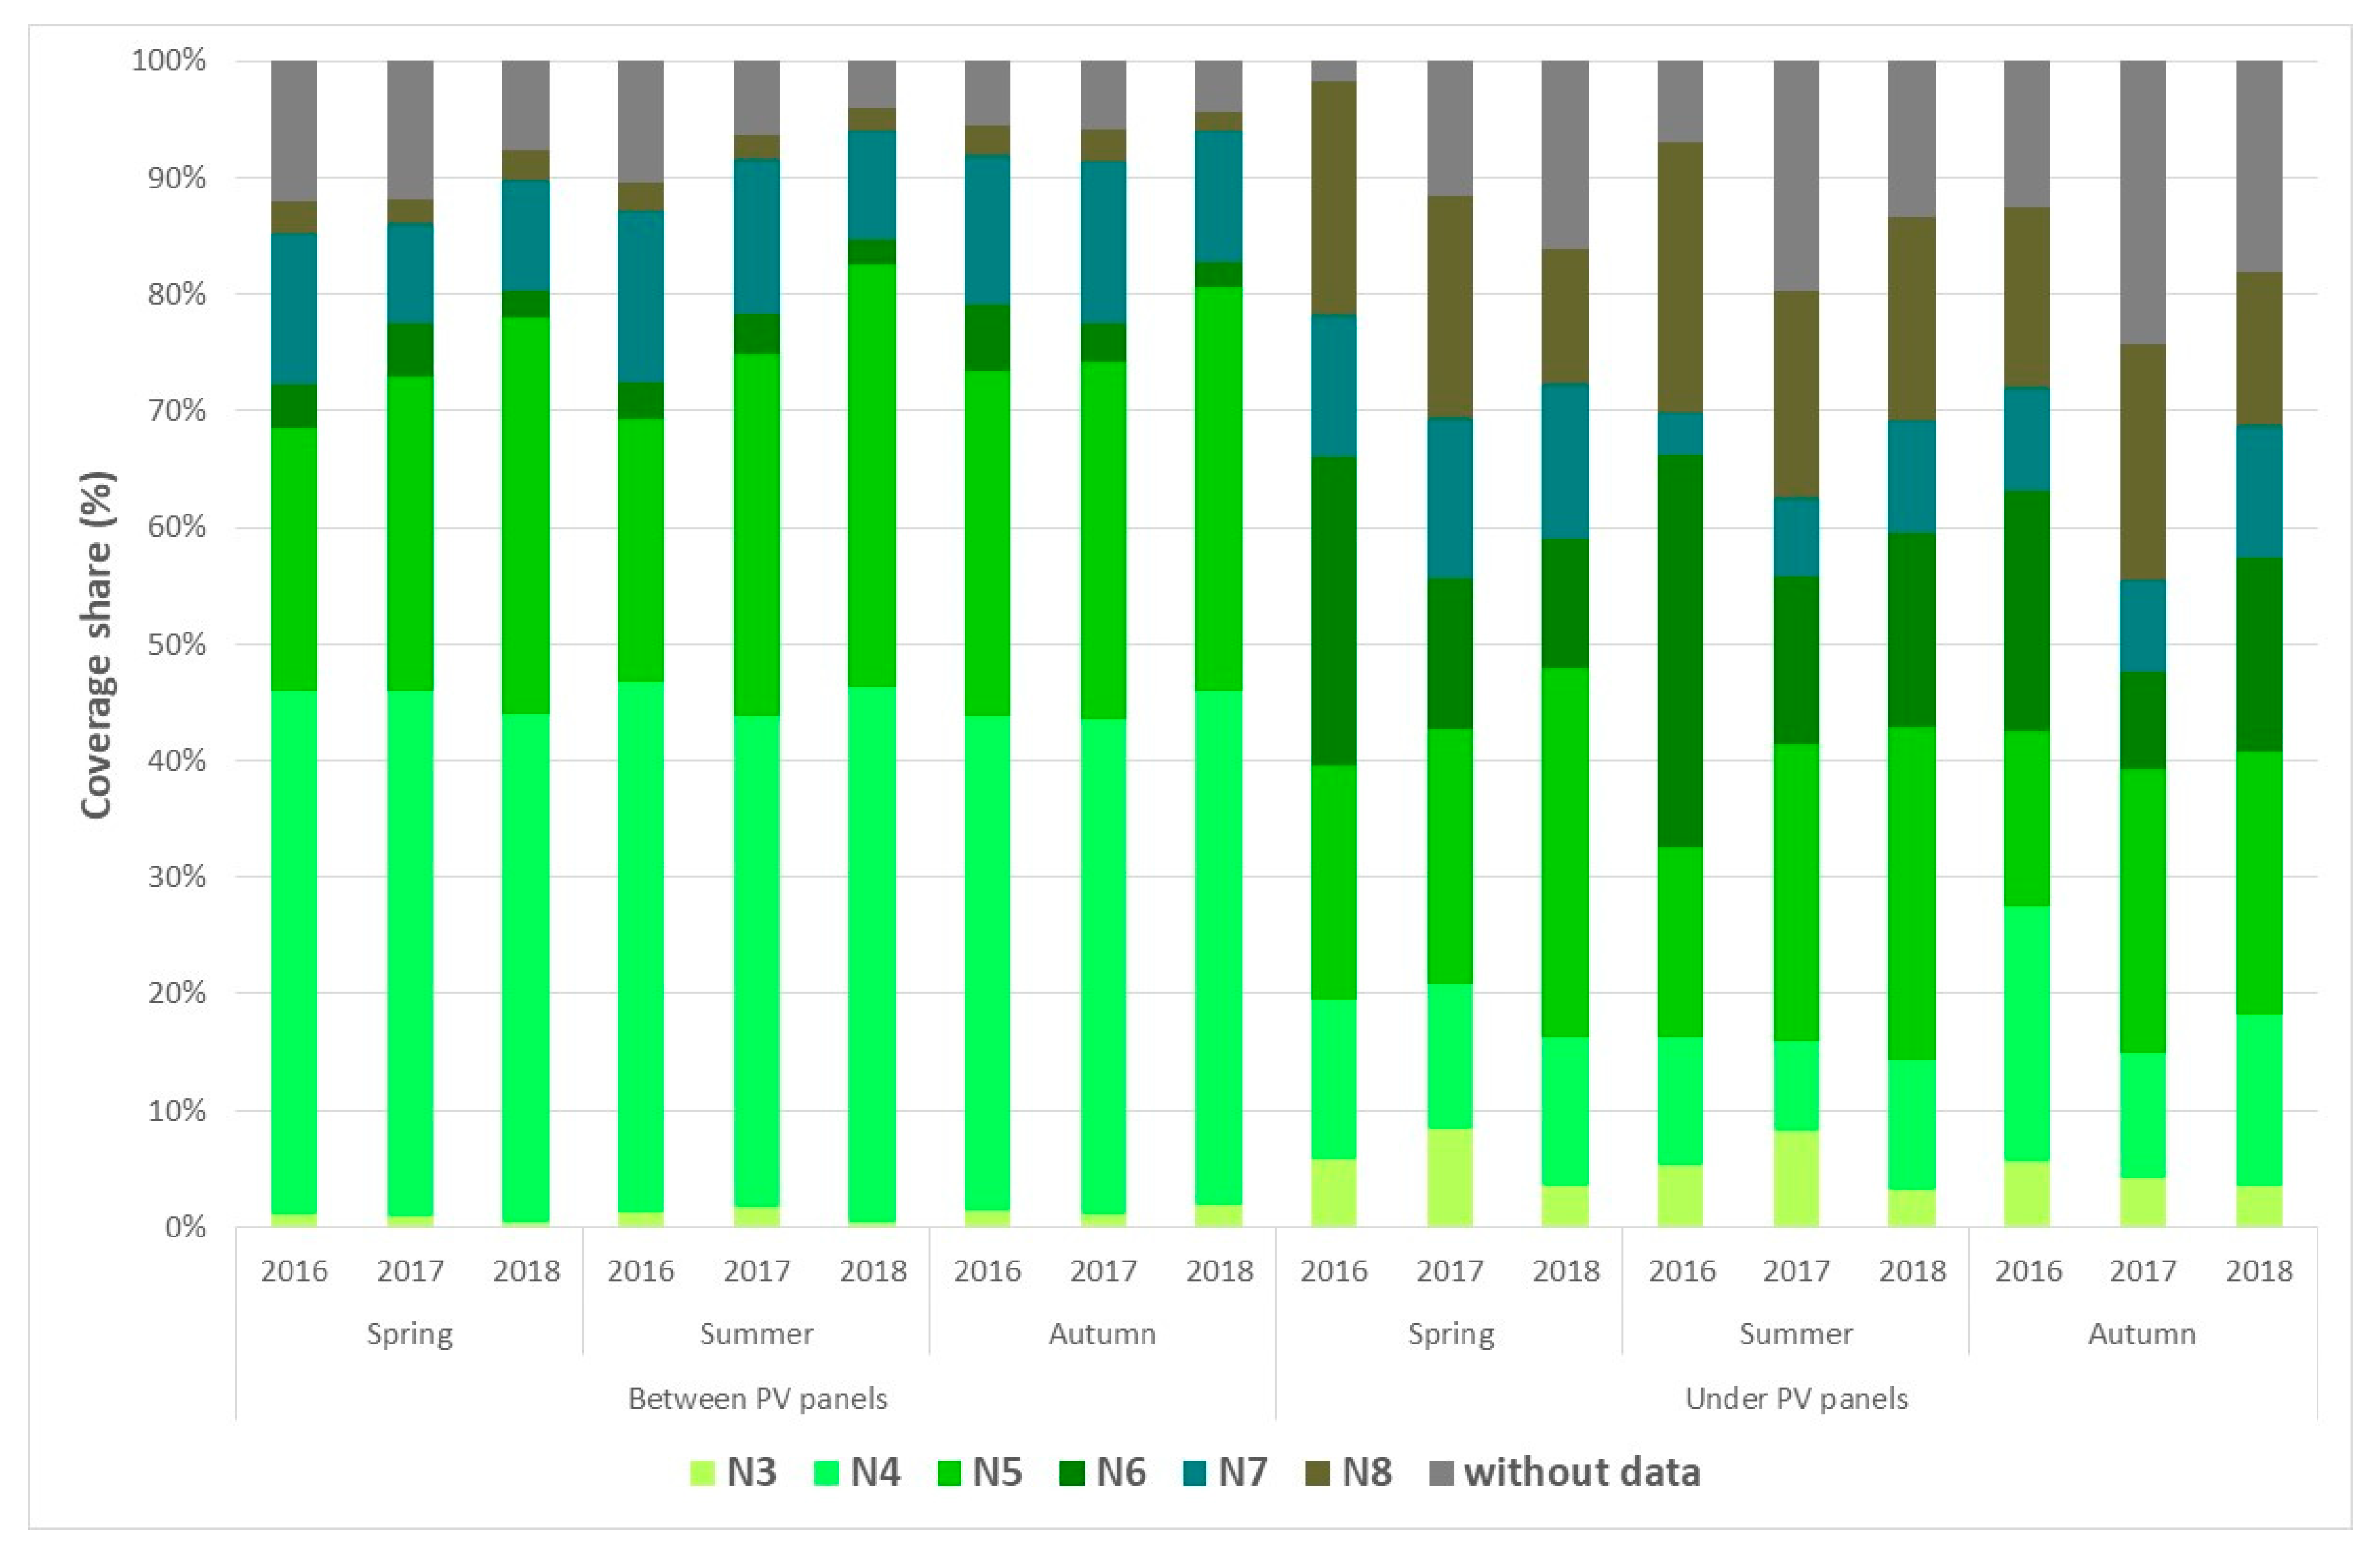
The next criterion is availability of N, which is the mean realized limit of the availability of this nutrient to plants from the soil. The scale of nine degrees is as follows: (i) N1 = nitrogen difficult to access; (ii) N2 = nitrogen difficult to access up to poorly available; (iii) N3 = nitrogen poorly available; (iv) N4 = nitrogen available; (v) N5 = soils moderately rich in nitrogen; (vi) N6 = soils moderately rich to rich in nitrogen; (vii) N7 = soils rich in nitrogen; (viii) N8 = soils very rich in natural nitrogen; (ix) N9 = soils very rich in nitrogen, usually artificially enriched with N.
Another criterion is the availability of phosphorus (P), which is expressed as the mean realized limit of the availability of phosphorus to plants from the soil. The scale of five degrees is as follows: (i) P1 = plant species avoiding soils with high availability of phosphorus; (ii) P2 = plant species disadvantaged by high availability of phosphorus; (iii) P3 = plant species thriving on average availability of phosphorus; (iv) P4 = plant species preferring high availability of phosphorus; (v) P5 = plant species occurring only in soils with high availability of phosphorus.
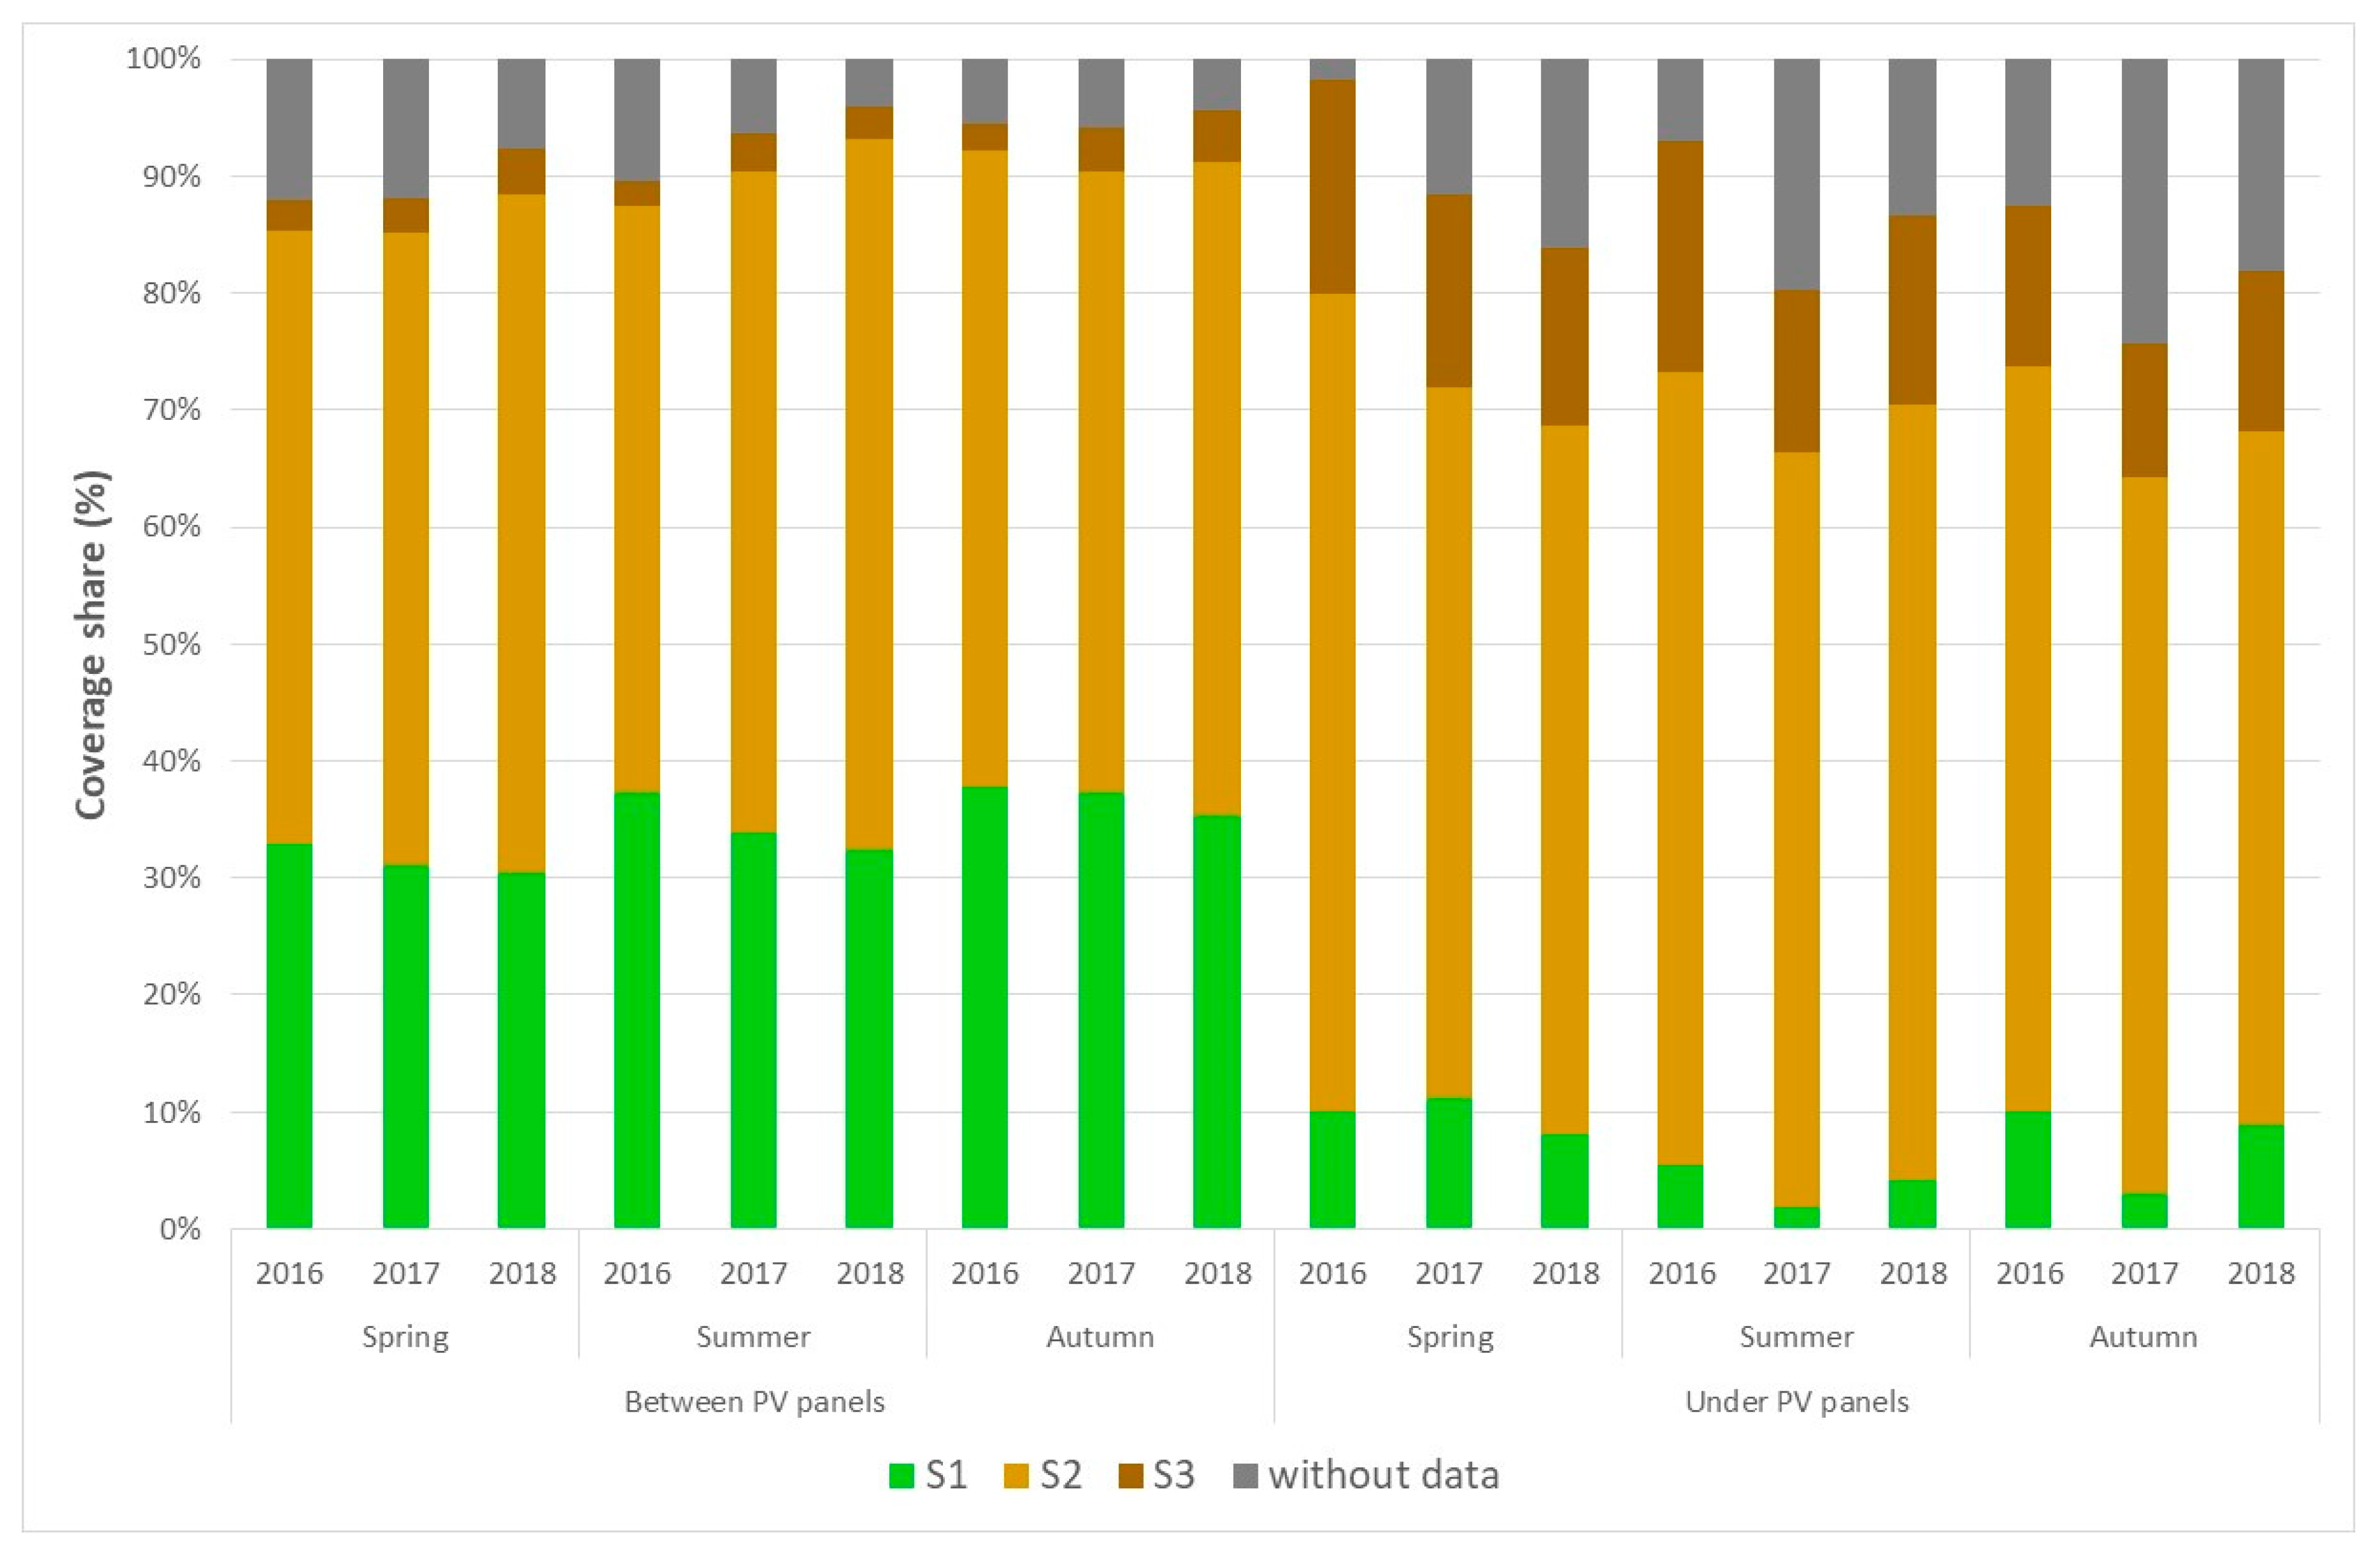
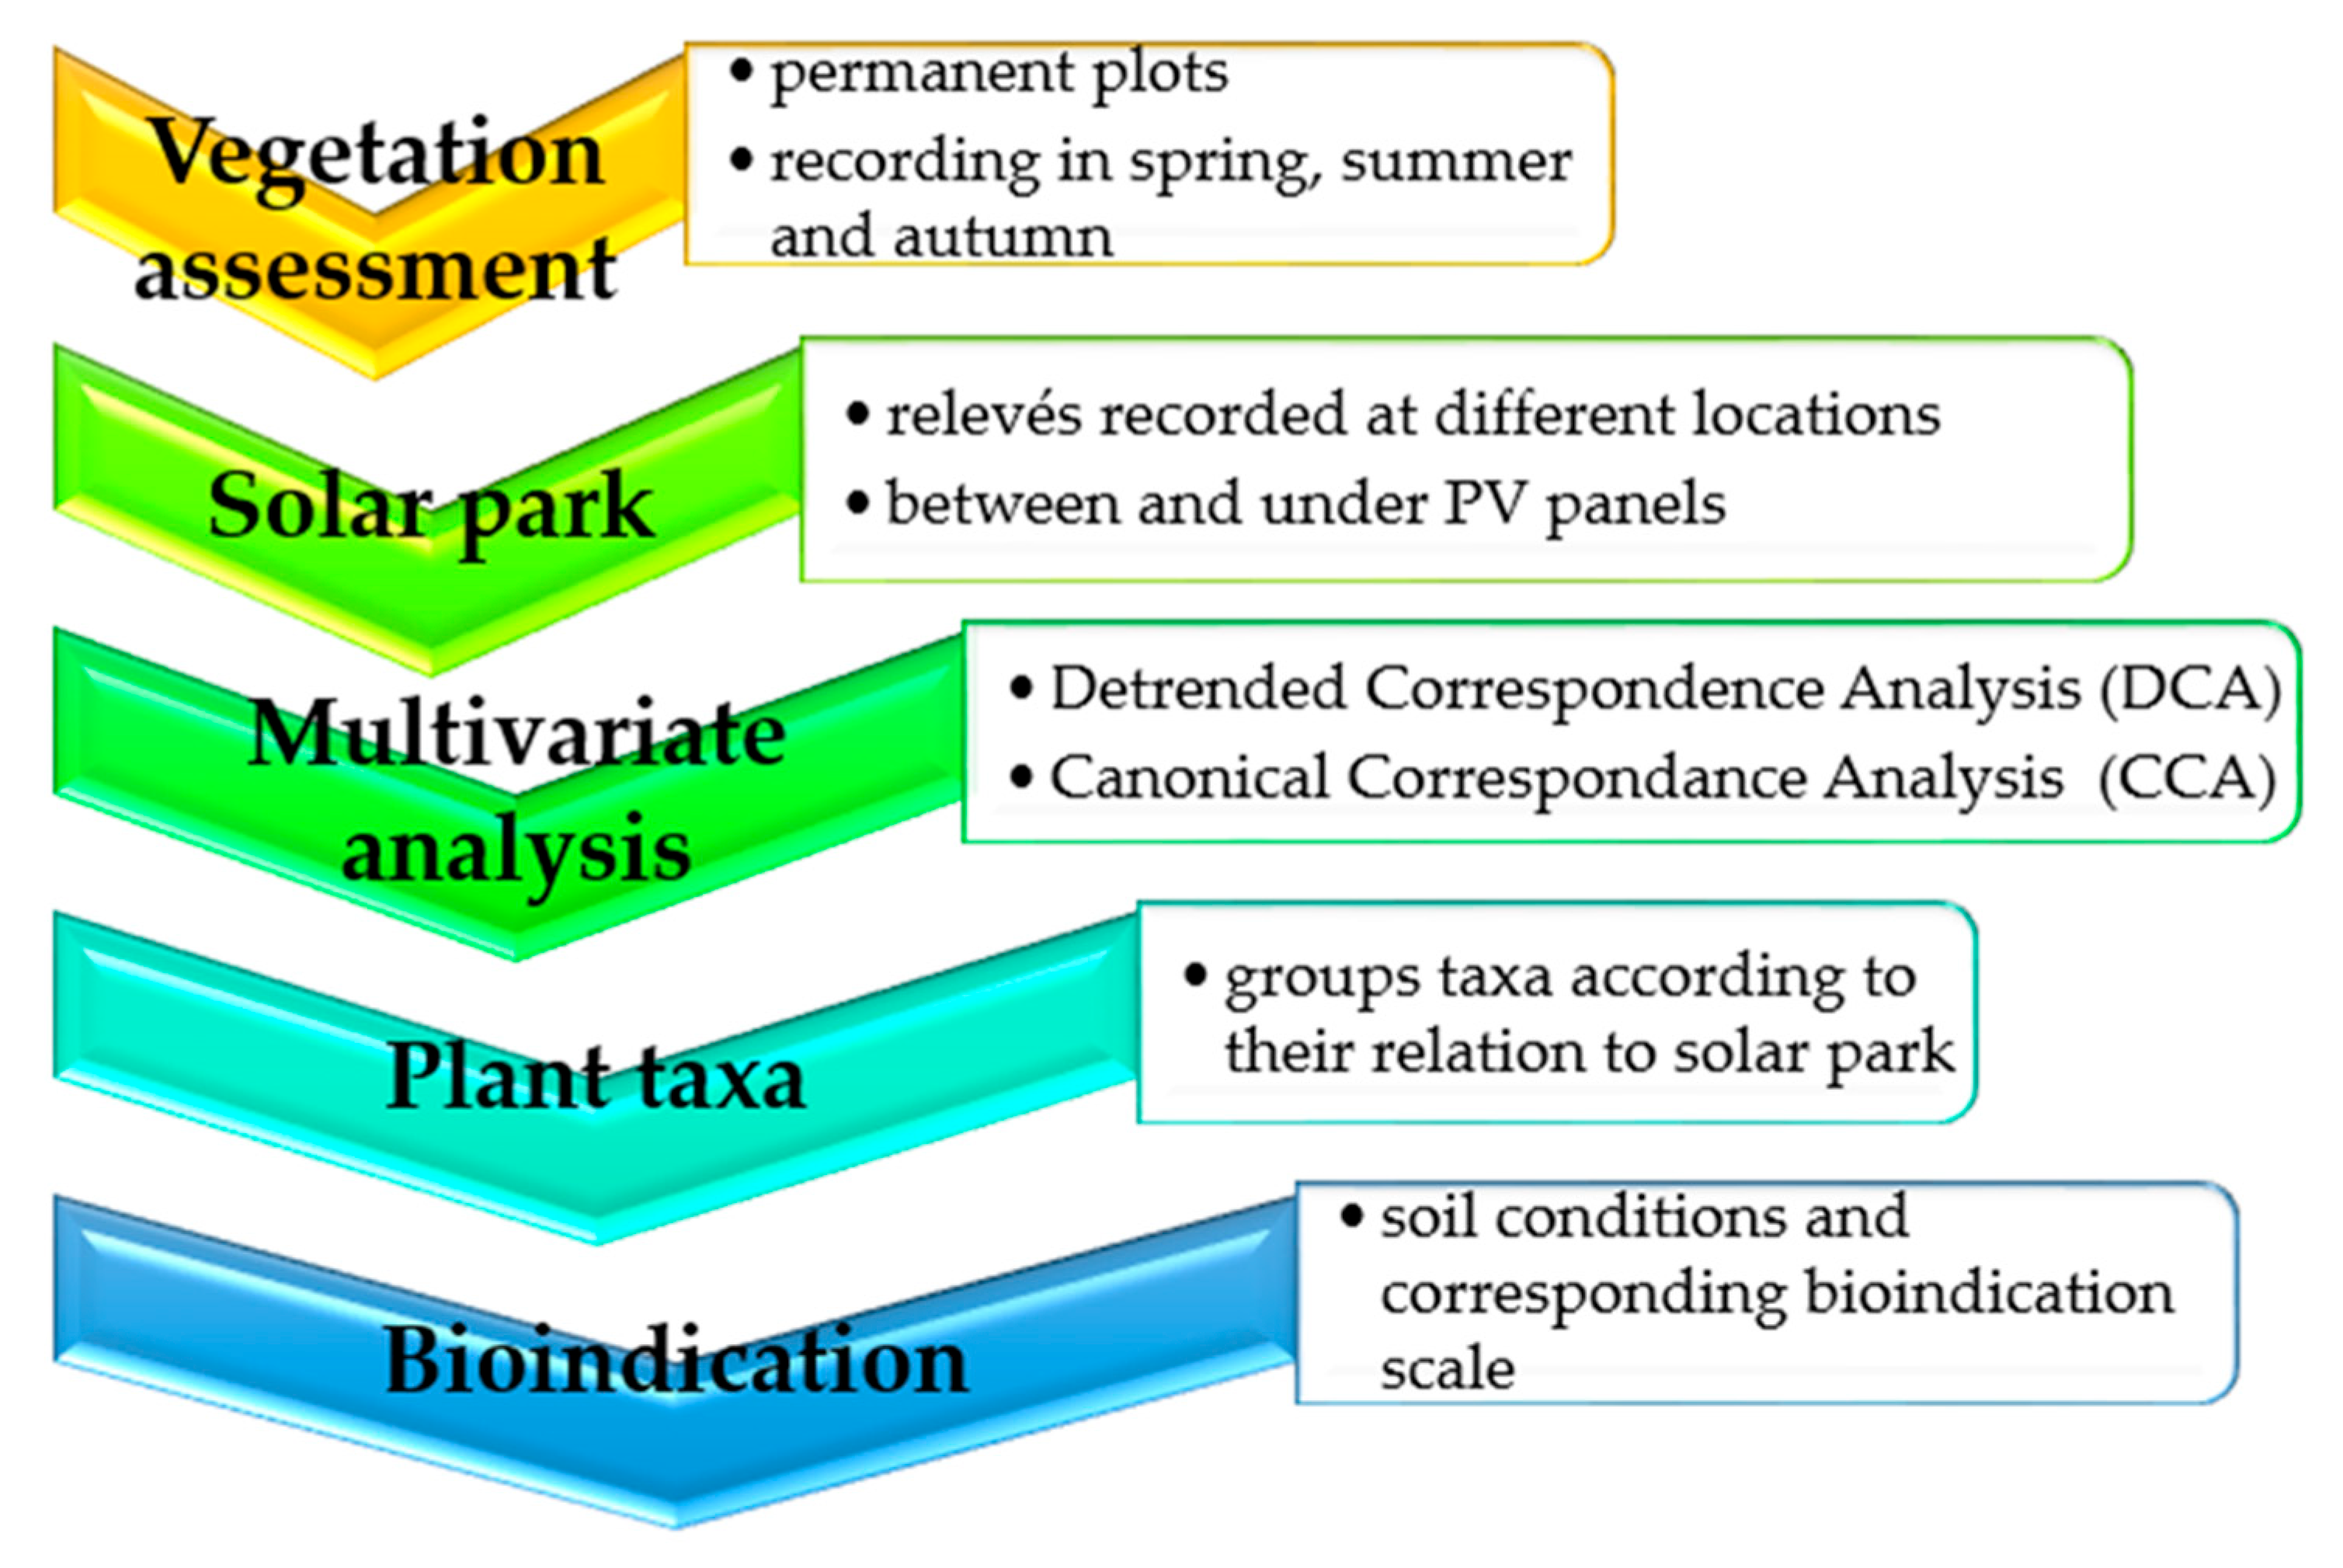
The next criterion is soil salinity which is expressed by tolerance to the gradient of salinity, and is characterized by a scale of five degrees: (i) S1 = plant species intolerant to salt, also avoiding conditions with a weak salt solution; (ii) S2 = plant species moderately tolerant to salts but preferring conditions without salts; (iii) S3 = plant species tolerant to mild salinization but their occurrence is not restricted to such habitats; (iv) S4 = plant species are more competitive at moderate to high soil salinity; (v) S5 = plant species are competitive at high soil salinity only. A block diagram explaining the process of this study is presented in Appendix A Figure A1.
3. Results
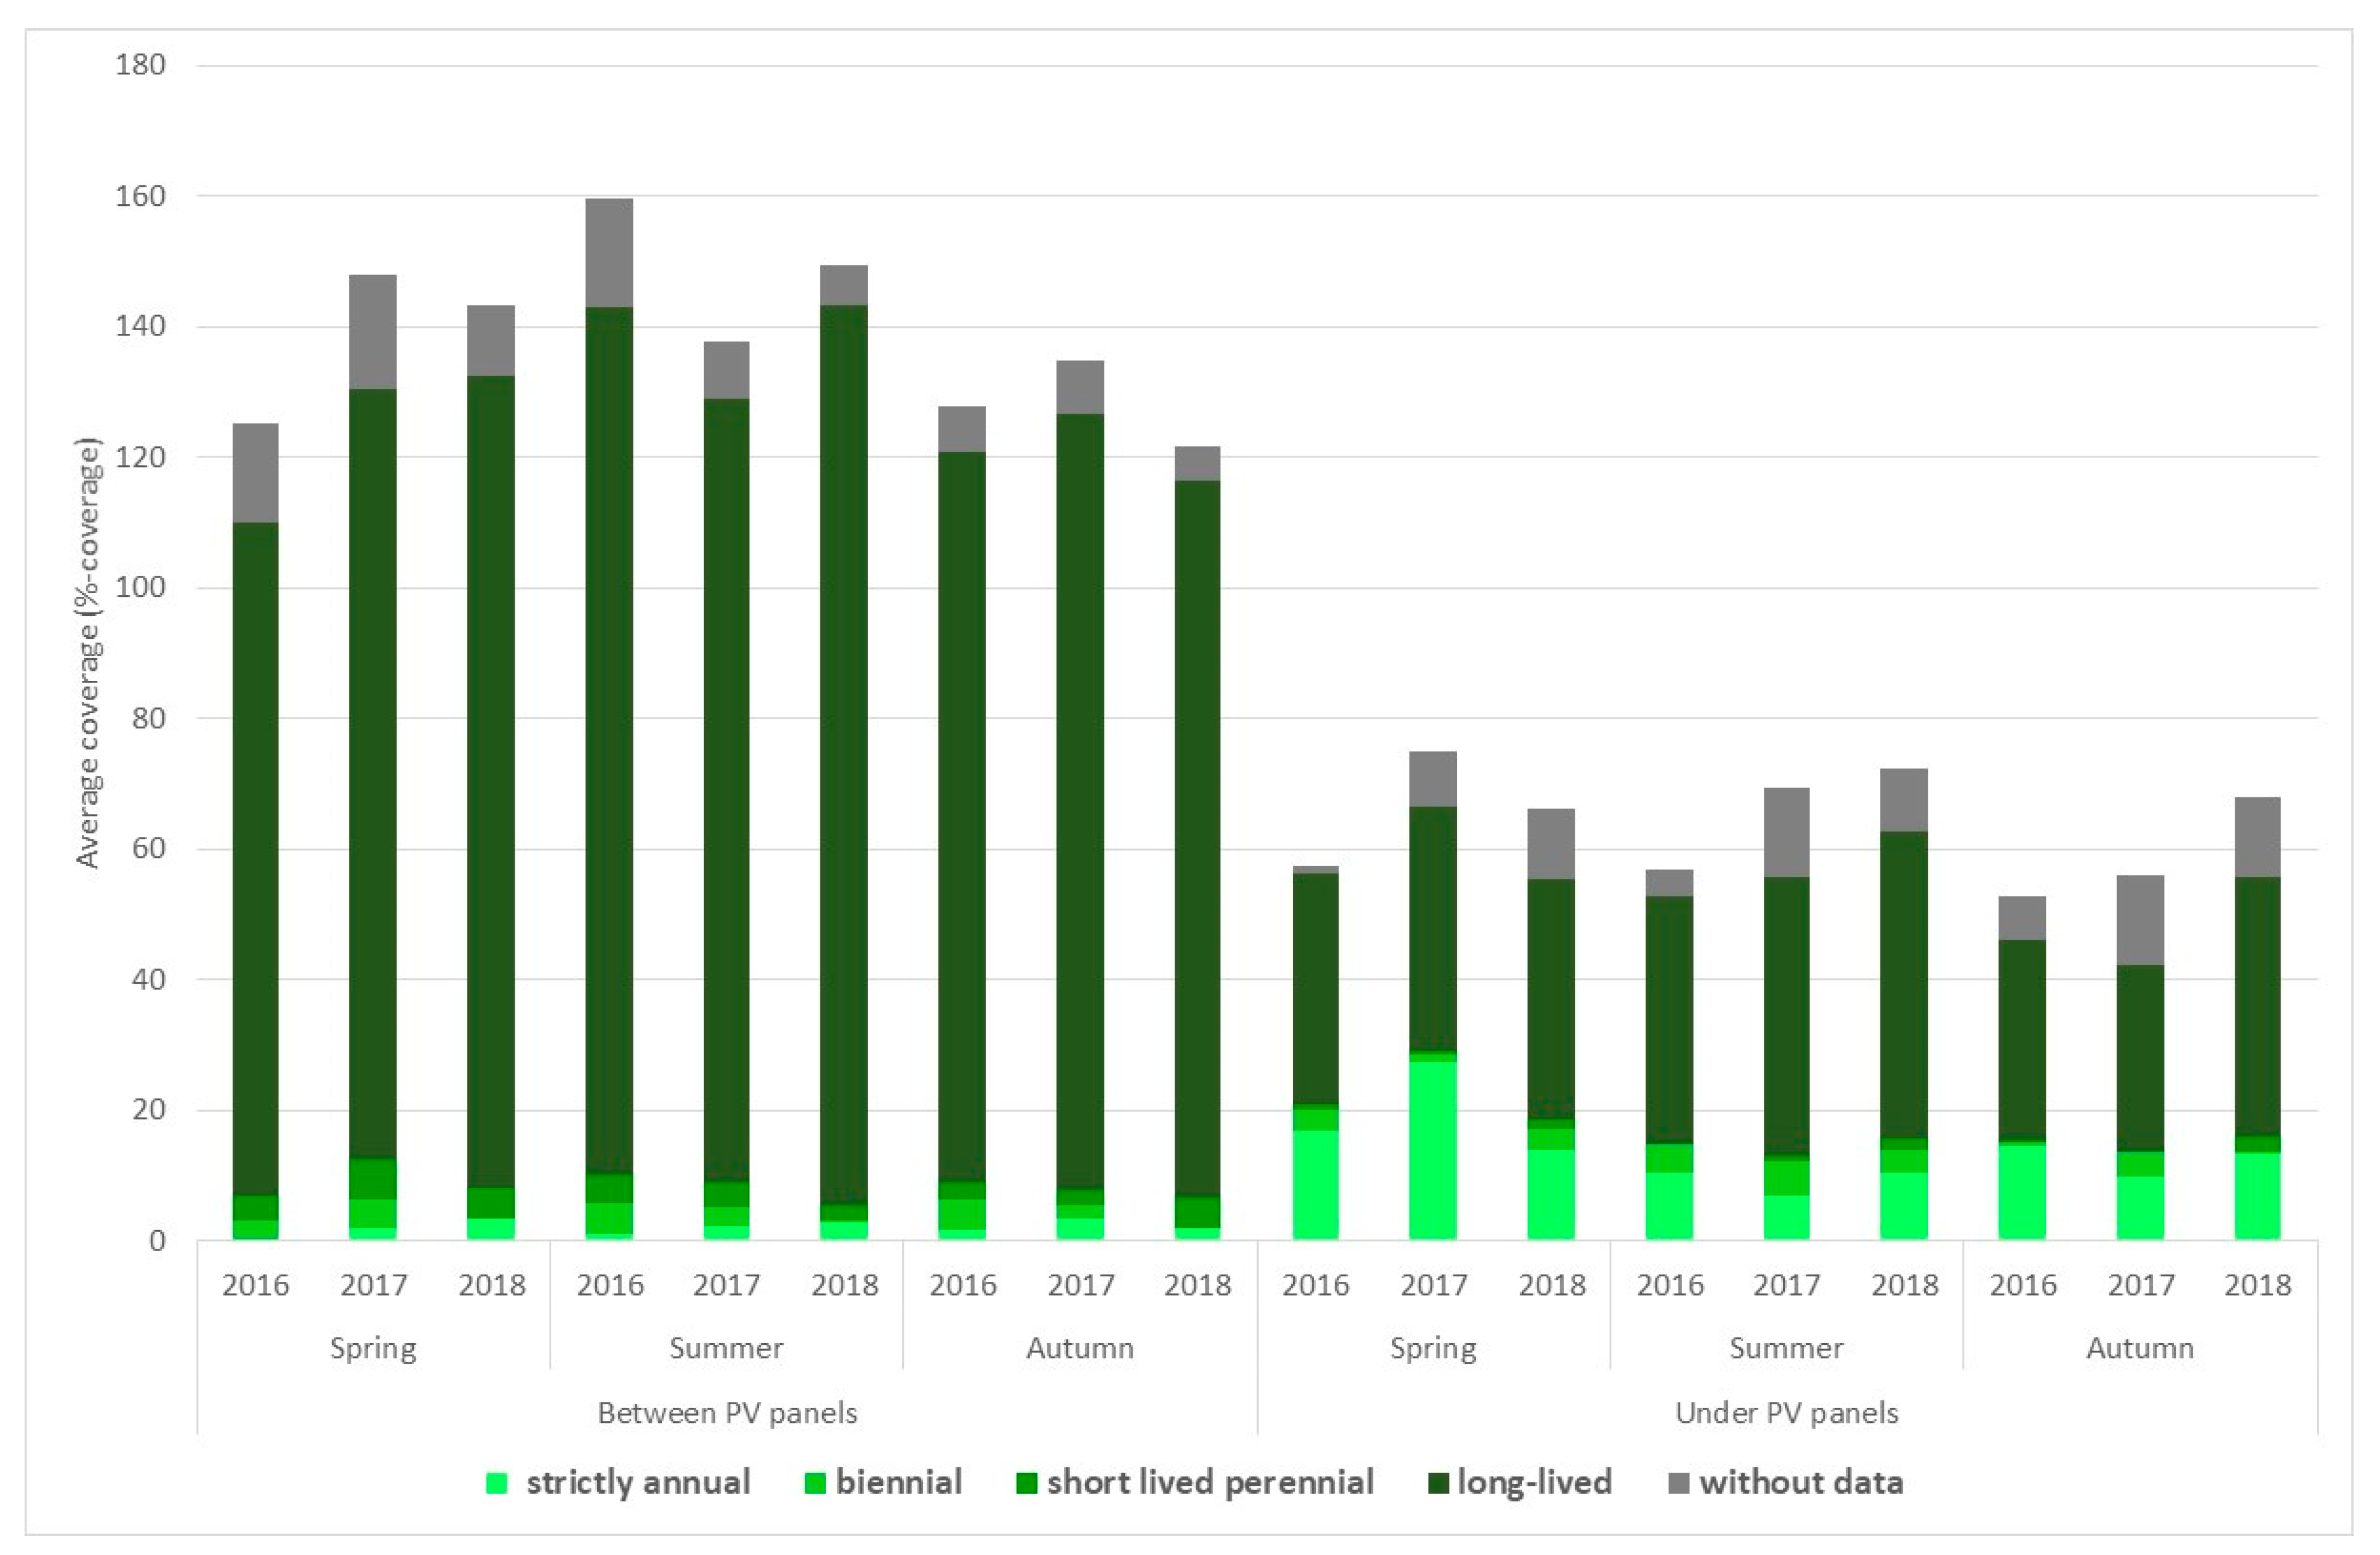
There were altogether 77 taxa of plants with a dominant position of permanent species found on the assessed solar park site. Lower coverage of all plant categories was recorded under the PV panels with a conspicuous predominance of annual plant species. The steady species composition of solar park vegetation showed only slight differences between the evaluated years. The coverage of the plant categories during the monitored period and at the investigated sites is shown in Figure 2.
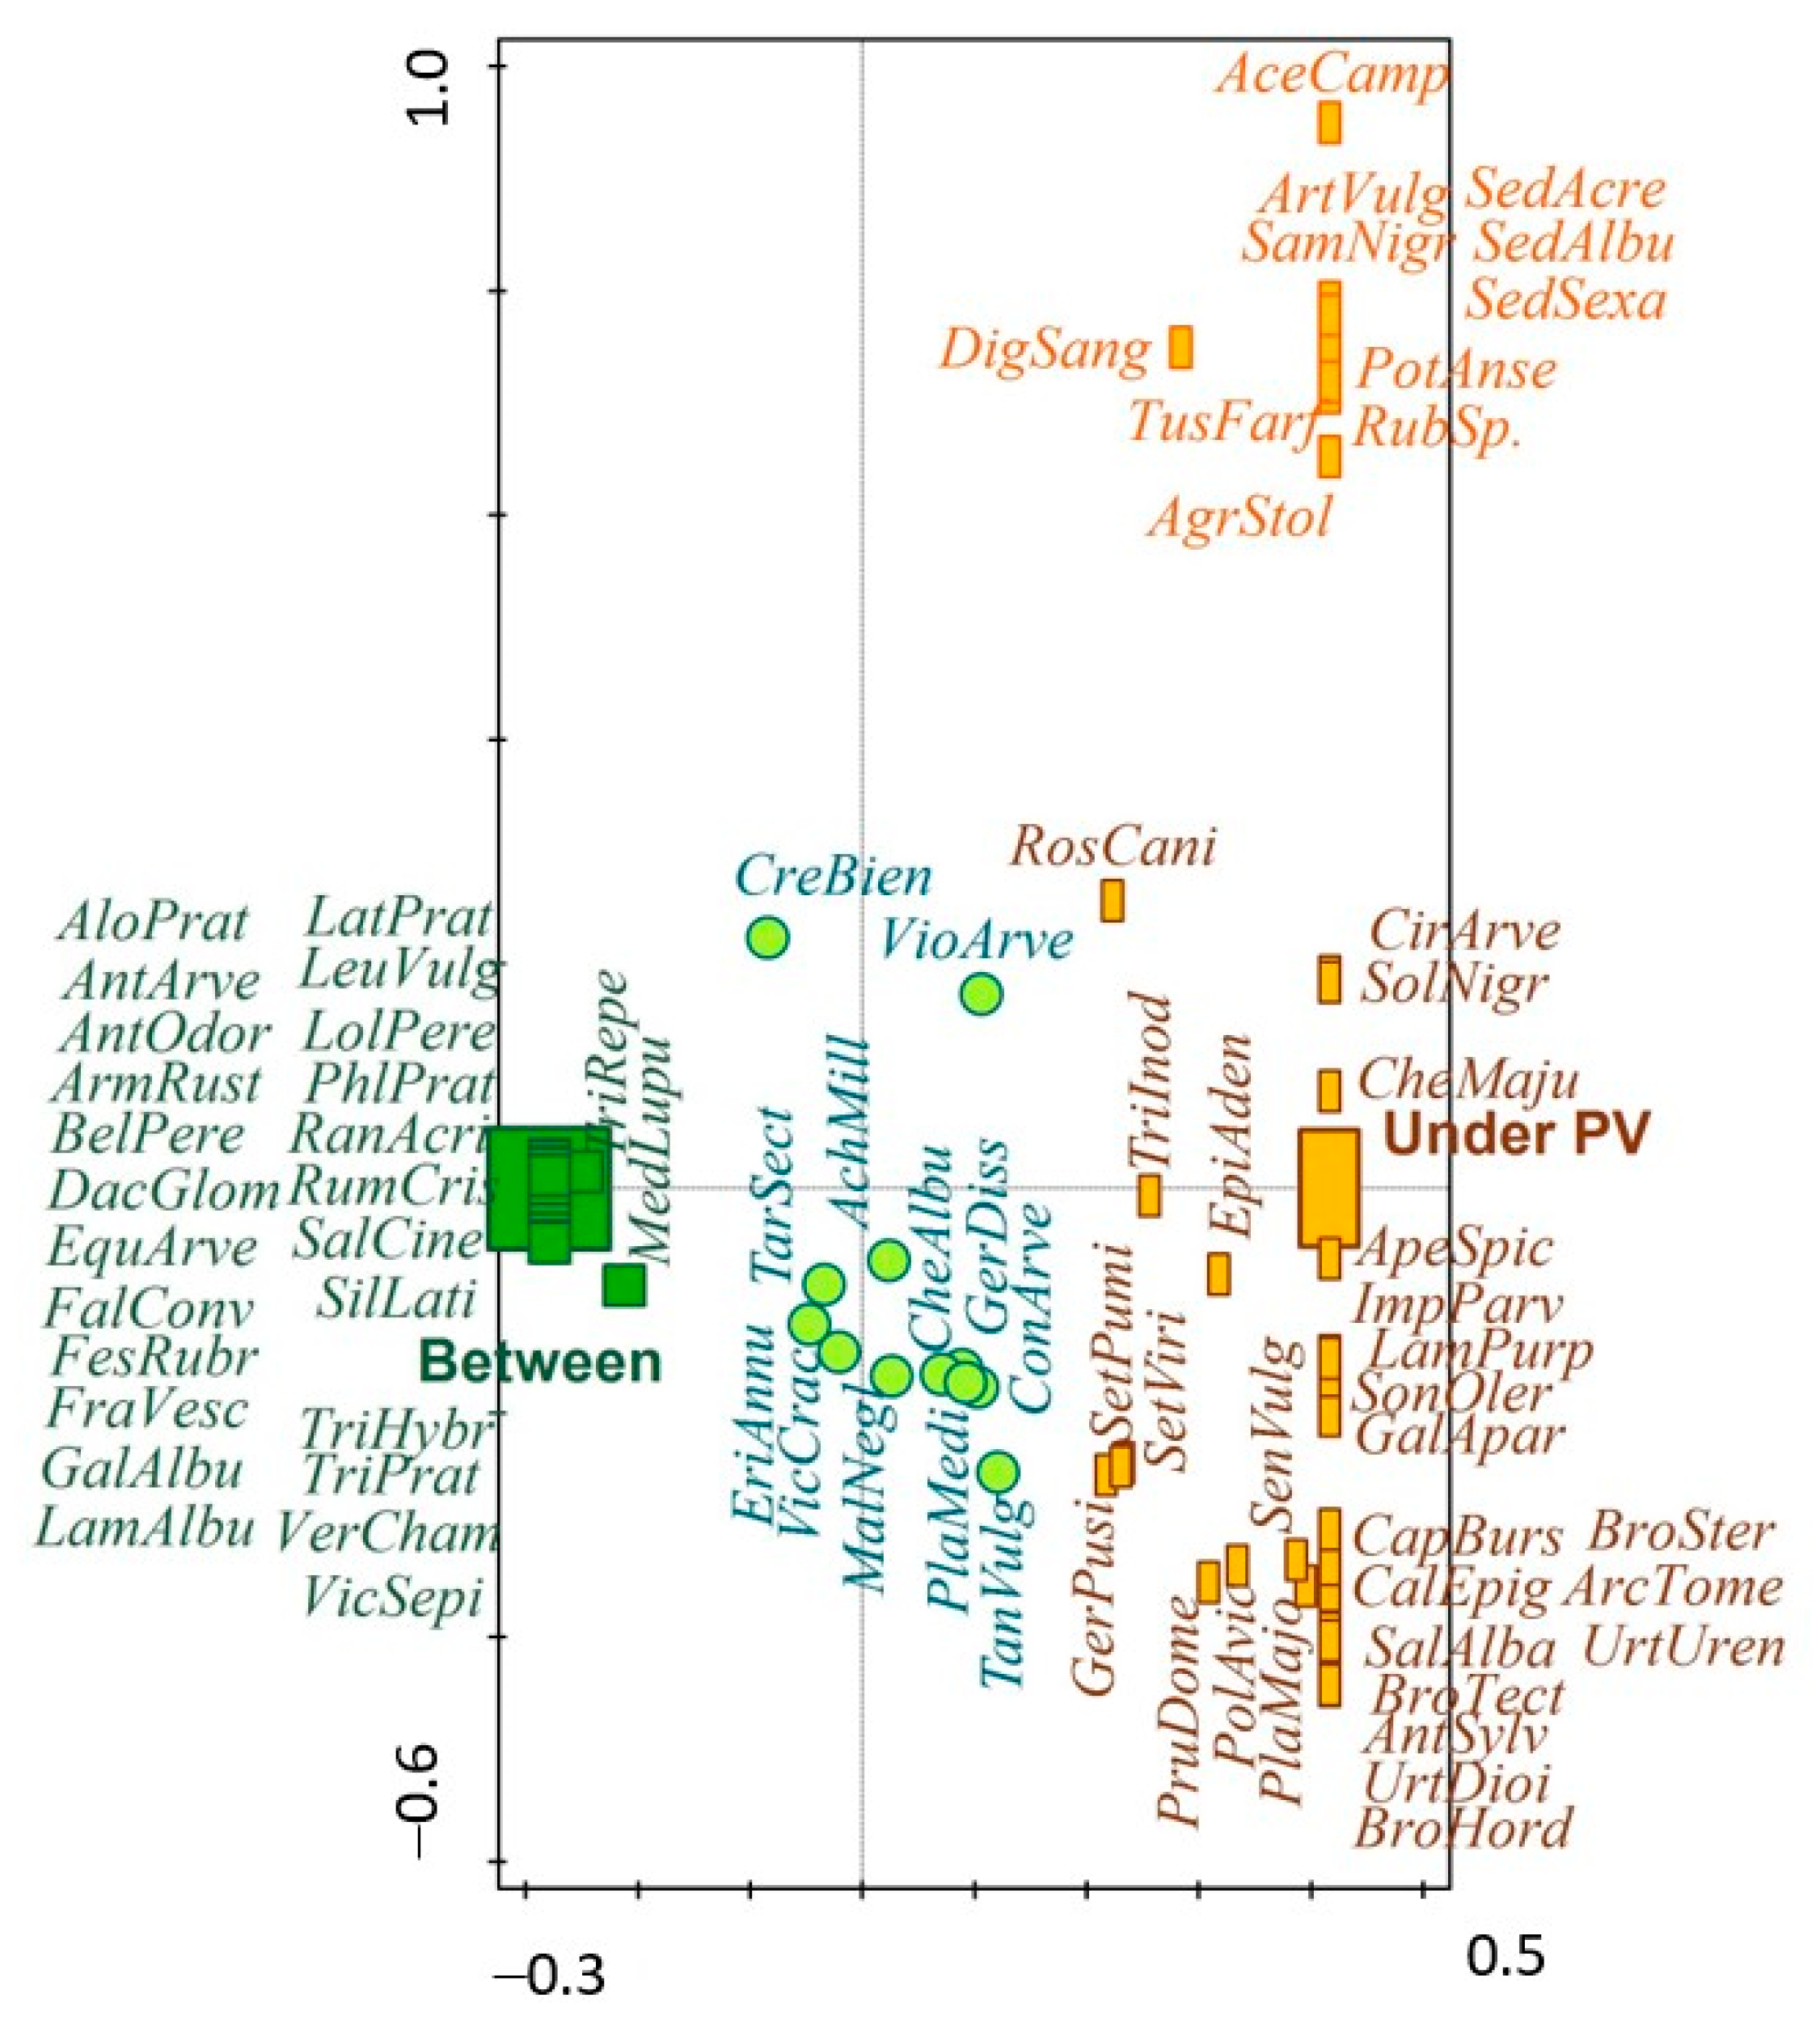
The correlation between the identified plant species and the monitored sites was assessed using CCA analysis. Figure 3 graphically shows the results of the analysis. Table 1 shows the division of plant species into groups. Group 1 of plant species (Under) showed a predominant occurrence and higher coverage in the area under the PV panels and associated species, indicating dry sites. Group 2 of plant species (Under) occurred predominantly and showed higher coverage under the PV panels, associating species with diverse indications. Group 3 (indifferent) associated plant species with no significant site preference were recorded at both sites (Between and Under). Group 4 of the plant species (Between) occurred more frequently between the PV panels.
The first assessed criterion was moisture. Results of the bioindication of conditions are shown in Figure 4. The site under the PV panels exhibits a significantly higher share of drought-resistant plant taxa.
The second assessed criterion was soil pH. Results of the bioindication of conditions are shown in Figure 5. The site under PV panels exhibits a higher share of plant species, indicating acidic soil pH but also neutral soil pH.
The third assessed criterion was the availability of N. Results of the bioindication of conditions are shown in Figure 6. In this criterion too, the site under the PV panels exhibits a higher share of plant species indicating low availability of N but also a higher share of plant species indicating a high surplus of N.
The fourth assessed criterion was the availability of P. Results of the bioindication of conditions are shown in Figure 7. In this criterion, once again, the site under the PV panels exhibits a higher share of plant taxa indicating low availability of P but also a higher share of plant species indicating high enough phosphorus.
The fifth assessed criterion was salinity. Results of the bioindication of conditions are presented in Figure 8. The site under the PV panels exhibits a greater share of plant species tolerant to salinization.
4. Discussion
Solar parks and the presence of PV panels cause changes and fragmentation of the living conditions of plants. Different conditions are reflected in the different species composition of the vegetation. The sites between the PV panels were dominated by perennial species, both grasses (Festuca rubra, Lolium perenne, and Dactylis glomerata) as well as by some permanent dicotyledonous species (Trifolium repens). The species composition of vegetation indicates that the sites between the PV panels feature conditions similar to those of meadows and pastures. The dominance of grasses in the vegetation was also confirmed by Armstrong et al. [28], Uldrijan et al. [50], and Vaverková et al. [51].
The site under the PV panels differs in the species composition of vegetation and was less favorable for biomass formation. Perennial species represented there in greater numbers are for example Calamagrostis epigejos, Cirsium arvense, and Urtica dioica. Conditions of this site are also favorable for some annual plant species such as Senecio vulgaris, Capsella bursa-pastoris, and Bromus sterilis. As these species are mostly nitrophilous, we can assume that the drift of nutrients, namely N, occurs in these places, and better availability of water can be expected as well. PV panels provide shade and limit solar radiation but also change the distribution of water precipitation. Irregular and lacking precipitation shows in the different compositions of vegetation on sites under the PV panels. Drier places are then dominated by plant species tolerant to low water supply, for example, Artemisia vulgaris, Sedum sexangulare, and Polygonum aviculare. It follows that PV panels change site conditions to which the vegetation adapts [50,52] and there are more research studies showing that some plant species benefit from the shade provided by them [53,54,55,56].
The bioindication of vegetation in solar parks shows that the living conditions for plants are very diverse. Environmental heterogeneity is the basis for landscape fragmentation and hence, for enhanced biodiversity. Increased botanical biodiversity following different microclimates in solar plants (shade, rainfall diversion) can result in a higher number of invertebrates and a greater diversity of avian species and invertebrate animals, including pollinators [21]. Solar parks have a considerable potential to enhance the biological diversity of pollinators because of the availability of food sources and places for reproduction [57].
Solar parks also have specific impacts which are shown in the landscape as a long-term disturbance of life potential, and therefore, their operation should be considered with responsibility [58,59]. The growing capacities of solar parks will increase land confiscation, which will lead to ecosystem disturbance. Therefore, local environments must be considered. Solar parks offer land areas suitable for the creation of various biotopes and minimize the impact of marginal agricultural effects (e.g., pesticide spraying) [57].
The massive transformation of agricultural practices has led to the conversion of a structurally diverse and complex landscape into a homogeneous and intensively used environment with a substantial loss of biodiversity-rich sites such as hedgerows, field margins, and other uncultivated areas [60,61]. The intensification of agriculture has had a major impact on the overall loss of biological diversity in the landscape [62,63,64]. Biodiversity loss has a myriad of consequences for the function and stability of landscapes, including a decline in ecosystem services [65,66,67]. Reductions in ecosystem services have greatly affected the suitability and availability of food for wildlife and have led to further declines in biodiversity [68,69,70]. The construction of the solar park and the diverse management of vegetation together creates diverse conditions for the solar park. High diversity creates favorable living conditions for various plant types. Therefore, a prerequisite is created to increase the biodiversity of vegetation with wider ecosystem services.
Vegetation in the landscape fulfills a number of ecosystem functions, such as reducing soil erosion, improving soil health, phytomedical functions, food sources for animals, and aesthetic and cultural functions [71,72,73,74]. Higher species diversity of vegetation is a prerequisite for the successful fulfillment of these functions [75,76]. The vegetation of solar parks has a high potential to fulfill all these functions in the landscape. Solar parks can become islands of biodiversity stabilizing ecosystems in the landscape.
The fundamental problem of the current agricultural landscape is the homogenization that has taken place in recent decades and is still taking place today [77,78]. The result of the homogenization of the landscape was primarily the merging of plots of land and the expansion of arable land. This has led to the loss of habitats, linear greenery, meadows, and field margins, and reduced landscape fragmentation [79]. The conditions of the solar park, where alternating PV-panel strips shade the area and divert rainfall, fragment the site conditions. According to Steffan-Dewenter [80], Paesel et al. [81], and Fattorini [82], vegetation composition changes based on microclimate, with different vegetation compositions in shaded areas and permanently sunlit areas.
Another important factor is vegetation management, which significantly affects ecosystem functions and biodiversity [83,84,85]. Vegetation management applied to solar park lands can take different forms. Its main objective is to limit the height of vegetation and prevent the shading of PV panels caused by vegetation. Vegetation management also affects the water regime [86,87,88]. Herbicide use often results in completely bare soil that has limited infiltration, increases stormwater runoff, and can increase soil erosion [89,90]. The frequency of vegetation mowing is a key indicator of plant species diversity [91]. Studies conducted by Chollet et al. [92] reported that lawns with low mowing frequency are characterized by higher plant biodiversity than green areas with high mowing frequency. Moreover, the results obtained by Watson et al. [93] suggested that frequent mowing may facilitate weed invasion. On the one hand, vegetation management of solar parks must ensure the functionality of PV panels and limit the negative impacts of vegetation; on the other hand, high-intensity vegetation control will limit diversity and leads to the spread of unwanted invasive plant species.
The bioindication of soil conditions in the solar park shows that conditions under the PV panels significantly differ. Uldrijan et al. [94] warn about the change in living conditions under the PV panels, too. It is to be expected that life’s extremes will be increasing due to limited precipitation as well as due to shading. The question is what the cumulative action of these changes will be and how it will affect the ecosystem.
The increasing extremes in soil conditions are not good news for local native plant species. Changes in cumulative action may result in the withdrawal of some plant species. In a vacant place, species with more plastic life requirements may occur as well as species of invasive characteristics. Plant species of invasive character already occurring in the solar park are, for example, Artemisia vulgaris, Digitaria sanguinalis, Bromus hordeaceus, B. sterilis, B. tectorum, Calamagrostis epigejos, Cirsium arvense, Impatiens parviflora, and Epilobium adenocaulon.
Extreme conditions under the PV panels are utilized by more tolerant plant species. The anthropogenic conditions of solar parks, however, create space for the involvement of plant species with anthropogenic life strategy [95]. The vegetation of solar parks is a result of the co-evolution of human civilization and synanthropic vegetation.
5. Conclusions
- Vegetation in solar parks provides valuable information regarding the impact of PV panels on the environment;
- Different living conditions, bioindicated by plants, suggest increasing extreme soil conditions due to PV panels;
- PV panels change the distribution of water precipitation, affecting the soil water regime, availability of nitrogen and phosphorus, soil pH, and salinity;
- Vegetation responds to these changes by withdrawing sensitive plant species and increasing tolerant species;
- It remains unclear to what extent these changes will be permanent and whether they could affect the subsequent use of the land;
- Heterogeneous conditions in solar parks may lead to increased biodiversity of vegetation, subsequently reflected in the increased biodiversity of animals;
- Changes in the environment also open up opportunities for invasive plant species, therefore monitoring, bioindication, and subsequent management of vegetation in solar parks is crucial;
- Solar parks represent a new living space for plant species, some of which find conditions favorable for growth and reproduction, whereas others have to adapt to new conditions;
- Solar parks can be considered the next stage in the co-evolution of vegetation and human civilization.
Consideration: The future impact of invasive species on solar parks will depend on a variety of factors, including the specific species present in the area, management practices in place, and climatic conditions. As climate change continues to alter ecosystems and create new opportunities for invasive species to establish themselves, solar parks and other facilities need to be vigilant in monitoring and controlling the spread of invasive species to minimize their impact. This may include implementing early detection and rapid response strategies, using integrated pest management techniques, and working with local communities to raise awareness of the importance of preventing the introduction and spread of invasive species.
Author Contributions
Conceptualization, J.W., D.U. and M.D.V.; methodology, J.W. and D.U.; validation, J.W. and D.U.; formal analysis, J.W. and D.U.; investigation, J.W.; resources, J.W.; data curation, J.W. and D.U.; writing—original draft preparation, J.W. and D.U.; writing—review and editing, J.W. and D.U.; visualization, M.D.V.; supervision, J.W.; funding acquisition, D.U. All authors have read and agreed to the published version of the manuscript.
Funding
This research was supported by the INTER-EXCELLENCE program, subprogram INTER-COST of the Ministry of Education, Youth and Sports CR, grant No. LTC20001, and COST Action CA18135 supported by COST (European Cooperation in Science and Technology).
Data Availability Statement
The data presented in this study are available on request from the corresponding author and shared after his consideration.
Conflicts of Interest
The authors declare no conflict of interest.
Appendix A
Figure A1.
A block diagram explaining the process of this study.

References
- Kumar, C.M.S.; Singh, S.; Gupta, M.K.; Nimdeo, Y.M.; Raushan, R.; Deorankar, A.V.; Kumar, T.A.; Rout, P.K.; Chanotiya, C.S.; Pakhale, V.D.; et al. Solar energy: A promising renewable source for meeting energy demand in Indian agriculture applications. Sustain. Energy Technol. Assess. 2023, 55, 102905. [Google Scholar] [CrossRef]
- Assadi, M.R.; Ataebi, M.; sadat Ataebi, E.; Hasani, A. Prioritization of renewable energy resources based on sustainable management approach using simultaneous evaluation of criteria and alternatives: A case study on Iran’s electricity industry. Renew. Energy 2022, 181, 820–832. [Google Scholar] [CrossRef]
- Le, T.H. Quantile time-frequency connectedness between cryptocurrency volatility and renewable energy volatility during the COVID-19 pandemic and Ukraine-Russia conflicts. Renew. Energy 2023, 202, 613–625. [Google Scholar] [CrossRef]
- Nerlinger, M.; Utz, S. The impact of the Russia-Ukraine conflict on energy firms: A capital market perspective. Financ. Res. Lett. 2022, 50, 103243. [Google Scholar] [CrossRef]
- Sarker, A.K.; Azad, A.K.; Rasul, M.G.; Doppalapudi, A.T. Prospect of Green Hydrogen Generation from Hybrid Renewable Energy Sources: A Review. Energies 2023, 16, 1556. [Google Scholar] [CrossRef]
- Bahar, H.; Abdelilah, Y.; Bianco, E. Renewables 2017; International Energy Agency: Paris, France, 2017; p. 185. Available online: https://iea.blob.core.windows.net/assets/952fe0c1-8d57-4dcc-adbd-85c854674478/MRSrenew2017.pdf (accessed on 10 January 2023).
- IEA. Renewables 2019 Analysis and Forecast to 2024 Executive Summary; International Energy Agency: Paris, France, 2019; Available online: https://www.iea.org/reports/renewables-2019/power (accessed on 10 January 2023).
- IRENA. Future of Solar Photovoltaic: Deployment, Investment, Technology, Grid Integration and Socio-Economic Aspects (A Global Energy Transformation Paper); International Renewable Energy Agency: Abu Dhabi, United Arab Emirates, 2019; p. 72. Available online: www.irena.org/publications (accessed on 10 January 2023).
- Edenhofer, O.; Pichs-Madruga, R.; Sokona, Y.; Seyboth, K.; Kadner, S.; Zwickel, T.; Eickemeier, P.; Hansen, G.; Scholmer, S.; von Stechow, C. Renewable Energy Sources and Climate Change Mitigation: Special Report of the Intergovernmental Panel on Climate Change; Cambridge University Press: Cambridge, UK; New York, NY, USA, 2011; p. 1075. [Google Scholar]
- Mahmudul, H.M.; Akbar, D.; Rasul, M.G.; Narayanan, R.; Mofijur, M. Estimation of the sustainable production of gaseous biofuels, generation of lektricity, and reduction of greenhouse gas emissions using food waste in anaerobic digesters. Fuel 2022, 310, 122346. [Google Scholar] [CrossRef]
- Islam, A.; Teo, S.H.; Ng, C.H.; Taufiq-Yap, Y.H.; Choong, S.Y.T.; Awual, M.R. Progress in recent sustainable materials for greenhouse gas (NOx and SOx) emission mitigation. Prog. Mater. Sci. 2022, 132, 101033. [Google Scholar] [CrossRef]
- SolarPower Europe. Global Market Outlook for Solar Power 2019–2023; SolarPower Europe: Etterbeek, Belgium, 2019; Available online: https://www.solarpowereurope.org/insights/webinars/global-market-outlook-solar-2019-2023 (accessed on 10 January 2023).
- Scurlock, J. Agricultural Good Practice for Solar Farms; BRE National Solar Centre: St Blaise, UK, 2014; p. 5. Available online: https://files.bregroup.com/solar/NSC_-Guid_Agricultural-good-practice-for-SFs_0914.pdf (accessed on 10 January 2023).
- Turney, D.; Fthenakis, V. Environmental impacts from the installation and operation of large-scale solar power plants. Renew. Sustain. Energy Rev. 2011, 15, 3261–3270. [Google Scholar] [CrossRef]
- Hernandez, R.R.; Easter, S.B.; Murphy-Mariscal, M.L.; Maestre, F.T.; Tavassoli, M.; Allen, E.B.; Barrows, C.W.; Belnap, J.; Ochoa-Hueso, R.; Allen, M.F. Environmental impacts of utility-scale solar energy. Renew. Sustain. Energy Rev. 2014, 29, 766–779. [Google Scholar] [CrossRef]
- Thomas, S.J.; Thomas, S.; Sahoo, S.S.; Gobinath, R.; Awad, M.M. Allotment of Waste and Degraded Land Parcels for PV Based Solar Parks in India: Effects on Power Generation Cost and Influence on Investment Decision-Making. Sustainability 2022, 14, 1786. [Google Scholar] [CrossRef]
- Oudes, D.; van den Brink, A.; Stremke, S. Towards a typology of solar energy landscapes: Mixed-production, nature based and landscape inclusive solar power transitions. Energy Res. Soc. Sci. 2022, 91, 102742. [Google Scholar] [CrossRef]
- Sinha, P.; Hoffman, B.; Sakers, J.; Althouse, L. Best Practices in Responsible Land Use for Improving Biodiversity at a Utility-Scale Solar Facility. Case Stud. Environ. 2018, 2, 1–12. [Google Scholar] [CrossRef]
- Allison, T.D.; Root, T.L.; Frumhoff, P.C. Thinking globally and siting locally–renewable energy and biodiversity in a rapidly warming world. Clim. Change 2014, 126, 1–6. [Google Scholar] [CrossRef]
- Peschel, T. Solar parks—Opportunities for biodiversity: A report on biodiversity in and around ground-mounted photovoltaic plants. Renews Spec. 2010, 45, 3–34. [Google Scholar]
- Montag, H.; Parker, G.; Clarkson, T. The Effects of Solar Farms on Local Biodiversity; A Comparative Study. Clarkson and Woods and Wychwood Biodiversity. 2016. Available online: http://www.solar-trade.org.uk/solar-farms-biodiversity-study/ (accessed on 10 January 2023).
- Parker, G.E.; Greene, L. National Solar Centre Biodiversity Guidance for Solar Developments; BRE National Solar Centre: St Blaise, UK, 2014; p. 9. Available online: https://www.bre.co.uk/filelibrary/nsc/Documents%20Library/NSC%20Publications/National-Solar-Centre---Biodiversity-Guidance-for-Solar-Developments--2014-.pdf (accessed on 10 January 2023).
- Walston, L.J.; Mishra, S.K.; Hartmann, H.M.; Hlohowskyj, I.; McCall, J.; Macknick, J. Examining the potential for agricultural benefits from pollinator habitat at solar facilities in the United States. Environ. Sci. Technol. 2018, 52, 7566–7576. [Google Scholar] [CrossRef]
- Semeraro, T.; Pomes, A.; Del Giudice, C.; Negro, D.; Aretano, R. Planning ground based utility scale solar energy as green infrastructure to enhance ecosystem services. Energy Pol. 2018, 117, 218–227. [Google Scholar] [CrossRef]
- IPBES. The Assessment Report of the Intergovernmental Science-Policy Platform on Biodiversity and Ecosystem Services on Pollinators, Pollination and Food Production; Secretariat of the Intergovernmental Science-Policy Platform on Biodiversity and Ecosystem Services: Bonn, Germany, 2016; Available online: https://ipbes.net/assessment-reports/pollinators (accessed on 10 January 2023).
- Potts, S.G.; Imperatriz-Fonseca, V.; Ngo, H.T.; Aizen, M.A.; Biesmeijer, J.C.; Breeze, T.D.; Dicks, L.V.; Garibaldi, L.A.; Hill, R.; Settele, J.; et al. Safeguarding pollinators and their values to human well-being. Nature 2016, 540, 220–229. [Google Scholar] [CrossRef]
- Armstrong, A.; Ostle, N.J.; Whitaker, J. Solar park microclimate and vegetation management effects on grassland carbon cycling. Environ. Res. Lett. 2016, 11, 074016. [Google Scholar] [CrossRef]
- Armstrong, A.; Waldron, S.; Whitaker, J.; Ostle, N.J. Wind farm and solar park effects on plant–soil carbon cycling: Uncertain impacts of changes in ground-level microclimate. Global Change Biol. 2014, 20, 1699–1706. [Google Scholar] [CrossRef] [PubMed]
- Wu, C.; Liu, H.; Yu, Y.; Zhao, W.; Liu, J.; Yu, H.; Yetemen, O. Ecohydrological effects of photovoltaic solar farms on soil microclimates and moisture regimes in arid Northwest China: A modeling study. Sci. Total Environ. 2022, 802, 149946. [Google Scholar] [CrossRef] [PubMed]
- Uldrijan, D.; Chovancová, S.; Winkler, J. Species spectrum of plants on selected land of photovoltaic power plant. In Proceedings of the International PhD Students Conference MendelNet; Polák, O., Cerkal, R., Belcredi, N.B., Horky, P., Vacek, P., Eds.; Mendel University in Brno: Brno, Czech Republic, 2016; pp. 163–167. [Google Scholar]
- Ferrara, G.; Boselli, M.; Palasciano, M.; Mazzeo, A. Effect of shading determined by photovoltaic panels installed above the vines on the performance of cv. Corvina (Vitis vinifera L.). Sci. Hortic. 2023, 308, 111595. [Google Scholar] [CrossRef]
- Ellenberg, H.; Weber, H.E.; Düll, R.; Wirth, V.; Werner, W.; Paulißen, D. Pointer values of plants in Central Europe. Scr. Geobot. 1991, 18, 1–248. [Google Scholar] [CrossRef]
- Diekmann, M. Use and improvement of Ellenberg’s indicator values in deciduous forests of the Boreo-nemoral zone in Sweden. Ecography 1995, 18, 178–189. Available online: https://www.jstor.org/stable/3682767 (accessed on 10 January 2023). [CrossRef]
- Mičieta, K. Phytoindication of environmental mutagenesis in the in-situ conditions using the pollen of selected species of native flora. Thaiszia J. Bot. 2021, 31, 69–78. [Google Scholar] [CrossRef]
- Nykytiuk, P. Phytoindication: Basic diagnostic characteristics and approaches. Dan. Sci. J. 2020, 35, 5–9. [Google Scholar]
- Zverev, A.A. Direct and mediate assessment of acidity in hydromorphic habitats in West Siberian Plain. Int. J. Environ. Stud. 2014, 71, 629–636. [Google Scholar] [CrossRef]
- Holyk, H.M.; Goncharenko, I.V. Syntaxonomy, synphytoindication analysis and anthropogenic transformation of forest vegetation in Kyiv city. Ecol. Noospherol. 2017, 28, 49–63. [Google Scholar] [CrossRef]
- Zhukov, O.V.; Potapenko, O.V. Environmental impact assessment of distribution substations: The case of phytoindication. Ukr. J. Ecol. 2017, 7, 5–21. [Google Scholar] [CrossRef]
- Glibovytska, N.; Mykhailiuk, Y. Phytoindication research in the system of environmental monitoring. Ecol. Sci. 2020, 28, 111–114. [Google Scholar] [CrossRef]
- Janssens, F.; Peeters, A.; Tallowin, J.R.B.; Bakker, J.P.; Bekker, R.M.; Fillat, F.; Oomes, M.J.M. Relationship between soil chemical factors and grassland diversity. Plant Soil 1998, 202, 69–78. [Google Scholar] [CrossRef]
- Bobbink, R.; Hornung, M.; Roelofs, J.G.M. The effects of air-borne nitrogen pollutants on species diversity in natura and semi-natural European vegetation. J. Ecol. 1998, 86, 717–738. [Google Scholar] [CrossRef]
- Löfgren, O.; Hall, K.; Schmid, B.C.; Prentice, H.C. Grasslands ancient and modern: Soil nutrients, habitat age and their relation to Ellenberg N. J. Veg. Sci. 2020, 31, 367–379. [Google Scholar] [CrossRef]
- Wassen, M.J.; Venterink, H.O.; Lapshina, E.D.; Tanneberger, F. Endangered plants persist under phosphorus limitation. Nature 2005, 437, 547–550. [Google Scholar] [CrossRef]
- CGS. Map of Soil Types of the Czech Republic, 1:50,000. Czech Geological Society. 2017. Available online: https://mapy.geology.cz/pudy/ (accessed on 8 November 2022).
- CGS. Geological Map of the Czech Republic, 1:50,000. Czech Geological Society. 2018. Available online: https://mapy.geology.cz/geocr50/ (accessed on 8 November 2022).
- Westhoff, V.; van der Maarel, E. The Braun-Blanquet Approach. In Classification of Plant Communities; Whittaker, R.H., Ed.; W. Junk: Hague, The Netherlands, 1978; pp. 289–399. [Google Scholar]
- Kaplan, Z.; Danihelka, J.; Chrtek, J.; Kirschner, J.; Kubát, K.; Štech, M.; Štěpánek, J. (Eds.) Key to the Flora of the Czech Republic; Academia: Praha, Czech Republic, 2019; p. 1168. ISBN 978-80-200-2660-6. (In Czech) [Google Scholar]
- Ter Braak, C.J.F.; Šmilauer, P. Canoco Reference Manual and User’s Guide: Software for Ordination (Version 5.0); Microcomputer Power: Ithaca, NY, USA, 2012. [Google Scholar]
- Tyler, T.; Herbertsson, L.; Olofsson, J.; Olsson, P.A. Ecological indicator and traits values for swedish vascular plants. Ecol. Indic. 2021, 120, 106923. [Google Scholar] [CrossRef]
- Uldrijan, D.; Kováčiková, M.; Jakimiuk, A.; Vaverková, M.D.; Winkler, J. Ecological effects of preferential vegetation composition developed on sites with photovoltaic power plants. Ecol. Eng. 2021, 168, 106274. [Google Scholar] [CrossRef]
- Vaverková, M.D.; Winkler, J.; Uldrijan, D.; Ogrodnik, P.; Vespalcová, T.; Aleksiejuk-Gawron, J.; Adamcová, D.; Koda, E. Fire hazard associated with different types of photovoltaic power plants: Effect of vegetation management. Renew. Sustain. Energy Rev. 2022, 162, 112491. [Google Scholar] [CrossRef]
- Schindler, B.Y.; Blaustein, L.; Lotan, R.; Shalom, H.; Kadas, G.J.; Seifan, M. Green roof and photovoltaic panel integration: Effects on plant and arthropod diversity and electricity production. J. Environ. Manag. 2018, 225, 288–299. [Google Scholar] [CrossRef]
- Köhler, M.; Shmidt, M.; Laar, M.; Wachsmann, U.; Krauter, S. Photovoltaic panels on greened roofs: Positive interaction between two elements of sustainable architecture. In Proceedings of the RIO 02-World Climate & Energy Event, Rio de Janeiro, Brazil, 6–11 January 2002; pp. 6–11. [Google Scholar]
- Köhler, M.; Wiartalla, W.; Feige, R. Interaction between PV-systems and extensive green roofs. In Proceedings of the Fifth Annual Greening Rooftops for Sustainable Communities Conference, Awards and Trade Show, Minneapolis, MN, USA, 29 April–1 May 2007; pp. 1–16. [Google Scholar]
- Bousselot, J.; Slabe, T.; Klett, J.; Koski, R. Photovoltaic array influences the growth of green roof plants. J. Living Arch. 2017, 4, 9–18. [Google Scholar] [CrossRef]
- Wu, Z.; Dijkstra, P.; Koch, G.W.; Peñuelas, J.; Hungate, B.A. Responses of terrestrial ecosystems to temperature and precipitation change: A meta-analysis of experimental manipulation. Glob. Change Biol. 2011, 17, 927–942. [Google Scholar] [CrossRef]
- Blaydes, H.; Potts, S.G.; Whyatt, J.D.; Armstrong, A. Opportunities to enhance pollinator biodiversity in solar parks. Renew. Sustain. Energy Rev. 2021, 145, 111065. [Google Scholar] [CrossRef]
- Lovich, J.E.; Ennen, J.R. Wildlife conservation and solar energy development in the Desert Southwest, United States. BioScience 2011, 61, 982–992. [Google Scholar] [CrossRef]
- Moore-O’Leary, K.; Hernandez, R.R.; Johnston, D.S.; Abella, S.R.; Tanner, K.E.; Swanson, A.C.; Kreitler, J.; Lovich, J.E. Sustainability of utility-scale solar energy—Critical ecological concepts. Front. Ecol. Environ. 2017, 15, 385–394. [Google Scholar] [CrossRef]
- Benton, T.G.; Vickery, J.A.; Wilson, J.D. Farmland biodiversity: Is habitat heterogeneity the key? Trends. Ecol. Evol. 2003, 18, 182–188. [Google Scholar] [CrossRef]
- Hristov, J.; Clough, Y.; Sahlin, U.; Smith, H.G.; Stjernman, M.; Olsson, O.; Sahrbacher, A.; Brady, M.V. Impacts of the EU’s Common Agricultural Policy “Greening” reform on agricultural development, biodiversity, and ecosystem services. Appl. Econ. Perspect. Policy 2020, 42, 716–738. [Google Scholar] [CrossRef]
- Donald, R.F.; Green, R.E.; Heath, M.F. Agricultural intensification and the collapse of Europe’s farmland bird populations. Proc. R. Soc. B. 2001, 268, 25–29. [Google Scholar] [CrossRef] [PubMed]
- Tilman, D.; Fargione, J.; Wolff, B.; D’Antonio, C.; Dobson, A.; Howarth, R.; Schindler, D.; Schlesinger, W.H.; Simberloff, D.; Swackhamer, D. Forecasting agriculturally driven global environmental change. Science 2001, 292, 281–284. [Google Scholar] [CrossRef]
- Raven, P.H.; Wagner, D.L. Agricultural intensification and climate change are rapidly decreasing insect biodiversity. Proc. Natl. Acad. Sci. USA 2021, 118, 2002548117. [Google Scholar] [CrossRef]
- Tscharntke, T.; Klein, A.M.; Kruess, A.; Steffan-Dewenter, I.; Thies, C. Landscape perspectives on agricultural intensification and biodiversity—Ecosystem service management. Ecol. Lett. 2005, 8, 857–874. [Google Scholar] [CrossRef]
- Hines, J.; Ebeling, A.; Barnes, A.D.; Brose, U.; Scherber, C.; Scheu, S.; Tscharntke, T.; Weisser, W.W.; Giling, D.P.; Klein, A.M.; et al. Mapping change in biodiversity and ecosystem function research: Food webs foster integration of experiments and science policy. Adv. Ecol. Res. 2019, 61, 297–322. [Google Scholar] [CrossRef]
- Singhal, R.K.; Chauhan, J.; Jatav, H.S.; Rajput, V.D.; Singh, G.S.; Bose, B. Artificial night light alters ecosystem services provided by biotic components. Biol. Futur. 2021, 72, 169–185. [Google Scholar] [CrossRef]
- Fuller, R.J.; Trevelyan, R.J.; Hudson, R.W. Landscape composition models for breeding bird populations in lowland English farmland over a 20 year period. Ecography 1997, 20, 295–307. [Google Scholar] [CrossRef]
- Dover, J.W.; Sparks, T.; Clarke, S.; Gobbett, K.; Glossop, S. Linear features and butterflies: The importance of green lanes. Agric. Ecosyst. Environ. 2000, 80, 227–242. [Google Scholar] [CrossRef]
- Wilson, J.D.; Whittingham, M.J.; Bradbury, R.B. The management of crop structure: A general approach to reversing the impacts of agricultural intensification on birds? Ibis 2005, 147, 453–463. [Google Scholar] [CrossRef]
- Jannoyer, M.L.; Le Bellec, F.; Lavigne, C.; Achard, R.; Malézieux, E. Choosing cover crops to enhance ecological services in orchards: A multiple criteria and systemic approach applied to tropical areas. Procedia Environ. Sci. 2011, 9, 104–112. [Google Scholar] [CrossRef]
- Ayoubi, S.; Mohammadi, A.; Abdi, M.R.; Abbaszadeh Afshar, F.; Wang, L.; Zeraatpisheh, M. Assessment of soil redistribution following land rehabilitation with an apple orchard in hilly regions of central Iran. Agronomy 2022, 12, 451. [Google Scholar] [CrossRef]
- Ramos, M.F.; da Silva Almeida, W.R.; do Amaral, R.D.L.; Suzuki, L.E.A.S. Degree of compactness and soil quality of peach orchards with different production ages. Soil Tillage Res. 2022, 219, 105324. [Google Scholar] [CrossRef]
- Beniaich, A.; Guimarães, D.V.; Avanzi, J.C.; Silva, B.M.; Acuña-Guzman, S.F.; dos Santos, W.P.; Silva, M.L.N. Spontaneous vegetation as an alternative to cover crops in olive orchards reduces water erosion and improves soil physical properties under tropical conditions. Agric. Water Manag. 2023, 279, 108186. [Google Scholar] [CrossRef]
- Fagerholm, N.; Torralba, M.; Burgess, P.J.; Plieninger, T. A systematic map of ecosystem services assessments around European agroforestry. Ecol. Indic. 2016, 62, 47–65. [Google Scholar] [CrossRef]
- Ioannidou, S.C.; Litskas, V.D.; Stavrinides, M.C.; Vogiatzakis, I.N. Linking management practices and soil properties to Ecosystem Services in Mediterranean mixed orchards. Ecosyst. Serv. 2022, 53, 101378. [Google Scholar] [CrossRef]
- Picuno, P.; Cillis, G.; Statuto, D. Investigating the time evolution of a rural landscape: How historical maps may provide environmental information when processed using a GIS. Ecol. Eng. 2019, 139, 105580. [Google Scholar] [CrossRef]
- Van Den Berge, S.; Tessens, S.; Baeten, L.; Vanderschaeve, C.; Verheyen, K. Contrasting vegetation change (1974–2015) in hedgerows and forests in an intensively used agricultural landscape. Appl. Veg. Sci. 2019, 22, 269–281. [Google Scholar] [CrossRef]
- Sánchez, A.C.; Jones, S.K.; Purvis, A.; Estrada-Carmona, N.; De Palma, A. Landscape and functional groups moderate the effect of diversified farming on biodiversity: A global meta-analysis. Agric. Ecosyst. Environ. 2022, 332, 107933. [Google Scholar] [CrossRef]
- Steffan-Dewenter, I. Importance of habitat area and landscape context for species richness of bees and wasps in fragmented orchard meadows. Conserv. Biol. 2003, 17, 1036–1044. [Google Scholar] [CrossRef]
- Paesel, H.K.; Schmitz, A.; Isselstein, J. Heterogeneity and diversity of orchard grassland vegetation in Central Germany: Role of tree stock, soil parameters and site management. Agrofor. Syst. 2019, 93, 825–836. [Google Scholar] [CrossRef]
- Fattorini, S. Biotope prioritisation in the Central Apennines (Italy): Species rarity and cross-taxon congruence. Biodivers. Conserv. 2021, 19, 3413–3429. [Google Scholar] [CrossRef]
- Schaeckermann, J.; Pufal, G.; Mandelik, Y.; Klein, A.M. Agro-ecosystem services and dis-services in almond orchards are differentially influenced by the surrounding landscape. Ecol. Entomol. 2015, 40, 12–21. [Google Scholar] [CrossRef]
- Gkisakis, V.; Volakakis, N.; Kollaros, D.; Bàrberi, P.; Kabourakis, E.M. Soil arthropod community in the olive agroecosystem: Determined by environment and farming practices in different management systems and agroecological zones. Agric. Ecosyst. Environ. 2016, 218, 178–189. [Google Scholar] [CrossRef]
- Winkler, J.; Ježová, M.; Punčochář, R.; Hurajová, E.; Martínez Barroso, P.; Kopta, T.; Semerádová, D.; Vaverková, M.D. Fire Hazard: Undesirable Ecosystem Function of Orchard Vegetation. Fire 2023, 6, 25. [Google Scholar] [CrossRef]
- Vignozzi, N.; Agnelli, A.E.; Brandi, G.; Gagnarli, E.; Goggioli, D.; Lagomarsino, A.; Pellegrini, S.; Simoncini, S.; Simoni, S.; Valboa, G.; et al. Soil ecosystem functions in a high-density olive orchard managed by different soil conservation practices. Appl. Soil Ecol. 2019, 134, 64–76. [Google Scholar] [CrossRef]
- Simoni, S.; Caruso, G.; Vignozzi, N.; Gucci, R.; Valboa, G.; Pellegrini, S.; Palai, G.; Goggioli, D.; Gagnarli, E. Effect of long-term soil management practices on tree growth, yield and soil biodiversity in a high-density olive agro-ecosystem. Agronomy 2021, 11, 1036. [Google Scholar] [CrossRef]
- González-Gómez, L.; Intrigliolo, D.S.; Rubio-Asensio, J.S.; Buesa, I.; Ramírez-Cuesta, J.M. Assessing almond response to irrigation and soil management practices using vegetation indexes time-series and plant water status measurements. Agric. Ecosyst. Environ. 2022, 339, 108124. [Google Scholar] [CrossRef]
- Merwin, I.A.; Stiles, W.C.; van Es, H.M. Orchard groundcover management impacts on soil physical properties. J. Am. Soc. Hortic. Sci. 1994, 119, 216–222. [Google Scholar] [CrossRef]
- Demestihas, C.; Plénet, D.; Génard, M.; Raynal, C.; Lescourret, F. Ecosystem services in orchards. A review. Agron. Sustain. Dev. 2017, 37, 12. [Google Scholar] [CrossRef]
- Socher, S.A.; Prati, D.; Boch, S.; Müller, J.; Klaus, V.H.; Hölzel, N.; Fischer, M. Direct and productivity-mediated indirect effects of fertilization, mowing and grazing on grassland species richness. J. Ecol. 2012, 100, 1391–1399. [Google Scholar] [CrossRef]
- Chollet, S.; Brabant, C.; Tessier, S.; Jung, V. From urban lawns to urban meadows: Reduction of mowing frequency increases plant taxonomic, functional and phylogenetic diversity. Landsc. Urban Plan. 2018, 180, 121–124. [Google Scholar] [CrossRef]
- Watson, C.J.; Carignan-Guillemette, L.; Turcotte, C.; Maire, V.; Proulx, R. Ecological and economic benefits of low-intensity urban lawn management. J. Appl. Ecol. 2020, 57, 436–446. [Google Scholar] [CrossRef]
- Uldrijan, D.; Černý, M.; Winkler, J. Solar Park: Opportunity or Threat for Vegetation and Ecosystem. J. Ecol. Eng. 2022, 23, 1–10. [Google Scholar] [CrossRef]
- Winkler, J.; Vaverková, M.D.; Havel, L. Anthropogenic life strategy of plants. Anthr. Rev. 2023. in print. [Google Scholar] [CrossRef]
Figure 1.
Study site overview.

Figure 2.
Representation of biological groups of plant species in the monitored dates and habitats of the solar park.
Figure 2.
Representation of biological groups of plant species in the monitored dates and habitats of the solar park.

Figure 3.
Ordination diagram expressing the correlation between the occurrence of plant taxa and site in the solar park. Result of CCA analysis; overall explained variability = 17.6%; F-ratio = 11.18; p-value = 0.001. Legend: Between—site between the rows of PV panels; Under PV—site under PV panels.

Figure 4.
Biomonitoring-moisture criterion, representation of groups of indicator taxa.

Figure 5.
Biomonitoring-soil pH criterion, representation of groups of indicator taxa.

Figure 6.
Biomonitoring-criterion nitrogen, representation of groups of indicator taxa.

Figure 7.
Biomonitoring-criterion phosphorus, representation of groups of indicator taxa.

Figure 8.
Biomonitoring-salinity criterion, representation of groups of indicator taxa.


Table 1.
Classification of identified plant taxa into groups according to their relation to solar park (CCA results).
Table 1.
Classification of identified plant taxa into groups according to their relation to solar park (CCA results).
| Groups of Taxa | Taxon |
|---|---|
| Group 1 prefers sites Under PV and on dries sites | Acer campestre (AceCamp), Agrostis stolonifera (AgrStol), Artemisia vulgaris (ArtVulg), Digitaria sanguinalis (DigSang), Potentilla anserina (PotAnse), Rubus sp. (RubSp.), Sambucus nigra (SamNigr), Sedum acre (SedAcre), S. album (SedAlbu), S. sexangulare (SedSexa), Tussilago farfara (TusFarf). |
| Group 2 prefers sites Under PV | Anthriscus sylvestris (AntSylv), Apera spica-venti (ApeSpic), Arctium tomentosum (ArcTome), Bromus hordeaceus (BroHord), B. sterilis (BroSter), B. tectorum (BroTect), Calamagrostis epigejos (CalEpig), Capsella bursa-pastoris (CapBurs), Cirsium arvense (CirArve), Epilobium adenocaulon (EpiAden), Galium aparine (GalApar), Geranium pusillum (GerPusi), Chelidonium majus (CheMaju), Impatiens parviflora (ImpParv), Lamium purpureum (LamPurp), Plantago major (PlaMajo), Polygonum aviculare (PolAvic), Prunus domestica (PruDome), Rosa canina (RosCani), Salix alba (SalAlba), Senecio vulgaris (SenVulg), Setaria pumila (SetPumi), Setaria viridis (SetViri), Solanum nigrum (SolNigr), Sonchus oleraceus (SonOler), Tripleurospermum inodorum (TriInod), Urtica dioica (UrtDioi), Urtica urens (UrtUren). |
| Group 3 with no preferences | Achillea millefolium (AchMill), Convolvulus arvensis (ConArve), Crepis biennis (CreBien), Erigeron annuus (EriAnnu), Geranium dissectum (GerDiss), Chenopodium album (CheAlbu), Malva neglecta (MalNegl), Plantago media (PlaMedi), Tanacetum vulgare (TanVulg), Taraxacum sect. Taraxacum (TarSect), Vicia cracca (VicCrac), Viola arvensis (VioArve). |
| Group 4 prefers sites Between | Alopecurus pratensis (AloPrat), Anthemis arvensis (AntArve), Anthoxanthum odoratum (AntOdor), Armoracia rusticana (ArmRust), Bellis perennis (BelPere), Dactylis glomerata (DacGlom), Equisetum arvense (EquArve), Fallopia convolvulus (FalConv), Festuca rubra (FesRubr), Fragaria vesca (FraVesc), Galium album (GalAlbu), Lamium album (LamAlbu), Lathyrus pratensis (LatPrat), Leucanthemum vulgare (LeuVulg), Lolium perenne (LolPere), Medicago lupulina (MedLupu), Phleum pratense (PhlPrat), Ranunculus acris (RanAcri), Rumex crispus (RumCrisp), Salix cinerea (SalCine), Silene latifolia (SilLati), Trifolium hybridum (TriHybr), Trifolium pratense (TriPrat), Trifolium repens (TriRepe), Veronica chamaedrys (VerCham), Vicia sepium (VicSepi). |
Disclaimer/Publisher’s Note: The statements, opinions and data contained in all publications are solely those of the individual author(s) and contributor(s) and not of MDPI and/or the editor(s). MDPI and/or the editor(s) disclaim responsibility for any injury to people or property resulting from any ideas, methods, instructions or products referred to in the content. |
© 2023 by the authors. Licensee MDPI, Basel, Switzerland. This article is an open access article distributed under the terms and conditions of the Creative Commons Attribution (CC BY) license (https://creativecommons.org/licenses/by/4.0/).
Share and Cite
MDPI and ACS Style
Uldrijan, D.; Winkler, J.; Vaverková, M.D. Bioindication of Environmental Conditions Using Solar Park Vegetation. Environments 2023, 10, 86. https://doi.org/10.3390/environments10050086
AMA Style
Uldrijan D, Winkler J, Vaverková MD. Bioindication of Environmental Conditions Using Solar Park Vegetation. Environments. 2023; 10(5):86. https://doi.org/10.3390/environments10050086
Chicago/Turabian StyleUldrijan, Dan, Jan Winkler, and Magdalena Daria Vaverková. 2023. "Bioindication of Environmental Conditions Using Solar Park Vegetation" Environments 10, no. 5: 86. https://doi.org/10.3390/environments10050086
Note that from the first issue of 2016, this journal uses article numbers instead of page numbers. See further details here.