
Near-Term Effects of Perennial Grasses on Soil Carbon and Nitrogen in Eastern Nebraska
by
 , ,
, ,
Salvador Ramirez II
1,*,
Marty R. Schmer
1,*,
Virginia L. Jin
1,
Robert B. Mitchell
2 and
Kent M. Eskridge
3 1
USDA–ARS, Agroecosystem Management Research Unit, University of Nebraska-Lincoln East Campus, 251 Filley Hall, Lincoln, NE 68583, USA
2
USDA–ARS, Wheat, Sorghum and Forage Research Unit, University of Nebraska-Lincoln East Campus, 251 Filley Hall, Lincoln, NE 68583, USA
3
Department of Statistics, University of Nebraska—Lincoln, 343E Harden Hall, Lincoln, NE 68583, USA
*
Authors to whom correspondence should be addressed.
Environments 2023, 10(5), 80; https://doi.org/10.3390/environments10050080
Submission received: 16 April 2023
/
Revised: 2 May 2023
/
Accepted: 2 May 2023
/
Published: 6 May 2023
(This article belongs to the Special Issue Soil Organic Carbon Assessment)
Abstract
:Incorporating native perennial grasses adjacent to annual row crop systems managed on marginal lands can increase system resiliency by diversifying food and energy production. This study evaluated (1) soil organic C (SOC) and total N stocks (TN) under warm-season grass (WSG) monocultures and a low diversity mixture compared to an adjacent no-till continuous-corn system, and (2) WSG total above-ground biomass (AGB) in response to two levels of N fertilization from 2012 to 2017 in eastern Nebraska, USA. The WSG treatments consisted of (1) switchgrass (SWG), (2) big bluestem (BGB), and (3) low-diversity grass mixture (LDM; big bluestem, Indiangrass, and sideoat grama). Soils were sampled at fixed depth increments (0–120 cm) in the WSG plots and in the adjacent corn experiment in 2012 and 2017. Soil stocks (Mg ha−1) of SOC and TN were calculated on an equivalent soil mass (ESM) basis and compared within the three WSG treatments as well as between experiments (corn compared to the mean of all WSGs). Soil organic C and TN stocks within soil layers and cumulative stocks responded to the main effect of WSG (PWSG < 0.05) but were no different when comparing the WSGs to corn (Pexpt = NS). Both SOC/TN stocks and cumulative stocks were generally greater in the LDM compared to the BGB. Neither SOC nor TN changed over time under either the WSGs or corn. Warm-season grass AGB responded to a three-way interaction of year, N rate, and WSG (p = 0.0007). Decreases in AGB over time were significant across WSGs and N levels except for SWG at 56 kg N ha−1 and LDM at 112 kg N ha−1. Above-ground biomass was generally greater in the LDM after the first harvest year (2013). Results suggest that incorporating WSGs into marginal cropland can maintain SOC and TN stocks while providing a significant source of biomass to be used in energy production or in integrated livestock systems.
1. Introduction
Renewable energy from biomass is expected to play a critical role in developing a low-carbon economy. Native perennial warm-season grasses (WSGs) are being evaluated as a bioenergy feedstock that can be grown on marginally productive lands [1], especially those already under agricultural management. Annual row crop production has expanded onto marginally productive lands in the U.S. Midwest [2], triggering important tradeoffs such as increased carbon (C) emissions [3,4], decreased biodiversity [5], and wildlife habitat losses [6]. A potential alternative to growing annual row crops, such as corn (Zea mays L.), on marginally productive lands is to grow a dedicated WSG bioenergy feedstock [7]. Transitioning marginally productive lands back from annual row crops to perennial bioenergy grasses could positively impact soil C stocks [8], decrease GHG emissions [9], and positively impact native biodiversity on marginally productive lands [5], all while providing an important feedstock for an emerging bioeconomy.
There are substantial differences between cropping systems in their ability to sequester SOC due to (1) management, (2) crop strategies for partitioning C over time, and (3) the amount and chemical composition of plant residues [10]. How annual vs. perennial plants partition C is especially important because this determines how much C becomes harvestable biomass and how much enters the soil, contributing to SOC. Research comparing plant root-to-shoot ratios of C suggests that WSGs such as switchgrass (Panicum virgatum L.) allocate greater C to root biomass than annual row crops (0.33–0.55 for fertilized corn [11,12] and 1.5–6.1 for switchgrass [13]). Thus, in WSG systems, the primary source of C inputs are roots [14,15]. Additionally, there may be differences between WSG monocultures and mixtures in their ability to sequester SOC, where greater diversity can be expected to enhance SOC storage potential via increased root biomass [16,17,18]. Ultimately, more studies are needed that compare WSGs to continuous corn systems and WSG mixtures to WSG monocultures and continuous corn systems to determine the SOC accrual potential of these different cropping systems on marginal lands.
It has become increasingly important to monitor SOC stocks under bioenergy production systems on marginally productive lands. First, measured SOC data can be used for model validation. Soil organic C dynamics are often simulated or estimated using process-based models such as the Systems Approach to Land-Use Sustainability (SALUS) model [19]. Predicted SOC changes, using SALUS, under switchgrass grown on marginal lands in the U.S. Great Lakes Region would store, on average, 0.87 Mg C ha−1 year−1, albeit with substantial variation in the rate of SOC accumulation (range: 0.2–1.3 Mg C ha−1 year−1) [20]. Another reason that it is important to monitor SOC stocks under bioenergy production systems is that the extent to which biogenic C emissions are balanced by changes in SOC storage can depend on soil and climate, resulting in variable data across a region. For example, Jin, Schmer, Stewart, Mitchell, Williams, Wienhold, Varvel, Follett, Kimble and Vogel [9] reported SOC accrual rates of 1.1 Mg C ha−1 year−1 over 16 years in the top 30 cm of soil under N fertilization in eastern NE. However, Liebig, et al. [21] reported variable changes in SOC, ranging from −0.6 to 4.3 Mg C ha−1 year−1 for the 0–30 cm depth after 5 years across 10 sites in ND, SD, and NE. More data are needed, especially at field-scale sites, to account for this variability in SOC changes to both better estimate future changes in SOC via processed-based models and to design bioenergy feedstock systems that both meet the demand of bioenergy production while preserving or building our natural resources.
The objectives of this study were to obtain field-scale information on the potential for incorporating perennial WSG grasses for bioenergy into existing cropping systems (e.g., no-till continuous corn) on marginal lands in eastern Nebraska. Near-term changes in SOC and TN stocks under WSG monocultures, a WSG mixture, and continuous corn were assessed in both surface and subsurface soils on marginally productive land while documenting WSG yields to be used for biofuel production. Ultimately, this 5-year evaluation will improve our understanding of the near-term bioenergy potential and SOC sequestration potential of WSG systems on marginally productive lands and help inform management decisions related to land use optimization.
2. Materials and Methods
2.1. Experimental Design
This study was established in 2012 at the University of Nebraska—Lincoln (UNL) Eastern Nebraska Research, Extension, and Education Center (ENREEC) near Ithaca, NE (41°09′09″ N, 96°27′17″ W). Long-term mean annual temperature is 10.3 °C and mean annual precipitation is 731 mm, with 447 mm occurring during the growing season (April–October). Soils at the study site are comprised of 36% eroded Yutan silty clay loam (fine-silty, mixed, superactive, mesic Mollic Hapludalfs, 2–6% slope), 35% Tomek silt loam (fine, smectitic, mesic Pachic Argiudolls; 0–2% slope), 28% Filbert silt loam (fine, smectitic, mesic Vertic Argialbolls; 0–1% slope), and <1% is Scott silt loam [22]. Prior to establishing this experiment, the site had been under a corn (Zea mays L.)-soybean [Glycine max (L.) Merr.] rotation for >20 years. The site was in a no-till crop rotation for five years prior to experiment establishment.
Cropping system treatments consisted of (1) “Liberty” switchgrass (SWG), (2) “Bonanza” and “Goldmine” blend of big bluestem (Andropogon gerardii Vitman) (BGB), (3) low-diversity grass mixture (LDM; big bluestem, “Scout” and “Warrior” blend of Indiangrass [Sorghastrum nutans (L.) Nash], and “Butte” sideoats grama [Bouteloua curtipendula (Michx.) Torr.]), and (4) no-till continuous corn. The WSG treatments were replicated three times in a complete randomized block as the whole plot factor. The whole plot factor dimensions were 76 m by 107 m. In the WSG plots, an additional randomized split-plot factor consisting of two N fertilization rates (56 and 112 kg N ha−1) was 38 m by 107 m. To facilitate management, the continuous corn treatment was not randomized with WSG treatments but instead planted adjacent to the perennial grasses. Within the corn plots, stover management treatments were randomly assigned, where stover was either (1) left unharvested or (2) harvested at a rate of 50% plus the addition of a triticale cover crop (×Triticosecale Wittmack).
2.2. WSG Management
The WSGs were seeded using a Truax no-till grass drill (Truax Company, Minneapolis, MN, USA) in the spring of 2012 on a pure live seed (PLS) basis of 325 PLS m2. Big bluestem was seeded as a 50:50 blend of “Bonanza” and “Goldmine”. Indiangrass in the LDM was seeded as a 50:50 blend of “Scout” and “Warrior”. Nitrogen fertilizer was first applied in spring 2013. Warm-season grass treatments were fertilized annually with either a low (56 kg N ha−1) or high (112 kg N ha−1) rate, except in 2016, when N fertilizer rates were reduced to 28 kg N ha−1 and 56 kg N ha−1, respectively, due to a lack of yield response and to begin evaluating grass response to reduced N application. After a killing frost (mid-October to mid-November), a small-plot forage flail harvester (Carter Manufacturing, Indiana) was used to randomly harvest an area (0.9 × 9.1-m) from each WSG plot at a cutting height of 5 cm to determine aboveground biomass (AGB) production. The remaining biomass was removed using commercial-scale hay equipment to an average cutting height of 10 cm above the soil surface. Bales were weighed and removed from the plots.
2.3. Corn Management
Corn management practices represented those commonly used in the region and were performed with commercial-scale field equipment. Corn was planted in late April in 76-cm rows at a planting rate of 64,250 seeds ha−1. Corn was fertilized in the spring prior to planting at a rate of 134 kg N ha−1. Herbicide formulations varied among years, although at least one application of glyphosate [N-(phosphonomethyl) glycine] occurred. Corn stover from the continuous corn removal treatment was harvested in the fall of each year using a self-propelled disk mower and round baler. Triticale was seeded in the corn stover removal treatment after grain harvest using a no-till grain drill.
2.4. Soil Sampling and C and N Analysis
Soil samples for SOC and TN stocks were taken to a depth of 120 cm in sampling increments of 0–5, 5–15, 15–30, 30–60, 60–90, and 90–120 cm in 2012 and 2017. Six cores (3.3 diam.) were taken from each N subplot in the WSG plots and from each subplot in the corn system using a directed soil sampling approach. Soil apparent electrical conductivity (ECa) was measured using an electromagnetic (EM) induction survey prior to soil sampling. The EM survey was conducted using an EM-38 electromagnetic induction sensor (Geonics Limited, Mississauga, ON, Canada) installed on a non-metallic sled pulled behind an all-terrain vehicle. A global positioning system (GPS) was used to georeference soil ECa to a depth of ~75 cm as the survey was conducted. All samples were weighed to determine bulk density, air-dried, ground to pass a 2-mm screen, and analyzed for total C and N. Soil organic C was calculated from total C by subtracting inorganic C determined by a pressure calcimeter when soil pH > 7.4 indicated the potential presence of carbonates [23].
Due to differences in soil bulk densities by year, soil stocks of SOC and TN were calculated on an equivalent soil mass (ESM) basis, as described by [24].
2.5. Statistical Analysis
Nitrogen fertilization effects on WSG AGB from 2013 (the first year of fertilizer application) to 2016 were assessed using a generalized linear mixed model using a split-plot ANOVA (PROC GLIMMIX; SAS v9.4). The whole plot factor WSG and subplot factor N fertilization rate were considered fixed effects; block was a random effect; and year was a repeated measure. Least squares means were used to assess significant main effects or treatment interactions, and differences were reported as significant at the 0.05 level. Tukey’s adjustment was used to adjust multiple comparisons.
Initial statistical analyses included evaluating the effects of N fertilization only in the WSGs (3 treatments) and the effects of residue management only in corn (2 treatments). The two levels of N fertilization were split-plot treatments within the WSGs, which were main plot treatments in a split-plot analysis of variance. Because N fertilization was not significant as a main or interacting effect in any soil layer, data were pooled across N levels for each WSG system in all subsequent analyses. Likewise, the effect of two stover management treatments (no stover harvest and 50% stover harvest + triticale cover crop) was independently analyzed as a RCBD since each corn plot served as a block since both treatments were in each plot. The effect of residue management was not significant as a main effect or interacting effect in any soil layer, so subsequent analyses were conducted on plot means averaged across the two corn management treatments.
Because the corn stover treatments were not randomized with the WSG treatments, the WSG and corn studies were considered different experiments. To compare changes in soil properties under the WSG and corn plots, the combined data was analyzed using an analysis of variance for combining separate experiments where treatments were nested in the experiment. The experimental error for testing the experiment effect was based on replicates only from the WSG experiment, as there were no true replications from the corn experiment. As both experiments were measured in each year, the year was considered a stripped factor across all units in both experiments. This analysis resulted in the following model terms: expt rep(expt) crop(expt) rep×crop(expt) year year×expt year×rep(expt) year×crop(expt) year×rep×crop(expt). Tests were constructed assuming rep(expt) was fixed and any interaction with rep was random, and Satterthwaite’s correction was used to estimate the denominator degrees of freedom for the F-tests. In the ANOVAs, the Expt test compares the mean of corn to the mean of all WSGs. Because the crop(type) test compares all WSG treatments (SWG, BGB, and LDM), it will be referred to as WSGs in the ANOVAs. Likewise, rep(expt) will be referred to as block, while crop×year(expt) will be referred to as WSG×year. This nested model was fit by soil layer, i.e., 0–5 cm, 5–15 cm, etc. These nested model ANOVAs were fit using SAS PROC GLIMMIX (SAS v9.4).
3. Results
3.1. Historic Climate and Crop Productivity
Mean monthly temperature highs and lows approximated the 30-year average throughout the growing season for the duration of this study (2012–2017) (Table 1). However, air temperatures in May and July 2012 were 10% to 19% higher than the 30-year mean. Monthly cumulative precipitation varied from the 30-year average throughout the growing season from 2012 to 2017. May’s monthly cumulative precipitation in 2012 was 15% lower than the 30-year average. Additionally, monthly cumulative precipitation was considerably lower than the 30-year average in 2012 and 2013, especially in July and August. July monthly precipitation 2012–2014 was 92.2, 81.5, and 83.5% lower, respectively, than the 30-year average.
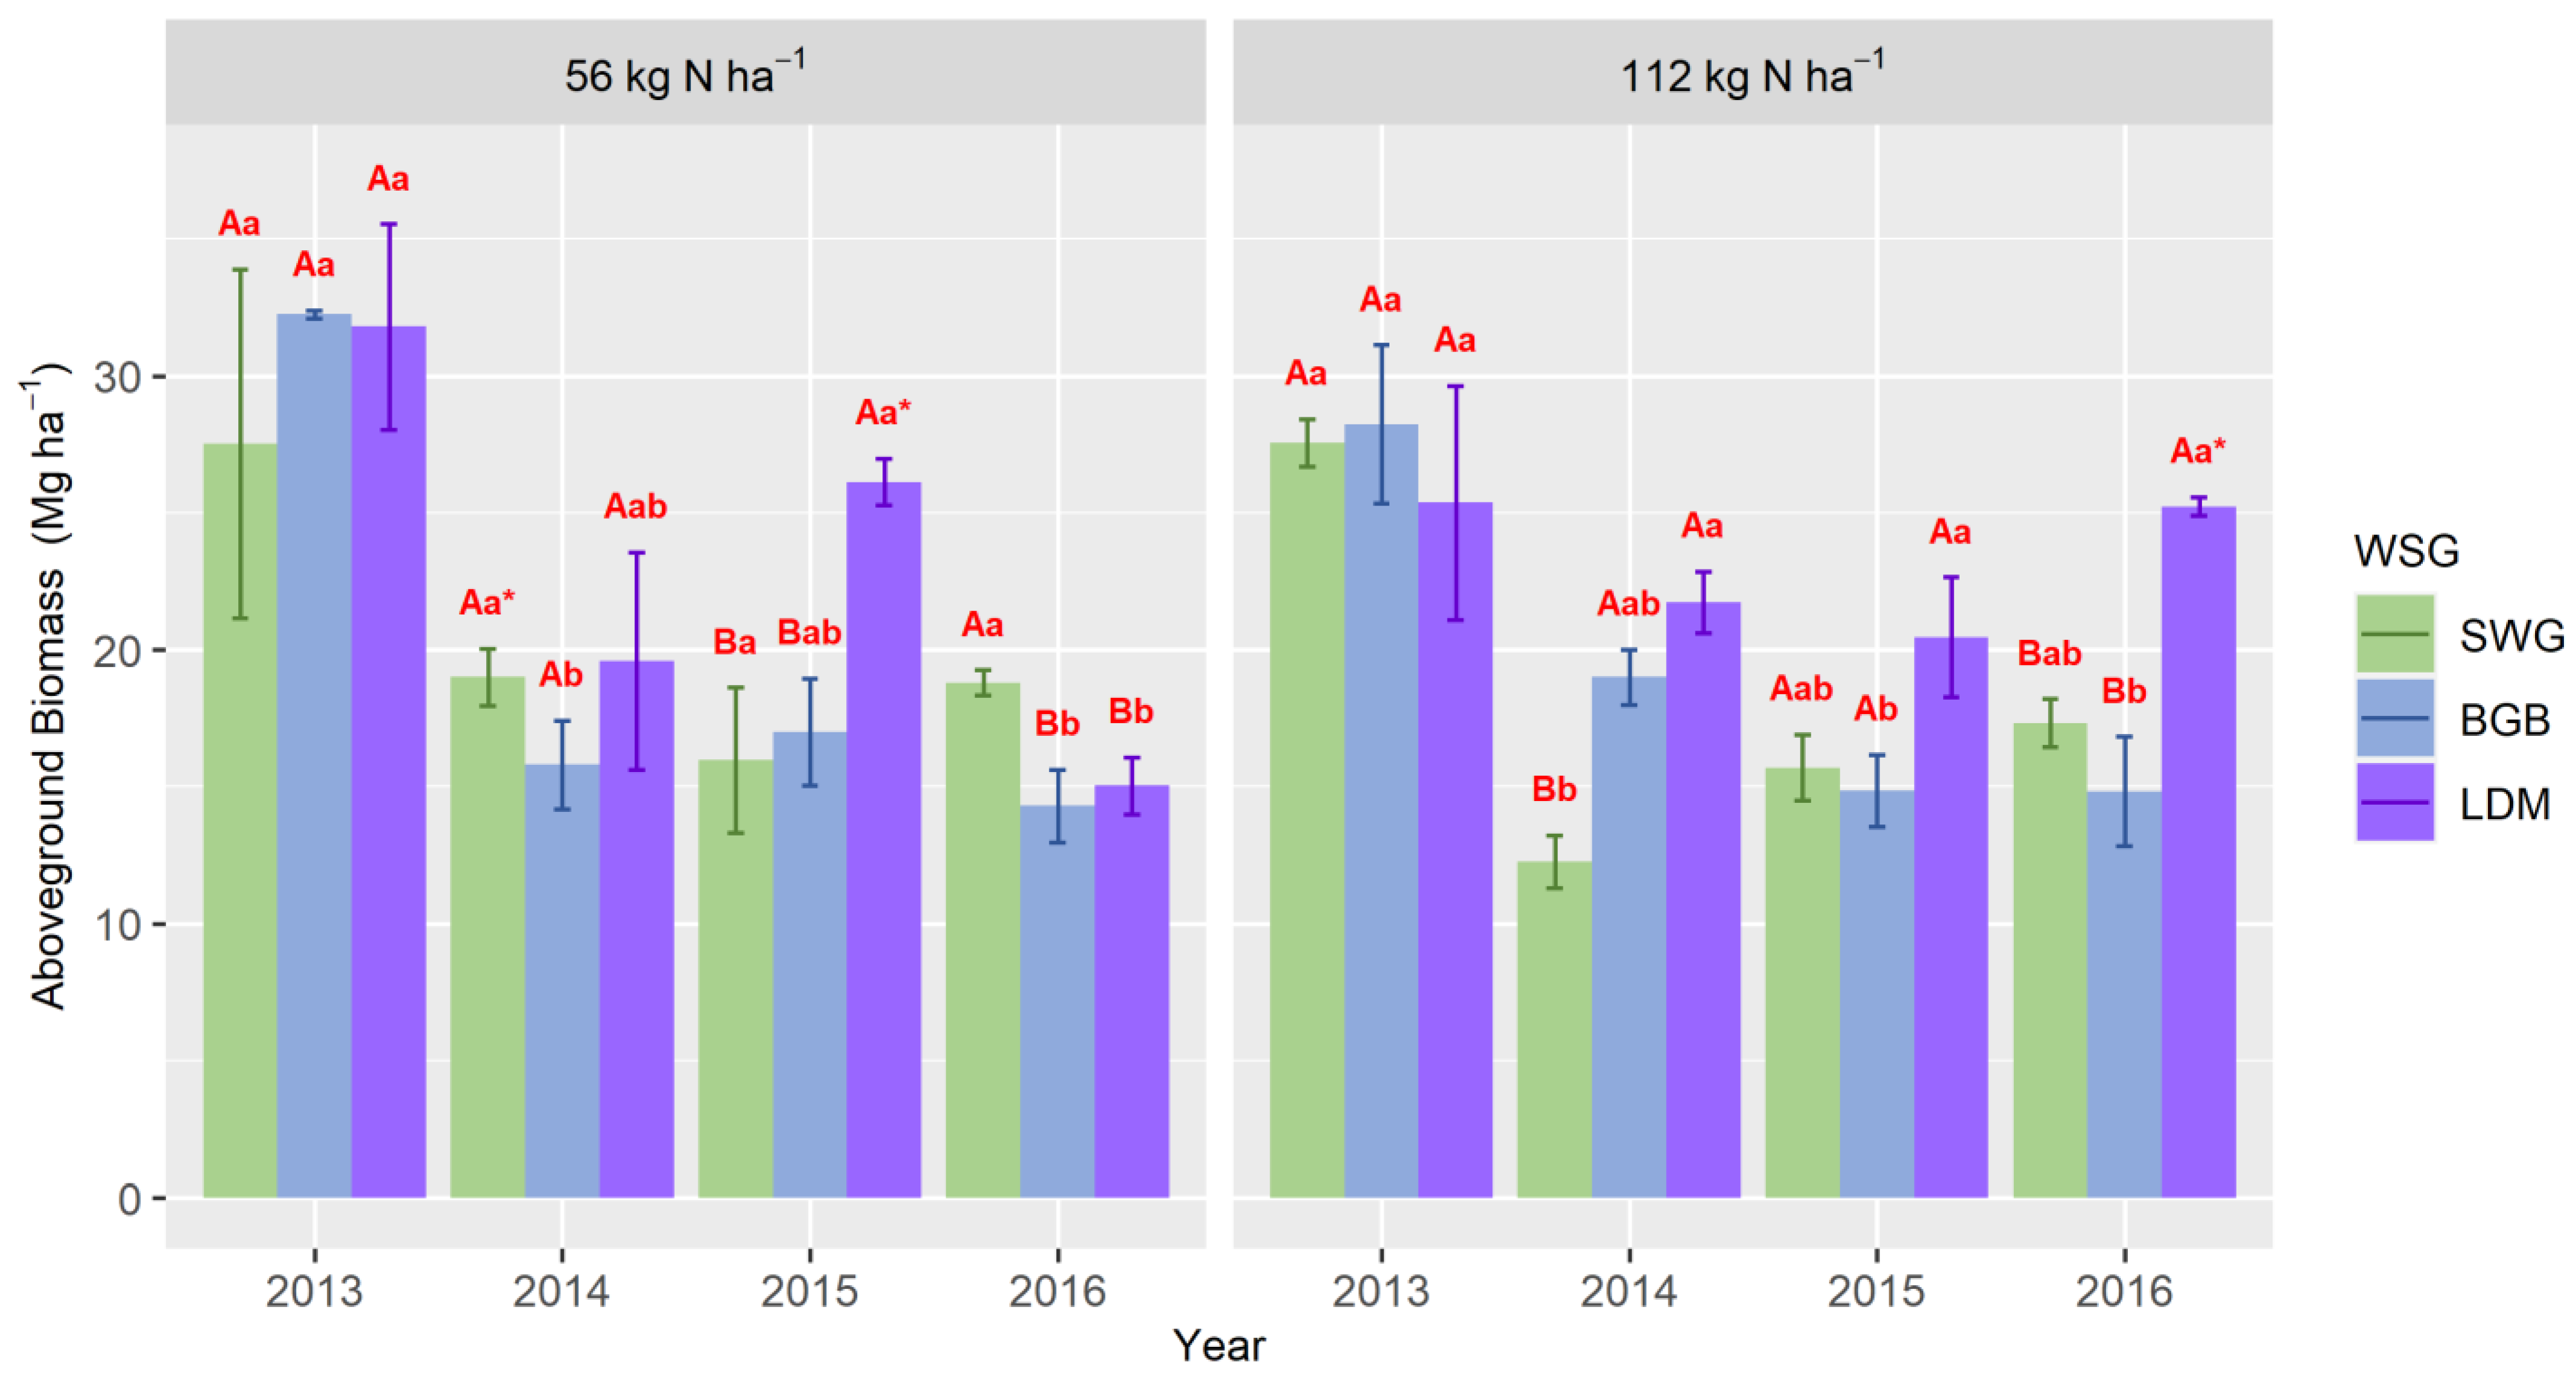
Warm-season grass above-ground biomass (AGB) responded to a three-way interaction of year, N rate, and WSG (p = 0.0017, Figure 1). Although not always significant, AGB declined over time across WSGs and N rates, except for LDM under the high N rate. Under the low N rate, AGB differed across years in the BGB and LDM systems. For BGB, AGB was the greatest in 2013 compared to 2014 and 2016. Under LDM, AGB was greater in 2013 compared to 2016. Under the high N rate, AGB differed over time in the SWG and BGB systems. Under SWG, AGB was greatest in 2013 compared to 2014. Under BGB, AGB was greatest in 2013 compared to 2015 and 2016. Differences in AGB were significant under the high N rate in 2014 (SWG < BGB, LDM) and 2016 (SWG, BGB < LDM), and in 2015 (SWG, BGB < LDM) and 2016 (SWG > BGB, LDM) under the low N rate. Nitrogen fertilization was inconsistent with WSG AGB. The only WSGs that responded to N fertilization were SWG in 2014, when AGB was greater under high N, and LDM in 2015 (greatest under low N) and 2016 (greater under high N).
3.2. Soil Organic Carbon and Total Nitrogen Stocks by Soil Layer and Cumulative Depth
Soil organic C and total N stocks, both by soil layer (0–5, 5–15, 15–30, 30–60, and 60–90 cm) and in cumulative depths (0–15, 0–30, 0–60, and 0–90 cm cumulative soil depths), were only affected by the main effect of WSG (PWSG < 0.05) (Table 2, Table 3 and Table 4). Both SOC and total N stocks were greater under the LDM compared to the BGB in the 15–30, 30–60, and 60–90 cm soil layers. There were no differences in SOC and TN stocks when comparing SWG to LDM or when comparing corn to all WSGs (Pexpt = NS). Cumulative SOC and TN stocks were greater under the LDM compared to the BGB in the 0–30, 0–60, and 0–90 cumulative soil layers. Cumulative SOC and TN stocks were no different when comparing SWG to LDM or corn to all WSGs (Pexpt = NS). Neither cumulative SOC nor TN stocks changed over time (2012–2017).
4. Discussion
All WSGs were high-yielding but declined after the establishment year in this 5-year evaluation of perennial grass systems in eastern Nebraska. The LDM was generally the highest-yielding WSG, but the effect of N on WSG productivity overall was inconsistent over time. Limited treatment effects on WSG AGB were reflected in SOC and TN stocks (which were similar in no-till continuous corn soils), with few differences among the WSGs (greater under LDM compared to BGB but no differences compared to SWG) and no changes in SOC and TN over time. These results suggest that (1) while there may be some benefits to low diversity mixtures, a longer time frame may be needed to observe their effects on SOC and TN, and (2) no-till continuous corn and perennial WSGs may have similar near-term effects on SOC and TN. Biomass and soil responses are discussed in greater detail below.
4.1. Warm-Season Grass Aboveground Biomass
The low-diversity WSG mixture produced higher yields than the monocultures, contrasting with other studies that reported no yield differences [25] or lower yields under mixtures [26]. For example, Wang, Lebauer and Dietze [26] reported that switchgrass yields grown in monoculture (10.9 Mg ha−1, n = 324) were greater than both switchgrass yields grown in mixtures (4.4 Mg ha−1, n = 85) and the total yield of all grass species in mixtures (6.9 Mg ha−1, n = 90). Wang, Lebauer and Dietze [26] also reported that switchgrass yields in monocultures, but not in mixtures, were significantly positively influenced by water availability. These results suggest that factors other than water availability, such as competition, could be limiting switchgrass yield in mixtures. In this study, monthly cumulative precipitation was considerably lower than the 30-year average in 2012 (the year of establishment) and 2013, especially in July and August. After 2013, WSG yields were generally greater in the LDM. Diversifying cropping systems can increase resiliency via enhanced ecosystem services [27,28], and specifically, increase resiliency to drought events [29], supported by the greater AGB under LDM during variable moisture conditions.
In this study, there was an inconsistent effect of N fertilization on WSG aboveground biomass. In a multi-year study across the US, Hong, et al. [30] reported that switchgrass at sites with low initial soil N responded positively to N fertilization but did not respond to fertilization at locations with high initial soil N. Total N in this study did not change over time and was generally highest under the LDM, which also showed the highest biomass yields. Ultimately, the variable effects of N fertilization on above-ground biomass and the lack of response of SOC and TN stocks to N fertilization highlight how site-specific factors such as regional climate or initial N levels can impact how N fertilization affects WSGs.
4.2. Soil C Stocks under WSGs and Corn
No changes in cumulative SOC stocks were observed over time in this near-term (4 year) study under switchgrass—or any WSG or corn—in any cumulative soil layer (0–15, 0–30, 0–60, and 0–90 cm). These results differ from other studies reporting near-term SOC accrual under switchgrass [8,21] but align with results from studies reporting no near-term SOC accrual under WSG mixtures compared to WSG monocultures [31,32]. These results also support results from studies reporting few to no differences in SOC and TN stocks or accrual under WSGs compared to corn [8,33]. No changes in SOC or TN stocks due to N fertilization were observed in this study. These results differ from studies reporting changes in SOC or TN stocks under WSGs due to N fertilization [34].
Soil organic C accrual under switchgrass managed for bioenergy production has been reported in both near-term (≤5 years) and longer-term (≥9 years) studies, as well as above and below 30 cm of soil. For example, Liebig, Schmer, Vogel and Mitchell [21] reported SOC accrual rates of 1.1 and 2.9 Mg C ha−1 yr−1 in the 0–30 cm and 0–120 cm soil layers, respectively, under switchgrass managed for bioenergy after 5 years in a multi-location study that included four sites in NE. Follett, Vogel, Varvel, Mitchell and Kimble [8] reported SOC accrual rates that exceeded 2 Mg C ha−1 yr−1 after 9 years for a 0–150 cm soil depth under switchgrass in a study conducted in eastern NE. Soil organic C accrual under perennial WSGs such as switchgrass is expected because switchgrass C allocation to belowground biomass can be 4–7 times greater than that of annual crops [10], increasing SOC stocks even when a considerable portion of its aboveground biomass is harvested [35,36,37,38]. However, SOC accrual depends on both plant-driven C inputs as well as organic C decomposition rates [39], both of which are controlled by site-specific factors such as climate and soil texture [40,41], land-use history [42], and initial SOC content [43]. For example, while Slessarev, et al. [44] argue that initial SOC dependent accrual could be (1) an example of regression to the mean and (2) a statistical artifact, others in meta-analyses [45,46,47] have concluded that initial SOC content influenced SOC accrual in response to changes in agricultural management. In this study, mean initial SOC (2012) across treatments (WSGs and corn) was 64.4, 105.6, and 129.3 Mg C ha−1 for the 0–30, 0–60, and 0–90 cm cumulative soil depths, respectively. Compared to Follett, Vogel, Varvel, Mitchell and Kimble [8], this study contained 130% more initial SOC in the 0–30 soil layer. Compared to the two southeastern NE sites—Douglas and Lawrence, NE—in Liebig, Schmer, Vogel and Mitchell [21], this study contained 107, 118, and 123% as well as 210, 255, and 264% more SOC in the 0–30, 0–60, and 0–90 cm cumulative soil depths, respectively. Given that SOC accrual under perennial WSGs can be driven by various site-specific factors such as initial SOC content in addition to plant-driven C inputs, soils within the same region may not respond uniformly to perennial conversion, requiring a longer time frame to assess SOC accrual under WSGs.
The depth distribution of SOC accrual under WSGs highlights the importance of characterizing SOC dynamics in both near-surface and sub-surface soils. Soil organic C accrual in near-surface soils (0–30 cm) can increase soil aggregation, thereby reducing erosion potential [48]. These improved near-surface soil properties are especially important in systems in which soils under WSGs will be transitioned to annual cropping [49]. Soil organic C accrual deeper in the soil profile [50,51,52] can stabilize ecosystem-level C storage since over half of all SOC accrual may occur in deep soil depths [8,53] in soils under perennial WSGs. In this study, approximately half of the SOC observed across treatments occurred below 30 cm, supporting the need to monitor SOC dynamics in soils under perennial WSGs at deeper depths.
Fertilizing WSGs with N can be expected to drive SOC accrual via changes in total biomass inputs as well as biomass allocation between shoots and roots. For example, Garten, et al. [54] reported decreased root:shoot ratios in switchgrass after 5 years of 202 kg N ha−1. The effect of N on root:shoot ratios can depend on WSG species. Heggenstaller, et al. [55] reported that 140 kg N ha−1 maximized root biomass and favored nutrient allocation to roots over shoots in big bluestem and switchgrass but not in Indiangrass and gamagrass. While others have reported differences in SOC stocks under WSGs due to N fertilization in this region [34], N fertilization had no effect on SOC stocks in this study at the end of the first four years of management. Expectations that potential gains in SOC will offset N fertilization from a greenhouse gas mitigation perspective may not be met in the near term due to the absence of SOC changes as well as increased nitrous oxide emissions under higher nitrogen fertilization rates [38]. Longer time periods may be necessary before any measurable GHG mitigation potential can be realized in WSG systems on marginally productive croplands.
4.3. Soil C and Total N Stocks under All Warm Season Grasses
The results in this study support those from other studies that report no differences in the rate of SOC accrual under WSG monocultures compared to WSG mixtures [31,32]. Kibet, Blanco-Canqui, Mitchell and Schacht [32] compared four WSG monocultures to two different mixtures consisting of three WSGs in eastern Nebraska. They reported no differences in SOC and total N pools at any soil depth among grass monocultures and mixtures after 6 years of management. Bonin, Lal and Tracy [31] compared switchgrass monocultures to 4- and 10-species mixtures of native grasses in Virginia and reported no differences in total soil C due to species composition of grass mixtures after 4 years of management. While no differences in SOC accrual were observed in this study, SOC and TN stocks were greater under LDM compared to BGB in the 0–30, 0–60, and 0–90 cumulative soil layers, which could be due to enhanced root distribution in the LDM [16]. Enhanced root growth under plant mixtures has been observed in pot experiments with grassland species [17,18]. For example, Mommer, Van Ruijven, De Caluwe, Smit-Tiekstra, Wagemaker, Joop Ouborg, Bögemann, Van Der Weerden, Berendse and De Kroon [17] reported 40% greater root biomass in mixtures of two grasses and two forbs compared to their monocultures using DNA to quantify species abundances in multispecies root samples. Given that plant roots under WSGs are a primary source of SOC [15], potential enhanced root distribution in the LDM could explain the differences in SOC stocks compared to BGB. Potential changes in soil microbial dynamics could also explain the greater SOC and TN stocks under LDM compared to BGB. Increasing plant diversity can increase microbial necromass contributions to SOC [56,57] and SOC stabilization [58]. Ultimately, these initial differences in SOC stocks when comparing LDM to BGB may result in different future accrual rates, which would require a longer timeframe to investigate.
5. Conclusions
Soil organic C and TN stocks were comparable under WSGs and no-till continuous corn in eastern NE in this five-year study. When comparing C and N within the WSG treatments, the LDM generally had greater SOC and TN stocks compared to BGB, but there were no other differences when comparing LDM to SWG or all WSGs to corn. No SOC accrual under switchgrass—or any other WSG or corn—was observed in this time frame. While all WSGs were generally high-yielding, AGB declined after the first harvest year. Although not always significant, the LDM was generally the highest-yielding WSG. The effect of N on WSG aboveground biomass in this study was inconsistent. In relation to other studies, these results suggest that soils within the same region may not respond uniformly to perennial conversion. These results also suggest that (1) WSG mixtures, compared to WSG monocultures, may not improve near-term soil C and N conditions, and (2) no-till continuous corn and perennial WSGs may have similar near-term effects on SOC and TN, highlighting the importance of requiring a longer time frame and deeper soil samples to assess SOC accrual under WSGs and when comparing WSGs to corn. Research conducted at the field scale provides important information on sustainability indicators that is more relevant than that from smaller plot-scale studies. Further investigation is required, beyond the near-term effects (5-year), to adequately quantify production, economics, SOC change, and other ecosystem services to fully quantify the potential benefits of incorporating perennial feedstocks into current crop production systems.
Author Contributions
Conceptualization, M.R.S., V.L.J. and R.B.M.; methodology, M.R.S., V.L.J. and R.B.M.; formal analysis, S.R.II, K.M.E. and M.R.S.; resources, M.R.S., V.L.J. and R.B.M.; data curation, M.R.S., V.L.J. and R.B.M.; writing—original draft preparation, S.R.II and M.R.S.; writing—review and editing, S.R.II, M.R.S., V.L.J. and R.B.M.; visualization, S.R.II; supervision, M.R.S., V.L.J. and R.B.M.; project administration, R.B.M.; funding acquisition, R.B.M. All authors have read and agreed to the published version of the manuscript.
Funding
This research was funded by the EXCHANGE project, the U.S. Department of Energy, Energy Efficiency and Renewable Energy (EERE), the Bioenergy Technologies Office (BETO), Grant number DE-EE0009279, the CENUSA project, the Agriculture and Food Research Initiative Competitive, Grant No. 2011-68005-30411 from the USDA National Institute of Food and Agriculture, and the ASEC project, the U.S. Department of Energy, Energy Efficiency and Renewable Energy (EERE), the Bioenergy Technologies Office (BETO), Grant number DE-EE0008521.
Data Availability Statement
The data that support the findings of this study are available upon request from the corresponding author.
Acknowledgments
We thank S. Swanson, B. Fann, P. Koerner, D. Walla, R. Harrison, S. Wagner, S. Siragusa-Ortman, and the many students who helped collect, analyze, and manage this experimental study.
Conflicts of Interest
The authors declare no conflict of interest.
References
- Gelfand, I.; Sahajpal, R.; Zhang, X.; Izaurralde, R.C.; Gross, K.L.; Robertson, G.P. Sustainable Bioenergy Production from Marginal Lands in the Us Midwest. Nature 2013, 493, 514–517. [Google Scholar] [CrossRef]
- Lark, T.J.; Salmon, J.M.; Gibbs, H.K. Cropland Expansion Outpaces Agricultural and Biofuel Policies in the United States. Environ. Res. Lett. 2015, 10, 044003. [Google Scholar] [CrossRef]
- Spawn, S.A.; Lark, T.J.; Gibbs, H.K. Carbon Emissions from Cropland Expansion in the United States. Environ. Res. Lett. 2019, 14, 045009. [Google Scholar] [CrossRef]
- Yu, Z.; Lu, C.; Tian, H.; Canadell, J.G. Largely Underestimated Carbon Emission from Land Use and Land Cover Change in the Conterminous United States. Glob. Chang. Biol. 2019, 25, 3741–3752. [Google Scholar] [CrossRef]
- Werling, B.P.; Dickson, T.L.; Isaacs, R.; Gaines, H.; Gratton, C.; Gross, K.L.; Liere, H.; Malmstrom, C.M.; Meehan, T.D.; Ruan, L.; et al. Perennial Grasslands Enhance Biodiversity and Multiple Ecosystem Services in Bioenergy Landscapes. Proc. Natl. Acad. Sci. USA 2014, 111, 1652–1657. [Google Scholar] [CrossRef]
- Lark, T.J.; Seth, A.S.; Bougie, M.; Gibbs, H.K. Cropland Expansion in the United States Produces Marginal Yields at High Costs to Wildlife. Nat. Commun. 2020, 11, 4295. [Google Scholar] [CrossRef]
- Varvel, G.; Vogel, K.; Mitchell, R.; Follett, R.; Kimble, J. Comparison of Corn and Switchgrass on Marginal Soils for Bioenergy. Biomass Bioenergy 2008, 32, 18–21. [Google Scholar] [CrossRef]
- Follett, R.F.; Vogel, K.P.; Varvel, G.E.; Mitchell, R.B.; Kimble, J. Soil Carbon Sequestration by Switchgrass and No-Till Maize Grown for Bioenergy. BioEnergy Res. 2012, 5, 866–875. [Google Scholar] [CrossRef]
- Jin, V.L.; Schmer, M.R.; Stewart, C.E.; Mitchell, R.B.; Williams, C.O.; Wienhold, B.J.; Varvel, G.E.; Follett, R.F.; Kimble, J.; Vogel, K.P. Management Controls the Net Greenhouse Gas Outcomes of Growing Bioenergy Feedstocks on Marginally Productive Croplands. Sci. Adv. 2019, 5, eaav9318. [Google Scholar] [CrossRef]
- Anderson-Teixeira, K.J.; Davis, S.C.; Masters, M.D.; Delucia, E.H. Changes in Soil Organic Carbon under Biofuel Crops. GCB Bioenergy 2009, 1, 75–96. [Google Scholar] [CrossRef]
- Bonifas, K.D.; Walters, D.T.; Cassman, K.G.; Lindquist, J.L. Nitrogen Supply Affects Root:Shoot Ratio in Corn and Velvetleaf (Abutilon Theophrasti). Weed Sci. 2005, 53, 670–675. [Google Scholar] [CrossRef]
- Johnson, J.M.F.; Allmaras, R.R.; Reicosky, D.C. Estimating Source Carbon from Crop Residues, Roots and Rhizodeposits Using the National Grain-Yield Database. Agron. J. 2006, 98, 622–636. [Google Scholar] [CrossRef]
- Ma, Z.; Wood, C.; Bransby, D. Impact of Row Spacing, Nitrogen Rate, and Time on Carbon Partitioning of Switchgrass. Biomass Bioenergy 2001, 20, 413–419. [Google Scholar] [CrossRef]
- Wilhelm, W.W.; Johnson, J.M.F.; Hatfield, J.L.; Voorhees, W.B.; Linden, D.R. Crop and Soil Productivity Response to Corn Residue Removal. Agron. J. 2004, 96, 1–17. [Google Scholar]
- Lemus, R.; Lal, R. Bioenergy Crops and Carbon Sequestration. Crit. Rev. Plant Sci. 2005, 24, 1–21. [Google Scholar] [CrossRef]
- de Kroon, H.; Hendriks, M.; van Ruijven, J.; Ravenek, J.; Padilla, F.M.; Jongejans, E.; Visser, E.J.W.; Mommer, L. Root Responses to Nutrients and Soil Biota: Drivers of Species Coexistence and Ecosystem Productivity. J. Ecol. 2012, 100, 6–15. [Google Scholar] [CrossRef]
- Mommer, L.; Van Ruijven, J.; De Caluwe, H.; Smit-Tiekstra, A.E.; Wagemaker, C.A.; Ouborg, N.J.; Bögemann, G.M.; Van Der Weerden, G.M.; Berendse, F.; De Kroon, H. Unveiling Below-Ground Species Abundance in a Biodiversity Experiment: A Test of Vertical Niche Differentiation among Grassland Species. J. Ecol. 2010, 98, 1117–1127. [Google Scholar] [CrossRef]
- Von Felten, S.; Schmid, B. Complementarity among Species in Horizontal Versus Vertical Rooting Space. J. Plant Ecol. 2008, 1, 33–41. [Google Scholar] [CrossRef]
- Basso, B.; Ritche, J.T. Simulating Crop Growth and Biogeochemical Fluxes in Response to Land Management Using the Salus Model. In The Ecology of Agricultural Landscapes: Long-Term Research on the Path to Sustainability; Hamilton, S.K., Doll, J.E., Robertson, G.P., Eds.; Oxford University Press: New York, NY, USA, 2015; pp. 252–274. [Google Scholar]
- Martinez-Feria, R.; Basso, B. Predicting Soil Carbon Changes in Switchgrass Grown on Marginal Lands under Climate Change and Adaptation Strategies. GCB Bioenergy 2020, 12, 742–755. [Google Scholar] [CrossRef]
- Liebig, M.A.; Schmer, M.R.; Vogel, K.P.; Mitchell, R.B. Soil Carbon Storage by Switchgrass Grown for Bioenergy. BioEnergy Res. 2008, 1, 215–222. [Google Scholar] [CrossRef]
- Blanco-Canqui, H.; Mitchell, R.B.; Jin, V.L.; Schmer, M.R.; Eskridge, K.M. Perennial Warm-Season Grasses for Producing Biofuel and Enhancing Soil Properties: An Alternative to Corn Residue Removal. GCB Bioenergy 2017, 9, 1510–1521. [Google Scholar] [CrossRef]
- Sherrod, L.A.; Dunn, G.; Peterson, G.A.; Kolberg, R.L. Inorganic Carbon Analysis by Modified Pressure-Calcimeter Method. Soil Sci. Soc. Am. J. 2002, 66, 299–305. [Google Scholar] [CrossRef]
- Ellert, B.H.; Bettany, J.R. Calculation of Organic Matter and Nutrients Stored in Soils under Contrasting Management Regimes. Can. J. Soil Sci. 1995, 75, 529–538. [Google Scholar] [CrossRef]
- Lee, M.-S.; Mitchell, R.; Heaton, E.; Zumpf, C.; Lee, D.K. Warm-Season Grass Monocultures and Mixtures for Sustainable Bioenergy Feedstock Production in the Midwest, USA. BioEnergy Res. 2019, 12, 43–54. [Google Scholar] [CrossRef]
- Wang, D.; Lebauer, D.S.; Dietze, M.C. A Quantitative Review Comparing the Yield of Switchgrass in Monocultures and Mixtures in Relation to Climate and Management Factors. GCB Bioenergy 2010, 2, 16–25. [Google Scholar] [CrossRef]
- Ricketts, T.H.; Watson, K.B.; Koh, I.; Ellis, A.M.; Nicholson, C.C.; Posner, S.; Richardson, L.L.; Sonter, L.J. Disaggregating the Evidence Linking Biodiversity and Ecosystem Services. Nat. Commun. 2016, 7, 13106. [Google Scholar] [CrossRef]
- Isbell, F.; Adler, P.R.; Eisenhauer, N.; Fornara, D.; Kimmel, K.; Kremen, C.; Letourneau, D.K.; Liebman, M.; Polley, H.W.; Quijas, S.; et al. Benefits of Increasing Plant Diversity in Sustainable Agroecosystems. J. Ecol. 2017, 105, 871–879. [Google Scholar] [CrossRef]
- Bowles, T.M.; Mooshammer, M.; Socolar, Y.; Calderón, F.; Cavigelli, M.A.; Culman, S.W.; Deen, W.; Drury, C.F.; Garcia, A.G.Y.; Gaudin, A.C.M.; et al. Long-Term Evidence Shows That Crop-Rotation Diversification Increases Agricultural Resilience to Adverse Growing Conditions in North America. One Earth 2020, 2, 284–293. [Google Scholar] [CrossRef]
- Hong, C.O.; Owens, V.N.; Bransby, D.; Farris, R.; Fike, J.; Heaton, E.; Kim, S.; Mayton, H.; Mitchell, R.; Viands, D. Switchgrass Response to Nitrogen Fertilizer across Diverse Environments in the USA: A Regional Feedstock Partnership Report. BioEnergy Res. 2014, 7, 777–788. [Google Scholar] [CrossRef]
- Bonin, C.L.; Lal, R.; Tracy, B.F. Evaluation of Perennial Warm-Season Grass Mixtures Managed for Grazing or Biomass Production. Crop Sci. 2014, 54, 2373–2385. [Google Scholar] [CrossRef]
- Kibet, L.C.; Blanco-Canqui, H.; Mitchell, R.B.; Schacht, W.H. Root Biomass and Soil Carbon Response to Growing Perennial Grasses for Bioenergy. Energy Sustain. Soc. 2016, 6, 1. [Google Scholar] [CrossRef]
- Stewart, C.E.; Follett, R.F.; Pruessner, E.G.; Varvel, G.E.; Vogel, K.P.; Mitchell, R.B. Nitrogen and Harvest Effects on Soil Properties under Rainfed Switchgrass and No-Till Corn over 9 years: Implications for Soil Quality. GCB Bioenergy 2015, 7, 288–301. [Google Scholar] [CrossRef]
- Bonin, C.L.; Lal, R. Aboveground Productivity and Soil Carbon Storage of Biofuel Crops in Ohio. GCB Bioenergy 2014, 6, 67–75. [Google Scholar] [CrossRef]
- Agostini, F.; Gregory, A.S.; Richter, G.M. Carbon Sequestration by Perennial Energy Crops: Is the Jury Still Out? BioEnergy Res. 2015, 8, 1057–1080. [Google Scholar] [CrossRef]
- Robertson, G.P.; Hamilton, S.K.; Del Grosso, S.J.; Parton, W.J. The Biogeochemistry of Bioenergy Landscapes: Carbon, Nitrogen, and Water Considerations. Ecol. Appl. 2011, 21, 1055–1067. [Google Scholar] [CrossRef]
- Robertson, G.P.; Hamilton, S.K.; Barham, B.L.; Dale, B.E.; Izaurralde, R.C.; Jackson, R.D.; Landis, D.A.; Swinton, S.M.; Thelen, K.D.; Tiedje, J.M. Cellulosic Biofuel Contributions to a Sustainable Energy Future: Choices and Outcomes. Science 2017, 356, eaal2324. [Google Scholar] [CrossRef]
- Ruan, L.; Bhardwaj, A.K.; Hamilton, S.K.; Robertson, G.P. Nitrogen Fertilization Challenges the Climate Benefit of Cellulosic Biofuels. Environ. Res. Lett. 2016, 11, 064007. [Google Scholar] [CrossRef]
- Stewart, C.E.; Paustian, K.; Conant, R.; Plante, A.; Six, J. Soil Carbon Saturation: Concept, Evidence and Evaluation. Biogeochemistry 2007, 86, 19–31. [Google Scholar] [CrossRef]
- Bouwman, A.F.; Boumans, L.J.M.; Batjes, N.H. Emissions of N2o and No from Fertilized Fields: Summary of Available Measurement Data. Glob. Biogeochem. Cycles 2002, 16, 6-1–6-13. [Google Scholar] [CrossRef]
- Field, J.L.; Evans, S.G.; Marx, E.; Easter, M.; Adler, P.R.; Dinh, T.; Willson, B.; Paustian, K. High-Resolution Techno–Ecological Modelling of a Bioenergy Landscape to Identify Climate Mitigation Opportunities in Cellulosic Ethanol Production. Nat. Energy 2018, 3, 211–219. [Google Scholar] [CrossRef]
- Qin, Z.; Dunn, J.B.; Kwon, H.; Mueller, S.; Wander, M.M. Soil Carbon Sequestration and Land Use Change Associated with Biofuel Production: Empirical Evidence. GCB Bioenergy 2016, 8, 66–80. [Google Scholar] [CrossRef]
- Minasny, B.; Malone, B.P.; McBratney, A.B.; Angers, D.A.; Arrouays, D.; Chambers, A.; Chaplot, V.; Chen, Z.-S.; Cheng, K.; Das, B.S.; et al. Soil Carbon 4 Per Mille. Geoderma 2017, 292, 59–86. [Google Scholar] [CrossRef]
- Slessarev, E.W.; Mayer, A.; Kelly, C.; Georgiou, K.; Pett-Ridge, J.; Nuccio, E.E. Initial Soil Organic Carbon Stocks Govern Changes in Soil Carbon: Reality or Artifact? Glob. Chang. Biol. 2023, 29, 1239–1247. [Google Scholar] [CrossRef] [PubMed]
- Lessmann, M.; Ros, G.H.; Young, M.D.; de Vries, W. Global Variation in Soil Carbon Sequestration Potential through Improved Cropland Management. Glob. Chang. Biol. 2022, 28, 1162–1177. [Google Scholar] [CrossRef] [PubMed]
- Berhane, M.; Xu, M.; Liang, Z.; Shi, J.; Wei, G.; Tian, X. Effects of Long-Term Straw Return on Soil Organic Carbon Storage and Sequestration Rate in North China Upland Crops: A Meta-Analysis. Glob. Chang. Biol. 2020, 26, 2686–2701. [Google Scholar] [CrossRef]
- Deng, L.; Zhu, G.-Y.; Tang, Z.-S.; Shangguan, Z.-P. Global Patterns of the Effects of Land-Use Changes on Soil Carbon Stocks. Glob. Ecol. Conserv. 2016, 5, 127–138. [Google Scholar] [CrossRef]
- Jung, J.Y.; Lal, R.; Jastrow, J.D.; Tyler, D.D. Nitrogenous Fertilizer Effects on Soil Structural Properties under Switchgrass. Agric. Ecosyst. Environ. 2011, 141, 215–220. [Google Scholar] [CrossRef]
- Entz, M.H.; Baron, V.S.; Carr, P.M.; Meyer, D.W.; Smith, S.R., Jr.; McCaughey, W.P. Potential of Forages to Diversify Cropping Systems in the Northern Great Plains. Agron. J. 2002, 94, 240–250. [Google Scholar] [CrossRef]
- Frank, A.B.; Berdahl, J.D.; Hanson, J.D.; Liebig, M.A.; Johnson, H.A. Biomass and Carbon Partitioning in Switchgrass. Crop Sci. 2004, 44, 1391–1396. [Google Scholar] [CrossRef]
- Liebig, M.; Johnson, H.; Hanson, J.; Frank, A. Soil Carbon under Switchgrass Stands and Cultivated Cropland. Biomass Bioenergy 2005, 28, 347–354. [Google Scholar] [CrossRef]
- Lee, D.K.; Owens, V.N.; Doolittle, J.J. Switchgrass and Soil Carbon Sequestration Response to Ammonium Nitrate, Manure, and Harvest Frequency on Conservation Reserve Program Land. Agron. J. 2007, 99, 462–468. [Google Scholar] [CrossRef]
- Knops, J.M.H.; Bradley, K.L. Soil Carbon and Nitrogen Accumulation and Vertical Distribution across a 74-Year Chronosequence. Soil Sci. Soc. Am. J. 2009, 73, 2096–2104. [Google Scholar] [CrossRef]
- Garten, C.T.; Brice, D.J.; Castro, H.F.; Graham, R.L.; Mayes, M.A.; Phillips, J.R.; Post, W.M.; Schadt, C.W.; Wullschleger, S.D.; Tyler, D.D.; et al. Response of Alamo Switchgrass Tissue Chemistry and Biomass to Nitrogen Fertilization in West Tennessee, USA. Agric. Ecosyst. Environ. 2011, 140, 289–297. [Google Scholar] [CrossRef]
- Heggenstaller, A.H.; Moore, K.J.; Liebman, M.; Anex, R.P. Nitrogen Influences Biomass and Nutrient Partitioning by Perennial, Warm-Season Grasses. Agron. J. 2009, 101, 1363–1371. [Google Scholar] [CrossRef]
- Bai, Y.; Cotrufo, M.F. Grassland Soil Carbon Sequestration: Current Understanding, Challenges, and Solutions. Science 2022, 377, 603–608. [Google Scholar] [CrossRef] [PubMed]
- Prommer, J.; Walker, T.W.N.; Wanek, W.; Braun, J.; Zezula, D.; Hu, Y.; Hofhansl, F.; Richter, A. Increased Microbial Growth, Biomass, and Turnover Drive Soil Organic Carbon Accumulation at Higher Plant Diversity. Glob. Chang. Biol. 2020, 26, 669–681. [Google Scholar] [CrossRef] [PubMed]
- Liang, C.; Schimel, J.P.; Jastrow, J.D. The Importance of Anabolism in Microbial Control over Soil Carbon Storage. Nat. Microbiol. 2017, 2, 17105. [Google Scholar] [CrossRef]
Figure 1.
Warm-season grass total (WSG) aboveground biomass from 2013 to 2016 under two levels of N fertilization (56 and 112 kg ha−1 2013–2015; 28 and 56 kg ha−1 2016) in eastern Nebraska USA. Capital letters denote significant differences due to WSGs within year and N level after Tukey’s adjustment for multiple comparisons at α = 0.05. Lower case letters denote significant difference due to year within WSG and N level after Tukey’s adjustment for multiple comparisons at α = 0.05. Asterisk denotes significant differences due to N level within year and WSG after Tukey’s adjustment for multiple comparisons at α = 0.05.


Table 1.
Monthly mean maximum and minimum air temperatures (T) and monthly cumulative precipitation throughout the corn growing season (May–September) in Eastern Nebraska.
Table 1.
Monthly mean maximum and minimum air temperatures (T) and monthly cumulative precipitation throughout the corn growing season (May–September) in Eastern Nebraska.
| May | June | July | August | September | ||||||
|---|---|---|---|---|---|---|---|---|---|---|
| T-Max | T-Min | T-Max | T-Min | T-Max | T-Min | T-Max | T-Min | T-Max | T-Min | |
| Temperature (°C) | ||||||||||
| 2012 | 26.3 | 11.6 | 29.5 | 15.5 | 35.3 | 19.3 | 31.5 | 14.3 | 27.7 | 8.19 |
| 2013 | 21.5 | 8.9 | 27.0 | 15.0 | 29.9 | 16.4 | 30.1 | 17.0 | 28.1 | 13.4 |
| 2014 | 23.3 | 9.3 | 27.9 | 15.4 | 28.7 | 14.4 | 28.4 | 17.2 | 24.3 | 10.6 |
| 2015 | 21.0 | 9.5 | 27.4 | 15.6 | 29.3 | 17.1 | 27.6 | 15.1 | 27.5 | 14.4 |
| 2016 | 22.0 | 8.9 | 31.2 | 17.1 | 29.5 | 17.9 | 28.5 | 16.6 | 26.6 | 13.2 |
| 6-year avg | 22.8 | 9.6 | 28.6 | 15.7 | 30.5 | 17.0 | 29.2 | 16.0 | 26.8 | 12.0 |
| 30-year avg | 22.8 | 9.8 | 28.4 | 15.5 | 30.4 | 17.6 | 29.4 | 16.3 | 25.8 | 10.9 |
| Precipitation (cm) | ||||||||||
| 2012 | 9.7 | 10.8 | 0.7 | 2.3 | 3.0 | |||||
| 2013 | 16.3 | 11.9 | 1.6 | 4.6 | 9.6 | |||||
| 2014 | 16.5 | 21.2 | 1.4 | 17.7 | 7.9 | |||||
| 2015 | 19.8 | 15.1 | 9.0 | 19.5 | 10.2 | |||||
| 2016 | 18.7 | 10.3 | 9.5 | 14.3 | 7.5 | |||||
| 6-year avg | 16.2 | 13.9 | 4.4 | 11.7 | 7.7 | |||||
| 30-year avg | 11.4 | 12.0 | 8.5 | 7.2 | 4.8 | |||||
Monthly average high and low temperatures (1987–2017) were from weather station Mead, NE, 6S (source: www.climod.unl.edu (accessed on 10 October 2022)).
Table 2.
Year and cropping system main effect on SOC stocks within the soil layer after ESM A correction.
Table 2.
Year and cropping system main effect on SOC stocks within the soil layer after ESM A correction.
| Soil Depth | 0–5 cm | 5–15 cm | 15–30 cm | 30–60 cm | 60–90 cm | |
|---|---|---|---|---|---|---|
| Mg C ha−1 | ||||||
| Year | 2012 | 13.3 | 21.9 | 29.9 | 41.1 | 25.1 |
| 2017 | 13.9 | 21.4 | 29.4 | 41.4 | 24.1 | |
| Crop | Switchgrass | 13.1 | 20.9 AB | 30.3 AB | 40.9 AB | 22.5 AB |
| Big Bluestem | 13.3 | 20.3 B | 25.0 B | 34.0 B | 17.4 B | |
| Low Diversity Mix | 14.3 | 22.1 A | 31.4 A | 46.9 A | 27.0 A | |
| No-Till Corn | 13.7 | 22.2 | 30.1 | 41.9 | 26.9 | |
| Source of Variation | DF | Pr > F | ||||
| Expt | 1 | NS | NS | NS | NS | NS |
| Block | 2 | NS | NS | NS | NS | NS |
| WSGs | 2 | NS | 0.0878 | 0.0162 | 0.0359 | 0.0209 |
| Year | 1 | NS | NS | NS | NS | NS |
| Expt×Year | 1 | NS | NS | NS | NS | NS |
| WSG×Year | 2 | NS | NS | NS | NS | NS |
Uppercase letters denote significant differences due to main effects after Tukey’s adjustment for multiple comparisons at α = 0.05. Italicized p-values are marginally significant (0.05 < p < 0.10); ns = not significant. A ESM—equivalent soil mass corrected based on Ellert and Bettany (1995).
Table 3.
Year and cropping system main effects on TN stocks within the soil layer after ESM A correction.
Table 3.
Year and cropping system main effects on TN stocks within the soil layer after ESM A correction.
| Soil Depth | 0–5 cm | 5–15 cm | 15–30 cm | 30–60 cm | 60–90 cm | |
|---|---|---|---|---|---|---|
| Mg C ha−1 | ||||||
| Year | 2012 | 1.19 | 1.96 | 2.65 | 3.96 | 2.65 |
| 2017 | 1.19 | 1.91 | 2.63 | 3.91 | 2.59 | |
| Crop | Switchgrass | 1.15 | 1.90 AB | 2.69 AB | 3.88 AB | 2.41 AB |
| Big Bluestem | 1.14 | 1.85 B | 2.39 B | 3.31 B | 2.02B | |
| Low Diversity Mix | 1.24 | 2.02 A | 2.79 A | 4.44 A | 2.81 A | |
| No-Till Corn | 1.20 | 1.96 | 2.65 | 3.99 | 2.83 | |
| Source of Variation | DF | Pr > F | ||||
| Expt | 1 | NS | NS | NS | NS | NS |
| Block | 2 | NS | NS | NS | NS | NS |
| WSGs | 2 | NS | 0.0874 | 0.0144 | 0.0190 | 0.0135 |
| Year | 1 | NS | 0.0913 | NS | NS | NS |
| Expt×Year | 1 | NS | NS | NS | NS | NS |
| WSG×Year | 2 | NS | NS | NS | NS | NS |
Uppercase letters denote significant differences due to main effects after Tukey’s adjustment for multiple comparisons at α = 0.05. Italicized p-values are marginally significant (0.05 < p < 0.10); ns = not significant. A ESM—equivalent soil mass corrected based on Ellert and Bettany (1995).
Table 4.
Year and cropping system main effects on cumulative SOC and TN stocks within the soil layer after ESM A correction.
Table 4.
Year and cropping system main effects on cumulative SOC and TN stocks within the soil layer after ESM A correction.
| Soil Depth | 0–15 cm | 0–30 cm | 0–60 cm | 0–90 cm | 0–15 cm | 0–30 cm | 0–60 cm | 0–90 cm | |
|---|---|---|---|---|---|---|---|---|---|
| Soil Organic Carbon, Mg C ha−1 | Total Nitrogen, Mg N ha−1 | ||||||||
| Year | 2012 | 35.2 | 65.1 | 106 | 131 | 3.149 | 5.80 | 9.76 | 12.4 |
| 2017 | 35.3 | 64.8 | 106 | 130 | 3.106 | 5.73 | 9.64 | 12.2 | |
| Crop | Switchgrass | 34.0 | 64.3 AB | 105 AB | 128 AB | 3.05 | 5.74 AB | 9.61 AB | 12.0 AB |
| Big Bluestem | 33.6 | 59.6 B | 93.6 B | 111 B | 2.98 | 5.37 B | 8.68 B | 10.7 B | |
| Low Diversity Mix | 36.4 | 67.8 A | 115 A | 142 A | 3.25 | 6.04 A | 10.5 A | 13.3 A | |
| No-Till Corn | 35.8 | 65.9 | 108 | 135 | 3.16 | 5.82 | 9.81 | 12.6 | |
| Source of Variation | DF | Pr > F | Pr > F | ||||||
| Expt | 1 | NS | NS | NS | NS | NS | NS | NS | NS |
| Block | 2 | NS | NS | NS | NS | NS | NS | NS | NS |
| WSGs | 2 | 0.0989 | 0.0364 | 0.0183 | 0.0150 | 0.0991 | 0.0332 | 0.0078 | 0.0063 |
| Year | 1 | NS | NS | NS | NS | NS | NS | NS | NS |
| Expt×Year | 1 | NS | NS | NS | NS | NS | NS | NS | NS |
| WSG×Year | 2 | NS | NS | NS | NS | NS | NS | NS | NS |
Uppercase letters denote significant differences due to main effects after Tukey’s adjustment for multiple comparisons at α = 0.05. Italicized p-values are marginally significant (0.05 < p < 0.10); ns = not significant. A ESM—equivalent soil mass corrected based on Ellert and Bettany (1995).
Disclaimer/Publisher’s Note: The statements, opinions and data contained in all publications are solely those of the individual author(s) and contributor(s) and not of MDPI and/or the editor(s). MDPI and/or the editor(s) disclaim responsibility for any injury to people or property resulting from any ideas, methods, instructions or products referred to in the content. |
© 2023 by the authors. Licensee MDPI, Basel, Switzerland. This article is an open access article distributed under the terms and conditions of the Creative Commons Attribution (CC BY) license (https://creativecommons.org/licenses/by/4.0/).
Share and Cite
MDPI and ACS Style
Ramirez, S., II; Schmer, M.R.; Jin, V.L.; Mitchell, R.B.; Eskridge, K.M. Near-Term Effects of Perennial Grasses on Soil Carbon and Nitrogen in Eastern Nebraska. Environments 2023, 10, 80. https://doi.org/10.3390/environments10050080
AMA Style
Ramirez S II, Schmer MR, Jin VL, Mitchell RB, Eskridge KM. Near-Term Effects of Perennial Grasses on Soil Carbon and Nitrogen in Eastern Nebraska. Environments. 2023; 10(5):80. https://doi.org/10.3390/environments10050080
Chicago/Turabian StyleRamirez, Salvador, II, Marty R. Schmer, Virginia L. Jin, Robert B. Mitchell, and Kent M. Eskridge. 2023. "Near-Term Effects of Perennial Grasses on Soil Carbon and Nitrogen in Eastern Nebraska" Environments 10, no. 5: 80. https://doi.org/10.3390/environments10050080
Note that from the first issue of 2016, this journal uses article numbers instead of page numbers. See further details here.