Review

A Scientometric Review of Environmental Valuation Research with an Altmetric Pathway for the Future

by
Michael Ayodele Olukolajo
1,*,
Abiodun Kolawole Oyetunji
2,3,4,* and
Chiemela Victor Amaechi
4,5,6,*
1
Department of Estate Management, Federal University of Technology, Akure 340252, Nigeria
2
Department of Estate Management, University of Benin, Benin City 300287, Nigeria
3
Lancaster Environment Centre (LEC), Lancaster University, Lancaster LA1 4YQ, UK
4
Department of Construction Management, Global Banking School (GBS Manchester Campus), Bath Spa University (Partnership), Devonshire Street North, Manchester M12 6JH, UK
5
School of Engineering, Lancaster University, Bailrigg, Lancaster LA1 4YR, UK
6
Institute of Sustainable Energy, Universiti Tenaga Nasional (The National Energy University), Jalan IKRAM-UNITEN, Kajang 43000, Selangor, Malaysia
*
Authors to whom correspondence should be addressed.
Environments 2023, 10(4), 58; https://doi.org/10.3390/environments10040058
Submission received: 23 January 2023 / Revised: 8 March 2023 / Accepted: 15 March 2023 / Published: 27 March 2023
(This article belongs to the Special Issue Environmental Impact Assessment II)

Abstract

:
Environmental valuation (EV) research has advanced significantly as a method of assigning value to environmental goods, many of which lack readily discernible market values. The term “environmental valuation” describes a number of methods for putting monetary values on environmental effects, particularly non-market effects. Over the years, there has been a continuous increase in the number of publications on the topic. According to searches via the Scopus and Web of Science (WoS) databases, the phrase “environmental valuation” first occurred in 1987. The current research examines patterns in publishing rates over the previous three decades to analyse environmental valuation activity. To identify the future pathway, a research pattern was identified using Scopus, WoS, and the Altmetric Explorer. The data were postprocessed using VOSviewer to identify the mapping networks; then, Voyant Tools were used to explore the keywords. A summary of the demand for environmental valuation is also provided based on the literature review. However, the findings of this historical analysis indicate that despite the academic efforts on this subject, environmental valuation is not used in research as much as one may anticipate. In addition, the study gives a general outline of the future directions that environmental valuation research is anticipated to follow in light of the current academic research initiatives as well as academic market and policy market research efforts. The study shows that the United Kingdom (UK) showed the highest publications by location in this field. Additionally, the study shows that the choice experiment approach is preferred over the contingent valuation method, and this work illustrates this preference. It also demonstrates that only a small number of papers have had a significant influence on the researchers in this field.

1. Introduction

Research into environmental valuation (EV) has come a long way as a means of attributing value to benefits and services of non-market environmental goods, whereby many of which have no easily observed market prices [1]. A dimension to the development in the valuation method was brought about by the global consciousness of the natural environment and the need to incorporate sustainability features into valuation practice. Environmental valuation estimates in monetary terms the rather overlooked aspect of ecosystem contributions to human wellbeing and development. As a result of increased demand for sustainable development and improved resources, environmental issues now take greater prominence in decision-making. Economists have developed an array of techniques and methods for providing economic values in the environment [2]. The awareness of these techniques has revolutionised the practice of valuation. Some of the literature around environmental valuation also discusses aspects of economic valuation. One of the key areas that can be considered in environmental valuation is the market impact, financial considerations and the willingness to pay [3,4,5,6,7].
Another aspect of evaluation has been used in sustainability studies through scientometric analysis of green infrastructure [8]. In the mining, oil and gas industries, environmental valuation has also found great use in project appraisals [9]. In principle, environmental economics and the valuation of natural resources, as analytical tools, facilitate environmental accounting by which the adverse effects of environmental impacts can be tracked in real terms [10]. Environmental valuation studies have been investigated as far back as by various researchers in the late 80s and early 90s, such as Climis A. Davos [11,12]. Their studies investigated air quality as a key consideration in spatial designs. Although environmental valuation techniques have been in the academic discourse over three decades, their relevance and application are not without criticism [13]. Consequently, the process of applying valuation methods has gone through refinement, making it acceptable among many. One area of environmental valuation is environmental assessments, and the metrics for green technologies, innovative technologies and green knowledge management have been presented by some authors [14,15,16,17]. However, there are some gaps in environmental valuation in relation to sustainability, decisions made, innovative knowledge in this field and validation, which should be considered. Some reflection on the use of technology in environmental valuation has improved over the years, which implies that the data trend for the future will be influenced by some key determinants. A revision of the journey so far is therefore germane to the strategic future of environmental valuation research. Liu et al. [18] conducted a scientometric investigation of the environmental impact of cover crops to understand the research trends, while Wang et al. [19] conducted a systematic literature review of the water shed ecosystem based on economic value. Related scientometric work on this subject includes the recent study by Guijarro and Tsinaslanidis [20] whereby the study was limited in scope as the literature search was based on articles retrieved from the Web of Science database only. On the other hand, an earlier scientometric study by Adamowicz [21] considered the use of environmental valuation in policy analysis in academic publications; however, as this was almost two decades ago, and covered publications up to 2004, there is a need for more recent studies.
The current study made use of data retrieved from the Scopus, Web of Science (WoS) and Altmetric Explorer databases to understand the research trend on environmental valuation. This study also presents a novelty in the altmetrics (i.e., alternative metrics) approach applied in this investigation to understand the future research pathway. The data were postprocessed using VOSviewer to identify the mapping networks; then, Voyant tools were used to explore the keywords. The sections of this scientometric review are structured as follows: Section 1 introduces the subject, while Section 2 presents a brief literature review on environmental valuation. Section 3 presents the research method and the data analysis. Section 4 presents the results and discussion, while Section 5 presents the concluding remarks.

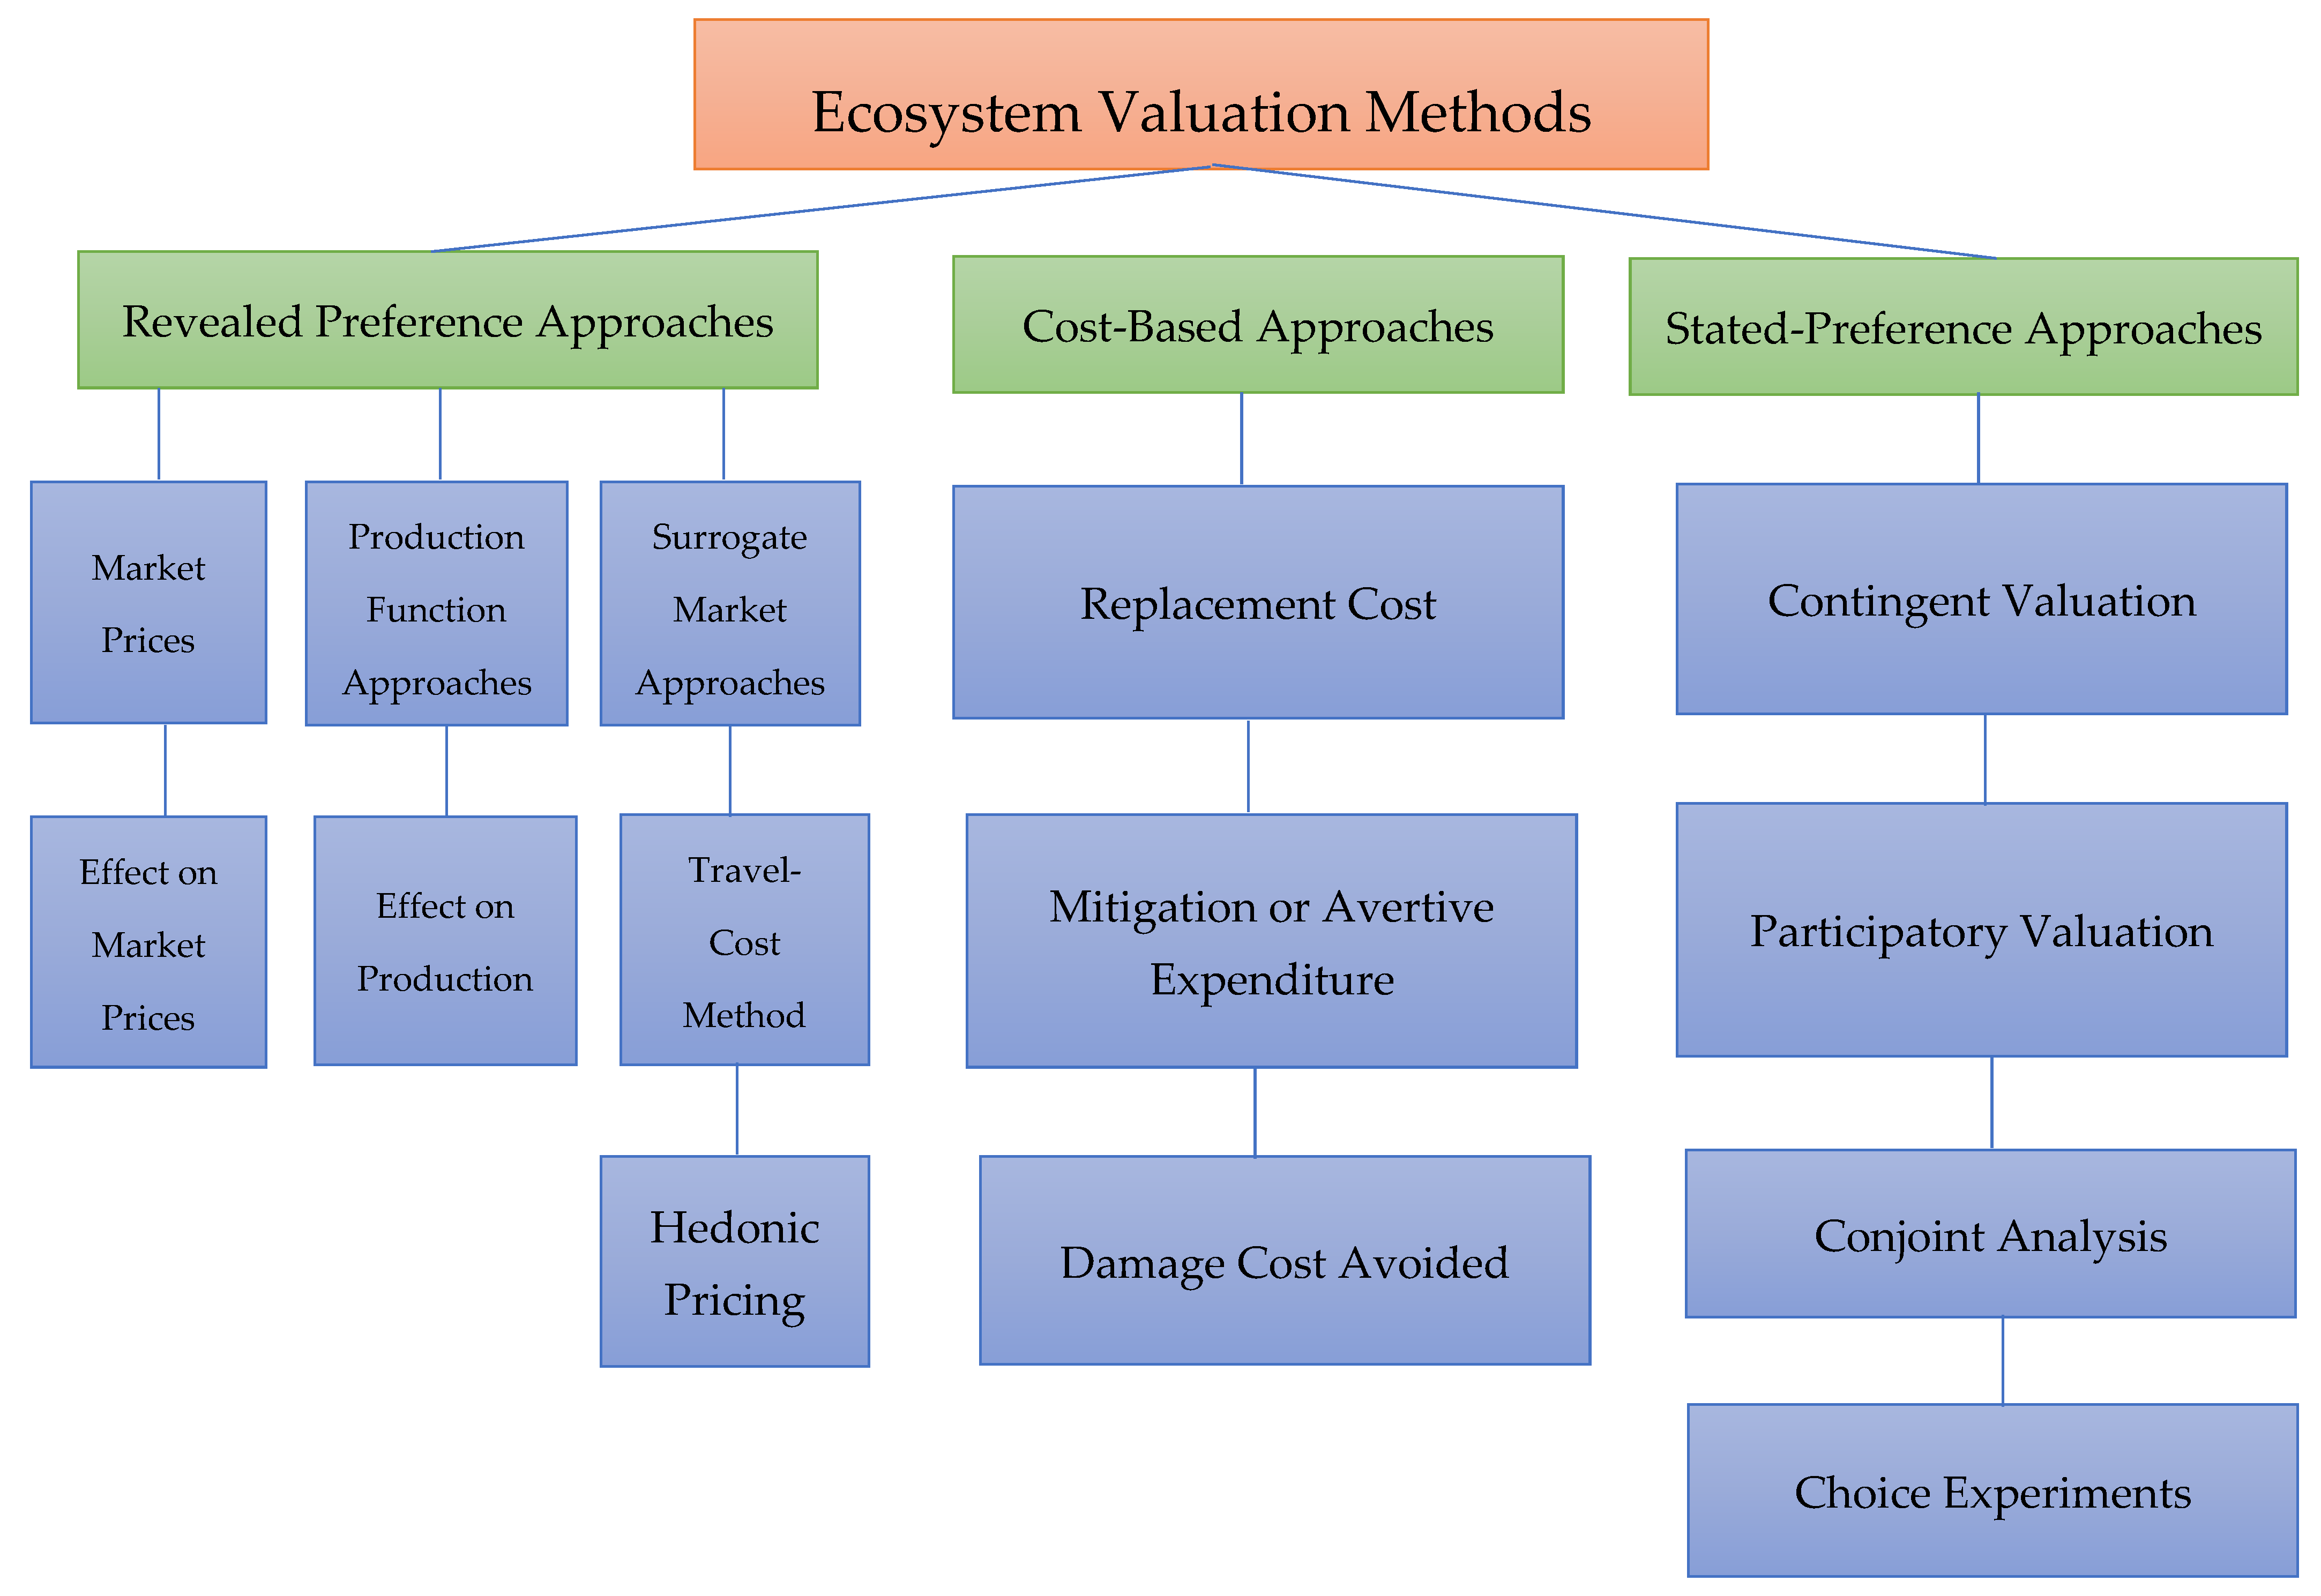
2. Brief Literature Review

In this present study, it is pertinent to conduct a brief literature review on environmental valuation. In this light, this review starts by introducing the concepts related to ecosystem services and environmental valuation, as provided by earlier works. Firstly, Pearce and Turner [22] investigated ecosystem services by considering the relationship between natural resources and the environment. Kadykalo et al. [23] investigated the support regarding ecosystem services from environmental economists and environmental scientists by understanding the research trends. The exploitation of the natural environment for developmental purposes on the basis of anthropocentric usefulness poses an ever-growing threat to conservation [24]. Most of the ecosystem services are not traded on markets and thus do not bear a price tag, making it difficult to make informed choices about their conservation and sustainable use. However, the absence of a price according to the Secretariat of the Convention on Biological Diversity in 2007 [25] does not mean the absence of economic value. Revealing the hidden value of ecosystem services through valuation techniques, in particular regarding non-market valuation, is an important mechanism for integrating biodiversity considerations in economic decision-making. In recent studies, some case studies of environmental valuation were presented, ranging from ecosystems to renewable energy and business cases [26,27,28,29,30].
Environmental valuation processes are born out of the total economic value (TEV) concept. Through TEV, both use and non-use value aspects of the ecosystem’s goods and services are captured [31], being further decomposed into active use and passive use values [32]. TEV seeks to determine the total contribution of ecosystems to the local or national economy and human wellbeing. According to Emerton and Bos [33], there are five most commonly used valuation methods that are applicable when valuing different components of the total economic value of an ecosystem. These are market prices, production function, surrogate market, cost-based and stated preference approaches, as shown in Figure 1.
The revealed preference methods comprise market prices, production function and surrogate market techniques [34]. Direct market prices are used in placing prices on extractable goods from the environment [35]. The production function (PF) technique relates to changes in the output of a marketed good or service and a measurable change in the quality or quantity of ecosystem goods and services by establishing a biophysical or dose–response relationship between ecosystem quality, the provision of particular services and the related production. Surrogate market techniques on the other hand include travel costs and hedonic pricing, and look at the ways in which the value of ecosystem goods and services is reflected indirectly in people’s expenditures, or in the prices of other market goods and services. Another aspect of EV research that has been largely investigated by various researchers is contingent valuation [36,37,38,39]. This is usually the key evaluation that must be conducted with respect to the environment or an ecosystem service.
Cost-based techniques comprise replacement costs, mitigative or aversive expenditures and the damage costs avoided, and look at the market trade-offs or costs avoided of maintaining ecosystems for their goods and services. Cost-based techniques are employed in estimating the probable costs that would have been incurred if a particular natural environmental resource had to be provided through some artificial means. Mungatana [40] identified four common cost-based techniques as being avoided cost, replacement cost, mitigation cost and restoration cost. In addition, stated preference methods measure people’s willingness to pay (WTP) for ecosystem services [41,42]. With stated preference techniques, rather than looking at the way in which people reveal their preferences for ecosystem goods and services through market production and consumption, these techniques ask consumers to state their preference directly. The most well-known technique is contingent valuation, while less commonly used stated preference valuation methods include conjoint analysis and choice experiments.
Research into the valuation of environmental assets applying all facets of developed environmental valuation methods to different case studies have covered aspects of recreational sites ([43]), water resources ([44]), flood protection ([45,46,47]), wetlands ([48,49,50,51]), forest plantations ([52,53,54]), air pollution ([55,56,57]) and COVID-19 ([58,59,60,61]). Another area considered in the investigation of research trends in environmental studies is observed in the outputs from different systematic reviews on areas ranging from environmental impacts ([62]), economic concerns in the environment ([63]), agricultural–ecological compensations ([64]) and ecotoxicological effects ([65]). Aside from these, different measurement tools have been identified by various researchers in EV ([66,67]).

3. Research Method

The study, being interpretative research, employed scientometric revision of the literature. According to Nalimov and Mulchenko ([68]), the authors of the Russian article “Naukometrija” in 1969, scientometrics can be defined as a technique that involves evaluating the impact of research, understanding the citation process and visualising the structure and development of knowledge in a field using a sizable scientific dataset. By analysing huge amounts of bibliometric data, scientometric methodologies allow academics to detect systematic literature-related discoveries by tying together literary themes that might be missed in manual review research. Recently, open access, open science and systematic reviews have also been identified in scientific research, such as one study on the environmental valuation of climate change by the Lancaster Environment Centre (LEC) at the University of Lancaster in the UK and the Institute for the Oceans and Fisheries at the University of British Columbia in Canada, considered this approach of alternative metric [69]. In this research by Tai and Robinson [69], the authors utilised almetrics to understand the research on climate change as an open science tool, by exploring the information from citations, news and twitter through Almetric Explorer. Though many scientific studies exist on economic valuation, climate change studies and other environmental valuations, there are other aspects of scientometric studies that are related to environmental valuation, such as the ecosystem service ([63,70,71]). Scientometrics has also been applied in particular aspects of the ecosystem service to examine the environmental impacts of agricultural produce by considering the knowledge mapping of cover crops [72]. Recently, Okolie and Ogundeji [73] conducted a similar scientometric study on the agricultural sector based on the effect of COVID-19 on food security and production.
The methodology for this investigation was a search using keywords, followed by comparing the sources using different databases. Next, the data were postprocessed, then analysed further and discussed to understand the impact of environmental valuation, thereby identifying its future research pathway. In this research, the term “environmental valuation” was searched for in the preliminary search for the articles that had it in their title, abstract or keywords. The Scopus electronic database’s online literature search engine was first used for the search, followed by the Web of Science (WoS). To understand the mentions of “environmental valuation”, further analysis was conducted using the Altmetric Explorer and postprocessed using VOSviewer.
It is pertinent to state that while VOSviewer was used to identify the mapped networks and visualisations, the Altmetric Explorer was used to identify the different research patterns in publications, such as the almetrics, the citations, the impact of social media platforms and future research trends. In the inclusion criteria, the authors included the Altmetric Explorer in the study to explore the analysis of social media platforms such as Twitter and Facebook, since more academic research involves views, shares, likes and comments from social media platforms. Based on the inclusion criteria, only articles written using the English language were considered in this study. Additionally, only peer-reviewed articles were considered, as the grey literature was excluded.
The current study made use of different databases, although the Scopus database was recorded to have a wider coverage of journals compared to Web of Science [74,75,76,77,78]. Singh et al. [79] expressed that, historically, researchers have relied on either Web of Science (WoS) or Scopus databases for a scientometric review of the literature. Although the WoS and Scopus databases had a wider coverage as explained, the authors decided to adopt the proposition of Falagas [80] by making use of the Scopus database, because Scopus offers about 20% more coverage than Web of Science (WoS). Therefore, due to the robustness and wide coverage of the literature, the Scopus and WoS databases were the main data sources used. However, these two sources did not present the needed information on some key data for future trends; thus, the Altmetric Explorer was accessed based on the literature search on this area. Other stages of this study followed the following process for the selection of subject themes and the document search.

3.1. Selection of Subject Theme and Document Search

Environmental valuation as a subject was searched in the title, abstract and keywords of documents indexed in the Scopus database covering the period up to the 10th day of April 2022 and a total of 718 documents were found. Afterward, excluding the year 2022 from the result, the document search yielded 709 publications. Furthermore, the document type was limited to articles, and the source type was limited to journals; this yielded 550 and 534 documents, respectively. In the search process, the language of publication was limited to English and 497 publication results were obtained. Consequently, the other aspects of the review were based on these 497 research articles. The detailed search code was as follows:
TLE-ABS-KEY (“Environmental Valuation”) AND (EXCLUDE (PUBYEAR < 2022)) AND (LIMIT-TO (DOCTYPE, “ar”)) AND (LIMIT-TO (SRCTYPE, “j”)) AND (LIMIT-TO (LANGUAGE, “English”)).

3.2. Selection of Software for Data Analysis

Scientometric analysis is basically scientific knowledge mapping ([81]) and it deploys bibliometric data, techniques and methods to scientifically map the literature ([82]). Although common software such as VantagePoint, CitNetExplorer, BibExcel, CiteSpace, Gephi and VOSviewer are popular and available for scientific mapping, VOSviewer was adopted in this research because of its inherent quality which is consistent with achieving its objective. VOSviewer is a freely available computer program developed for constructing and viewing bibliometric maps. The functionality of VOSviewer which suits the objective of this study is especially useful for displaying large bibliometric maps in an easy-to-interpret way ([83,84]).

3.3. Selection of Software for Alternative Metrics

The software chosen for the alternative metrics on environmental valuation was the Altmetric Explorer, which also helped us to study the future pathway. Users of this simple-to-use web portal known as the Altmetric Explorer can explore and report on all of the attention data for each piece of scholarly content that Altmetric has detected an interest for [85,86,87,88,89]. Each published research article’s key discussions are gathered by Altmetric. It makes use of Wikipedia, popular news sources, peer-review forums after publication, social media, blogs and policy documents. It also makes use of internet reference managers such as Mendeley and then compiles everything for you in one location (see data in Supplementary Materials section). Each article receives a score that indicates the volume and scope of attention it has attracted. A publication’s attention level and the sources from which mentions have come are both displayed in the score donut visualisation. In this study, the Altmetric Explorer license used was an academic resource license of Lancaster University that can access the full Altmetric database—with attention data for over 19 million research outputs to date—and enables researchers to make comparisons and benchmarks. Various researchers have also validated the Altmetric Explorer in different academic bibliometric studies [90,91,92,93,94,95,96]. Particular findings from Bornmann [97,98,99,100], after conducting an extensive review of a range of studies on altmetrics, found that the use of different elements can be effective in evaluating the suitability of altmetrics in literature survey measurements and research trend analysis.
Holmberg et al. [101] used the Altmetric Explorer for institutions to investigate the altmetric activity of open access publications in subscription-based publications for universities in Finland, and found that it delivered good results. The Altmetric Explorer for institutions is an intuitive platform that enables researchers to monitor the online activity surrounding their academic research [69,102,103]. Altmetrics (which means ‘alternative metrics’) are not intended to replace traditional metrics, such as citation count. Rather, they will complement these and allow for a fuller picture of research impact to be understood. According to Altmetric [104], “the database tracks a range of sources to capture and collate this activity, helping you to monitor and report on the attention surrounding the work you care about. Altmetric works behind the scenes, by collecting and collating all of this disparate information. The data is used to provide a single visually engaging and informative view of the online activity surrounding various scholarly contents”.
The qualitative data which are provided by the Altmetric Explorer are highly valuable. Additionally, the Altmetric Explorer assigns an attention score to scholarly output. This provides an indicator of relative attention, but does not measure the quality of research. The score is weighted, and includes inputs such as policy and patent citations and social media mentions. It is noteworthy to state that there are different areas of utilising the Altmetric Explorer for institutions:
  • Ensuring effective reputation management;
  • Developing publications’ mentions data and score donut visualisations;
  • Tracking influence as it happens;
  • Reporting on outcomes and trends;
  • Supporting your researchers;
  • Informing strategic decision-making;
  • Improving grant application success;
  • Running reports and analysing attention on research that matters to the researcher.

3.4. Research Hypothesis

Considering that this investigation is novel as it uses hybrid methods in the extraction of data and its analysis, it is important to present the research hypothesis governing the investigation. This study on research that focuses on environmental valuation also considered an alternative metric using the Altmetric Explorer. One of the key questions asked by various researchers is how can research output be measured using online attention, Twitter mentions, blog citations and web impact factors, or what other metrics are available in this evolving world [105,106,107,108,109,110]? Some other studies have used altmetrics to investigate the impact of social media on research and have showed that they could be used to predict future trends [69,111,112,113,114]. Thus, there is justification for approaching this problem by using similar metrics in this paper on EV. In this study, the research hypotheses pose unique questions which were also considered in developing the research framework for this investigation. The research hypothesis postulated for this study are that:
  • There is no significant research into environmental valuation research.
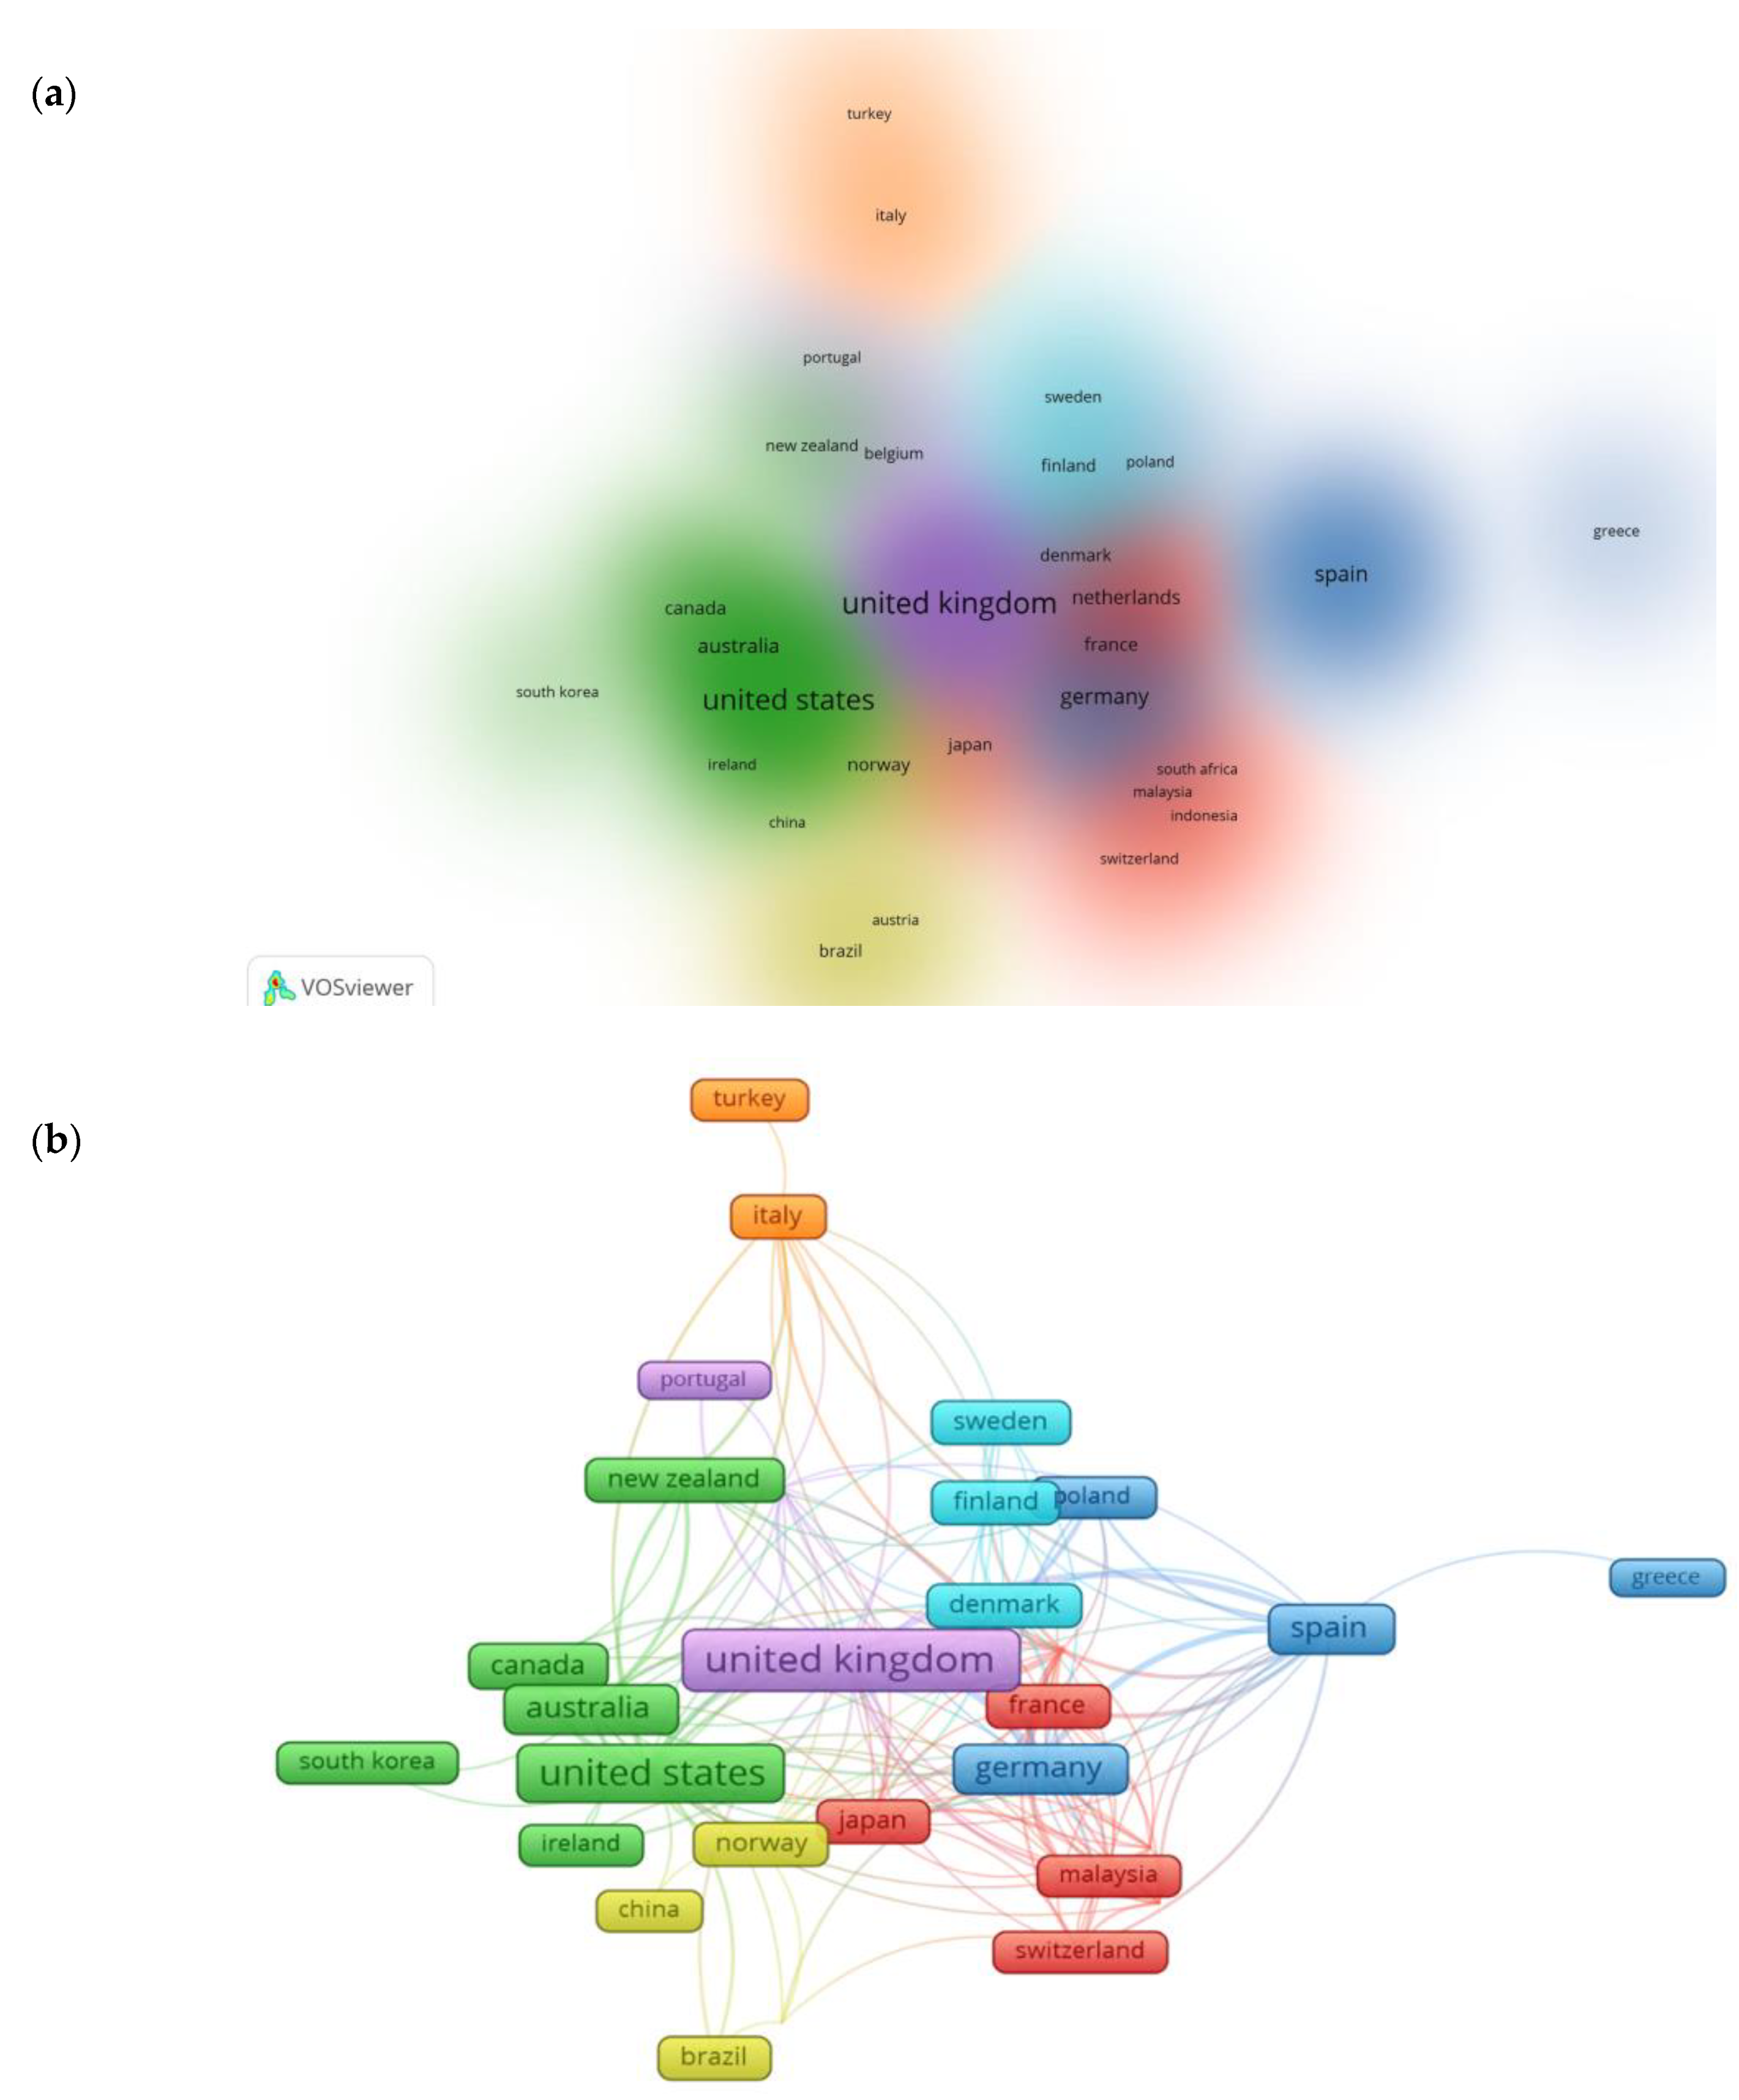
  • There are no significant collaborations on environmental valuation research.
  • There is no significant report on the impact of social media mentions for research into environmental valuation.

4. Results

This section presents the findings and analysis from the scientometric review.

4.1. Trends of Publication on Environmental Valuation Research

Although the search was left to any publications on environmental valuation research work from 1987 to 2021, this resulted in that seen in Figure 2. From the search of the Scopus database, the phrase “environmental valuation” first occurred in 1987. In that year, the earliest journal articles were found to be two in number and published by Davos [115] and Ellis and Fisher [116], both appearing in the same volume of the Journal of Environment. These articles advocate using environmental valuation in hazardous waste as an input for producing marketed goods. There appeared to be no other publication records for the next three years after these publications. At the turn of 1991, two additional publications by Huang and Odum [117] and Winpenny [118] were published. These studies focused on ecology and economy, and the relationship between environmental values and development.
From 1991 onwards, there has been consistency in the spread of knowledge on environmental valuation because there is no particular year without any publication on this subject. However, the years 2000, 2007, 2011 and 2017 appear to be significant in the research output in that there were 25, 19, 24 and 35 publications, respectively. It is noticeable that there is a rise and fall trend in the spread right from 1991 to 2021.

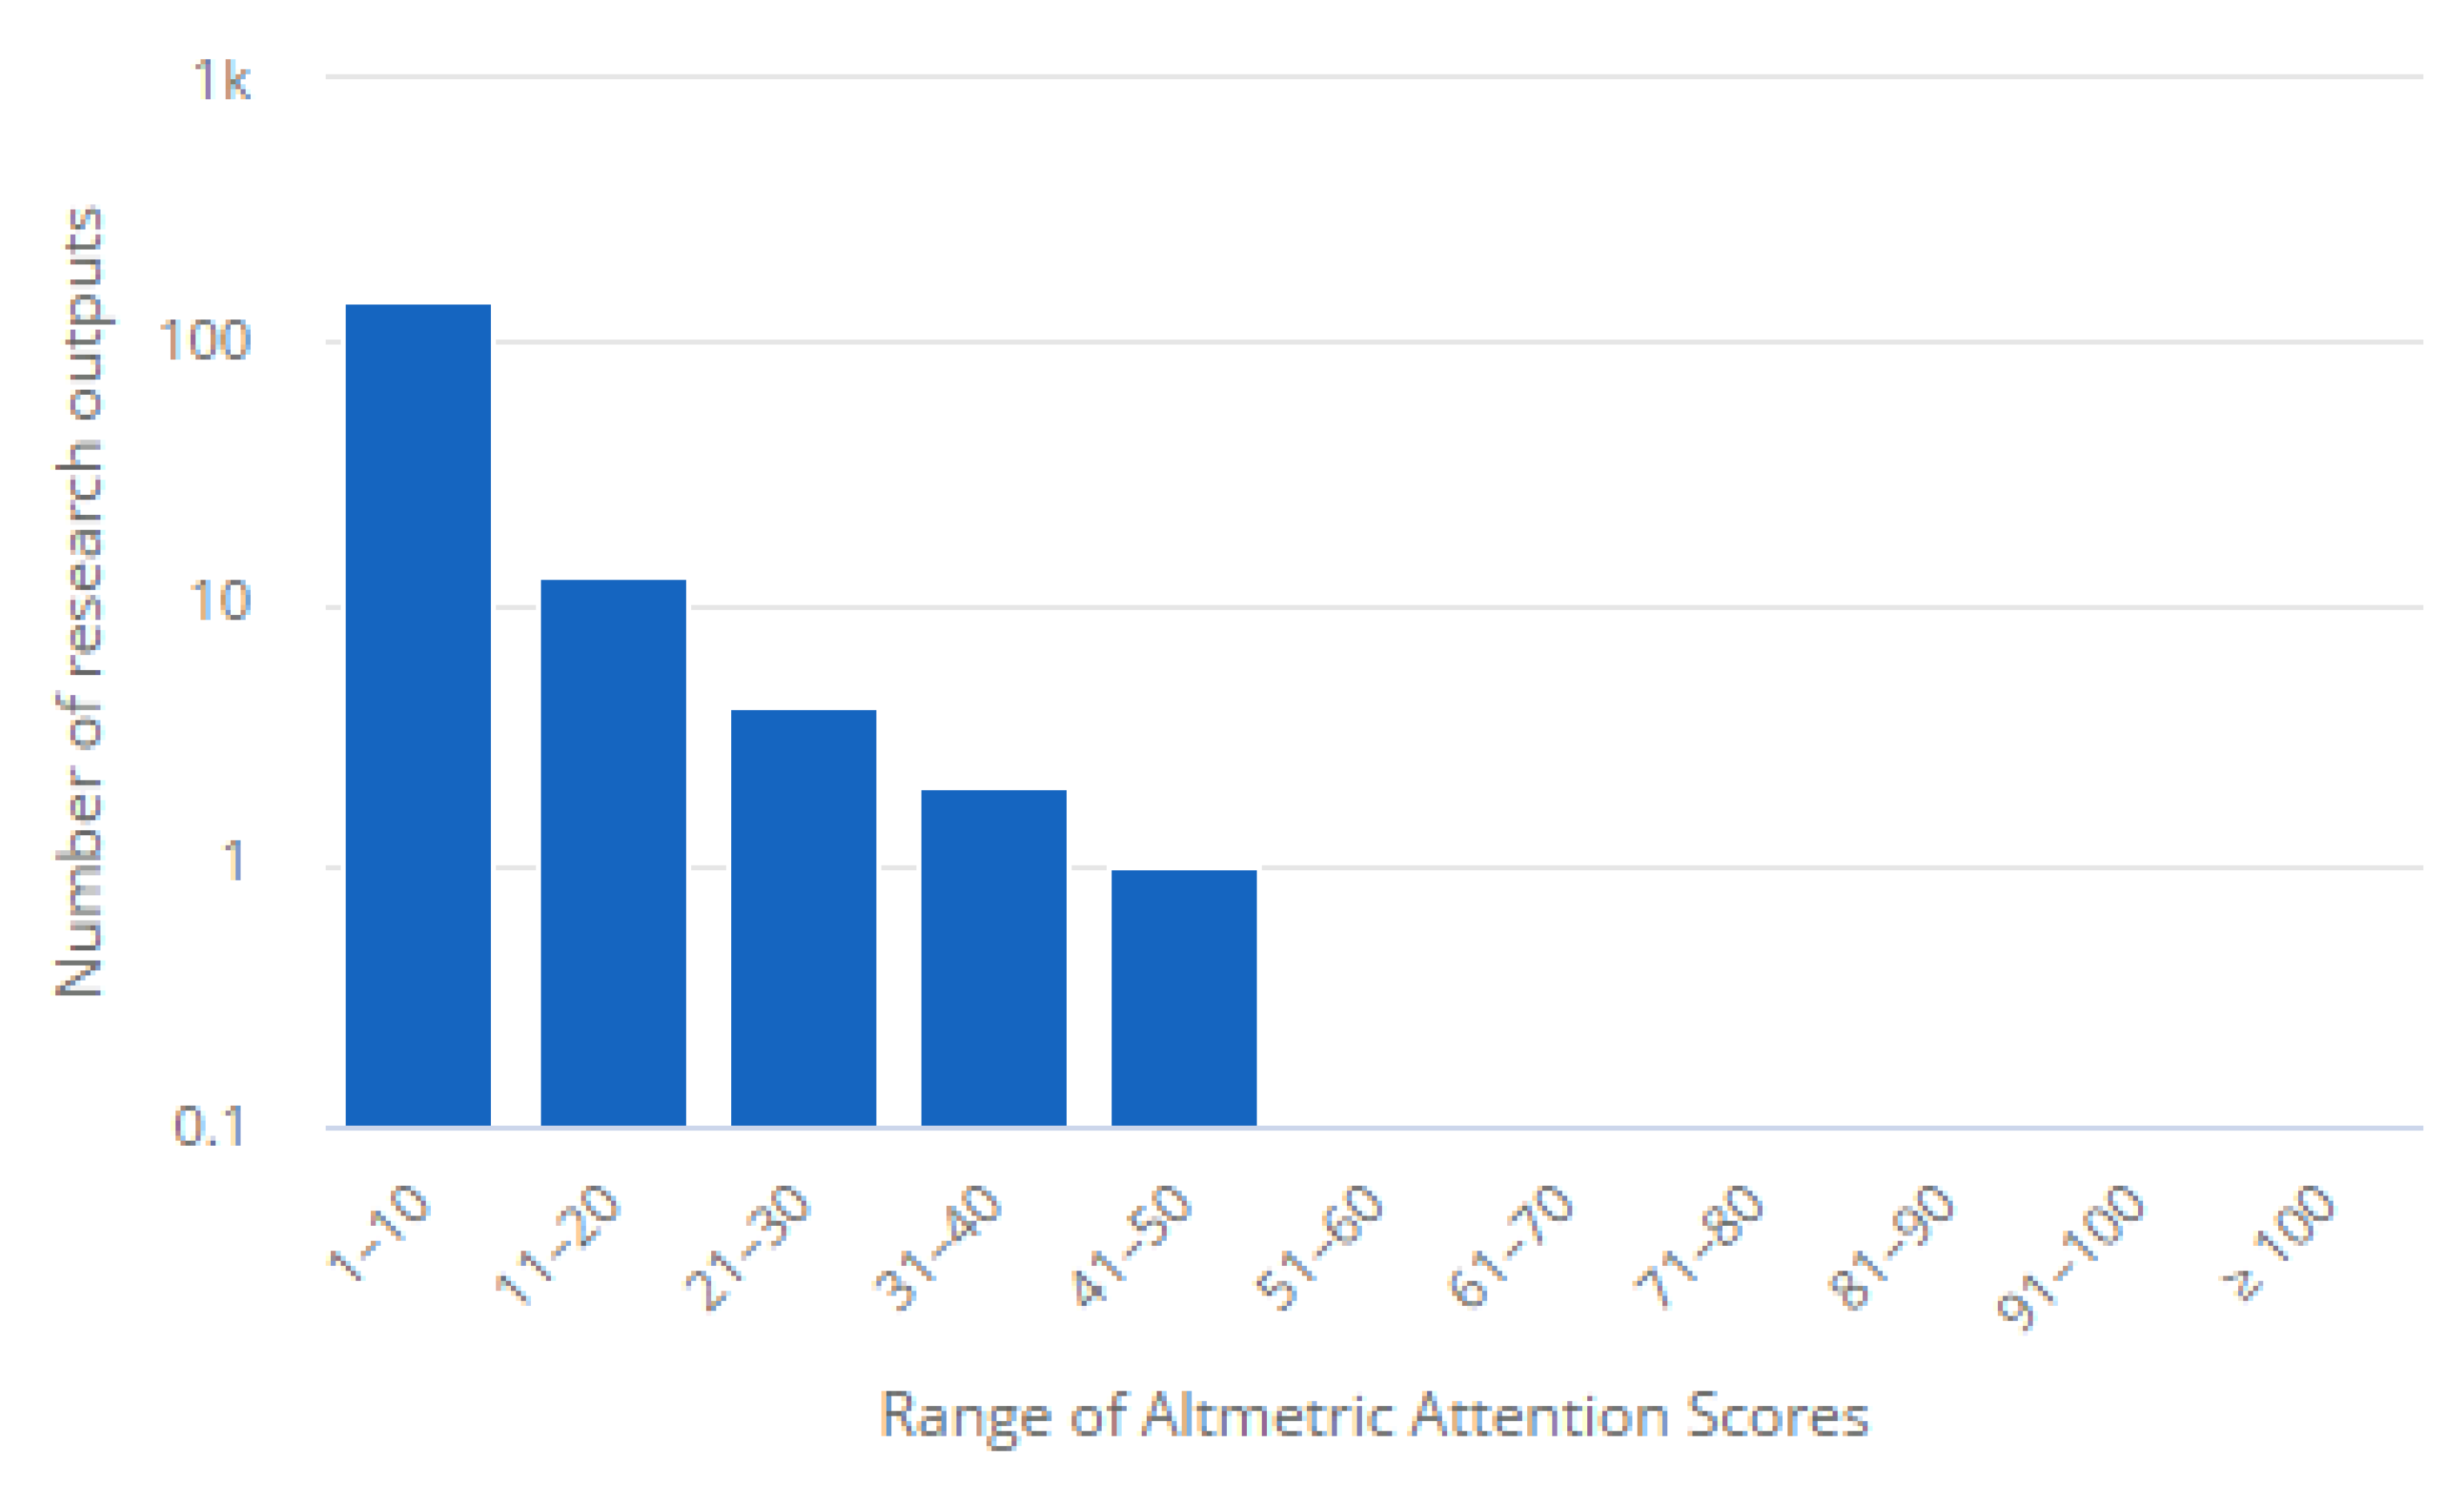
4.2. Distribution in Altmetric Attention Scores

The distribution in the Altmetric attention scores was found using the Altmetric Explorer. This was achieved by exploring data for all of the research outputs from the entire Altmetric database with the title and keywords containing “Environmental Valuation”. The distribution in the altmetric attention scores can be seen in Figure 3. The figure shows the highest number of research outputs with publications of about 110 outputs. The highest bar had one hundred and forty-seven research outputs with an altmetric attention score of 1–10, followed by thirteen research outputs with an altmetric attention score of 11–20, followed by four research outputs with an altmetric attention score of 21–30, followed by two research outputs with an altmetric attention score of 31–40, followed by one research output with an altmetric attention score of 41–50.

4.3. Attention Scores Related to Environmental Valuation

The top mentions from the Altmetric Explorer were analysed using attention scores related to “Environmental Valuation”. The top publication on the attention scores for environmental valuation was by Sawe and Knutson [119] published in NeuroImage, and it had the highest altmetric attention score of 50, being in the top 5% of all research outputs scored (see Figure 4). It has a high attention score compared to outputs of the same age (96th percentile), and a high attention score compared to outputs of the same age according to years of publications and source (97th percentile). Figure 4a shows that the term was mentioned by two news outlets, four blogs and nine tweets. The second highest publication was by Khaw et al. [120], published in PLoS ONE, currently a Q1 journal as found on Scimago. This publication had an altmetric attention score of thirty-two, being in the top 5% of all research outputs scored using altmetrics (see Figure 4b). It also has a high attention score compared to works of the same age (94th percentile), and a high attention score compared to outputs of the same age according to years of publication and source (93rd percentile). As seen in Figure 4b, the term was mentioned by one news outlet, two blogs, two Wikipedia pages and ten tweets. The third highest publication was by Fabre et al. [121], which was published in Science of the Total Environment, also a Q1 journal on Scimago. The publication also had an altmetric attention score of thirty-one, being in the top 5% of all research outputs scored using altmetrics (see Figure 4c). It also has a high attention score compared to outputs of the same age (92nd percentile), and a high attention score compared to outputs of the same age according to years of publication and source (96th percentile). The donut in Figure 4c shows that the term was mentioned by four news outlets and one Facebook page. Petr et al. [122] published the fourth highest publication, published by Springer Publishing. The publication also had an altmetric attention score of thirty, being in the top 5% of all research outputs scored using altmetrics (see Figure 4d). It also has a high attention score compared to outputs of the same age (92nd percentile), and a high attention score compared to outputs of the same age according to years of publication and source (96th percentile). This shows the impact of the attention score for understanding the research trend and impact of publications in this field.

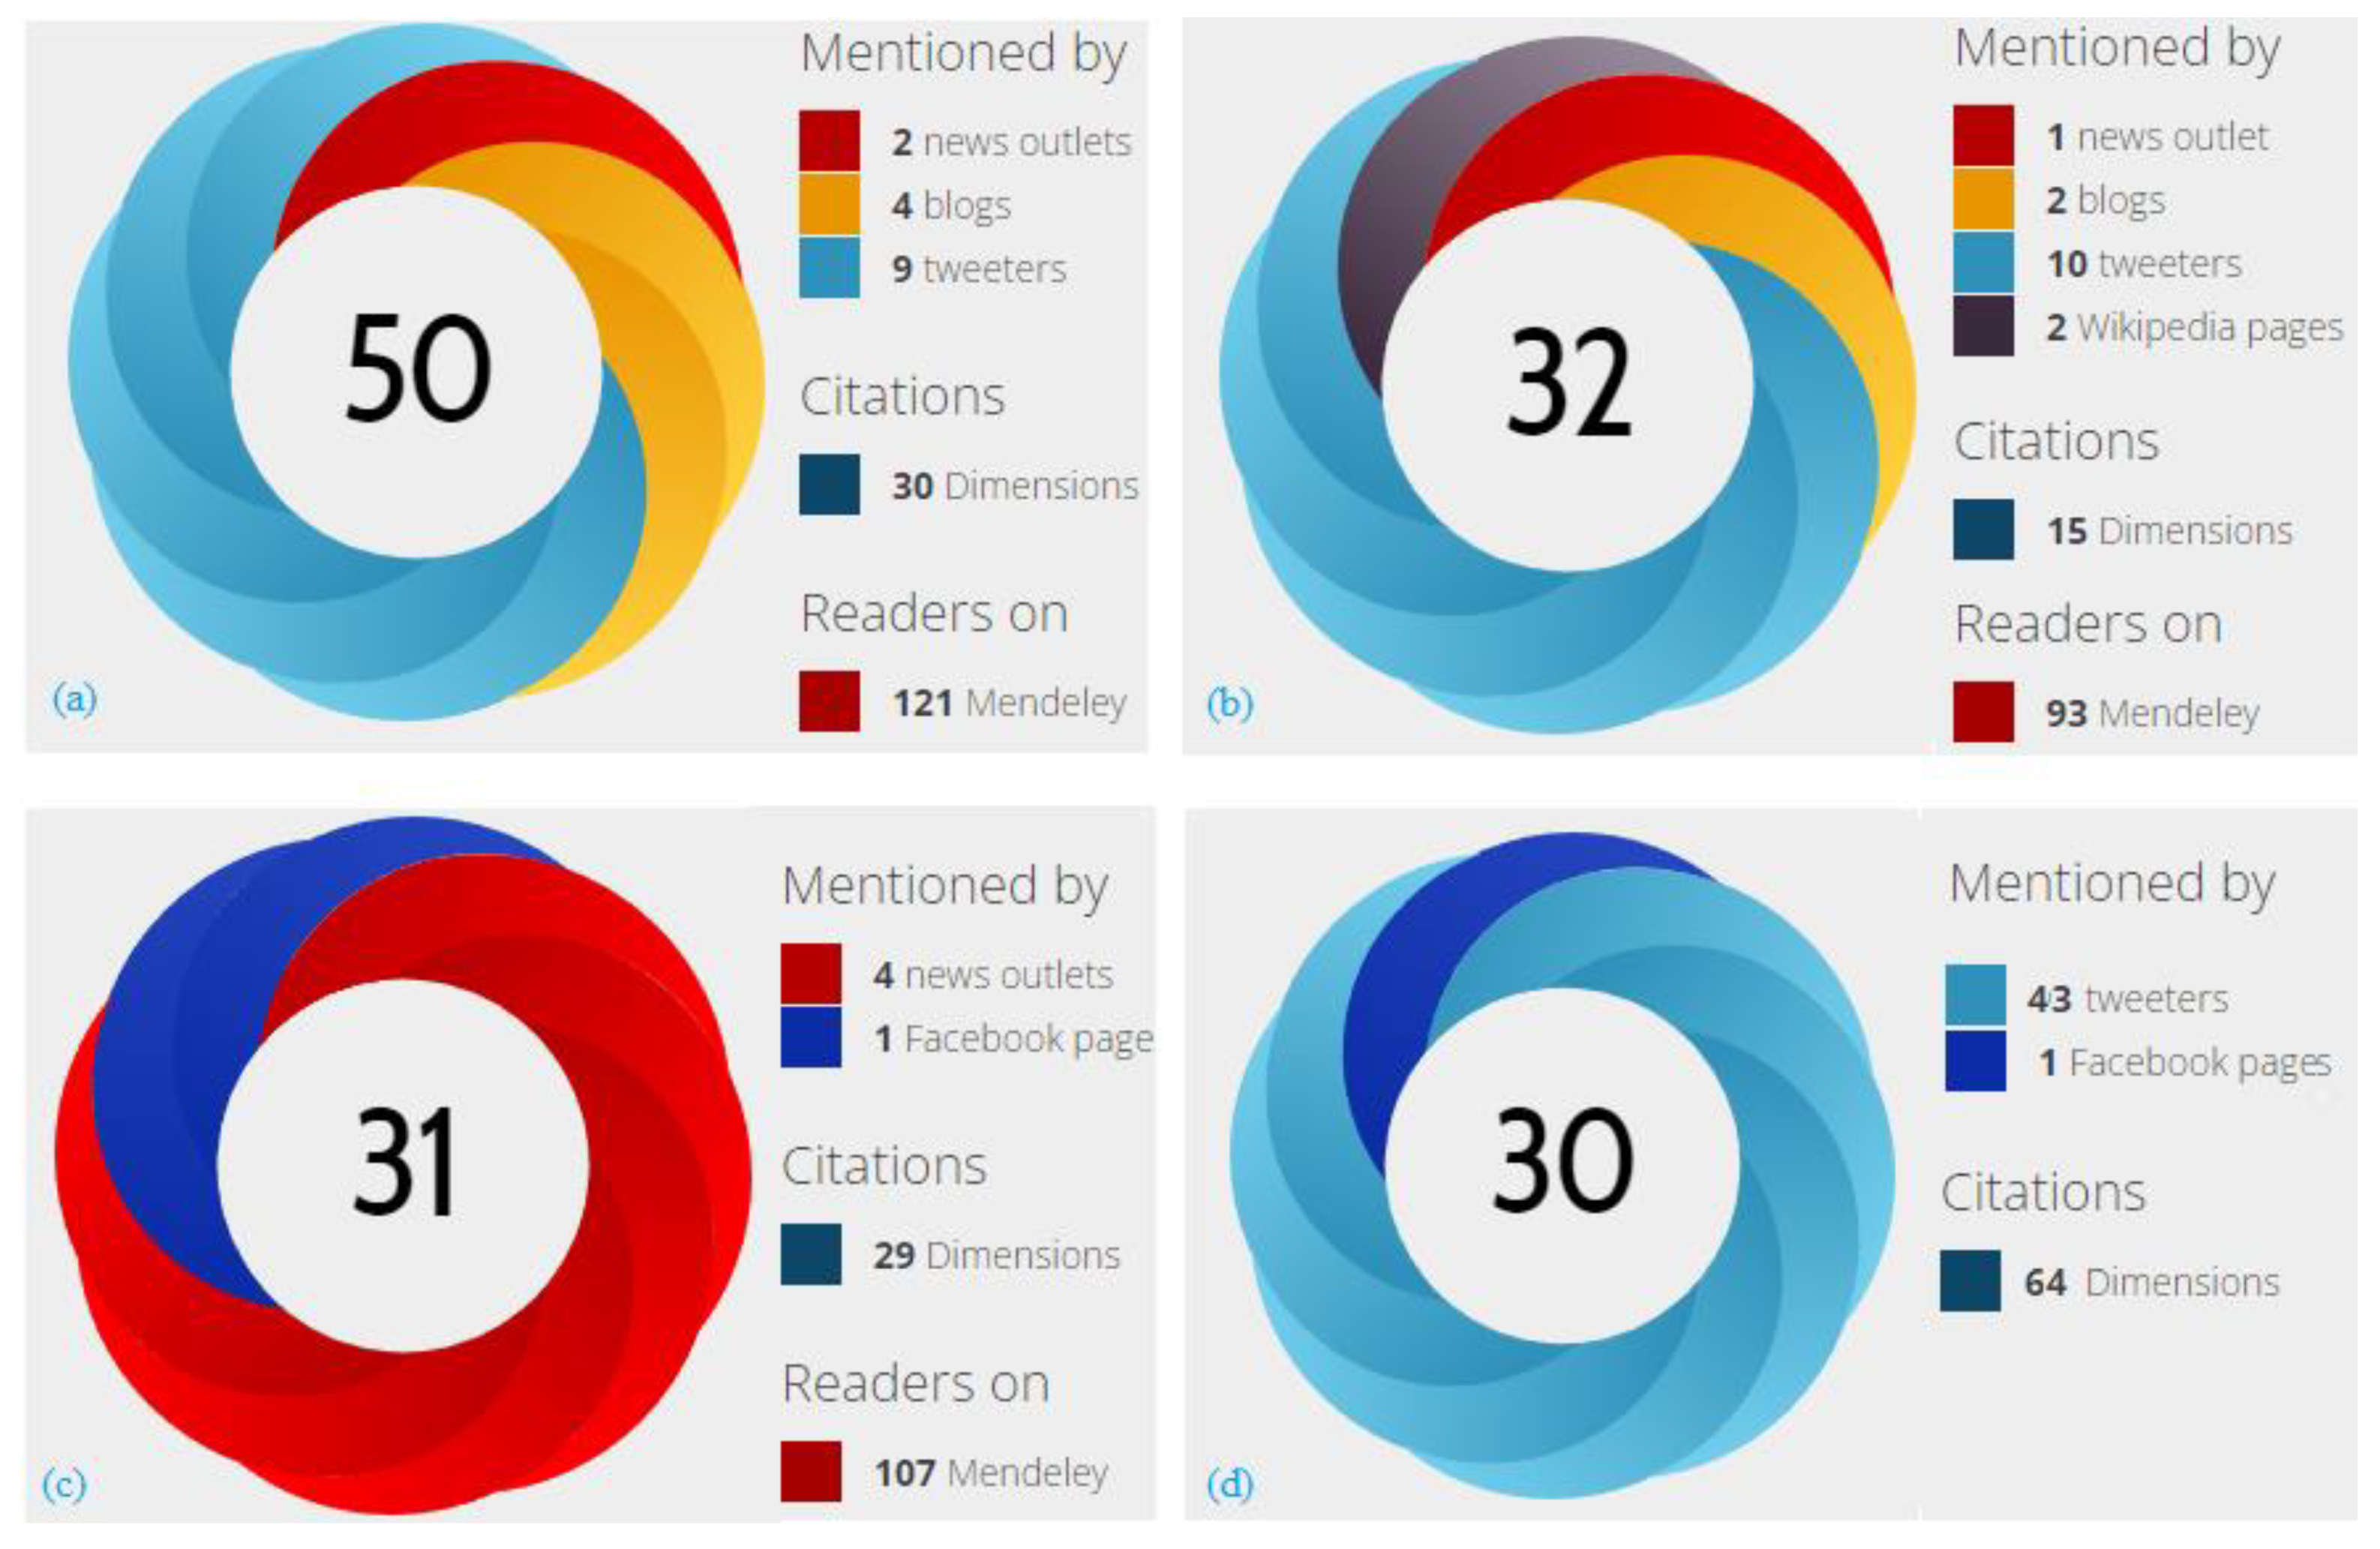
4.4. Analysis of Top Mentions Related to Environmental Valuation from Altmetric

The top mentions related to environmental valuation from Altmetric were analysed using three main components, namely top affiliations, top journals and collections and top subject areas in “Environmental Valuation”. In Table 1, the University of Leeds had the highest number of mentions of ninety-four (15%), with three outputs, followed by Lancaster University with sixty mentions (11%), with three outputs, followed by the University of the Basque Country having 61 mentions (10%), with four outputs. Based on the top subject areas, Economics had the highest number of mentions of three hundred and fifty-six (59%), with ninety outputs, followed by Applied Economics having three hundred and forty-three mentions (57%), with ninety-five outputs, and Environmental Sciences having eighty-two mentions (13%), with thirty-four outputs. Based on the top journals and collections, Ecological Economics had sixty-five mentions (10%), with twenty-three outputs, followed by People and Nature having forty-eight mentions (8%), with two outputs, and Environmental and Resource Economics having thirty-five mentions (5%), with nine outputs.

4.5. Altmetric Analysis of Journals and Other Collections on Environmental Valuation

The first investigation was to check the sources of the documents in journals and other collections and the results are detailed in Table 2. It was observed that there were eighty journals and other collections from the Altmetric Explorer having explored data for all research outputs from the Altmetric database using title and keywords containing the term “Environmental Valuation”. It was observed that Ecological Economics had the highest mentions with twenty-three outputs, having 10% of the data, and sixty-five mentions, including thirty-three Twitter mentions, fifteen policy mentions, nine Facebook mentions, five Wikipedia mentions and two blog mentions. This was followed by People and Nature, with two outputs having 8% of the data and forty-eight Twitter mentions. This was followed by Environmental and Resource Economics with nine outputs having 5% of the data and 35 mentions, including nineteen policy mentions, fifteen Twitter mentions and one Wikipedia mention. The Australian Journal of Agricultural and Resource Economics followed it with fifteen mentions, including seven Twitter mentions, three blog mentions, three policy mentions and two Facebook mentions. Sustainability followed it with thirteen mentions, including eleven Twitter mentions, one Facebook mention and one policy mention. This was followed by Journal of Environmental Management with ten mentions, including seven Twitter mentions, one news mention, one policy mention and one Wikipedia mention. Science of the Total Environment followed it with ten mentions, including one Twitter mention, two news mentions, two policy mentions and three Facebook mentions.

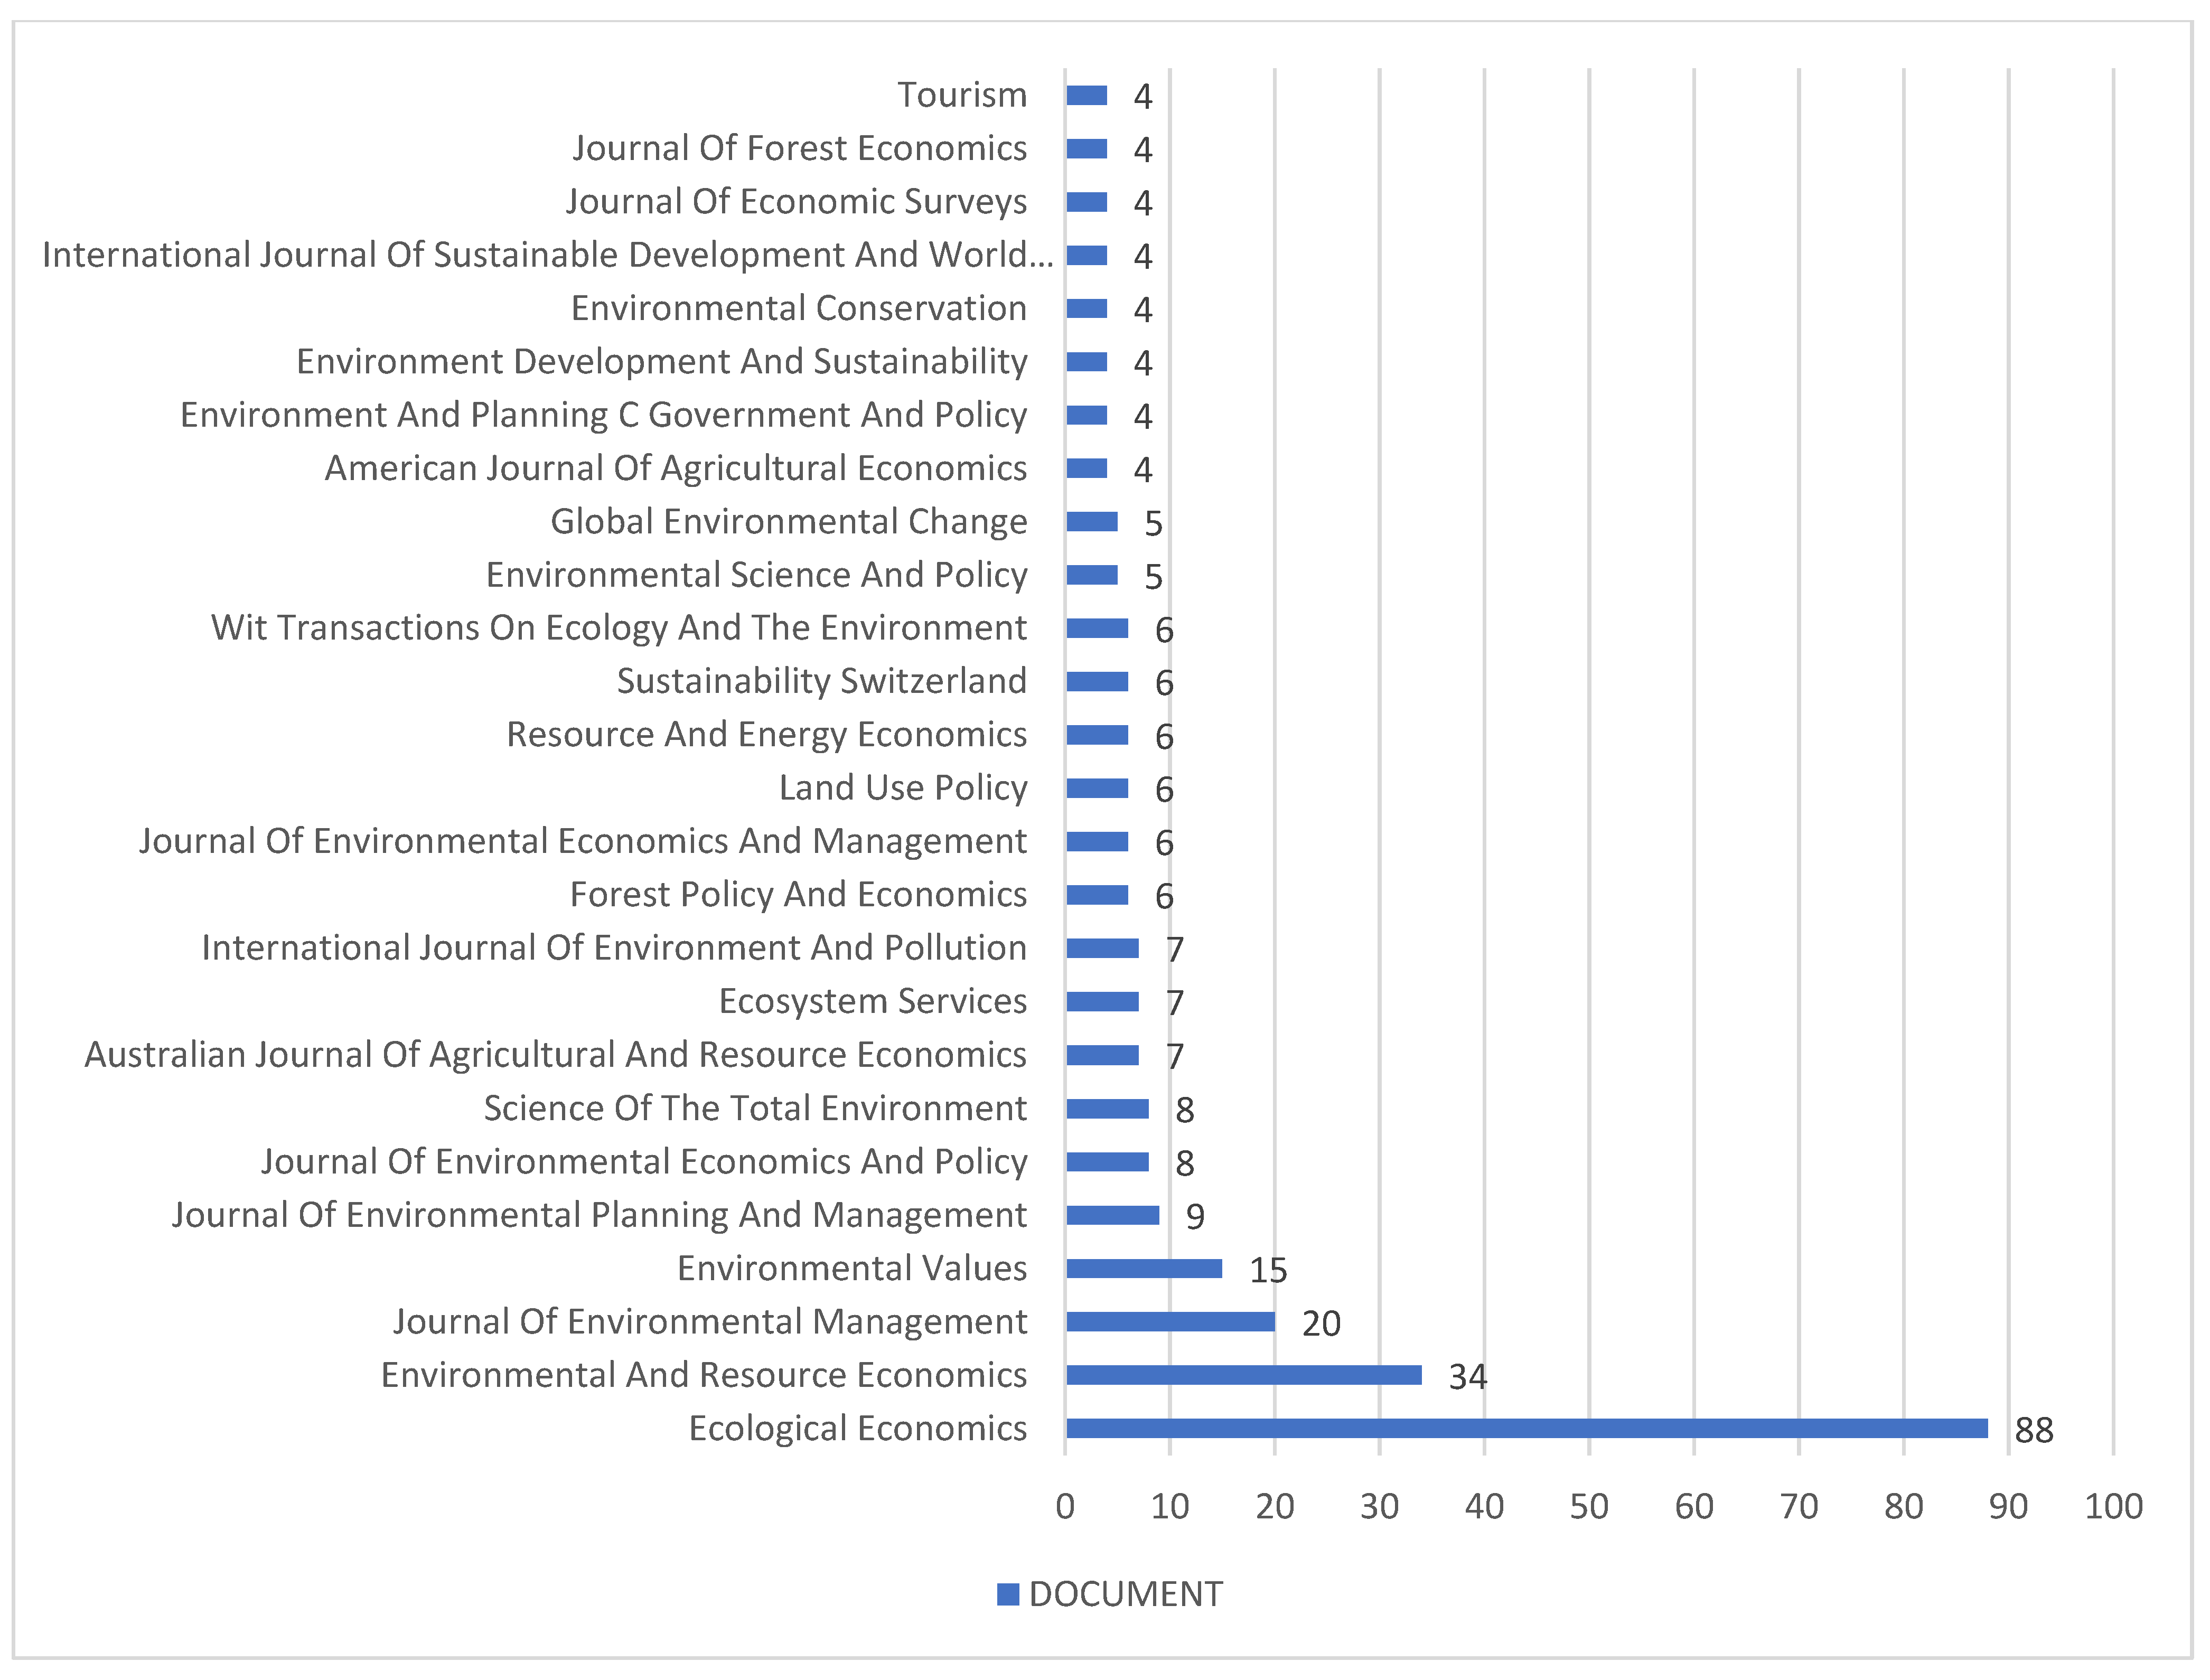
4.6. Document per Source

Using Scopus, it was found that one hundred and fifty-eight journals have published research into environmental valuation. Out of this number, 99 (62.69%) have contributed just one article, 22 (13.92%) have contributed two articles and 11 (6.96%) have contributed only three articles. All of these were excluded from further analysis of document sources because of their low number of contributions.
Figure 5 shows the document sources with at least four publications in this area. Most article contributions are from Ecological Economics with 88 (55.70%) being a single source, occupying first position. This journal was one of the earliest contributors to the subject.
As shown in Table 3, in terms of the citations and strength of journal publications on environmental valuation research, the second in rank is Environmental and Resource Economics journal with 34 (21.52%) articles, followed by the Journal of Environmental Management with 20 (12.67%) articles and ranked third in position. Fourth in rank is the Environmental Values journal with 15 (9.49%) articles.

4.7. Authors’ Contributions to Environmental Valuation Research

Table 4 shows the research output per author, thus revealing the most productive researchers in environmental valuation. The table shows the number of articles contributed by each author, the number of times cited and their total link strength. The document search excluded authors with less than four publications, and only twenty-eight met this threshold. Hanley has thirteen articles with a total of one thousand four hundred and forty-eight citations. Hanley has the highest number of published articles and the highest number of citation records and so ranks first in both. The second resourceful author in terms of the number of published articles is Mariel, with eleven papers and one hundred and ninety-six citations. However, this author ranks sixteenth in terms of citations. Although Adamowicz, Louviere, Swait and Welsch have four articles each to credit them, their citation records are one thousand two hundred and eighty-five, eight hundred and eighty-one, eight hundred and eleven and seven hundred and twenty-nine, thereby ranking second, third, fourth and fifth, respectively. The earliest contribution of Adamovicz was in the year 1996 [123]. Despite this, the rate of citation of the author’s work is high compared to the earlier authors who have contributed to the subject of environmental valuation since 1987. The understanding of the authorship and citations in this field help readers to understand the impact and trend of the research, which also show that there is increasing research interest into environmental valuation.

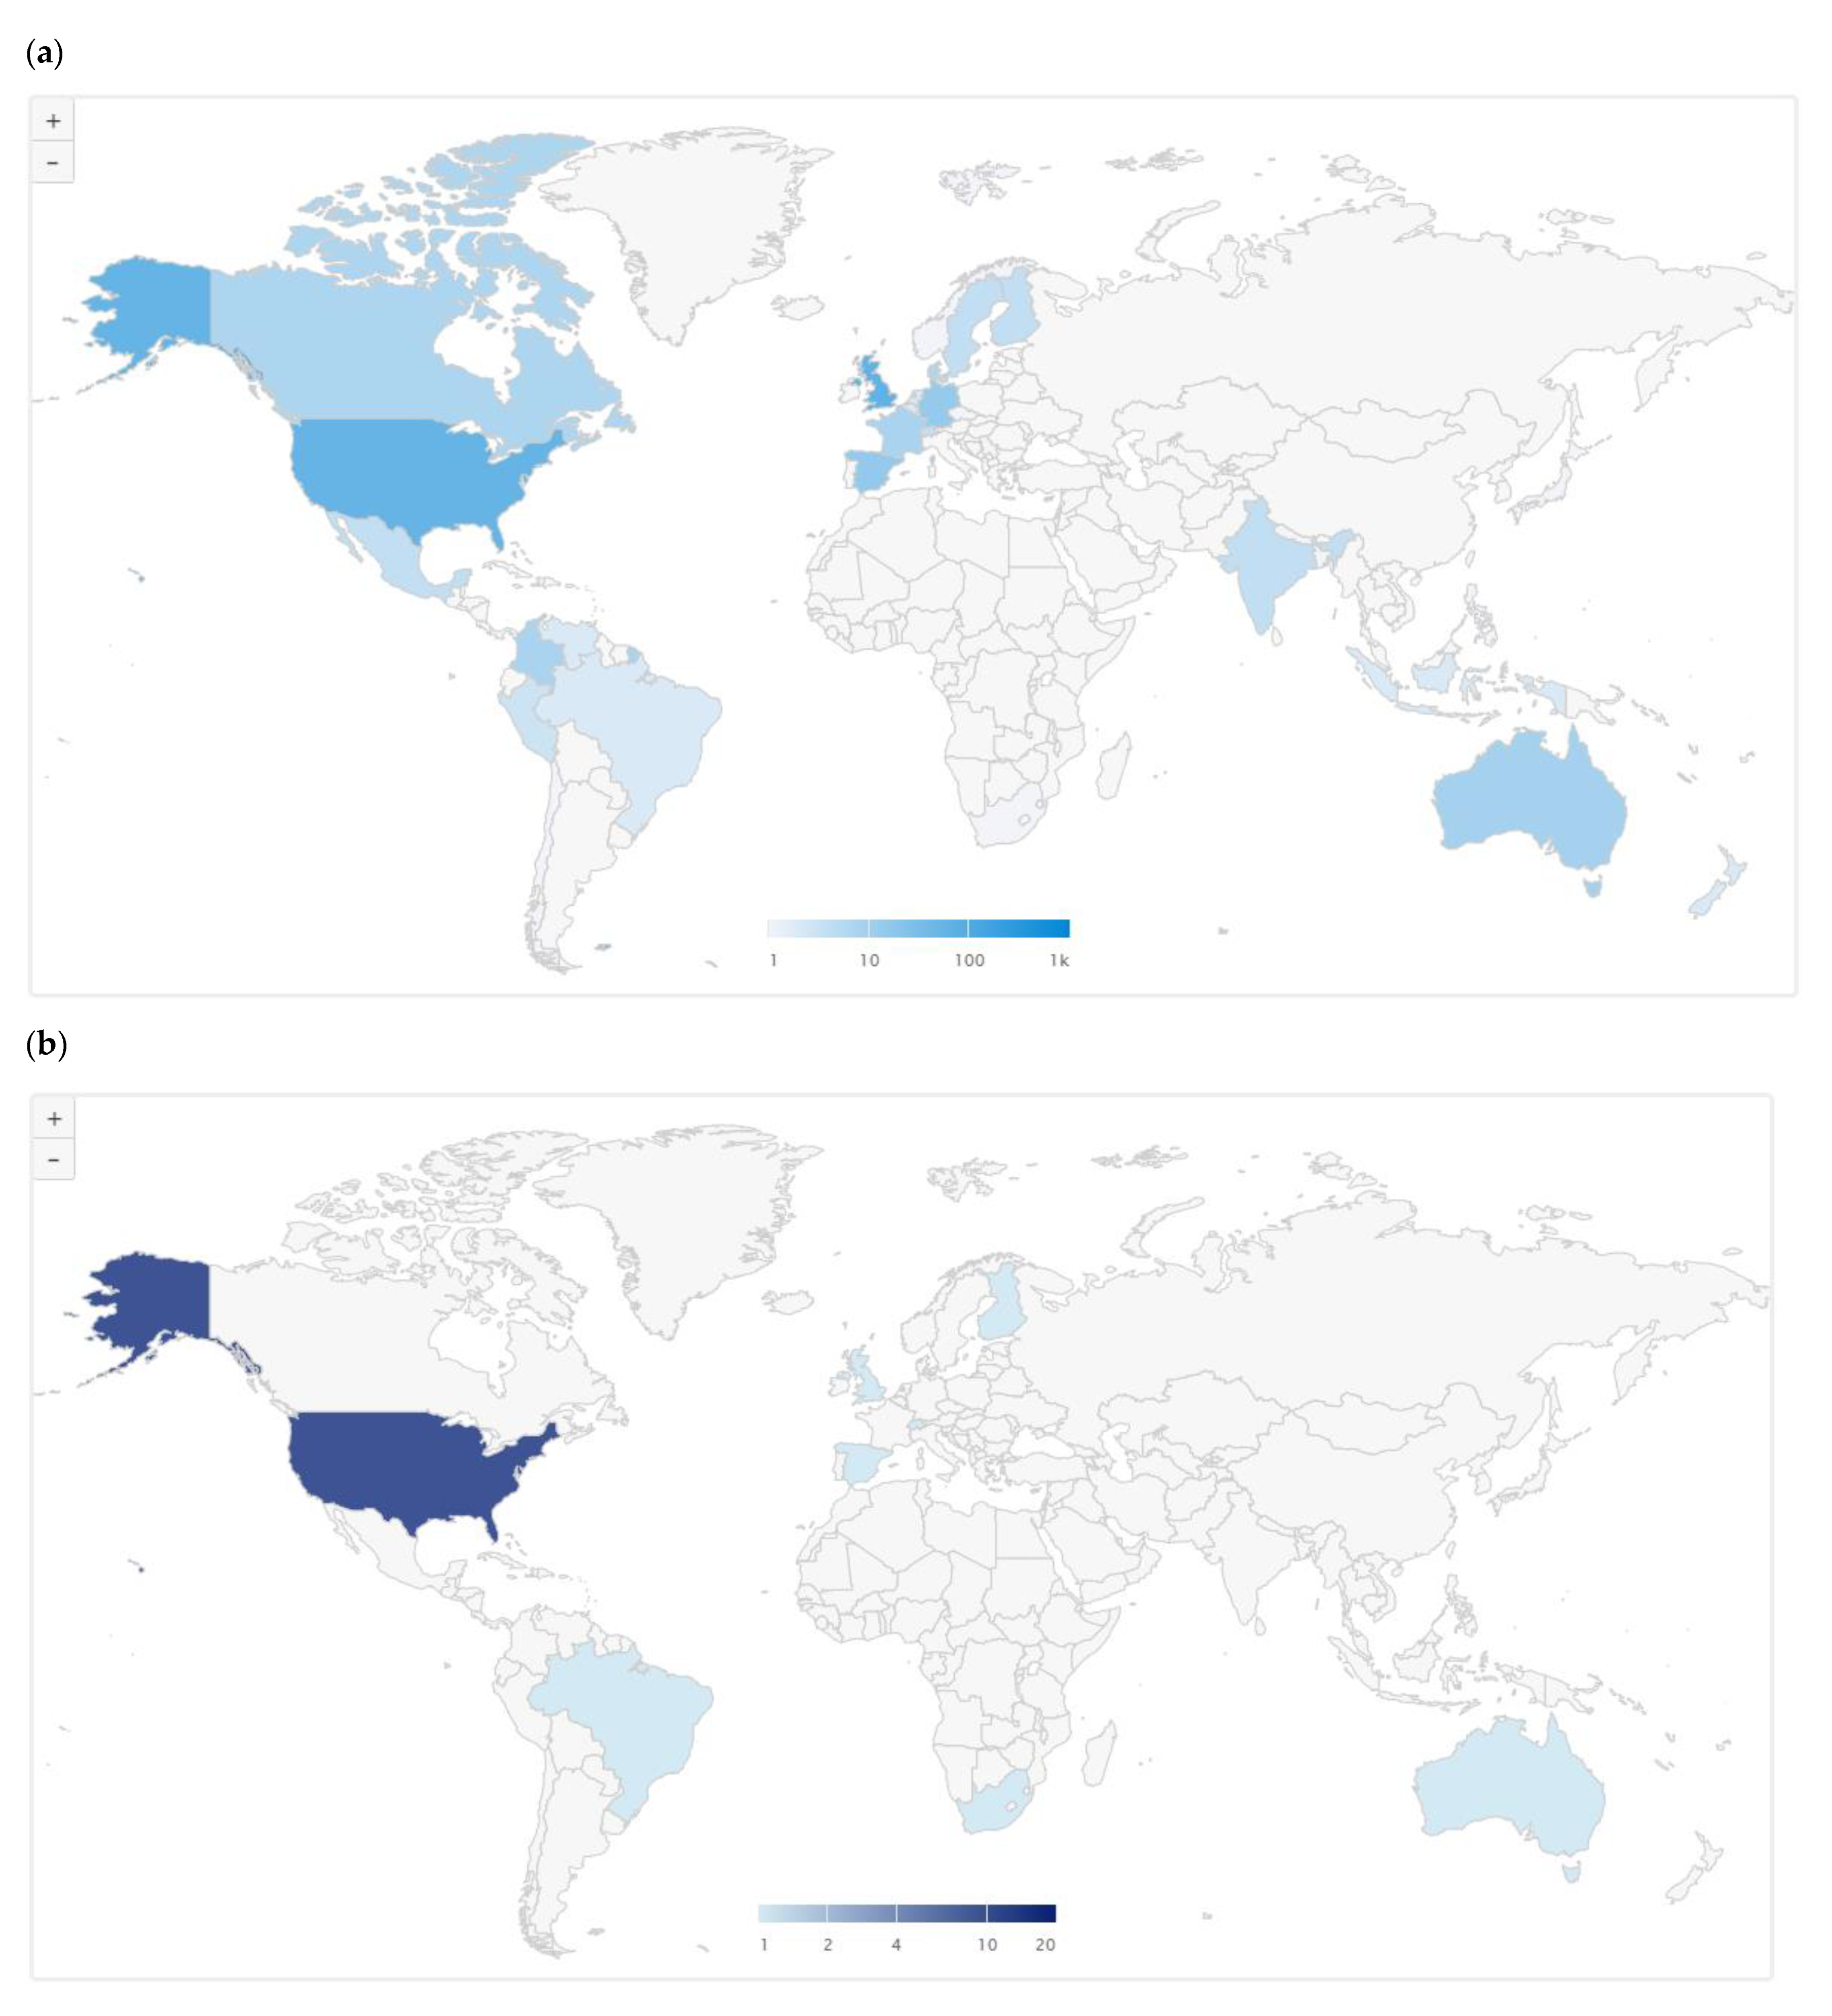
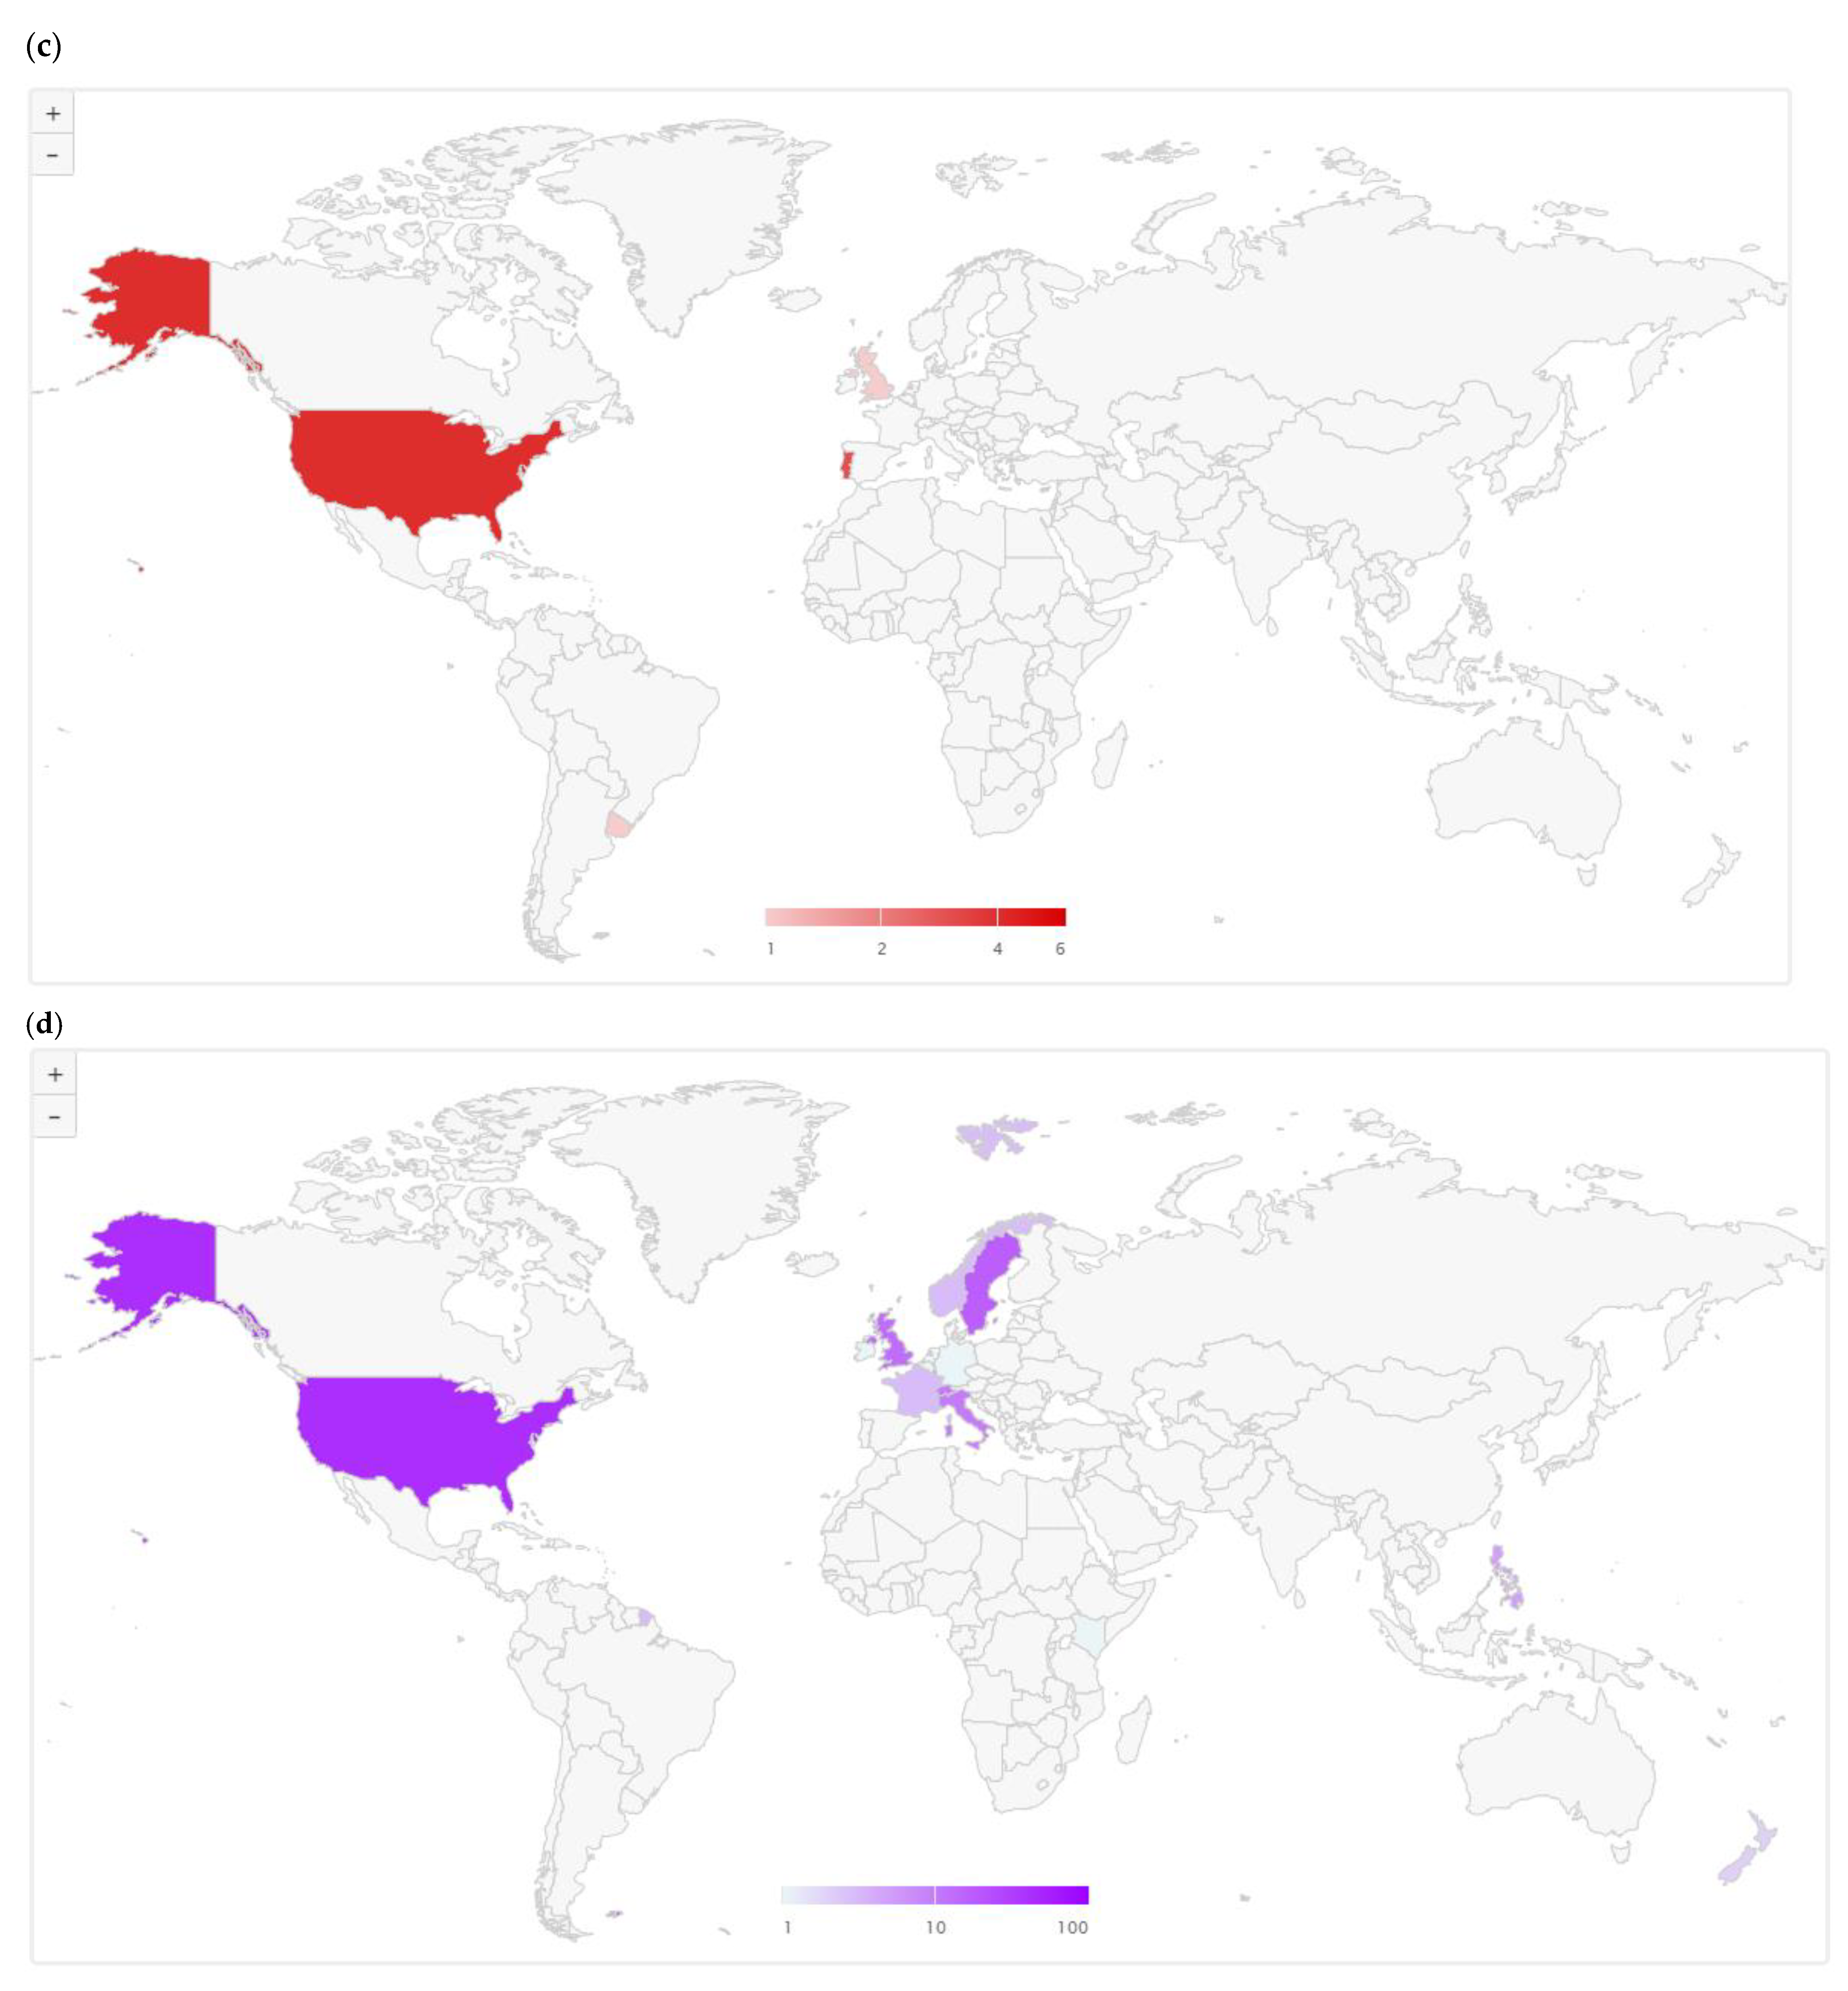
4.8. Distribution in the Demographics for Mentions Using Altmetrics

Although the publication trend from the search for environmental valuation research work was conducted, the distribution in the demographics showed that the highest mentions were from Twitter. As seen in Figure 6 and Table 5, there were 380 tweets about this content by 311 unique tweeters in 34 countries. However, there were also twenty-eight Facebook posts about this content on nineteen unique Facebook pages in nine countries, ten news stories about this content by nine unique news outlets in five countries and one hundred and fifteen policy documents about this content by twenty-eight unique policy sources in fourteen countries (see Figure 6). The United Kingdom had the highest mentions from the Altmetric Explorer, with 62 tweets and 52 unique profiles. It was followed by the United States of America with 56 tweets and 38 unique tweeters. This was followed by Spain with 15 tweets and 15 unique tweeters. This was followed by Germany with 14 tweets and 13 unique tweeters. This was followed by Australia with 9 tweets and 9 unique tweeters. This was followed by Colombia and France, as each had 8 tweets and 7 unique tweeters. These were followed by Canada, with 7 tweets and 7 unique tweeters.

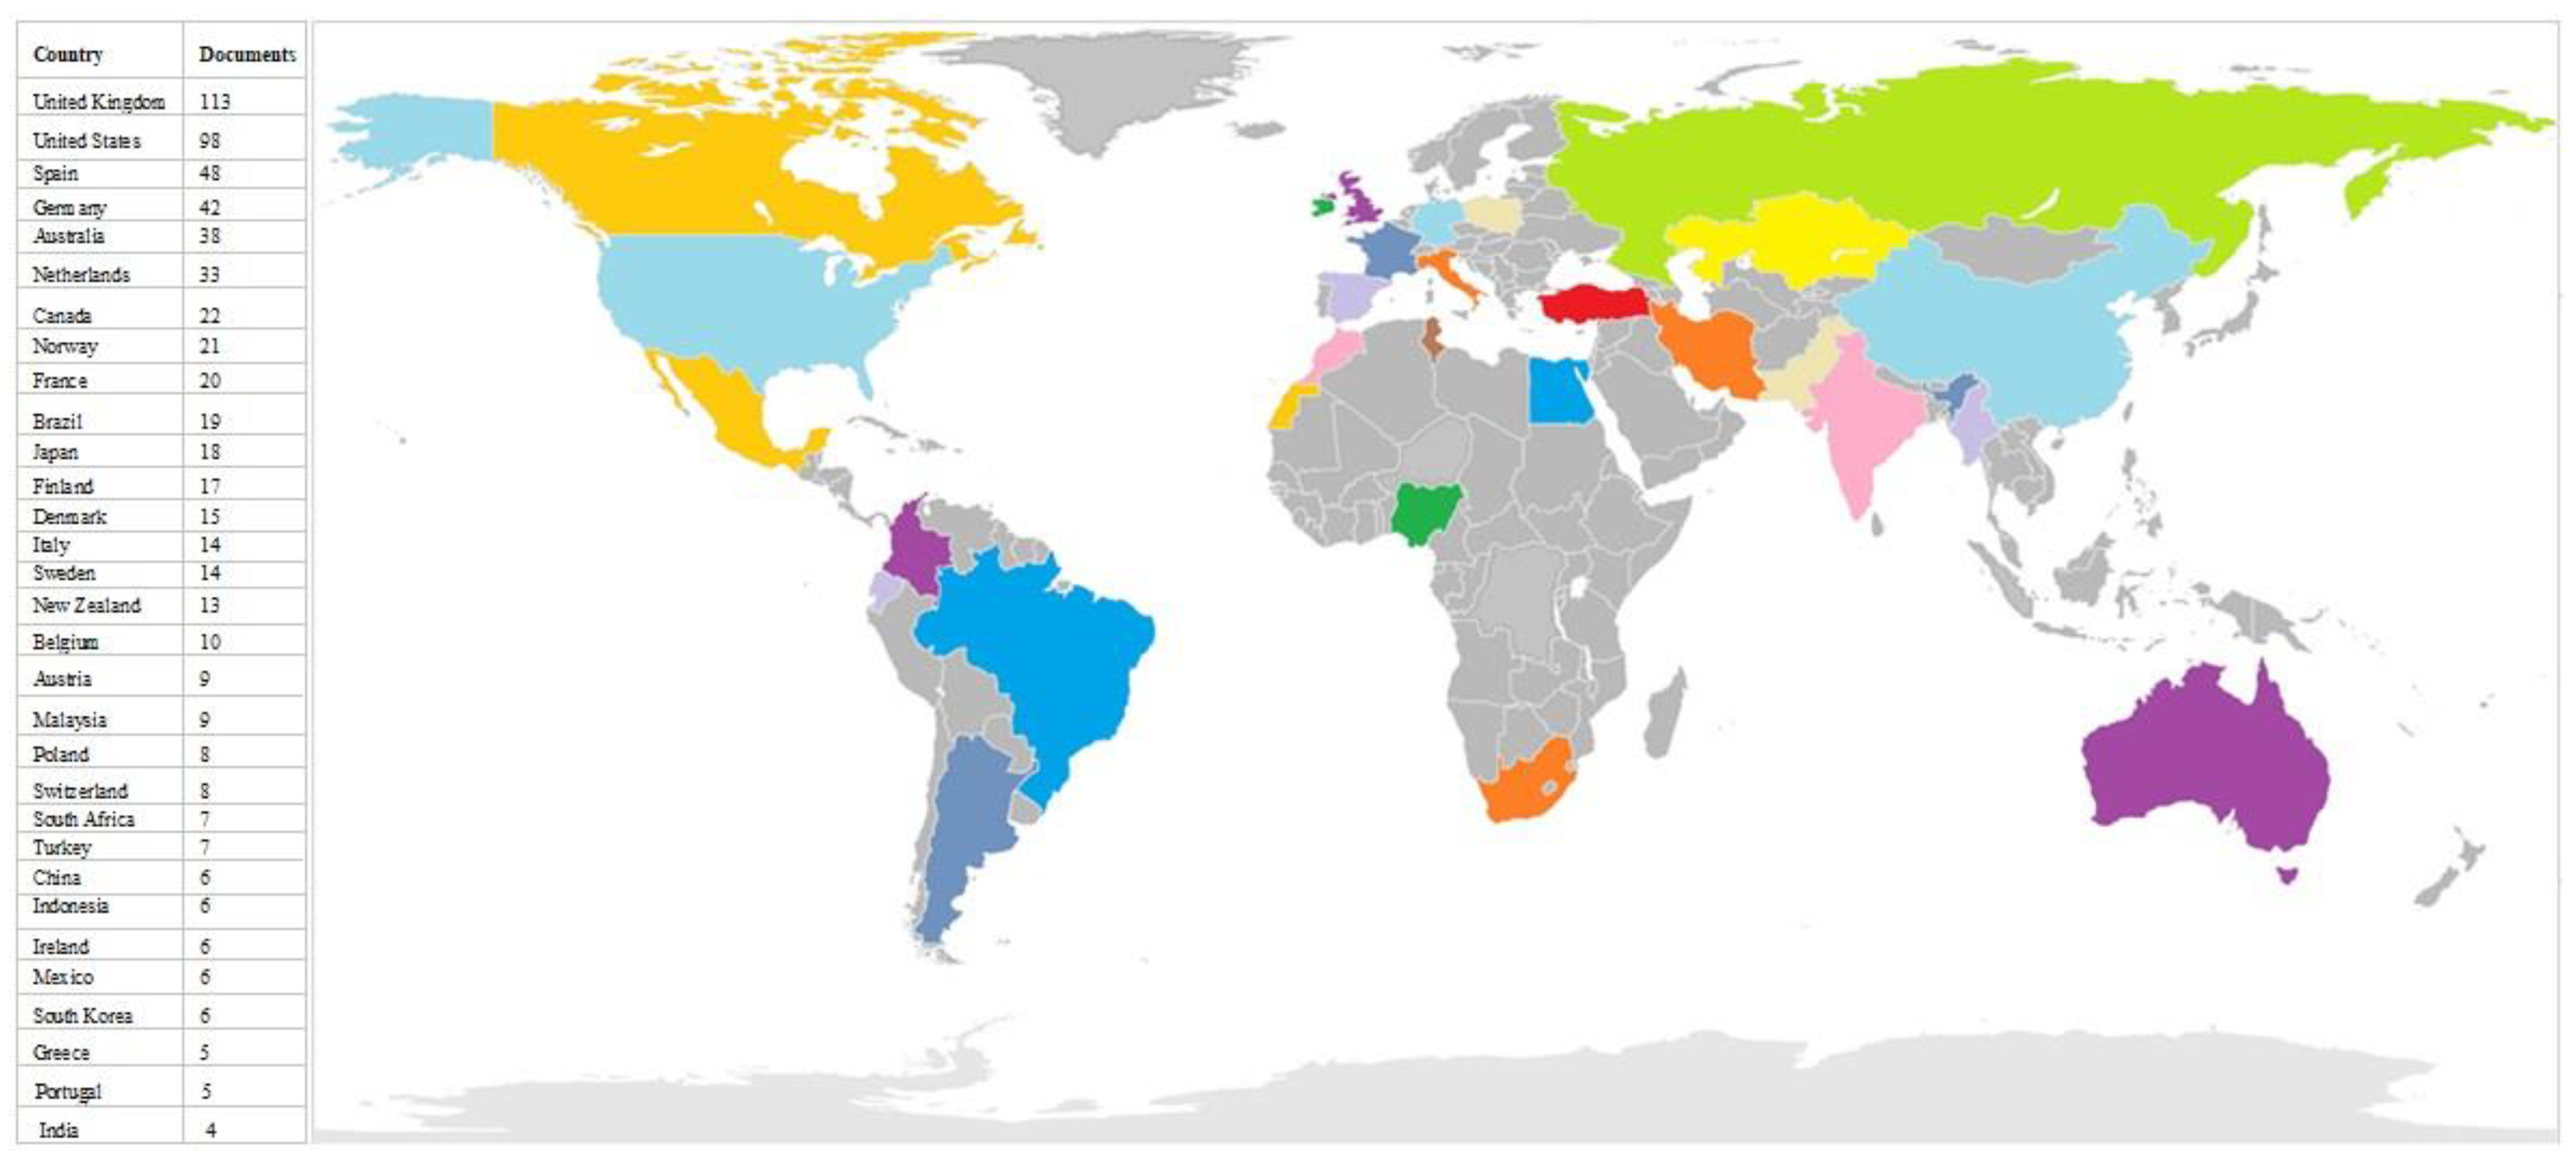
4.9. Countries’ Contributions to Environmental Valuation Research

The search criteria for countries’ contributions to environmental valuation research were set at a minimum of five documents and a minimum citation of five. To this end, 30 out of 72 countries fulfilled these criteria and the United Kingdom with 113 documents and 5772 citations topped the list (see Figure 7). The United Kingdom, the United States, Spain, Germany, Australia, the Netherlands, Canada, Norway, France and Brazil were the top 10 countries with 113, 98, 48, 42, 38, 33, 22, 21, 20 and 19, respectively. However, Canada ranked seventh in terms of the number of documents (22), having an average citation record that stood at 125 which is more than twice higher than that of the United Kingdom which had the highest document contribution. In the African continent, only South Africa significantly featured, having seven document contributions with 83 total citations. This implies that there has not been significant investigations in developing countries with regard to their contribution to environmental-valuation-related research, as earlier expressed by Navrud [124] and Wangai et al. [125]. The network mapping of the countries’ collaborations on environmental valuation research determines countries’ levels of productivity on a line of research as well as the promotion of research funding [126].
Figure 8a,b shows clusters of countries in terms of co-authorship. Cluster 1, which is depicted in magenta red-coloured profiles, has France, Indonesia, Japan, Malaysia, Mexico, the Netherlands and South Africa. Cluster 2, which is depicted in green-coloured profiles, comprises Austria, Canada, Ireland, New Zealand, South Korea and the United States of America (USA). In Cluster 3, which is depicted in sky blue-coloured profiles, there are Germany, Greece, Poland and Spain. The fourth cluster – Cluster 4 which is depicted in yellow-coloured profiles, incorporates Austria, Brazil, China and Norway. Cluster 5, which is depicted in purple-coloured profiles, has Belgium, Portugal and the United Kingdom (UK). Denmark, Finland and Sweden form Cluster 6, which is depicted in cyan-coloured profiles. Lastly, Cluster 7, which is depicted in dark orange-coloured profiles, comprises Italy and Turkey. It is noteworthy to add that network mapping is useful in identifying the key factors that influence trends in research. It can also be used to determine countries’ levels of productivity on a line of research as well as the promotion of research funding [126]. The size of the nodes represents the extent of each country’s contribution to EV research; consequently, the United Kingdom stands out, followed by the United States. The network lines show the co-citation links between the countries and the thickness of the lines indicate their affinity and strength of association. The network lines can be visualized to present the relationship of the country records and co-citations using the density mapping (as in Figure 8a) and the mapped network (as in Figure 8b). Both visualizations reflect the highest amount of citations on environmental valuation were obtained from the UK, followed by USA, which correlated with the findings in Figure 7.

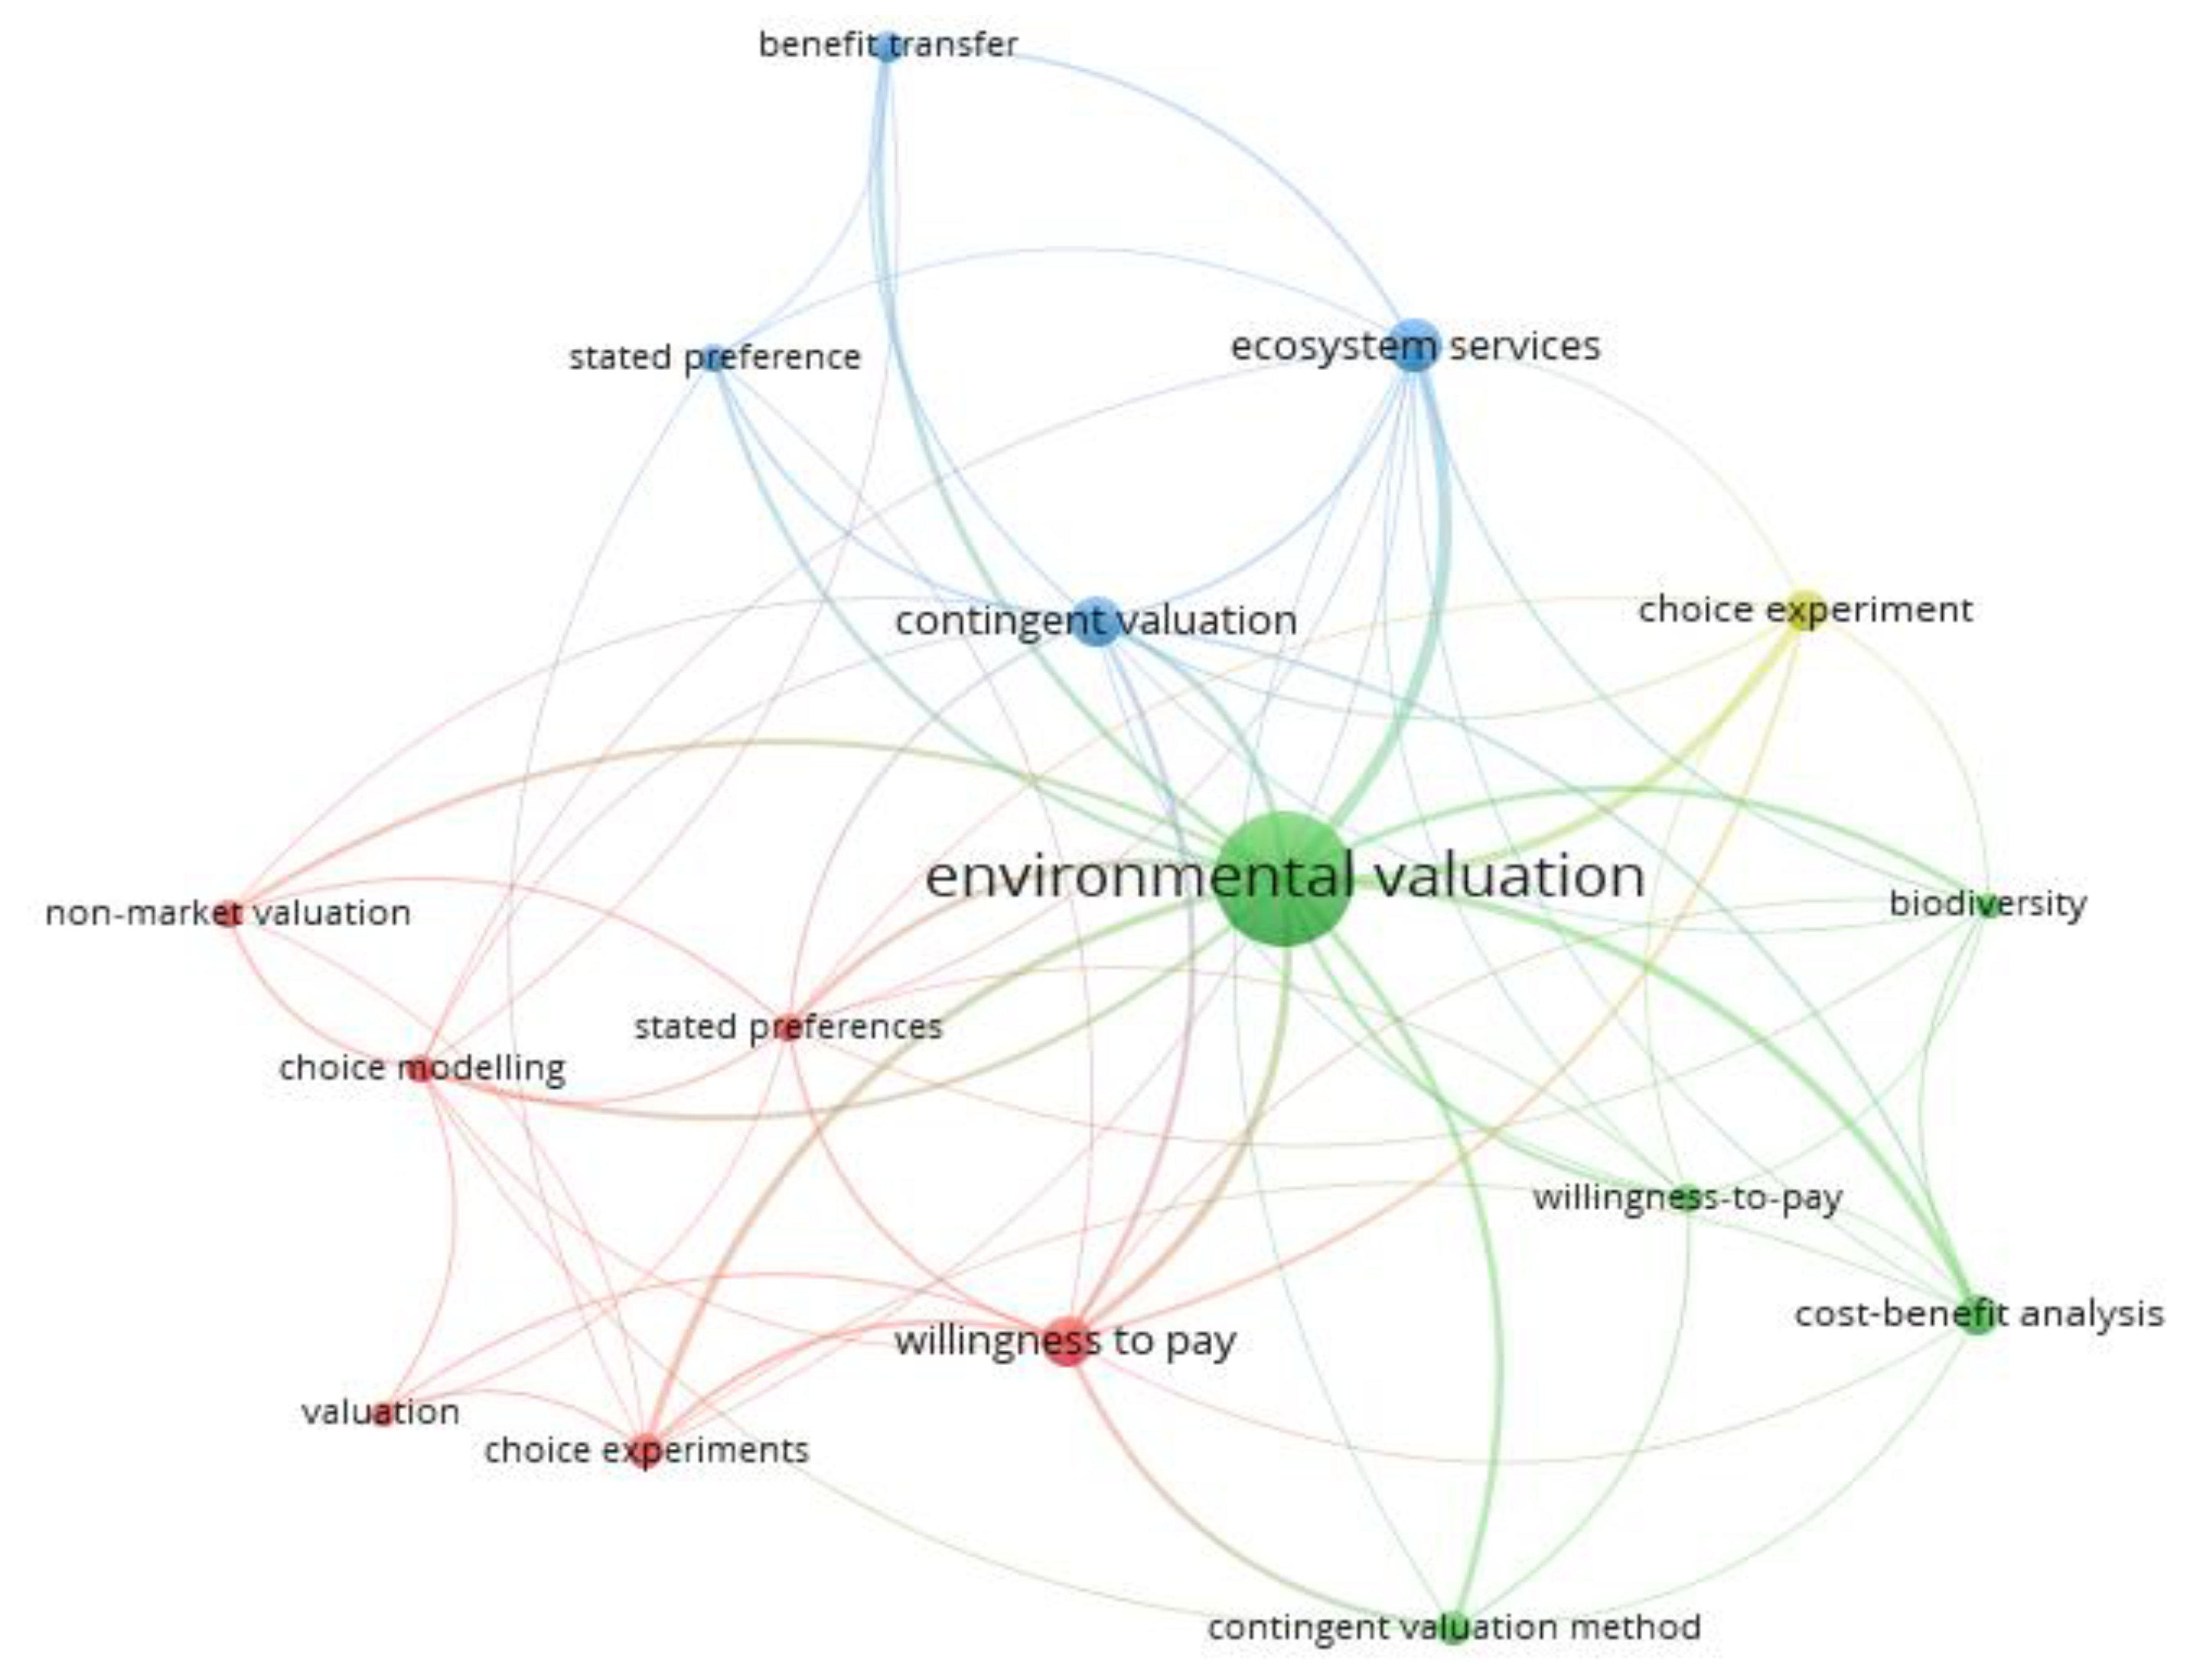
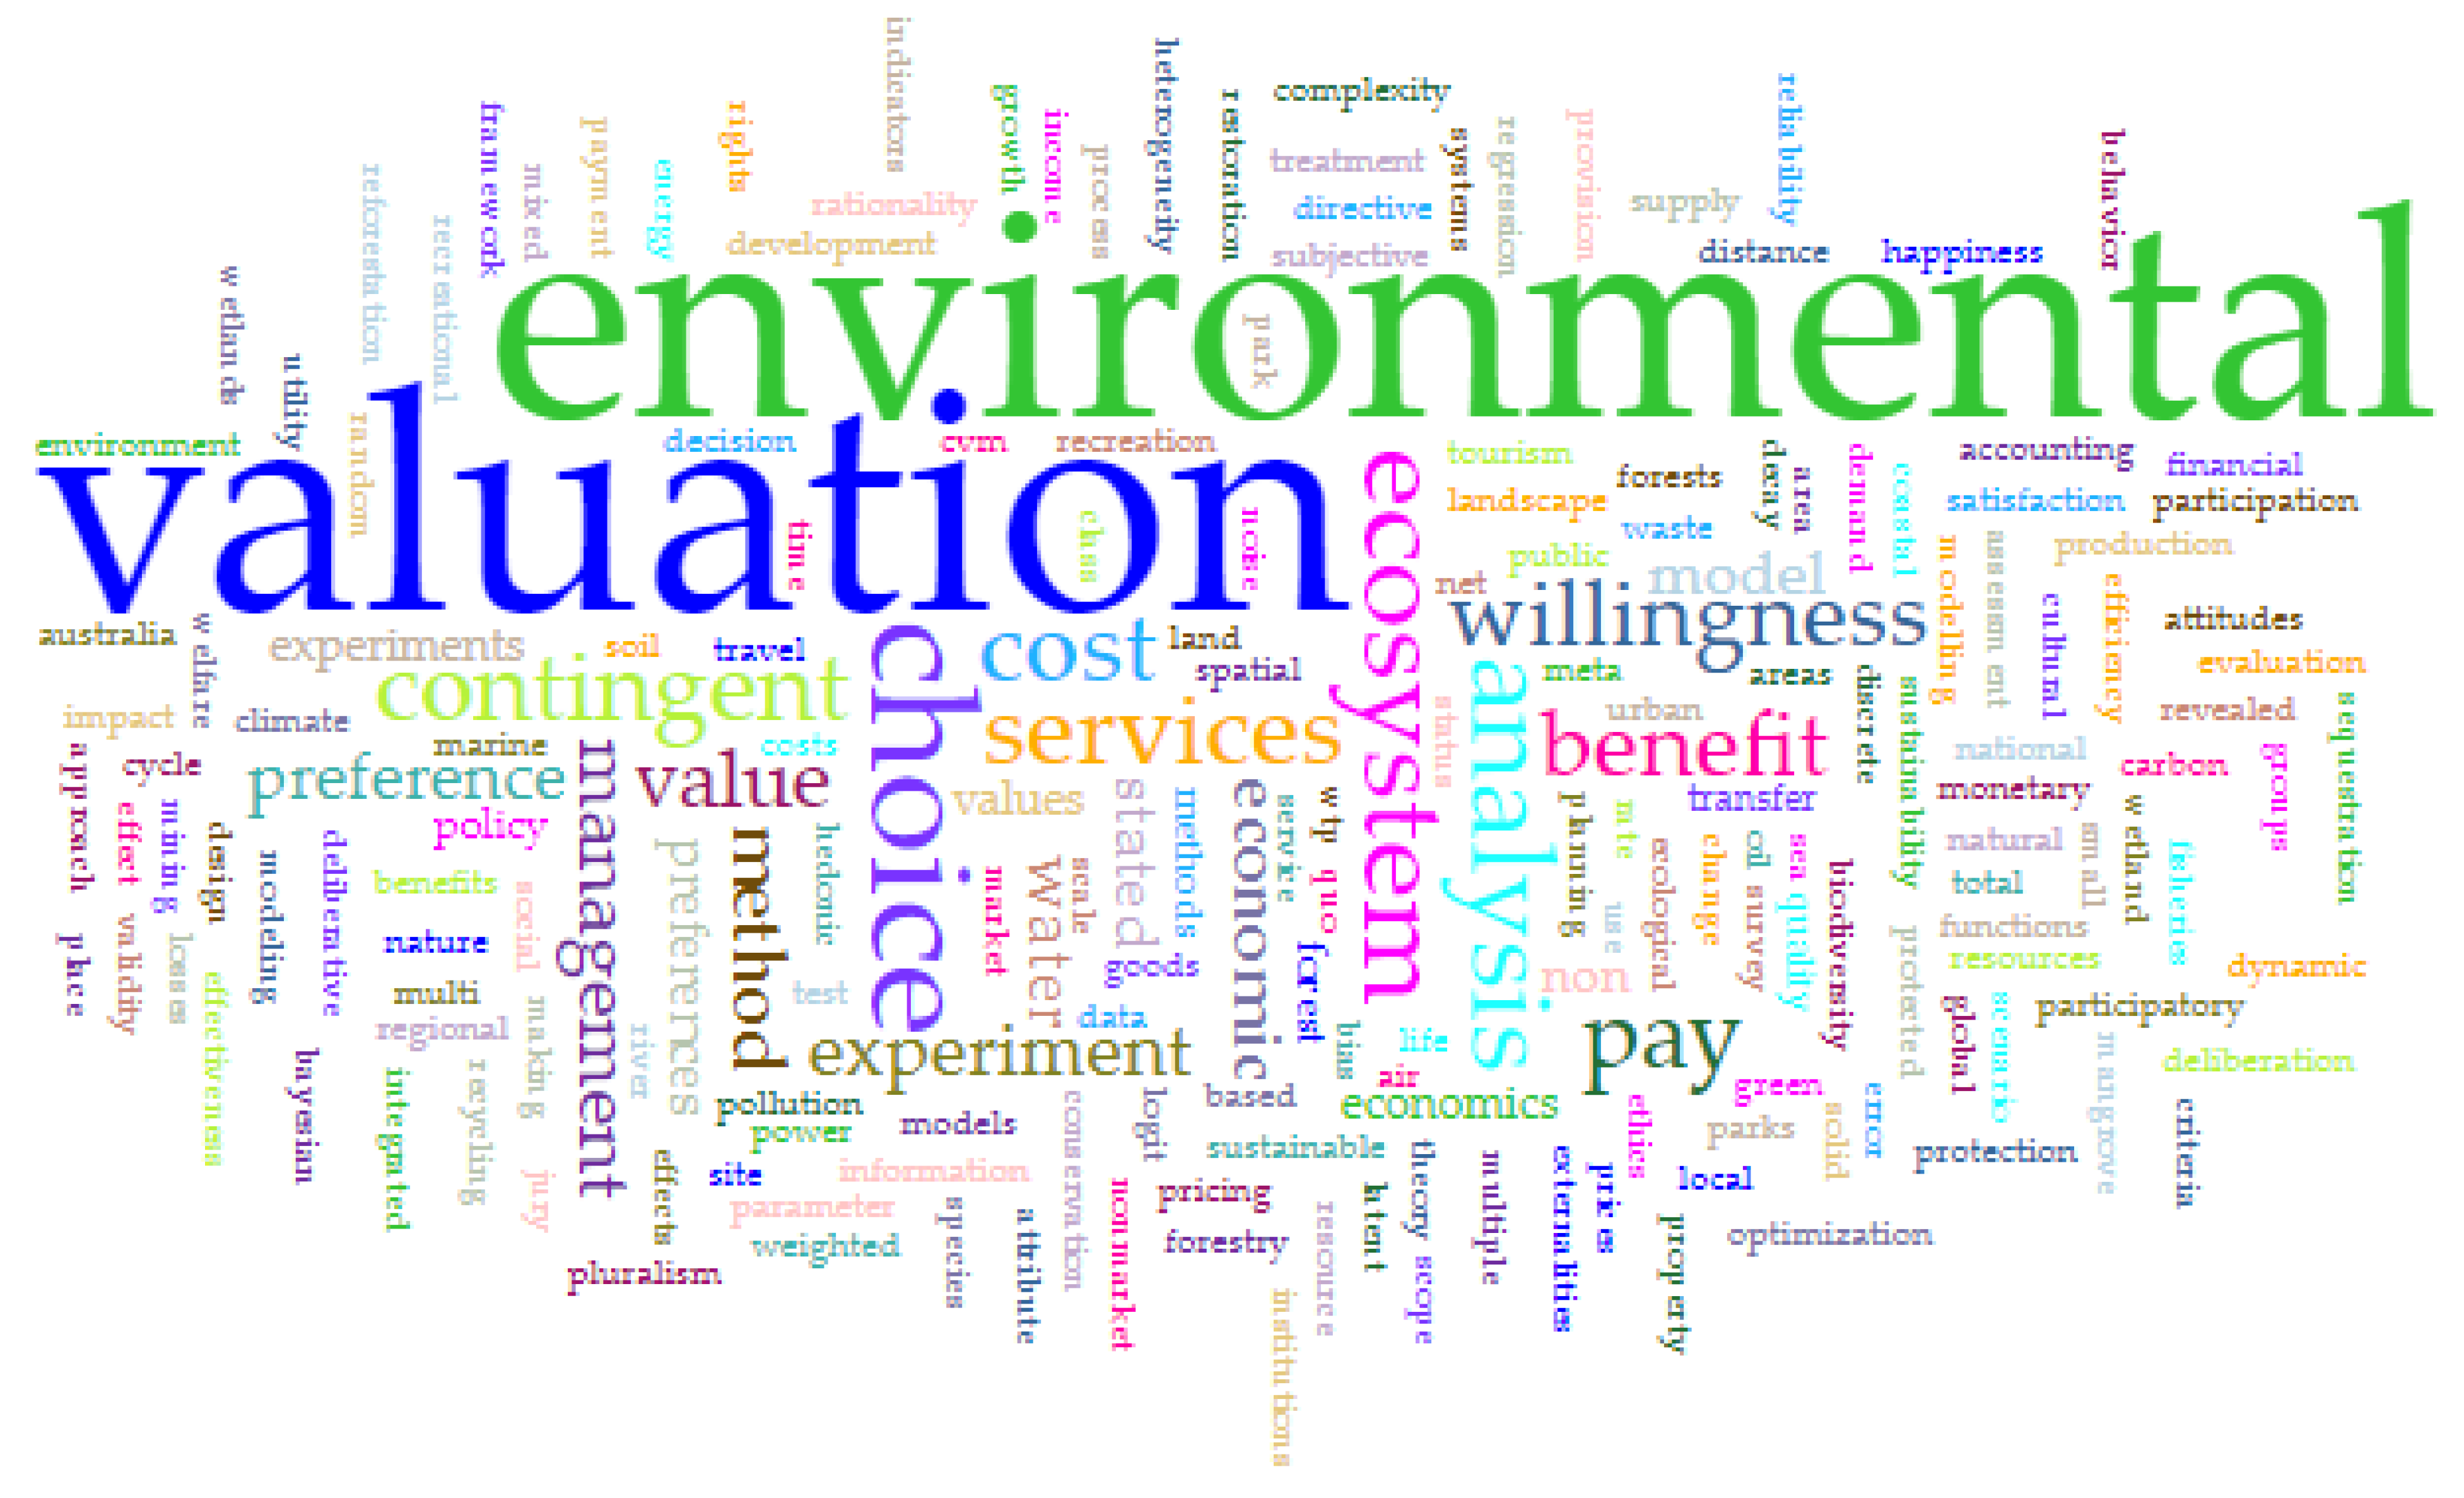
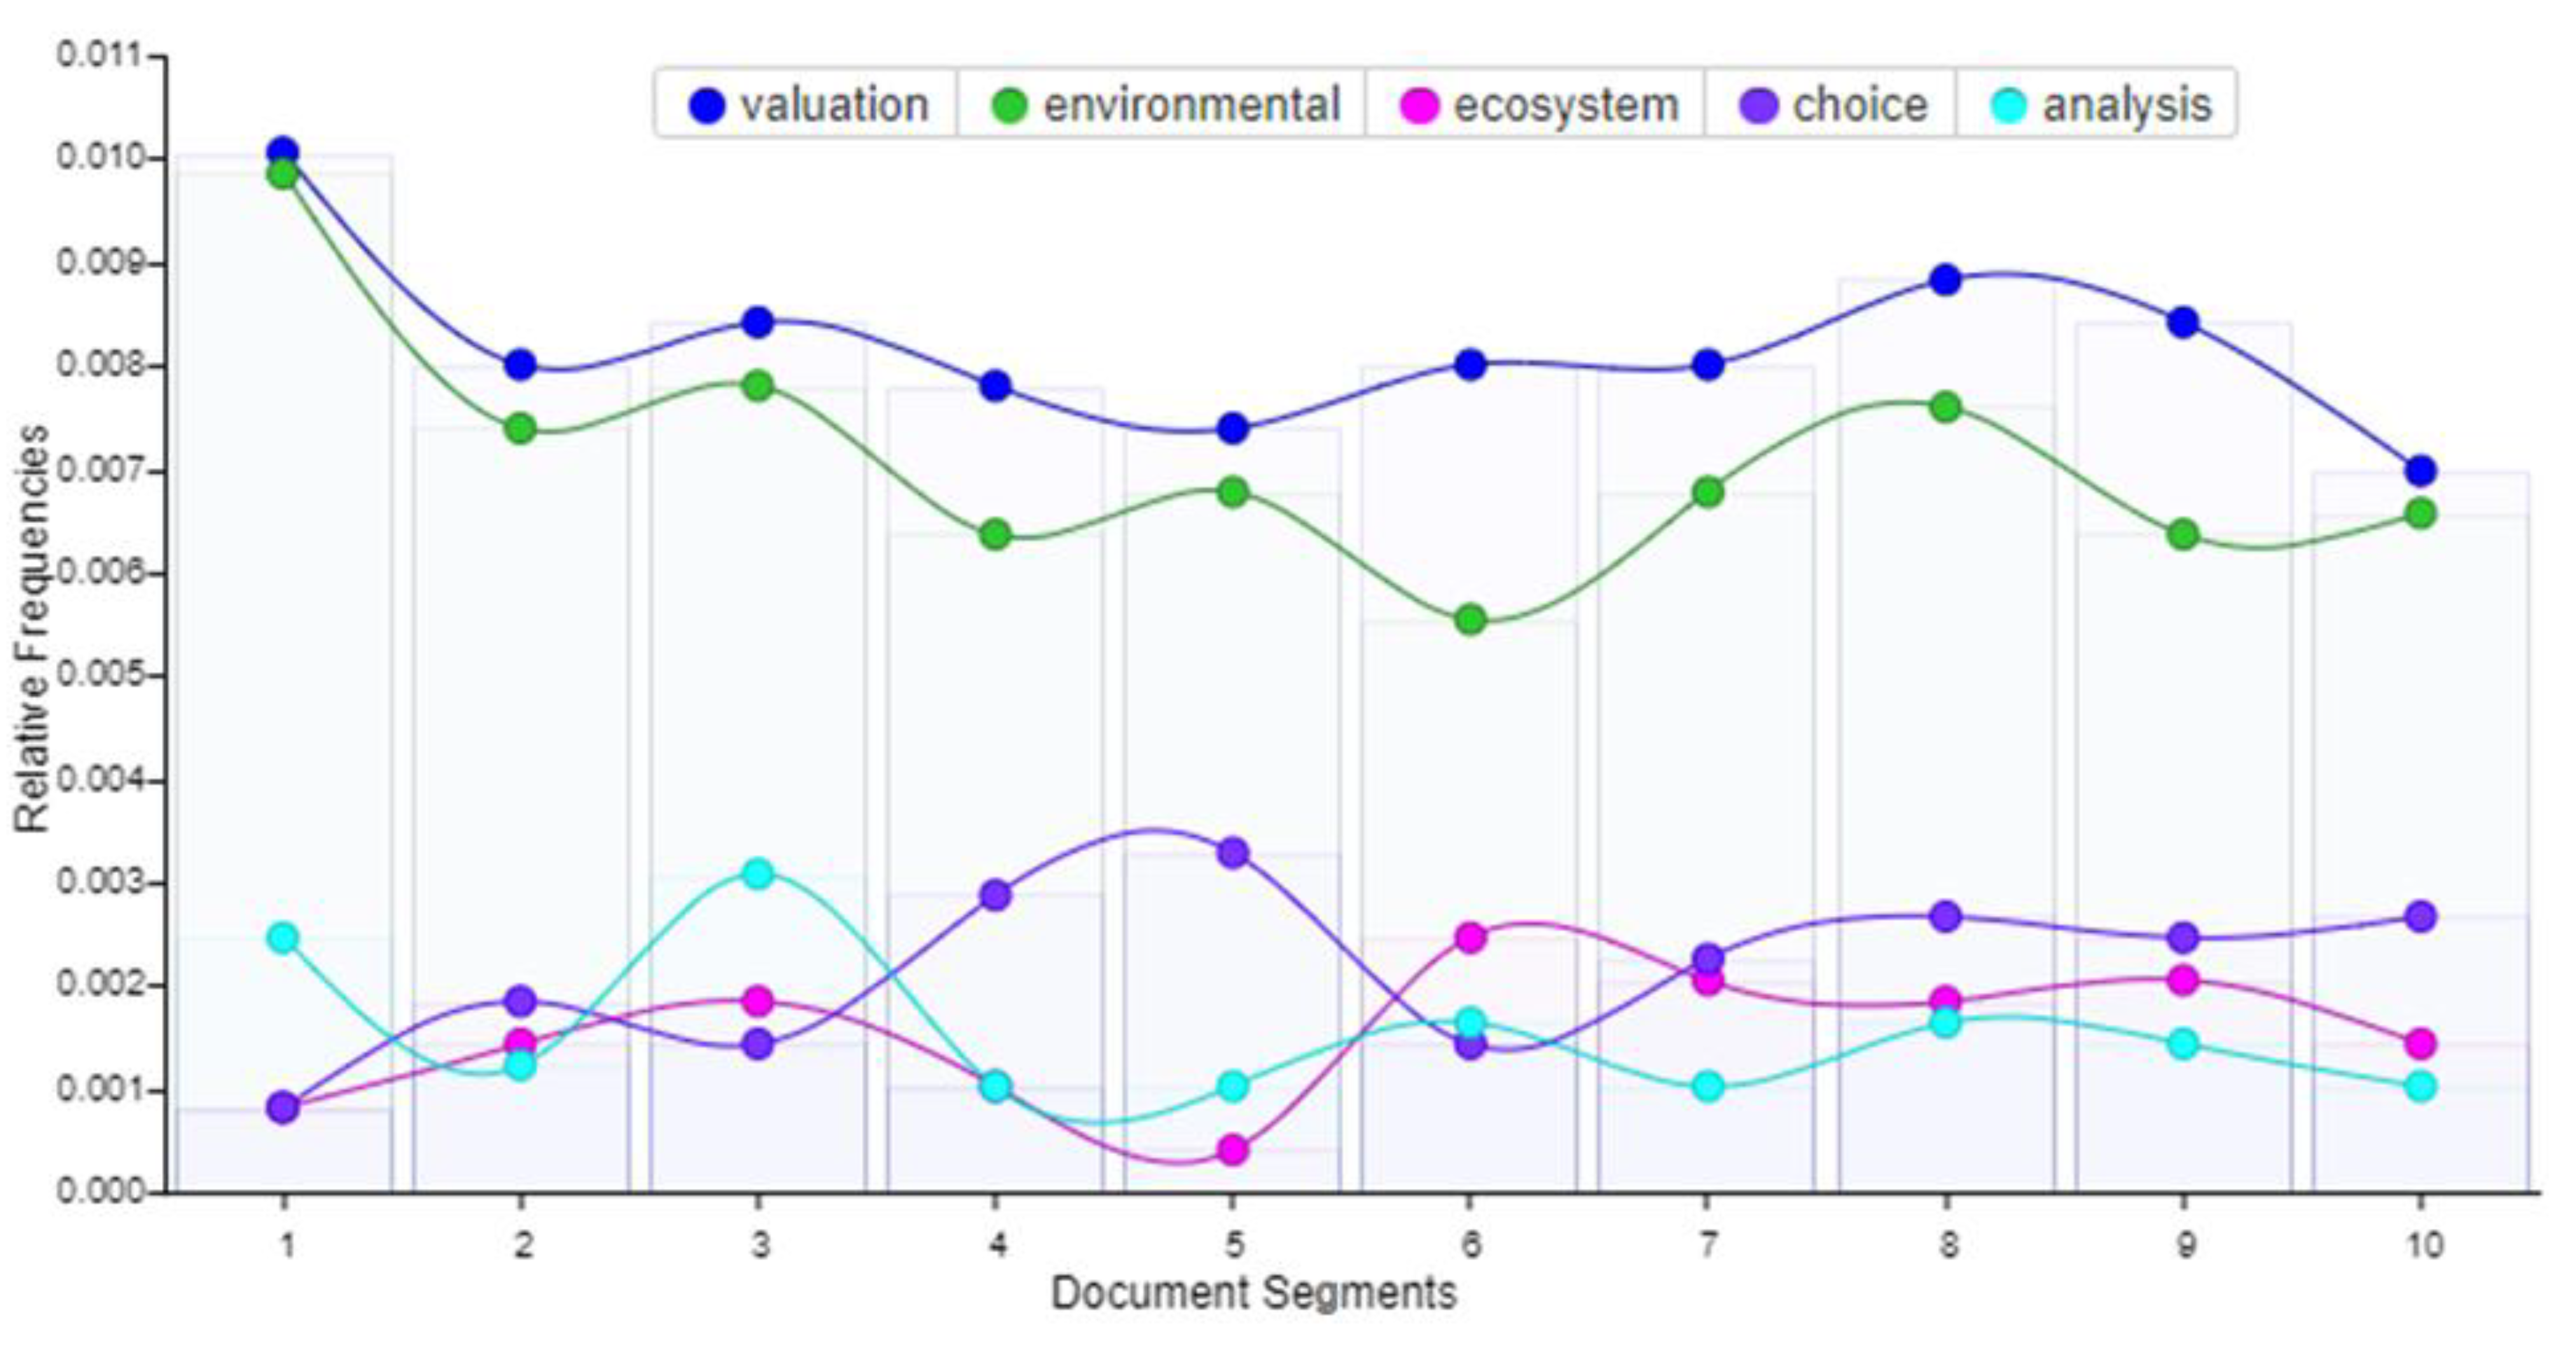
4.10. Analysis of Major Keywords in Environmental Valuation Research

Keywords are pointers to the emerging areas of studies based on the research themes. The themes were developed by evaluating the 497 articles, as well as the bibliometric data’s keyword checklists harvested from the Scopus database. The analysis of co-occurrence using author keywords and setting the minimum number of occurrences of a keyword to 10 was undertaken. Of the 1330 keywords, 16 met the threshold. However, a cursory look at the outcome showed that some keywords overlapped, and as such they were merged. For example, “willingness to pay” and ‘willingness-to-pay”, “contingent valuation” and “contingent valuation method”, “choice experiment” and “choice experiments”, “stated preference” and “stated experiments”. Thus, reducing the number of keywords to 12, Table 5 depicts their number of occurrences and total link strengths.
As expected, the results show that “environmental valuation” had the highest occurrence (255 times) in the four hundred and ninety-seven documents extracted with a total link strength of one hundred and fifty-two, indicating its level of involvement in the co-occurrence map. Second in rank is “contingent valuation”, with fifty-four occurrences and a total link strength of 158. This is equally not unexpected as the contingent valuation method has been described as being the most popular method of environmental valuation. It is the most popular method in a family of alternative stated preference techniques [36,37,38]. “Willingness to pay” has 46 occurrences with a total link strength of 59, thus occupying the third position. This keyword is associated with the contingent valuation method, being an approach adopted in engaging the method.
Figure 9 displays the visual map of authors’ keywords co-occurrence networks with four clusters. From the visualisation map, it can be observed that Cluster 1 comprises keywords of choice experiment, choice modelling, non-market valuation, stated preferences, valuation and willingness to pay. Cluster 2 comprises biodiversity, contingent valuation method, cost benefit analysis, environmental valuation and willingness to pay. Cluster 3 comprises benefit transfer, contingent valuation, ecosystem services and stated preference, while Cluster 4 comprises only one keyword: choice experiment.
Further analysis of the keywords was conducted using Voyant Tools to develop the word cloud in Figure 10. It was developed using the corpus from one keyword document with 4872 total words and 1235 unique word forms. From the keyword data, the vocabulary density was 0.253, the readability index was 32.740 and the average words per sentence were 2436.0. The most frequent words in the corpus were valuation (399), environmental (346), choice (106), analysis (76) and ecosystem (75). The trend of the keywords related to environmental valuation shows that the highest two keywords which were “valuation” and “environmental” had high statistical dispersion from the other top three keywords—choice, analysis and ecosystem—as seen in Figure 11. This graph shows the relative frequencies of the keywords, and their dispersion.

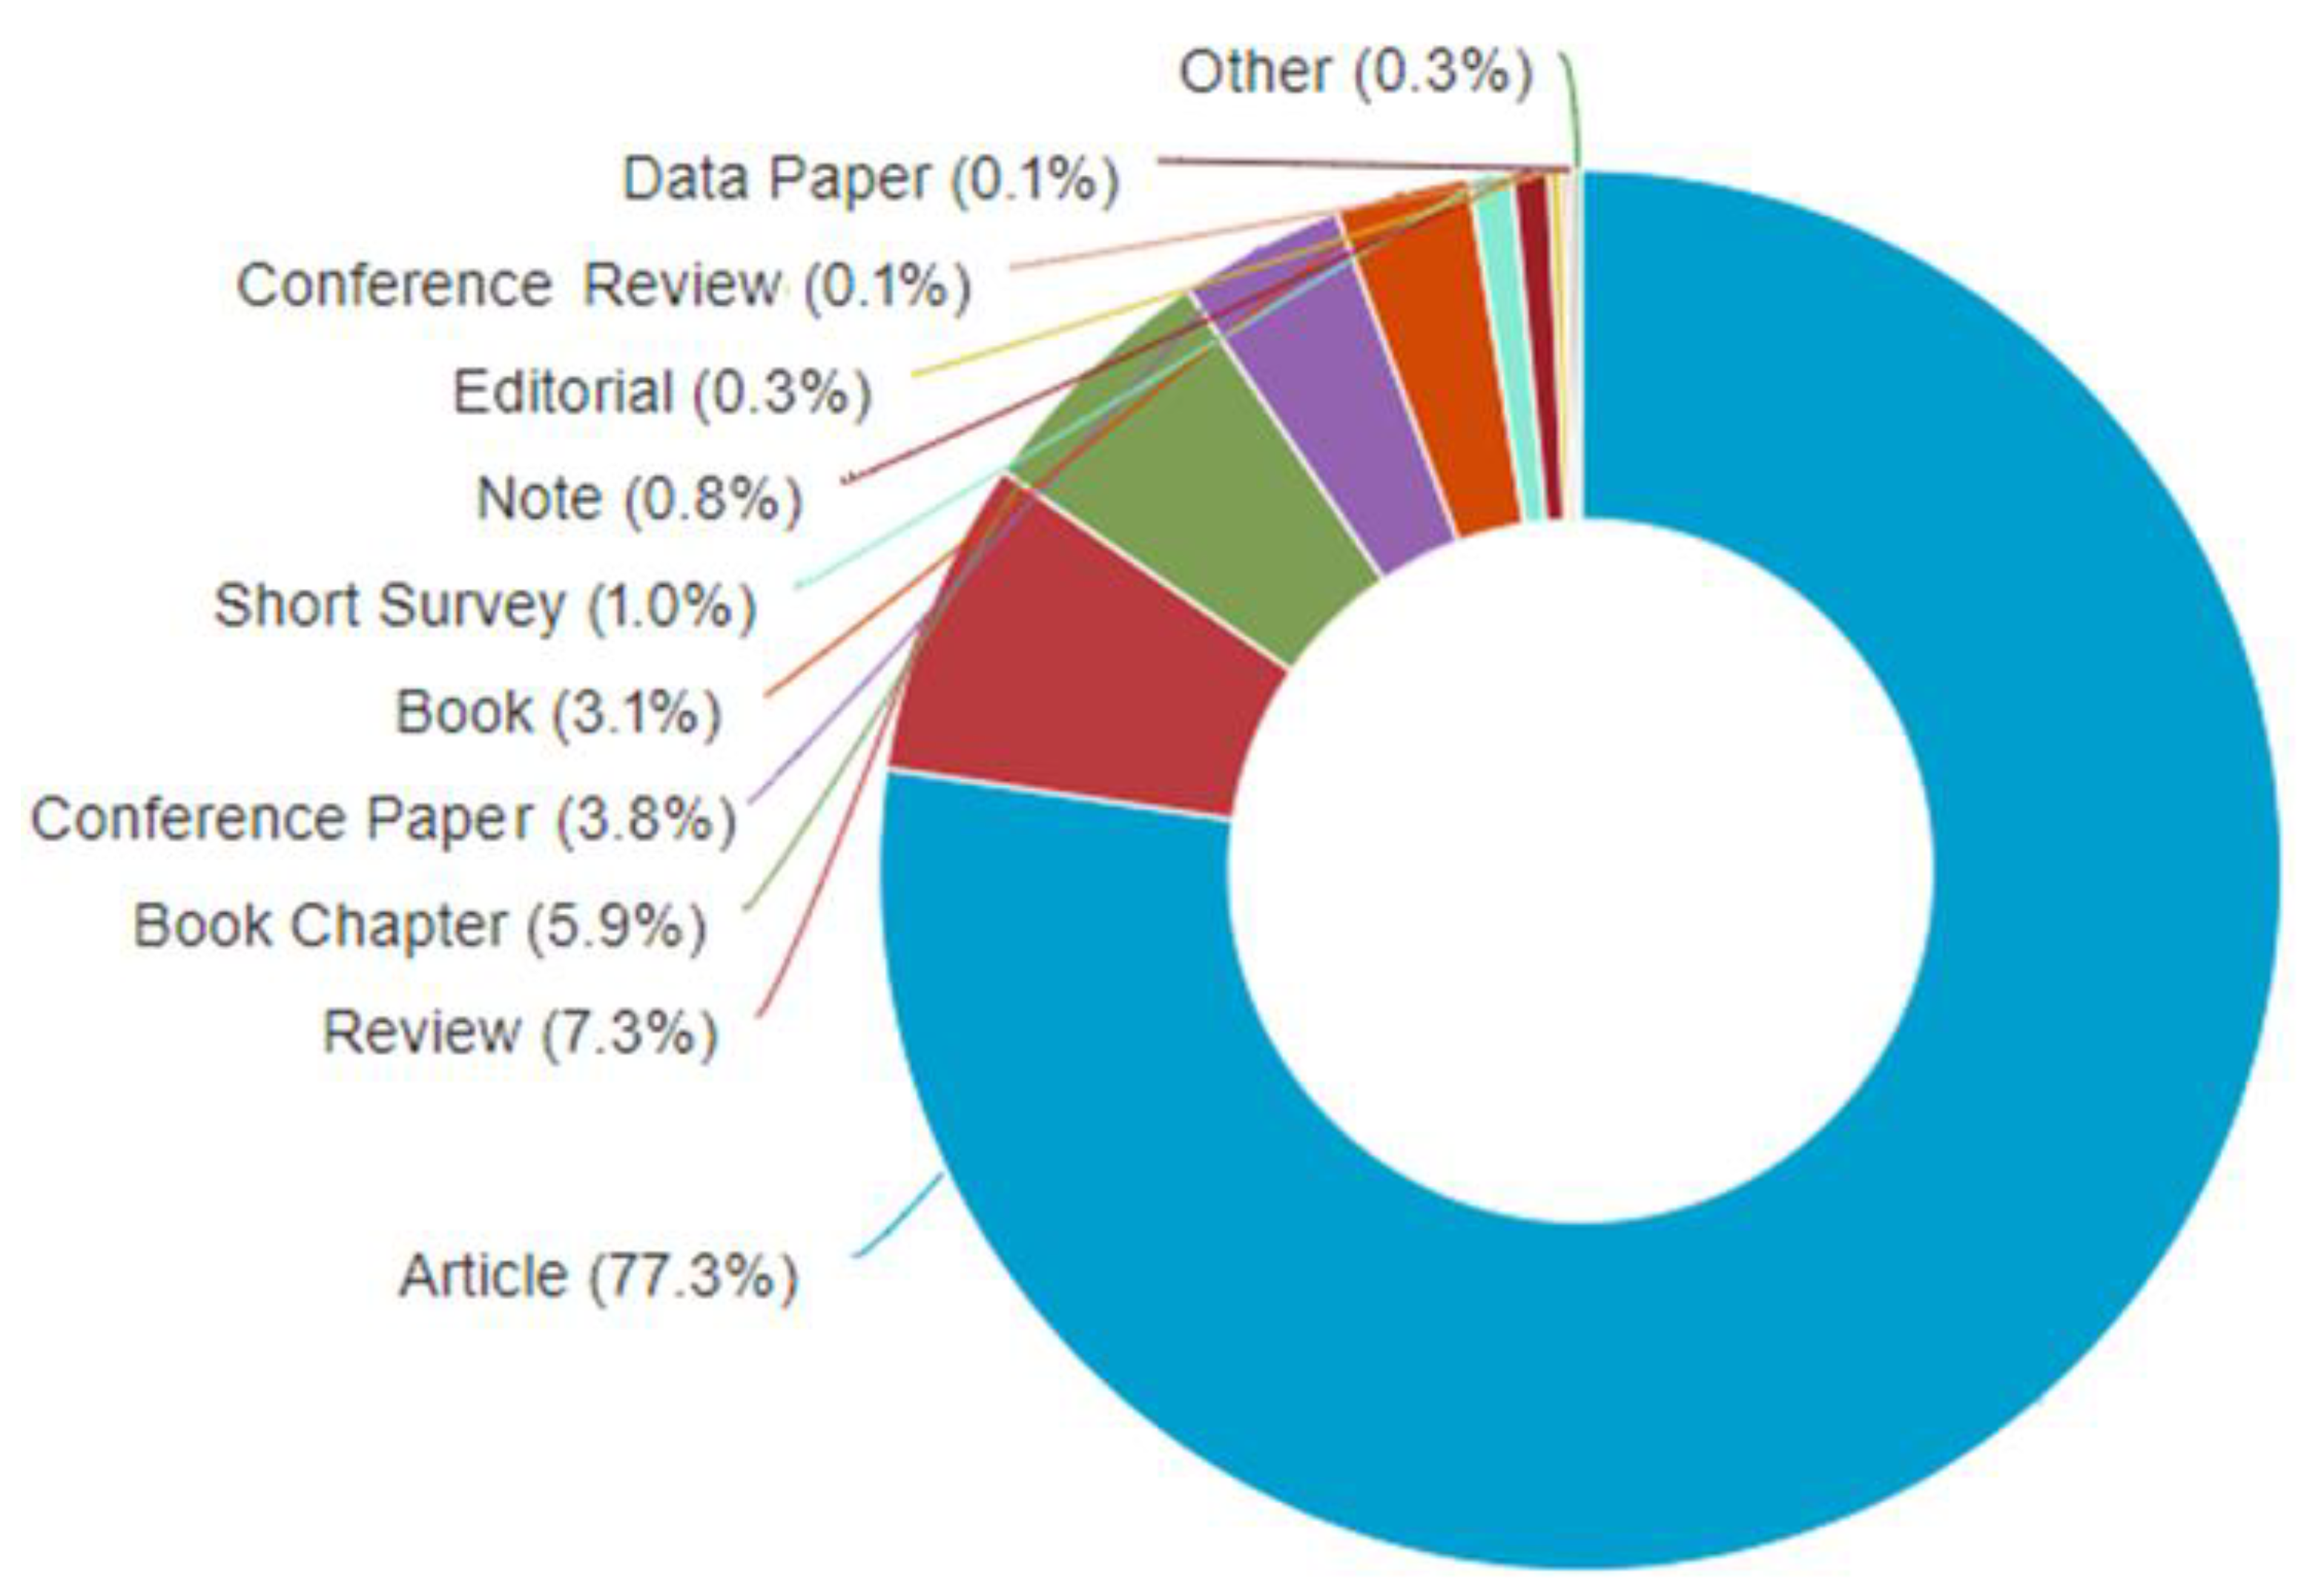
4.11. Analysis of Publication Types in Environmental Valuation Research

Another aspect of the study conducted was the analysis of publication types in environmental valuation research. Figure 12 shows that it was observed from Scopus data on “Environmental Valuation” that research articles were the highest (77.3%), which made up 549 out of 710 publications. This was followed by reviews with 52 publications (7.3%), followed by book chapters with 42 publications (5.9%), followed by conference papers with 27 publications (3.8%), followed by books with 22 publications (3.1%), followed by short surveys with 7 publications (1.0%), followed by notes with 6 publications (0.8%) and then followed by editorials with 2 publications (0.3%). The last set were conference reviews, reports and data papers, each having one publication (0.1%). This shows that there are different ways available to access information on environmental valuation research. It also shows that the publication documents are mostly journal articles (77.3%), which were over three quarters of the publication documents. This further reflects the high research in this field, with the publications also seen to have high impact in this area.

4.12. Analysis of Publications by Subject Area in Environmental Valuation Research

An analysis of the publications by subject area in environmental valuation research was also conducted. As seen in Table 6, it was observed from Scopus data on “Environmental Valuation” that Environmental Science was the highest (66.62%), with 473 out of 710 publications. This was followed by Economics, Econometrics and Finance with 282 publications (39.72%), followed by Social Sciences with 203 publications (28.59%), followed by Agricultural and Biological Sciences with 129 publications (18.17%), followed by Business, Management and Accounting with 61 publications (8.59%), followed by Engineering with 49 publications (6.90%), followed by Earth and Planetary Sciences with 36 publications (5.07%), followed by Arts and Humanities with 33 publications (4.65%), followed by Energy with 29 publications (4.08%), followed by Decision Sciences with 15 publications (2.11%), followed by Mathematics with 14 publications (1.97%). The rest are detailed in Table 6, showing that the research on environmental valuation cuts across different subject areas, but that the highest is Environmental Sciences.

4.13. Collaboration on Environmental Valuation Research between Industry and Academia

There is a need to understand the impact of funders and affiliations in this sector. One important finding of the research in this area is the funding support and collaboration of both industry and academia. An analysis of publication affiliations on environmental valuation research was also conducted. As seen in Figure 13, it was observed from Scopus data on “Environmental Valuation” that Norges Miljø og Biovitenskapelige Universitet was the highest with 21 publications. This was followed by the University of East Anglia which had 20 publications, followed by Vrije Universiteit Amsterdam which had 17 publications. The next set of affiliations were the University of Leeds, Universidad del Pais Vasco and Københavns Universitet which had 16 publications each. The rest of the affiliations in this field are shown in Figure 13.
This study also identified different funders that support the research on environmental valuation. Using the data retrieved from the Web of Science (WoS) database, UK Research Innovation (UKRI) had the highest funding support in this area, with 35 publication outputs. This was followed by the European Commission with 21 publication outputs, then Natural Environment Research Council (NERC) with 20 publication outputs, followed by Economic Social Research Council (ESRC) with 17 publication outputs, among others, as shown in the visualisation map in Figure 14. It shows different funders across different countries in this area. This gives an overview on the funding support that has been identified in EV research. This improves the comprehension of the key contributions of different technologies on environmental valuation from various sectors. It also shows that there are great impacts of legacy products, industry techniques and decisions that are made based on the availability of research funding in this area. Thus, the access to industry databases is necessary for making valuable choices and key decisions. Decisions must take into account enough scientific knowledge to predict the effects on the environment and society with a manageable level of uncertainty. In general, a persistent obstacle to data sharing can be a lack of trust amongst different stakeholders involved in the project. Building confidence and fostering working relationships, thus increasing human capital (or connections), can lead to the creation of dependable and beneficial data sharing agreements, so long as long-term communication is maintained through collaborations. These funders, as seen in Figure 14, encourage collaborations between industry and academia, which also improves the access to key findings and pertinent information.
Multi-stakeholder collaboration can offer the chance to produce open-source datasets in order to increase data transparency. Data gathering is a regular process that yields valuable information on environmental studies, but it is still difficult for outside parties and scientists to obtain environmental and contaminant data. This analysis shows that there is a lack of data openness with regard to the measures for environmental valuation connected to various infrastructures. A typical application in the energy sector is the environmental valuation of offshore oil and gas facilities during decommissioning [127,128,129,130]. Working together on different aspects of environmental valuation, such as marine engineering or ecological research, could present another way to inform stakeholders about new findings in the industry, such as marine growth on offshore platforms, the state of decommissioned platforms or how marine species interact with infrastructure. Collaboration between science and industry will solidify the bond between the two sectors and highlight the significance of environmental protection and risk assessment, spreading awareness of environmental science, and its significance will help the world’s knowledge grow regarding the potential consequences of contaminants on environmental valuation processes.
Partnerships between the private sector, the public sector and research organisations are encouraged in order to promote data transparency by removing obstacles that prevent effective communication and access to data. From this study, different methods have been identified that can be used in assessing environmental scenarios, such as the contingent valuation method. To broaden environmental policy frameworks, efforts should be made to strengthen coordination with national and international regulators, as well as operators (industry) and academic stakeholders (see refs. [131,132,133]). These partnerships ought to work to conduct reaction experiments to comprehend the cut-off points for tolerable degrees of environmental risk, such as for radiological examinations. These can be biological data inputs for multi-criteria decision-making processes that operators use to choose their preferred study sites, study samples and waste disposal techniques. These may be used to restore scale on the analyses, which gives the chance to conduct environmental valuation studies and makes it possible to comprehend any potential ecological and environmental effects related to the planned scenarios. Lastly, the different methods for environmental valuation could be tested in future research through collaborations.

5. Conclusions

In this paper, bibliometric and altmetric analysis was adopted to explore the research patterns and features in the literature on environmental valuation over the last three decades. The methodology for this study includes data obtained from Scopus. The data were checked to avoid duplicates, and to ensure that only English language publications were used; the publications were scrutinised to ensure that the content fitted into the scope. The data were analysed using the keyword co-occurrence network, cooperation network, topic dendrogram between categories, co-citation network and authorship publications, as well as mentions from altmetric analysis. The postprocessing for the visualisation mapping was conducted using VOSviewer, which was used to visualise the networks, structures and connections. The search from the Altmetric Explorer showed that there were 597 mentions on environmental valuation, with 167 outputs with attention mentions and 343 total research outputs tracked.
The main objective of this paper was to map the knowledge structure and features of the entirety of the environmental valuation research, exploring the research topics, hotspots and frontiers in the existing articles. It has been observed from this study that the discipline has been consolidated based on the development of environmental valuation publications during recent years. In recent years, choice-experiment-related papers have dominated academic publishing. It was found from the search of the Scopus database that the phrase “environmental valuation” first occurred in 1987. Since then, many studies have been published, leading to important advances in both theory and applications. In addition, the highest publication country was the United Kingdom (UK), which had 113 publications, followed by the United States of America (USA), which had 98 publications. However, there were other nations which also produced high, medium and low publication outputs. It was observed that the developed nations have the best developed methodologies regarding environmental valuation. It is noteworthy to state that the authors also identified three other scientometric studies on environmental valuation research [20,21,52] in current circulation, but the present paper is unique in been recent and the methodology applied presents new results. Thus, this implies that it makes more contribution to knowledge in this field as novelty is also presented in the use of almetric approach to measure the scientific impact of environmental valuation research.
Researchers working in the current stage of environmental valuation must contend with novel problems and developing patterns. Similarly to other study fields, environmental valuation procedures can be advanced by introducing machine learning techniques into the valuation process. This is achieved by building vast databases using the rising capacity to collect enormous amounts of data. This evolution should not, however, be limited to novel uses of tried-and-true valuation techniques. To address new valuation process components, researchers must create novel strategies. It is anticipated that academics will focus the most on proposing new methods for environmental valuation on climate change, one of the key concerns of the twenty-first century. The intangible elements must be expressly taken into account in the new valuation methodologies because knowledge and perception are arbitrary. In light of this, we may draw the conclusion that the future direction of environmental valuation is more likely to be determined by the inheritance and assimilation of consolidated procedures widely employed in other scientific fields than by the development of novel methodologies. Lastly, from this scientometric review, it is clear that there is a need for data transparency relating to the metrics for environmental valuation associated with different infrastructures. Future research can look into other types of representations aside from donuts for almetric score, like violin plots suggested in a recent study [106], could be looked into. Also, future work can consider the implementation of environmental valuation with building information modelling (BIM). Also, the data from environmental valuations can be trained using deep learning (DL) or machine learning (ML) for better understanding on its characteristics.

Supplementary Materials

The supplementary materials can be downloaded at the following link: https://data.mendeley.com/drafts/wcypffxzr4 which has the following citation: Amaechi, C.V.; Oyetunji, A.K.; Olukolajo, M.A. (2022), “Supplementary Data on Scientometrics of Environmental Valuation”, Mendeley Data, V1, doi: 10.17632/wcypffxzr4.1. The altmetric data are available at https://www.altmetric.com/explorer/outputs?filter=policy&q=Environmental%20Valuation%20&scope=all&title=Environmental%20Valuation%20 (accessed on 22 October 2022). The word cloud on Voyant Tools is available at https://voyant-tools.org/?corpus=9e00d4ce317b886450b78fc812d085c2 (accessed on 22 October 2022).

Author Contributions

Conceptualisation, M.A.O., A.K.O. and C.V.A.; methodology, M.A.O., A.K.O. and C.V.A.; software, M.A.O., A.K.O. and C.V.A.; validation, M.A.O., A.K.O. and C.V.A.; formal analysis, M.A.O., A.K.O. and C.V.A.; investigation, M.A.O., A.K.O. and C.V.A.; resources, M.A.O., A.K.O. and C.V.A.; data curation, M.A.O., A.K.O. and C.V.A.; writing—original draft preparation, M.A.O., A.K.O. and C.V.A.; writing—review and editing, M.A.O., A.K.O. and C.V.A.; visualisation, M.A.O., A.K.O. and C.V.A.; supervision, M.A.O., A.K.O. and C.V.A.; project administration, M.A.O., A.K.O. and C.V.A.; funding acquisition, M.A.O., A.K.O. and C.V.A. All authors have read and agreed to the published version of the manuscript.

Funding

This research also acknowledges the funding support of Lancaster University: Engineering Department Studentship Award; Niger Delta Development Commission (NG): NDDC Overseas Postgraduate Scholarship; Standards Organisation of Nigeria (NG): SON Study; Engineering and Physical Sciences Research Council (UK): EPSRC’s Doctoral Training Centre (DTC); Tertiary Education Trust Fund (NG): TETFUND. The financial support received for the doctoral research within which this study was carried out is highly appreciated.

Data Availability Statement

The data supporting the reported results can be found in the Supplementary Materials link.

Acknowledgments

The authors acknowledge Lancaster University Library for the support in providing access to Scopus database. The authors also acknowledge the feedback from the reviewers to improve the quality of this paper.

Conflicts of Interest

The authors declare no conflict of interest.

References

  1. Dixon, J.A. Environmental Valuation: Challenges and Practices. In Proceedings of the Economics and Conservation in the Tropics: A Strategic Dialogue, Washington DC, USA, 31 January–1 February 2008; Available online: https://www.conservation-strategy.org/sites/default/files/field-file/Tropics_Conference_Dixon_Environmenal_Valuation.pdf (accessed on 6 March 2023).
  2. Gong, M.; Aadland, D. Interview Effects in an Environmental Valuation Telephone Survey. Environ. Resour. Econ. 2010, 49, 47–64. [Google Scholar] [CrossRef]
  3. Balana, B.B.; Catacutan, D.; Mäkelä, M. Assessing the willingness to pay for reliable domestic water supply via catchment management: Results from a contingent valuation survey in Nairobi City, Kenya. J. Environ. Plan. Manag. 2013, 56, 1511–1531. [Google Scholar] [CrossRef]
  4. Ben Brahim-Neji, H.; Del Saz-Salazar, S.; Besrour, A.; González-Gómez, F. Estimating willingness to pay for desalinated seawater: The case of Djerba Island, Tunisia. Int. J. Water Resour. Dev. 2017, 35, 126–144. [Google Scholar] [CrossRef]
  5. Tesoriere, G.; Scuderi, R. Willingness to pay for water in secondary cities: Do poverty and negative experiences matter? Dev. Pract. 2022, 1–12. [Google Scholar] [CrossRef]
  6. Ali, M.A.S.; Khan, S.U.; Khan, A.; Khan, A.A.; Zhao, M. Ranking of ecosystem services on the basis of willingness to pay: Monetary assessment of a subset of ecosystem services in the Heihe River basin. Sci. Total Environ. 2022, 734, 139447. [Google Scholar] [CrossRef]
  7. Streimikiene, D.; Balezentis, T.; Alisauskaite-Seskiene, I.; Stankuniene, G.; Simanaviciene, Z. A Review of Willingness to Pay Studies for Climate Change Mitigation in the Energy Sector. Energies 2019, 12, 1481. [Google Scholar] [CrossRef] [Green Version]
  8. Retno, D.P.; Wibowo, M.A.; Hatmoko, J.U.D. The Scientometric Approach of Mapping Sustainable Green Infrastructure Research Developments. J. Phys. Conf. Ser. 2020, 1625, 1625. [Google Scholar] [CrossRef]
  9. Damigos, D. An overview of environmental valuation methods for the mining industry. J. Clean. Prod. 2006, 14, 234–247. [Google Scholar] [CrossRef]
  10. Munasinghe, P.C. Environmental Economics and Valuation in Development Decision Making; Environment Working Paper No. 51; The World Bank: Washington, DC, USA, 1992; Available online: https://documents1.worldbank.org/curated/en/478921493259967070/pdf/Environmental-economics-and-valuation-in-development-decision-making.pdf (accessed on 6 March 2023).
  11. Davos, C.A.; Thistlewaite, W.; Clark, C.A.; Sinsheimer, P.J. Public priorities for evaluating air quality management measures. J. Environ. Manag. 1991, 33, 205–221. [Google Scholar] [CrossRef]
  12. Davos, C.A.; Thistlewaite, W.A.; Paik, E.C. Air Quality Management: Participatory Ranking of Control Measures and Conflict Analysis. J. Environ. Manag. 1993, 37, 301–311. [Google Scholar] [CrossRef]
  13. Navrud, S.; Pruckner, G.J. Environmental Valuation—To Use or Not to Use? A Comparative Study of the United States and Europe. Environ. Resour. Econ. 1997, 10, 1–26. [Google Scholar] [CrossRef]
  14. Lian, G.; Xu, A.; Zhu, Y. Substantive green innovation or symbolic green innovation? The impact of ER on enterprise green innovation based on the dual moderating effects. J. Innov. Knowl. 2022, 7, 100203. [Google Scholar] [CrossRef]
  15. Wang, S.; Abbas, J.; Sial, M.S.; Álvarez-Otero, S.; Cioca, L.-I. Achieving green innovation and sustainable development goals through green knowledge management: Moderating role of organizational green culture. J. Innov. Knowl. 2022, 7, 100272. [Google Scholar] [CrossRef]
  16. Wang, S.; Li, J.; Du, P.; Zhao, E. A game theoretic technique for risk-based optimal bidding strategies in energy aggregators of markets: Knowledge management approach. J. Innov. Knowl. 2022, 7, 100279. [Google Scholar] [CrossRef]
  17. Yu, S.; Abbas, J.; Álvarez-Otero, S.; Cherian, J. Green knowledge management: Scale development and validation. J. Innov. Knowl. 2022, 7, 100244. [Google Scholar] [CrossRef]
  18. Liu, Y.; Ruiz-Menjivar, J.; Hu, Y.; Zavala, M.; Swisher, M.E. Knowledge Mapping of the Extant Literature on the Environmental Impacts of Using Cover Crops—A Scientometric Study. Environments 2022, 9, 120. [Google Scholar] [CrossRef]
  19. Wang, H.; Meijerink, S.; Van Der Krabben, E. Institutional Design and Performance of Markets for Watershed Ecosystem Services: A Systematic Literature Review. Sustainability 2020, 12, 6382. [Google Scholar] [CrossRef]
  20. Guijarro, F.; Tsinaslanidis, P. Analysis of Academic Literature on Environmental Valuation. Int. J. Environ. Res. Public Health 2020, 17, 2386. [Google Scholar] [CrossRef] [Green Version]
  21. Adamowicz, W.L. What’s it worth? An examination of historical trends and future directions in environmental valuation. Aust. J. Agric. Resour. Econ. 2004, 48, 419–443. [Google Scholar] [CrossRef]
  22. Bennett, J.W.; Pearce, D.W.; Turner, R.K. Economics of Natural Resources and the Environment. Am. J. Agric. Econ. 1991, 73, 227–228. [Google Scholar] [CrossRef]
  23. Kadykalo, A.N.; Kelly, L.A.; Berberi, A.; Reid, J.L.; Findlay, C.S. Research effort devoted to regulating and supporting ecosystem services by environmental scientists and economists. PLoS ONE 2021, 16, e0252463. [Google Scholar] [CrossRef] [PubMed]
  24. Spash, C.L.; Simpson, I.A. Protecting sites of special scientific interest: Intrinsic and utilitarian values. J. Environ. Manag. 1993, 39, 213–227. [Google Scholar] [CrossRef] [Green Version]
  25. CBD. The Convention on Biological Diversity: Year of Review 2007. Secretariat of the Convention on Biological Diversity, World Trade Centre, Quebec, Canada. 2007. Available online: https://www.cbd.int/doc/reports/cbd-report-2007-en.pdf (accessed on 6 March 2023).
  26. Mukoro, V.; Sharmina, M.; Gallego-Schmid, A. A framework for environmental evaluation of business models: A test case of solar energy in Kenya. Sustain. Prod. Consum. 2022, 34, 202–218. [Google Scholar] [CrossRef]
  27. Braig, P.; Edinger-Schons, L.M. From Purpose to Impact—An Investigation of the Application of Impact Measurement and Valuation Methods for Quantifying Environmental and Social Impacts of Businesses. Sustain. Prod. Consum. 2020, 23, 189–197. [Google Scholar] [CrossRef]
  28. Hervani, A.A.; Nandi, S.; Helms, M.M.; Sarkis, J. A performance measurement framework for socially sustainable and resilient supply chains using environmental goods valuation methods. Sustain. Prod. Consum. 2021, 30, 31–52. [Google Scholar] [CrossRef]
  29. Cao, Y.; Ehyaei, M. Energy, exergy, exergoenvironmental, and economic assessments of the multigeneration system powered by geothermal energy. J. Clean. Prod. 2021, 313, 127823. [Google Scholar] [CrossRef]
  30. Zhao, C.; Liu, M.; Wang, K. Monetary valuation of the environmental benefits of green building: A case study of China. J. Clean. Prod. 2022, 365, 132704. [Google Scholar] [CrossRef]
  31. Dixon, J.A.; Dixon, J.A.; Scura, L.; Carpenter, R.A.; Sherman, P. Economic Analysis of Environmental Impacts, 2nd ed.; Routledge: London, UK, 1994. [Google Scholar]
  32. Ruitenbeek, J.; Cartier, C. Issues in Applied Coral Reef Biodiversity Valuation: Results for Montego Bay, Jamaica; Research Committee Project Final Report; The World Bank: Washington, DC, USA, 1999. [Google Scholar]
  33. Emerton, L.; Bos, E. Value: Counting Ecosystems as Water Infrastructure; International Union for Conservation of Nature (IUCN): Gland, Switzerland, 2004; 88p, Available online: https://doi.org/10.2305/iucn.ch.2004.wani.3.en (accessed on 6 March 2023).
  34. Balana, B.B.; Muys, B.; Haregeweyn, N.; Descheemaeker, K.; Deckers, J.; Poesen, J.; Nyssen, J.; Mathijs, E. Cost-benefit analysis of soil and water conservation measure: The case of exclosures in northern Ethiopia. For. Policy Econ. 2011, 15, 27–36. [Google Scholar] [CrossRef] [Green Version]
  35. Kehrein, P.; Van Loosdrecht, M.; Osseweijer, P.; Garfí, M.; Dewulf, J.; Posada, J. A critical review of resource recovery from municipal wastewater treatment plants–market supply potentials, technologies and bottlenecks. Environ. Sci. Water Res. Technol. 2020, 6, 877–910. [Google Scholar] [CrossRef] [Green Version]
  36. Kritrom, B. Spike models in contingent valuation. Am. J. Agric. Econ. 1997, 79, 1013–1023. [Google Scholar] [CrossRef]
  37. Lee, C.-Y.; Heo, H. Estimating willingness to pay for renewable energy in South Korea using the contingent valuation method. Energy Policy 2016, 94, 150–156. [Google Scholar] [CrossRef]
  38. Noonan, D.S. Contingent Valuation and Cultural Resources: A Meta-Analytic Review of the Literature. J. Cult. Econ. 2003, 27, 159–176. [Google Scholar] [CrossRef] [Green Version]
  39. Knetsch, J.L. Environmental Valuation: Some Problems of Wrong Questions and Misleading Answers. Environ. Values 1994, 3, 351–368. [Google Scholar] [CrossRef]
  40. Kuntashula, E.; Mungatana, E. Estimating the causal effect of improved fallows on farmer welfare using robust identification strategies in Chongwe, Zambia. Agrofor. Syst. 2013, 87, 1229–1246. [Google Scholar] [CrossRef]
  41. Faccioli, M.; Czajkowski, M.; Glenk, K.; Martin-Ortega, J. Environmental attitudes and place identity as determinants of preferences for ecosystem services. Ecol. Econ. 2020, 174, 106600. [Google Scholar] [CrossRef]
  42. Hassan, S.; Olsen, S.B.; Afandi, S.H.M.; Thorsen, B.J. Environmental Attitudes on Setiu Wetlands, Malaysia. Asian J. Qual. Life 2018, 3, 59–69. [Google Scholar] [CrossRef] [Green Version]
  43. Peixer, J.; Giacomini, H.C.; Petrere, M., Jr. Economic valuation of the Emas waterfall, Mogi-Guaçu River, SP, Brazil. An. Acad. Bras. Ciênc. 2011, 83, 1287–1302. [Google Scholar] [CrossRef] [Green Version]
  44. Artell, J.; Ahtiainen, H.; Pouta, E. Subjective vs. objective measures in the valuation of water quality. J. Environ. Manag. 2013, 130, 288–296. [Google Scholar] [CrossRef]
  45. Mouter, N.; Koster, P.; Dekker, T. Participatory value evaluation for the evaluation of flood protection schemes. Water Resour. Econ. 2021, 36, 100188. [Google Scholar] [CrossRef]
  46. Zhao, J.; Chen, H.; Liang, Q.; Xia, X.; Xu, J.; Hoey, T.; Barrett, B.; Renaud, F.G.; Bosher, L.; Zhou, X. Large-scale flood risk assessment under different development strategies: The Luanhe River Basin in China. Sustain. Sci. 2021, 17, 1365–1384. [Google Scholar] [CrossRef]
  47. Nguyen, M.T.; Sebesvari, Z.; Souvignet, M.; Bachofer, F.; Braun, A.; Garschagen, M.; Schinkel, U.; Yang, L.E.; Nguyen, L.H.K.; Hochschild, V.; et al. Understanding and assessing flood risk in Vietnam: Current status, persisting gaps, and future directions. J. Flood Risk Manag. 2021, 14, e12689. [Google Scholar] [CrossRef]
  48. Chaikumbung, M.; Doucouliagos, H.; Scarborough, H. Institutions, culture, and wetland values. Ecol. Econ. 2018, 157, 195–204. [Google Scholar] [CrossRef] [Green Version]
  49. Senzaki, M.; Yamaura, Y.; Shoji, Y.; Kubo, T.; Nakamura, F. Citizens promote the conservation of flagship species more than ecosystem services in wetland restoration. Biol. Conserv. 2017, 214, 1–5. [Google Scholar] [CrossRef] [Green Version]
  50. Barbier, E.B.; Enchelmeyer, B.S. Valuing the storm surge protection service of US Gulf Coast wetlands. J. Environ. Econ. Policy 2014, 3, 167–185. [Google Scholar] [CrossRef]
  51. Hess, S.; Giergiczny, M. Intra-respondent heterogeneity in a stated choice survey on wetland conservation in Belarus: First steps towards creating a link with uncertainty in contingent valuation. Environ. Resour. Econ. 2015, 60, 327–347. [Google Scholar] [CrossRef] [Green Version]
  52. Getzner, M.; Islam, M.S. Ecosystem services of mangrove forests: Results of a meta- analysis of economic values. Int. J. Environ. Res. Public Health 2020, 17, 5830. [Google Scholar] [CrossRef]
  53. Getzner, M.; Meyerhoff, J.; Schläpfer, F. Willingness to pay for nature conservation policies in state-owned forests: An Austrian case study. Forests 2018, 9, 537. [Google Scholar] [CrossRef] [Green Version]
  54. Ojea, E.; Loureiro, M.L.; Allo, M.; Barrio, M. Ecosystem services and REDD: Estimating the benefits of non-carbon services in worldwide forests. World Dev. 2016, 78, 246–261. [Google Scholar] [CrossRef]
  55. Giovanis, E. Worthy to lose some money for better air quality: Applications of Bayesian networks on the causal effect of income and air pollution on life satisfaction in Switzerland. Empir. Econ. 2018, 57, 1579–1611. [Google Scholar] [CrossRef] [Green Version]
  56. Giovanis, E.; Ozdamar, O. The effects and costs of air pollution on health status in Great Britain. Int. J. Sustain. Econ. Manag. 2016, 5, 52–67. [Google Scholar] [CrossRef]
  57. Welsch, H. Environment and happiness: Valuation of air pollution using life satisfaction data. Ecol. Econ. 2006, 58, 801–813. [Google Scholar] [CrossRef]
  58. Bollyky, T.J.; Hulland, E.N.; Barber, R.M.; Collins, J.K.; Kiernan, S.; Moses, M.; Pigott, D.M.; Reiner, R.C., Jr.; Sorensen, R.J.D.; Abbafati, C.; et al. Pandemic preparedness and COVID-19: An exploratory analysis of infection and fatality rates, and contextual factors associated with preparedness in 177 countries, from Jan 1, 2020, to Sept 30, 2021. Lancet 2022, 399, 1489–1512. [Google Scholar] [CrossRef] [PubMed]
  59. Ouassou, H.; Kharchoufa, L.; Bouhrim, M.; Daoudi, N.E.; Imtara, H.; Bencheikh, N.; Elbouzidi, A.; Bnouham, M. The Pathogenesis of Coronavirus Disease 2019 (COVID-19): Evaluation and Prevention. J. Immunol. Res. 2020, 2020, 1357983. [Google Scholar] [CrossRef] [PubMed]
  60. Olukolajo, M.A.; Oyetunji, A.K.; Oluleye, I.B. COVID-19 protocols: Assessing construction site workers compliance. J. Eng. Des. Technol. 2021, 20, 115–131. [Google Scholar] [CrossRef]
  61. Amaechi, C.V.; Amaechi, E.C.; Amechi, S.C.; Oyetunji, A.K.; Kgosiemang, I.M.; Mgbeoji, O.J.; Ojo, A.S.; Abelenda, A.M.; Milad, M.; Adelusi, I.; et al. Management of Biohazards and Pandemics: COVID-19 and Its Implications in the Construction Sector. Comput. Water Energy Environ. Eng. 2022, 11, 34–63. [Google Scholar] [CrossRef]
  62. Bakke, T.; Klungsøyr, J.; Sanni, S. Environmental impacts of produced water and drilling waste discharges from the Norwegian offshore petroleum industry. Mar. Environ. Res. 2013, 92, 154–169. [Google Scholar] [CrossRef] [Green Version]
  63. Xie, J.; Zhu, M. What are the economic concerns on environment? Mapping the research trends and frontiers on air pollution and health. Econ. Res.-Ekon. Istraž. 2022, 35, 5070–5096. [Google Scholar] [CrossRef]
  64. He, K.; Zhang, J.; Wang, X.; Zeng, Y.; Zhang, L. A scientometric review of emerging trends and new developments in agricultural ecological compensation. Environ. Sci. Pollut. Res. 2018, 25, 16522–16532. [Google Scholar] [CrossRef]
  65. MacIntosh, A.; Dafforn, K.; Penrose, B.; Chariton, A.; Cresswell, T. Ecotoxicological effects of decommissioning offshore petroleum infrastructure: A systematic review. Crit. Rev. Environ. Sci. Technol. 2021, 52, 3283–3321. [Google Scholar] [CrossRef]
  66. Ahlroth, S.; Nilsson, M.; Finnveden, G.; Hjelm, O.; Hochschorner, E. Weighting and valuation in selected environmental systems analysis tools—Suggestions for further developments. J. Clean. Prod. 2011, 19, 145–156. [Google Scholar] [CrossRef]
  67. Bagstad, K.J.; Semmens, D.J.; Waage, S.; Winthrop, R. A comparative assessment of decision-support tools for ecosystem services quantification and valuation. Ecosyst. Serv. 2013, 5, 27–39. [Google Scholar] [CrossRef]
  68. Nalimov, V.V.; Mul’chenko, Z.M. Наукoметрия, Изучение развития Hауки как инфoрмациoннoгo прoцесса [Naukometriya, the Study of the Development of Science as an Information Process]; Nauka: Moscow, Russia, 1969. (In Russian) [Google Scholar]
  69. Tai, T.C.; Robinson, J.P. Enhancing climate change research with open science. Front. Environ. Sci. 2018, 6, 115. [Google Scholar] [CrossRef]
  70. Ma, T.; Hu, Q.; Wang, C.; Lv, J.; Mi, C.; Shi, R.; Wang, X.; Yang, Y.; Wu, W. Exploring the Relationship between Ecosystem Services under Different Socio-Economic Driving Degrees. Int. J. Environ. Res. Public Health 2022, 19, 16105. [Google Scholar] [CrossRef] [PubMed]
  71. Zhang, X.; Estoque, R.C.; Xie, H.; Murayama, Y.; Ranagalage, M. Bibliometric analysis of highly cited articles on ecosystem services. PLoS ONE 2019, 14, e0210707. [Google Scholar] [CrossRef] [PubMed]
  72. Xie, H.; Zhang, Y.; Choi, Y.; Li, F. A Scientometrics Review on Land Ecosystem Service Research. Sustainability 2020, 12, 2959. [Google Scholar] [CrossRef] [Green Version]
  73. Okolie, C.C.; Ogundeji, A.A. Effect of COVID-19 on agricultural production and food security: A scientometric analysis. Humanit. Soc. Sci. Commun. 2022, 9, 64. [Google Scholar] [CrossRef]
  74. Mongeon, P.; Paul-Hus, A. The journal coverage of Web of Science and Scopus: A comparative analysis. Scientometrics 2016, 106, 213–228. [Google Scholar] [CrossRef]
  75. Amaechi, C.V.; Amaechi, E.C.; Oyetunji, A.K.; Kgosiemang, I.M. Scientific Review and Annotated Bibliography of Teaching in Higher Education Academies on Online Learning: Adapting to the COVID-19 Pandemic. Sustainability 2022, 14, 120060. [Google Scholar] [CrossRef]
  76. Archambault, E.; Campbell, D.; Gingras, Y.; Larivière, V. Comparing bibliometric statistics obtained from the Web of Science and Scopus. J. Am. Soc. Inf. Sci. Technol. 2009, 60, 1320–1326. [Google Scholar] [CrossRef] [Green Version]
  77. Singh, V.K.; Singh, P.; Karmakar, M.; Leta, J.; Mayr, P. The journal coverage of Web of Science, Scopus and Dimensions: A comparative analysis. Scientometrics 2021, 126, 5113–5142. [Google Scholar] [CrossRef]
  78. Aghaei Chadegani, A.; Salehi, H.; Yunus, M.M.; Farhadi, H.; Fooladi, M.; Farhadi, M.; Ale Ebrahim, N. A comparison between two main academic literature collections: Web of science and scopus databases. Asian Soc. Sci. 2013, 9, 18–26. [Google Scholar] [CrossRef] [Green Version]
  79. Pranckutė, R. Web of Science (WoS) and Scopus: The Titans of Bibliographic Information in Today’s Academic World. Publications 2021, 9, 12. [Google Scholar] [CrossRef]
  80. Falagas, M.E.; Pitsouni, E.I.; Malietzis, G.; Pappas, G. Comparison of PubMed, Scopus, Web of Science, and Google Scholar: Strengths and weaknesses. FASEB J. 2007, 22, 338–342. [Google Scholar] [CrossRef]
  81. Zhong, B.; Wu, H.; Li, H.; Sepasgozar, S.; Luo, H.; He, L. A scientometric analysis and critical review of construction related ontology research. Autom. Constr. 2019, 101, 17–31. [Google Scholar] [CrossRef]
  82. Wuni, I.Y.; Shen, G.Q.; Osei-Kyei, R. Scientometric review of global research trends on green buildings in construction journals from 1992 to 2018. Energy Build. 2019, 190, 69–85. [Google Scholar] [CrossRef]
  83. van Eck, N.J.; Waltman, L. Software survey: VOSviewer, a computer program for bibliometric mapping. Scientometrics 2010, 84, 523–538. [Google Scholar] [CrossRef] [Green Version]
  84. van Eck, N.J.; Waltman, L. Citation-based clustering of publications using CitNetExplorer and VOSviewer. Scientometrics 2017, 111, 1053–1070. [Google Scholar] [CrossRef] [Green Version]
  85. Altmetric. The Donut and Altmetric Attention Score. An At-A-Glance Indicator of the Volume and Type of Attention a Research Output Has Received. 2015. Available online: https://www.altmetric.com/about-our-data/the-donut-and-score/ (accessed on 7 March 2023).
  86. Altmetric. Almetric for Publishers. 2021. Available online: https://www.altmetric.com/products/explorer-for-publishers/ (accessed on 6 March 2023).
  87. Almetric. Almetric Explorer Login Page. 2022. Available online: https://www.altmetric.com/explorer/login (accessed on 6 March 2023).
  88. Regan, A.; Henchion, M. Making sense of altmetrics: The perceived threats and opportunities for academic identity. Sci. Public Policy 2019, 46, 479–489. [Google Scholar] [CrossRef]
  89. Robinson-Garcia, N.; van Leeuwen, T.N.; Ràfols, I. Using altmetrics for contextualised mapping of societal impact: From hits to networks. Sci. Public Policy 2018, 45, 815–826. [Google Scholar] [CrossRef]
  90. Christian, K.; Adie, E.; Derrick, G.; Didegah, F.; Groth, P.; Neylon, C.; Priem, J.; Xu, S.; Zahedi, Z.; Theng, Y.L.; et al. The State of Altmetrics: A Tenth Anniversary Celebration; Almetrics: London, UK, 2020; Available online: https://www.altmetric.com/about-altmetrics/the-state-of-altmetrics/ (accessed on 6 March 2023).
  91. von Lee, S. Altmetrics and Open Access Comparison of Altmetric Scores of Open and Closed Access Articles Published by German Research Institutions in the Field of Natural Sciences. Humboldt Universitaet zu Berlin (Germany), ProQuest Dissertations Publishing. 2019. Available online: https://edoc.hu-berlin.de/bitstream/handle/18452/21498/BHR-444-Satzinger.pdf?sequence=1 (accessed on 6 March 2023).
  92. Taylor, M. Slow, slow, quick, quick, slow: Five altmetric sources observed over a decade show evolving trends, by research age, attention source maturity and open access status. Scientometrics 2023, 1–26, ahead-of-print version. [Google Scholar] [CrossRef]
  93. Taylor, M. An altmetric attention advantage for open access books in the humanities and social sciences. Scientometrics 2020, 125, 2523–2543. [Google Scholar] [CrossRef]
  94. Fang, Z.; Costas, R. Studying the accumulation velocity of altmetric data tracked by Altmetric.com. Scientometrics 2020, 123, 1077–1101. [Google Scholar] [CrossRef] [Green Version]
  95. Bornmann, L. Do altmetrics point to the broader impact of research? An overview of benefits and disadvantages of altmetrics. J. Inf. 2014, 8, 895–903. [Google Scholar] [CrossRef] [Green Version]
  96. Bornmann, L.; Haunschild, R. To what extent does the Leiden manifesto also apply to altmetrics? A discussion of the manifesto against the background of research into altmetrics. Online Inf. Rev. 2016, 40, 529–543. [Google Scholar] [CrossRef]
  97. Bornmann, L. Alternative metrics in scientometrics: A meta-analysis of research into three altmetrics. Scientometrics 2015, 103, 1123–1144. [Google Scholar] [CrossRef] [Green Version]
  98. Bornmann, L. Usefulness of altmetrics for measuring the broader impact of research: A case study using data from PLOS and F1000Prime. Aslib J. Inf. Manag. 2015, 67, 305–319. [Google Scholar] [CrossRef]
  99. Bornmann, L.; Haunschild, R. Alternative article-level metrics: The use of alternative metrics in research evaluation. EMBO Rep. 2018, 19, e47260. [Google Scholar] [CrossRef]
  100. Bornmann, L.; Haunschild, R. Do altmetrics correlate with the quality of papers? A large-scale empirical study based on F1000Prime data. PLoS ONE 2018, 13, e0197133. [Google Scholar] [CrossRef] [Green Version]
  101. Holmberg, K.; Hedman, J.; Bowman, T.D.; Didegah, F.; Laakso, M. Do articles in open access journals have more frequent altmetric activity than articles in subscription-based journals? An investigation of the research output of Finnish universities. Scientometrics 2019, 122, 645–659. [Google Scholar] [CrossRef] [Green Version]
  102. Michelle, H. Altmetric Explorer: How It Can Help You Track the Attention your Work Creates; Lancaster University: Lancaster, UK, 2021; Available online: https://www.lancaster.ac.uk/library/whats-on/altmetric-explorer-how-it-can-help-you-track-the-attention-your-work-creates-2021-07-14-14-00 (accessed on 6 March 2023).
  103. Lancaster University. Institutional Launch of Altmetric Explorer; Lancaster University: Lancaster, UK, 2021; Available online: https://portal.lancaster.ac.uk/portal/news/article/institutional-launch-of-altmetric-explorer (accessed on 6 March 2023).
  104. Almetric. What Does Almetric Do? Almetric Web. 2023. Available online: https://www.altmetric.com/ (accessed on 6 March 2023).
  105. Bornmann, L. What is societal impact of research and how can it be assessed? A literature survey. J. Am. Soc. Inf. Sci. Technol. 2012, 64, 217–233. [Google Scholar] [CrossRef]
  106. Verma, M.K.; Yuvaraj, M. Measuring the online attention to business research papers: An altmetric study of selected journals with high impact factor. J. Bus. Financ. Libr. 2022, 27, 268–282. [Google Scholar] [CrossRef]
  107. Shema, H.; Bar-Ilan, J.; Thelwall, M. Do blog citations correlate with a higher number of future citations? Research blogs as a potential source for alternative metrics. J. Assoc. Inf. Sci. Technol. 2014, 65, 1018–1027. [Google Scholar] [CrossRef]
  108. Thelwall, M. Web impact factors and search engine coverage. J. Doc. 2000, 56, 185–189. [Google Scholar] [CrossRef] [Green Version]
  109. Thelwall, M. Interpreting correlations between citation counts and other indicators. Scientometrics 2016, 108, 337–347. [Google Scholar] [CrossRef] [Green Version]
  110. Thelwall, M. Three practical field normalised alternative indicator formulae for research evaluation. J. Inf. 2017, 11, 128–151. [Google Scholar] [CrossRef]
  111. Zahedi, Z.; Costas, R.; Wouters, P. How well developed are altmetrics? A cross-disciplinary analysis of the presence of ‘alternative metrics’ in scientific publications. Scientometrics 2014, 101, 1491–1513. [Google Scholar] [CrossRef] [Green Version]
  112. Sugimoto, C.R.; Work, S.; Larivière, V.; Haustein, S. Scholarly use of social media and altmetrics: A review of the literature. J. Assoc. Inf. Sci. Technol. 2017, 68, 2037–2062. [Google Scholar] [CrossRef] [Green Version]
  113. Thelwall, M.; Haustein, S.; Larivière, V.; Sugimoto, C.R. Do Altmetrics Work? Twitter and Ten Other Social Web Services. PLoS ONE 2013, 8, e64841. [Google Scholar] [CrossRef] [Green Version]
  114. Williams, K. What counts: Making sense of metrics of research value. Sci. Public Policy 2022, 49, 518–531. [Google Scholar] [CrossRef]
  115. Davos, C.A. Group Environmental Valuation: Suitability of Single Interest Approaches. J. Environ. Manag. 1987, 5, 97–111. [Google Scholar]
  116. Ellis, G.M.; Fisher, A.C. Valuing the environment as input. J. Environ. Manag. 1987, 25, 149–156. [Google Scholar]
  117. Huang, S.-L.; Odum, H.T. Ecology and economy: Emergy synthesis and public policy in Taiwan. J. Environ. Manag. 1991, 32, 313–333. [Google Scholar] [CrossRef]
  118. Heady, C. Values for the environment: A guide to economic appraisal. Long Range Plan. 1992, 25, 129. [Google Scholar] [CrossRef]
  119. Sawe, N.; Knutson, B. Neural valuation of environmental resources. NeuroImage 2015, 122, 87–95. [Google Scholar] [CrossRef] [PubMed] [Green Version]
  120. haw, M.W.; Grab, D.A.; Livermore, M.A.; Vossler, C.A.; Glimcher, P.W. The Measurement of Subjective Value and Its Relation to Contingent Valuation and Environmental Public Goods. PLoS ONE 2015, 10, e0132842. [Google Scholar] [CrossRef] [Green Version]
  121. Fabre, E.; Lopes, C.B.; Vale, C.; Pereira, E.; Silva, C.M. Valuation of banana peels as an effective biosorbent for mercury removal under low environmental concentrations. Sci. Total Environ. 2019, 709, 135883. [Google Scholar] [CrossRef]
  122. Mariel, P.; Hoyos, D.; Meyerhoff, J.; Czajkowski, M.; Dekker, T.; Glenk, K.; Jacobsen, J.B.; Liebe, U.; Olsen, S.B.; Sagebiel, J.; et al. Environmental Valuation with Discrete Choice Experiments: Guidance on Design, Implementation and Data Analysis; Springer Nature: Berlin/Heidelberg, Germany, 2021; p. 129. [Google Scholar] [CrossRef]
  123. Boxall, P.C.; Adamowicz, W.L.; Swait, J.; Williams, M.; Louviere, J. A comparison of stated preference methods for environmental valuation. Ecol. Econ. 1996, 18, 243–253. [Google Scholar] [CrossRef]
  124. Navrud, S.; Mungatana, E. Environmental valuation in developing countries: The recreational value of wildlife viewing. Ecol. Econ. 1994, 11, 135–151. [Google Scholar] [CrossRef]
  125. Wangai, P.W.; Burkhard, B.; Müller, F. A review of studies on ecosystem services in Africa. Int. J. Sustain. Built Environ. 2016, 5, 225–245. [Google Scholar] [CrossRef] [Green Version]
  126. Tariq, S.; Hu, Z.; Zayed, T. Micro-electromechanical systems-based technologies for leak detection and localization in water supply networks: A bibliometric and systematic review. J. Clean. Prod. 2021, 289, 125751. [Google Scholar] [CrossRef]
  127. Fam, M.; Konovessis, D.; Ong, L.; Tan, H. A review of offshore decommissioning regulations in five countries—Strengths and weaknesses. Ocean Eng. 2018, 160, 244–263. [Google Scholar] [CrossRef]
  128. Claisse, J.T.; Ii, D.J.P.; Love, M.; Zahn, L.A.; Williams, C.M.; Bull, A.S. Impacts from Partial Removal of Decommissioned Oil and Gas Platforms on Fish Biomass and Production on the Remaining Platform Structure and Surrounding Shell Mounds. PLoS ONE 2015, 10, e0135812. [Google Scholar] [CrossRef]
  129. Birchenough, S.N.R.; Degraer, S. Science in support of ecologically sound decommissioning strategies for offshore man-made structures: Taking stock of current knowledge and considering future challenges. ICES J. Mar. Sci. 2020, 77, 1075–1078. [Google Scholar] [CrossRef] [Green Version]
  130. Murray, F.; Needham, K.; Gormley, K.; Rouse, S.; Coolen, J.W.; Billett, D.; Dannheim, J.; Birchenough, S.N.; Hyder, K.; Heard, R.; et al. Data challenges and opportunities for environmental management of North Sea oil and gas decommissioning in an era of blue growth. Mar. Policy 2018, 97, 130–138. [Google Scholar] [CrossRef]
  131. Aznar, J.; Guijarro, F.; Moreno-Jiménez, J.M. Mixed valuation methods: A combined AHP-GP procedure for individual and group multicriteria agricultural valuation. Ann. Oper. Res. 2009, 190, 221–238. [Google Scholar] [CrossRef]
  132. Niemeyer, S.; Spash, C.L. Environmental Valuation Analysis, Public Deliberation, and their Pragmatic Syntheses: A Critical Appraisal. Environ. Plan. C Gov. Policy 2001, 19, 567–585. [Google Scholar] [CrossRef] [Green Version]
  133. Nyborg, K. Project analysis as input to public debate: Environmental valuation versus physical unit indicators. Ecol. Econ. 2000, 34, 393–408. [Google Scholar] [CrossRef]
Figure 1. Categories of commonly used ecosystem valuation methods. The data was adapted, and revised as intended. It was obtained with permission from a public domain publication. Publisher: IUCN, Copyright year: 2004, Source: Emerton and Bos [33].
Environments 10 00058 g001
Figure 2. Trends of environmental valuation publications between 1987 and 2021.
Environments 10 00058 g002
Figure 3. Distribution in altmetric attention scores related to environmental valuation research.
Environments 10 00058 g003
Figure 4. (ad) Publication donuts showing the altmetric scores based on mentions, citations and readers for top 4 publications on environmental valuation.
Environments 10 00058 g004
Figure 5. Document per year by source.
Environments 10 00058 g005
Figure 6. Demographics of environmental valuation research from the Altmetric Explorer: (a) Twitter, (b) Facebook, (c) news stories, (d) policy.
Environments 10 00058 g006aEnvironments 10 00058 g006b
Figure 7. Map showing countries and citation records for environmental valuation publications. (Colours used only help to visualise and do not depict figures.).
Environments 10 00058 g007
Figure 8. Most productive countries in environmental valuation research developed using VOSviewer, showing (a) the density visualization and (b) mapped network visualization.
Environments 10 00058 g008
Figure 9. Keyword co-occurrence network visualisation map.
Environments 10 00058 g009
Figure 10. The word cloud of the author keywords related to environmental valuation using Voyant Tools.
Environments 10 00058 g010
Figure 11. The trend and relative frequencies plot for the top five keywords related to the research on environmental valuation, namely: valuation, environmental, ecosystem, choice and analysis, as obtained using Voyant Tools.
Environments 10 00058 g011
Figure 12. The pie chart for the research on environmental valuation.
Environments 10 00058 g012
Figure 13. The top affiliations for the research on environmental valuation (data retrieved from Scopus database on 22 October 2022).
Environments 10 00058 g013
Figure 14. The visualisation tree map of the top 10 funders for the research on environmental valuation (data retrieved from WoS database on 22 October 2022).
Environments 10 00058 g014
Table 1. The top 3 pieces of Altmetric data showing affiliations, journals and collections and subject areas in “Environmental Valuation”.
AffiliationsPercentageOutputsMentions
University of Leeds15%394
Lancaster University11%369
University of the Basque Country10%461
Journals and collectionsPercentageOutputsMentions
Ecological Economics10%2365
People and Nature8%248
Environmental and Resource Economics5%935
Subject areasPercentageOutputsMentions
Economics59%99356
Applied Economics57%95343
Environmental Sciences13%3482
Table 2. List of journals and collections from Altmetric on environmental valuation research.
Journal TitleNumber of Mentions
OutputsTotalNewsBlogPolicyPatentTwitterPeer
Review
WeiboFacebookWikipedia
Ecological Economics236502150331095
Environmental and Resource Economics93500190150001
Journal of Environmental Management510101070001
Land Economics49006030000
Australian Journal of Agric. and Resource Economics415033070020
Journal of Agricultural Economics35004010000
Environmental Values37002050000
Journal of Environmental Economics and Mgt36015000000
Sustainability3130010110010
Science of the Total Environment310402010030
Journal of Economic Surveys24001010002
Environment and Planning C: Govt and Policy27006000001
Forest Policy and Economics26000060000
Journal of Economic Psychology23002000001
Environmental Science and Technology29124010000
Canadian Journal of Agricultural Economics24001030000
Impact Assessment and Project Appraisal22002000000
Ecosystem Services24000040000
American Journal of Agricultural Economics23012000000
Journal of Cleaner Production210001090000
People and Nature2480000480000
PLOS ONE1161200110002
Applied Economic Perspectives and Policy1130000130000
Japanese Economic Review12000000002
Table 3. Citations and strength of journal publications on environmental valuation research.
Research OutletTotal
Citations
Average
Citations
Total Link
Strength
Rank of No.
of Articles
Ecological Economics5878671101
Environmental and Resource Economics223966472
Journal of Environmental Management82941183
Environmental Values47632264
Journal of Environmental Planning and Management1371535
Journal of Environmental Economics and Policy63856
Science of the Total Environment14118116
Australian Journal of Agricultural and Resource Economics25336118
Ecosystem Services33748178
International Journal of Environment and Pollution46768
Forest Policy and Economics10317311
Journal of Environmental Economics and Management7391232111
Land Use Policy13422811
Resource and Energy Economics72121111
Sustainability (Switzerland)6811311
Wit Transactions on Ecology and the Environment71011
Environmental Science and Policy17936117
Global Environmental Change17535617
American Journal of Agricultural Economics23659519
Environment and Planning C: Government and Policy158401920
Environment, Development and Sustainability318320
Environmental Conservation5113320
Int’l Journal of Sustainable Development and World Ecology9023320
Journal of Economic Surveys8702183020
Journal of Forest Economics7920120
Tourism62120
Table 4. Publication by authors and citation records.
AuthorDocumentsDocument RankCitationsCitation RankTotal Link Strength
Hanley N.131144810
Mariel P.112196169
Navrud S.9335590
Meyerhoff J.93198156
Thorsen B.J.931961614
Ahtiainen H.86132224
Spash C.L.7746270
Börger T.77237123
Jacobsen J.B.771652013
Brouwer R.61059160
Gowdy J.M.511255110
Rolfe J.511236131
Hoyos D.511161216
Lundhede T.H.5111322211
Artell J.51198254
O’connor M.51190270
Adamowicz W.L.417128522
Louviere J.41788135
Swait J.41781143
Welsch H.41772950
Scarpa R.41745881
Austen M.C.417348103
Moran D.417199140
Ferreira S.417193180
Glenk K.417172191
Rehdanz K.417115240
Olsen S.B.41798258
Hagihara K.4173280
Table 5. Keyword co-occurrences in environmental valuation research.
KeywordOccurrencesTotal Link Strength
Environmental Valuation255152
Contingent Valuation54158
Willingness To Pay4659
Choice Experiment4549
Ecosystem Services4144
Cost–Benefit Analysis2525
Stated Preferences2434
Benefit Transfer1516
Choice Modelling1318
Non-Market Valuation1213
Biodiversity1017
Valuation107
Table 6. Publications by subject area on environmental valuation research.
Subject AreaPublicationsPercentage (%)
Environmental Science47366.62
Economics, Econometrics and Finance28239.72
Social Sciences20328.59
Agricultural and Biological Sciences12918.17
Business, Management and Accounting618.59
Engineering496.90
Earth and Planetary Sciences365.07
Arts and Humanities334.65
Energy294.08
Decision Sciences152.11
Mathematics141.97
Chemical Engineering121.69
Medicine91.27
Multidisciplinary70.99
Biochemistry, Genetics and Molecular Biology50.70
Computer Science50.70
Materials Science50.70
Chemistry40.56
Physics and Astronomy40.56
Neuroscience30.42
Psychology30.42
Veterinary30.42
Health Professions10.14
Nursing10.14
Disclaimer/Publisher’s Note: The statements, opinions and data contained in all publications are solely those of the individual author(s) and contributor(s) and not of MDPI and/or the editor(s). MDPI and/or the editor(s) disclaim responsibility for any injury to people or property resulting from any ideas, methods, instructions or products referred to in the content.

