Article

Modeling and Optimization of Hexavalent Chromium Adsorption by Activated Eucalyptus Biochar Using Response Surface Methodology and Adaptive Neuro-Fuzzy Inference System

by
Adeyinka Sikiru Yusuff
1,*,
Niyi Babatunde Ishola
2,
Afeez Olayinka Gbadamosi
3 and
Emmanuel I. Epelle
4,*
1
Department of Chemical and Petroleum Engineering, College of Engineering, Afe Babalola University, Ado-Ekiti 360101, Nigeria
2
Department of Chemical Engineering, Faculty of Technology, Obafemi Awolowo University, Ile-Ife 220101, Nigeria
3
Department of Petroleum Engineering, College of Petroleum and Geosciences, King Fahd University of Petroleum and Minerals, Dhahran 31261, Saudi Arabia
4
School of Computing, Engineering & Physical Sciences, University of the West of Scotland, Paisley PA1 2BE, UK
*
Authors to whom correspondence should be addressed.
Environments 2023, 10(3), 55; https://doi.org/10.3390/environments10030055
Submission received: 23 January 2023 / Revised: 6 March 2023 / Accepted: 14 March 2023 / Published: 17 March 2023
(This article belongs to the Special Issue Emerging Technologies for Advanced Water Purification II)

Abstract

:
Due to its excellent textural features, non-toxicity, low cost and high uptake capacity, biochar has been synthesized from various biomasses and utilized as a biosorbent to remove hexavalent chromium (Cr6+) from contaminated water. Herein, activated eucalyptus biochar (AEB) was prepared via a pyrolysis-chemical activation process and then used as a less expensive biosorbent to adsorb Cr6+ ions from an aqueous solution. Proximate, ultimate, Fourier transform infrared (FTIR) spectroscopy, scanning electron microscopy (SEM), and Brunauer–Emmett–Teller (BET) analyses were employed in appraising the biosorbent characteristics. Furthermore, response surface methodology (RSM) and adaptive neuro-fuzzy inference system (ANFIS) were applied to establish the best operating conditions. Based on the results obtained, there was little discrepancy between the observed data and the data predicted by RSM and ANFIS approaches. In terms of prediction accuracy, ANFIS (MAE = 2.512 and  R 2 = 0.9200 ) was superior to RSM (MAE = 2.512 and  R 2 = 0.9002 ). Under best-optimized conditions (initial Cr6+ concentration = 38.14 mg/L, biosorbent dosage = 1.33 g/L and pH = 4.35), which were offered by the ANFIS–ACO technique, the maximum percentage removal of 99.92  ±  0.18% was achieved. The AEB performed exceptionally well due to its better textural characteristics, well-developed porous framework, and dominance of active surface functional groups, which were confirmed by BET, SEM, and FTIR analyses. The comparison of RSM, ACO and GA for process parameter optimization has not been reported in the open literature for Cr6+ adsorption by AEB and hence has been shown in this study.

1. Introduction

Recently, indiscriminate discharge of wastewater has enhanced the contamination of water resources, posing a serious problem to humans and the environment [1]. Generally, wastewater often contains heavy metal ions such as lead, copper, zinc, cadmium, and aluminum, manganese, to mention a few [2,3]. Chromium compounds, which can penetrate water bodies through wastewater being disposed of by electroplating, tanning, and textile industries, are highly toxic [4,5]. In a diluted solution, chromium occurs in two forms, namely, Cr3+ and Cr6+. The former has medical benefits, while the latter is more toxic because it is highly soluble in water [6]. Based on the World Health Organization standard, the concentration of Cr6+ ions must not exceed 0.05 mg/L, whereas the acceptable Cr6+ level in surface water is 0.1 mg/L. Thus, there is a need for industries to treat their wastewater to reduce Cr6+ to permissible levels before disposing to the environment [1].
Removal of Cr6+ ions from effluent can be achieved either by coagulation, reverse osmosis, photocatalysis, solvent extraction or adsorption [7,8]. Out of these treatment methods, adsorption is commonly employed owing to its simplicity, high efficiency and easy operational conditions [9]. Recently, the adsorptive removal of Cr6+ from an aqueous environment by biomass-based adsorbents, such as Eichhornia crassipes [10], chicken bone [11], Fox nutshell [12], Leucaena leucocephala seed pod [13], and agro-waste [14], has been reported. Among the waste and biomasses used as sources of adsorbents for heavy metal ions removal from effluent, eucalyptus tree bark has hemicellulose, lignocellulose, and carbonaceous material, which can offer double benefits of minimization of waste and synthesis of a biosorbent with low cost than commercially made sorbents [5,15].
For a cost-effective adsorption process, it is necessary to model and optimize the pertinent process parameters involved. Utilization of one variable at a time (OVAT) to study a multivariable system is not suitable because it is cumbersome and error-prone. Therefore, employing predictive modeling tools such as response surface methodology (RSM) and artificial intelligence techniques, including artificial neural network (ANN) or adaptive neuro-fuzzy inference system (ANFIS), would overcome all the downsides of OVAT. To improve and execute the process model, the RSM effectively combines statistical and mathematical methodologies [16,17,18]. It may be used to assess the magnitude of the effects of several variables and their interactions, even in the presence of very complicated interactions [19]. However, RSM can only be employed to approximate quadratic functions and hence cannot capture the nonlinear behavior of multivariate systems. Hence, a more robust and reliable modeling technique such as ANFIS is necessary to handle the complexity and nonlinearity behavior of bioprocess systems.
The ANFIS method, developed by Jang [20], combines the skills of a fuzzy inference system and an adaptable neural network (FIS). These are neural networks’ simple learning processes, computational power, and fuzzy systems’ capacity to explain uncertainty [21]. Albeit ANFIS has been used to model many chemical processes, it has seldom been used to model the adsorption process. Several reports exist on the utilization of RSM [5,22,23,24,25], RSM, and ANN [26,27,28,29,30] for the modeling and improvement of several biosorption and adsorption procedures used to remove heavy metals. These reports also provided a comparative evaluation of these modeling techniques in which the ANN technique often outperformed the RSM technique in predictive capability. While ANFIS has been singly used to model some adsorption processes [31,32] and has also been compared with ANN [33], information on the use of RSM and ANFIS to simulate the adsorption process for the removal of heavy metals like hexavalent chromium remains elusive.
Optimization of the pertinent process parameters is the critical stage after process modeling [34]. Process parameter optimization is a necessary step that significantly boosts the process’s efficiency [35]. RSM optimization algorithm, like other traditional optimization algorithms, is an optimization technique that is performed locally because it can only locate the local optimal [36]. RSM’s optimization process is based on the traditional deterministic, steepest ascent gradient-based approach [35], which presumes that the response surface is nearly quadratic because the nature of the function near an optimal is quadratic [36]. Alas, if the quadratic model is far from an optimal value, it may not accurately mimic the behavior of the function [34]. Thus, a more robust optimization algorithm such as genetic algorithm (GA) or ant colony optimization (ACO) is needed that can find the solution space globally.
A genetic algorithm (GA) is a non-deterministic or stochastic model which utilizes an evolutionary algorithm based on modeling the biological process of natural selection. The algorithm’s primary components are the fitness function, population of the chromosome, selection of chromosomes, crossover, and mutation. GA has been integrated with RSM and ANFIS to optimize some adsorption processes [37,38]. ACO is a metaheuristic optimization technique based on stochastic models like GA. It employs the foraging principle of ant colonies which locate the shortest route between food and the ants’ territory [39]. This is achieved by ants communicating indirectly through chemical pheromone trails, which the algorithm utilizes to interpret optimization problems [40]. It is worth noting that, to the best of our knowledge, there is no report on the use of GA and ACO in conjunction with RSM and ANFIS for the optimization of hexavalent chromium adsorption onto eucalyptus tree bark-derived pristine.
Thus, this current work aimed to model the hexavalent chromium adsorption process by employing RSM and ANFIS techniques to evaluate their predictive efficacy. The central composite design (CCD) of RSM was engaged to examine the individual and interactive influence of Cr6+ concentration (mg/L), sorbent amount (g/L), and pH on the removal percentage of Cr6+. Statistical parameters such as mean relative percentage deviation (MRPD), mean absolute error (MAE), correlation coefficient (R), coefficient of determination (R2), root mean square error (RMSE), hybrid fractional error function (HYBRID), Marquart’s percentage standard deviation (MPSD), Chi-square (x2), and adjusted R2 were employed to assess the developed RSM and ANFIS models. In order to establish the best combination of pertinent parameters for the efficient removal of Cr6+, optimization was conducted using the desirability function approach of RSM, RSM coupled with GA or ACO (RSM–GA, RSM–ACO), and ANFIS coupled with GA or ACO (ANFIS–GA, ANFIS–ACO).

2. Materials and Methods

2.1. Materials

Eucalyptus bark was collected from a solid waste bin in Ado–Ekiti, Nigeria. Analytical-grade chemical compounds, including zinc chloride (ZnCl2, 98%), sodium hydroxide (NaOH, 99.9%), tetraoxosulphate (H2SO4, 98%), and potassium dichromate (K2Cr2O7, 99%), used in this study were bought from LOBA Chemie Company, India. A standard solution of Cr6+ ions (1 g/L) was prepared by adding 2.829 g of K2Cr2O7 to 1 L of deionized water until the solid completely dissolved. Various solutions used for adsorption studies were prepared by diluting the standard solution with deionized water.

2.2. Preparation and Characterization of Biochar-Based Adsorbent

The method used in preparing the biochar-based adsorbent was reported by Gorzin and Abadi [1]. The collected eucalyptus barks were rinsed in clean water, dried in an oven at 80 °C for 6 h and then pyrolyzed at 500 °C for 1.5 h and a heating rate of 5 °C/min in a furnace. After that, the pyrolyzed sample was ground with the aid of mortar and pestle and then sieved using a sieve size of 0.3 mm to obtain the desired particle size. For the activation of the biochar, the sieved material was soaked in 200 mL of 3 M aqueous solution of ZnCl2 in a beaker and stirred on a magnetic stirrer at 60 °C for 5 h. After activation, the solution was filtered, and the product obtained was washed seven times until the pH of the washed water was neutral. The washed sample finally dried at 110 °C for 24 h, and the activated biochar obtained will henceforth be referred to as activated eucalyptus biochar (AEB).
The prepared (AEB) samples before and after use for Cr6+ removal from aqueous solution were analyzed to gain insights into their properties. Fourier transform infrared (FTIR) spectrophotometry was employed to determine the functional groups of the adsorbent samples. An FTIR spectrophotometer (Perkin–Elmer) was used for measuring the absorption of different infrared light wavelengths emitted by the analyzed samples. Adsorbent samples were ground and blended with 0.1 wt.% potassium bromide (KBr) before analysis. The spectra were recorded from 4000 to 400 cm−1. A scanning electron microscope (SEM; Quanta 200F, The Netherlands) was used to evaluate the surface morphology of the adsorbent samples at an accelerating voltage of 15.0 kV. The Brunauer–Emmett–Teller (BET) surface area measurements were carried out under N2 adsorption–desorption at 77 K using a Micromeritics surface area analyzer (Model ASAP 2010, USA) to determine the surface area and pore size distribution of the adsorbent. Prior to analysis, the sample was degassed at 250 °C for 6 h to remove any adsorbed molecules from the pores and surfaces.

2.3. Adsorption Studies

The procedure used in conducting the adsorption study in the current work was similar to the method reported in our previous work [5]. Treatment of Cr6+ ions contaminated water via a batch mode adsorption process was conducted in 100 mL flasks with the needed amount of AEB and 50 mL of the Cr6+ with varied concentrations and pH. The flask contents were agitated in a constant temperature shaker for 3 h at 150 rpm. After treatment, the solution was filtered, and the concentration of Cr6+ left in the filtrate was measured using a flame atomic absorption spectrophotometer (AAS, Buck scientific model 210-VGP, USA). The adsorption capacity at equilibrium ( q e ) and percentage removal (Y) were evaluated using Equations (1) and (2) [5].
q e = ( C o C e ) V m
Y = C o C e C o × 100 %
where  C o —initial Cr6+ ions concentration,  C e —equilibrium concentration, V—solution volume, m—adsorbent mass.

2.4. Model Development

2.4.1. RSM Model Development

The CCD of RSM was utilized to obtain the design of experimental runs using Stat-Ease Inc.’s Design-Expert version 7.0.0. The design considered three significant process parameters at five different factor levels (−α, −1, 0, +1, +α), as shown in Table 1. Cr6+ concentration (mg/L), sorbent amount (g/L), and pH were the three parameters studied. Table 1 shows the generated experimental condition by CCD. To accommodate for the design’s orthogonality, the alpha/axial point was set at 1.31607. Five center points were utilized to establish the design’s validity, while the axial points demonstrated the design’s rotatability [41]. To reduce systematic error, the experimental runs were performed randomly [42]. Equation (3) is a general second order that was employed to represent the relation between the response and the input parameter.
E ( % ) = o + 1 B 1 + 2 B 2 + 3 B 3 + 12 B 1 B 2 + 13 B 1 B 3 + 23 B 2 B 3 + 11 B 1 2 + 22 B 1 2 + 11 B 1 2
where E represents the removal percentage (%);  o  is the intercept term;  1 2 3  are the linear term coefficients;  12 13 23  are the interaction coefficients;  11 22 33  are the quadratic term coefficients; and  B 1 B 2 B 3  are the actual independent variables. Multiple regressions were used to fit the coefficients of Equation (3) to experimental data. The model’s performance was assessed employing ANOVA (analysis of variance) and the significance test. The Pareto chart and 3D response surface plots were generated using the Statistica 12 software package.

2.4.2. ANFIS Model Development

First order Takagi–Sugeno method Fuzzy Inference System (FIS) was utilized in this work due to its applicability and widespread acceptance. The Takagi–Sugeno IF-THEN rule for the current adsorption process governed the FIS. The ANFIS model’s overall structure is comprised of six distinct layers, including an input layer (Cr6+ concentration, sorbent amount and pH), a fuzzy operator layer (gbellmf in this work), a normalized/product layer in which the application method is embedded (Hybrid in this work), an output aggregation layer, a defuzzification layer, and an output layer (percentage removal of Cr(VI)) as displayed in Figure 1. The detailed parameters employed for the ANFIS are illustrated in Table 2 and Table 3. The parameters of the nodes in the fuzzification and defuzzification layers are trained to become adaptive, but the nodes in the product, output and normalized layers are fixed [43]. Figure 1 displays the ANFIS architecture employed in this study. The MATLAB function genfis1, based on grid partitioning, was used to develop the FIS that was used with ANFIS, utilizing generalized bell-shaped (gbellmf) as the membership function. The hybrid approach, which combines least-squares estimation and a back-propagation algorithm, was used to simulate the network [44]. Using the “randperm” function, all the data were randomly partitioned into two sets: 60% to train and 40% to check the network. This procedure has also been reported in the work of Franco et al. [44]. The development of the ANFIS model using the gbellmf has been explicitly reported in our previous work [45].

2.5. Optimization of Process Parameters

The RSM polynomial equation was solved using the desirability function technique to determine the ideal optimal conditions for achieving the highest percentage removal. In an effort to perform optimization using GA or ACO, the model developed was utilized as the fitness or objective function, which is used to determine an individual’s quality in the population in the case of GA and to measure the quality of ants in the colony in the case of ACO. The Design Expert version 7.0.0 was used for the RSM optimization, whereas a toolbox containing GA in MATLAB 2018a was employed for optimization with GA. For the ACO, codes were developed in MATLAB 2018a to perform the optimization. The response, i.e., removal percentage, was set to the maximum for all the optimization techniques while the operating variables were defined in the ranges examined. Table 2 shows the salient features utilized for GA and ACO optimization. The prediction by the five optimization types was verified in the laboratory by conducting a triplicate experiment and comparing the mean values obtained with the prognosticated values. The toolkit of fuzzy logic contained in MATLAB R2018a (MathWorks Inc., Natick, MA, USA) was utilized to complete the entire ANFIS modeling.

2.6. Appraisal of the Developed RSM and ANFIS Models

Based on the following statistical parameters: mean relative percentage deviation (MRPD), mean absolute error (MAE) correlation coefficient (R), coefficient of determination (R2), root mean square error (RMSE), hybrid fractional error function (HYBRID), Marquart’s percentage standard deviation (MPSD), Chi-square (x2), and adjusted R2 (Equations (4)–(11)), the created RSM and ANFIS models’ performance was evaluated [33,34].
R = 1 i = 1 n y p y e 2 i = 1 n y p y m e 2
R 2 = 1 i = 1 n y p y e 2 i = 1 n y p y m e 2
A d j u s t e d _ R 2 = 1 ( 1 R 2 ) × n 1 n v 1
R M S E = 1 n i = 1 n y p y e 2
M A E = 1 n i = 1 n y p y e
H Y B R I D = 100 n v i = 1 n y p y e 2 y e
M R P D = 100 n i = 1 n y e y p y e
χ 2 = i = 1 n y p y e 2 y e
where  y e  is the measured value of the removal percentage of Cr6+ y p  is the prognosticated value by RSM and ANFIS models,  y m e  is the average value of  y e , n is the experimental number of points, and v is the number of variables.

2.7. Sensitivity Analysis of the Operating Parameters on Model Response

Sensitivity analysis is a method for figuring out how different modeling factors contribute and is weighted. Additionally, it is utilized to choose an operating variable for future experiments, model improvements, or field of research [46]. Sensitivity analysis assesses and explains how modifications to the input values influence the model’s output values.
The ANFIS model sensitivity study was carried out by assessing the maximum value of each input factor while maintaining the nominal values of the other input factors (most frequent values). This guarantees an adequate evaluation of how input factors affect the response (percentage removal). Table 3 displays the inputs that were utilized to calculate the sensitivity study for the ANFIS model.
The RSM model’s sensitivity study was carried out utilizing the sum of squares computed for the model and individual factor [42]. According to Equation (9), they were utilized to compute the percentage contribution of each participating parameter to assess its relevance level on the output (percentage removal) (Equation (12)).
% C o n t r b u t i o n o f i n p u t v a r i a b l e = S o S i n d i v i u a l S o S o v e r a l l
where  S o S i n d i v i d u a l  and  S o S o v e r a l l , respectively, stand for the sum of squares of each variable and the sum of squares of all the variables.

3. Results and Discussion
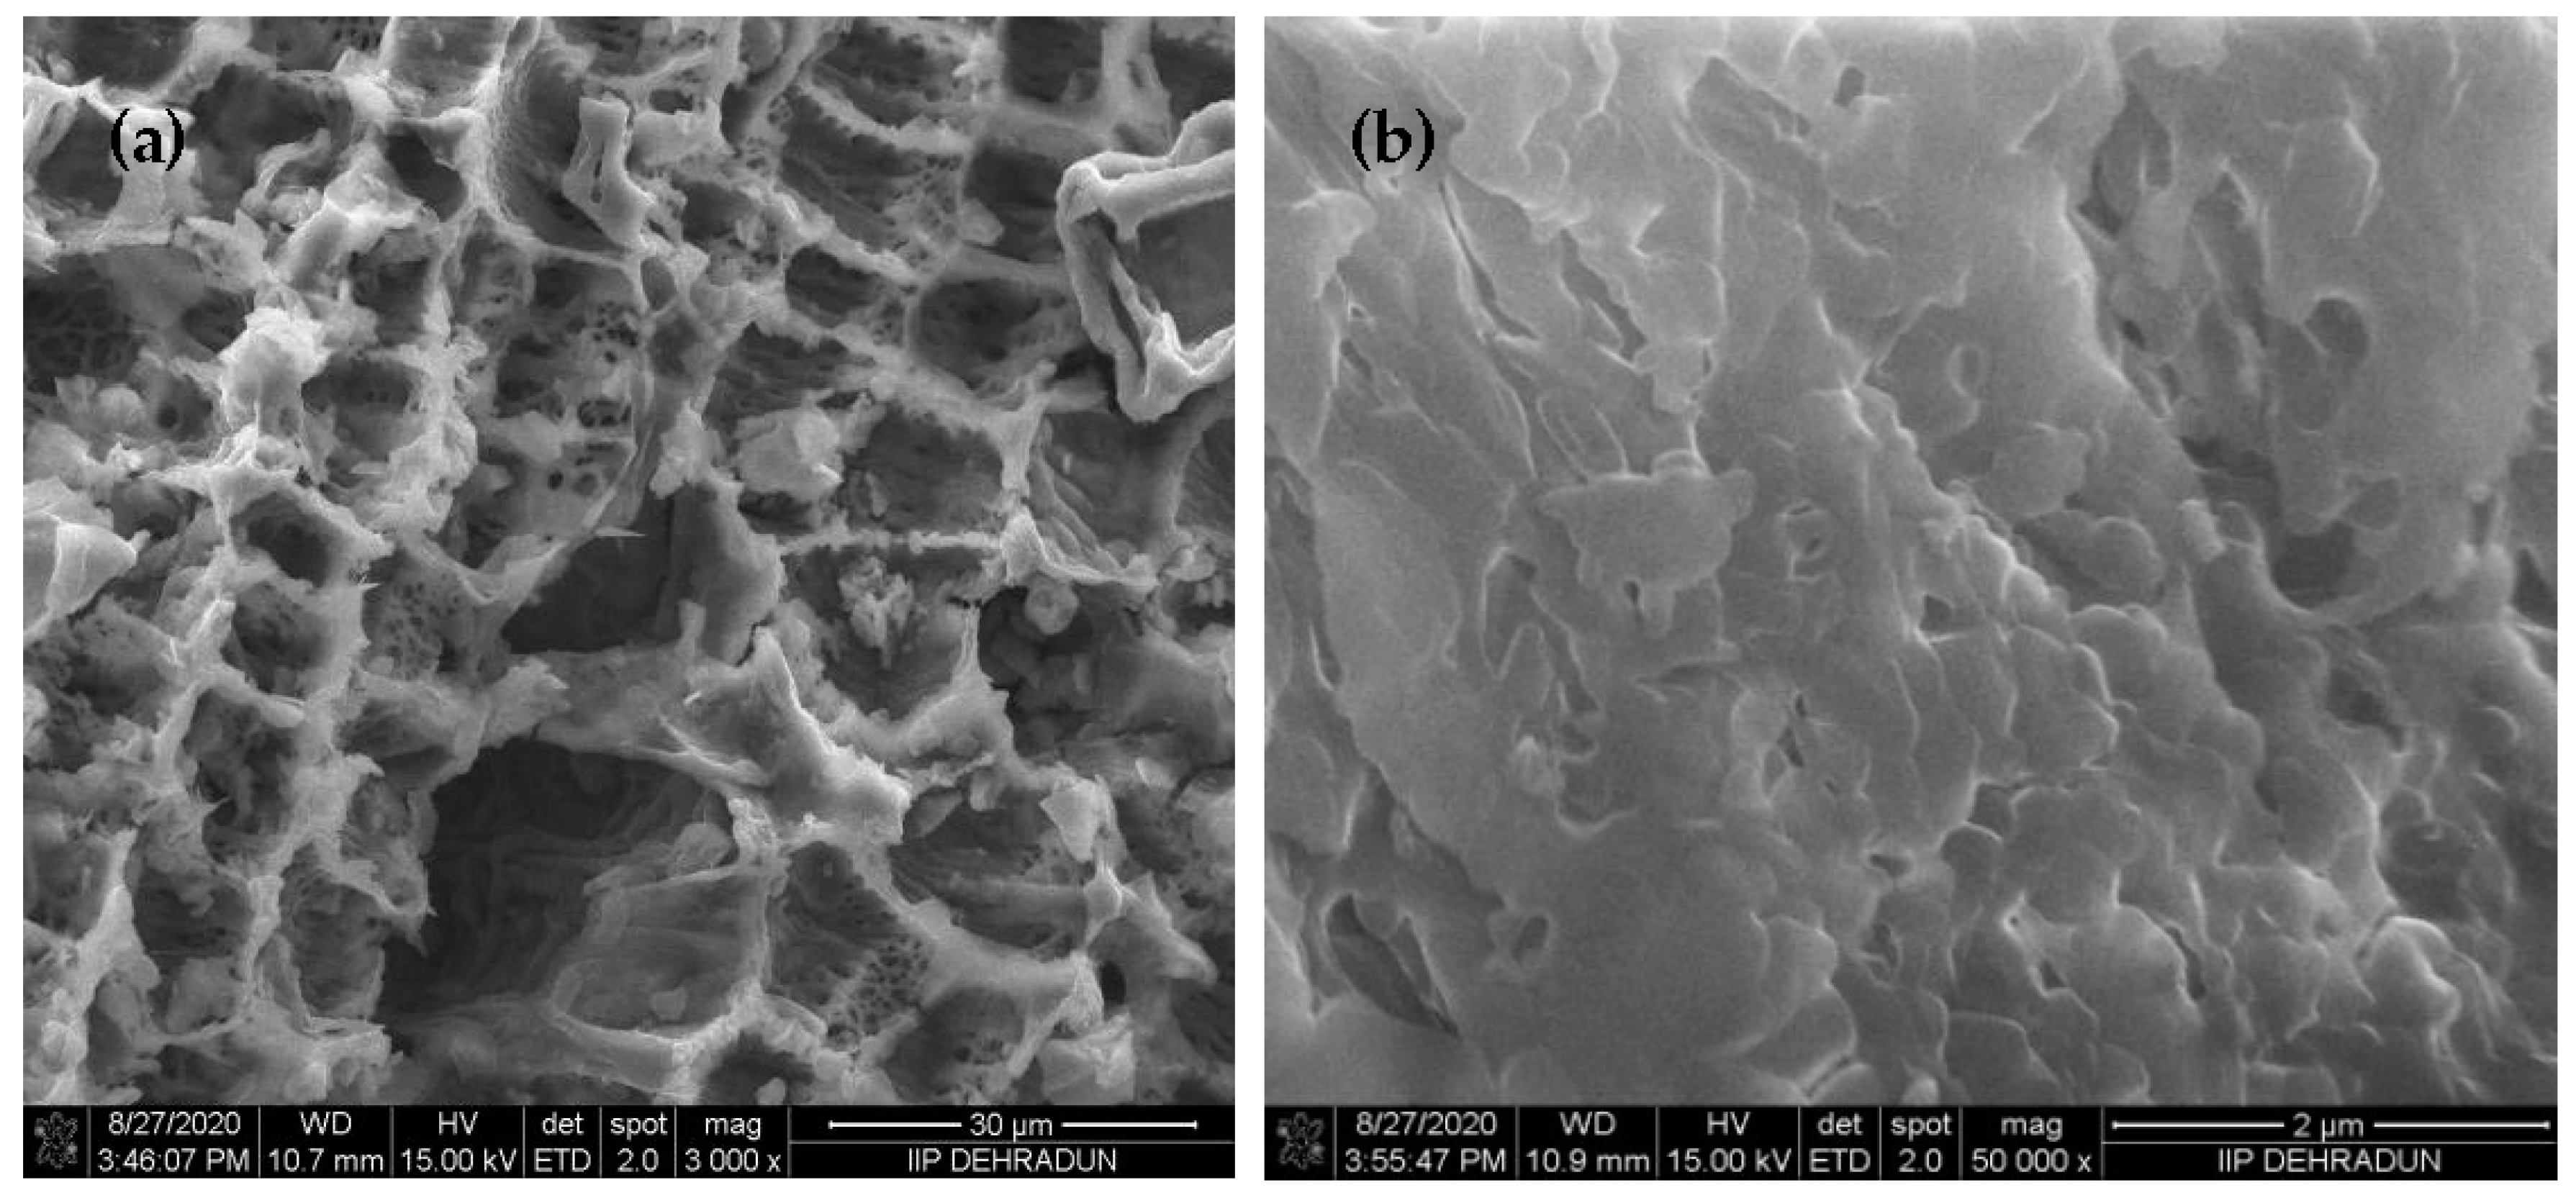
3.1. AEB Analysis

The proximate, ultimate, and textural properties of the prepared AEB sample were evaluated, and the obtained results are listed in Table 1. The elements contained in the AEB sample, which comprised mainly of carbon (68.7%), oxygen (26.4%), and hydrogen (2.97%), confirm that the studied sample is a carbonaceous material. Notably, the ratios of C to H and C to O were higher, suggesting that impregnation of ZnCl2 on biochar increased the number of active functional groups on the adsorbent and contributed to the retention of H and O contents. This may have enhanced the hydrophilicity of the prepared modified biochar, thereby potentially facilitating the adsorption of C6+, as reported by previous researchers [47,48]. It is worthy of note that the presence of Zn in the AEB sample was due to the activating agent (ZnCl2), which could not be completely washed off during the washing of the activated sample, similar to the observation reported by Ngaosuwan et al. [48]. This could be the reason why complete decolorization of the Cr6+ solution was noticed after adsorption, as Zn has good optical properties, which eminently enhanced the uptake capacity of the biosorbent. Furthermore, the activated biochar showed good textural qualities as its specific surface area, pore volume, and pore diameter were large, as indicated in Table 4.
Figure 2 displays the IR spectra of fresh and Cr6+ loaded AEB samples. The absorption bands revealed three major surface functional groups: carboxylic, hydroxyl, and amine groups. The difference in the peak intensity is a result of the contact of Cr6+ with the adsorbent surface functional groups. It is noticed that a band at 3533 cm−1—which was ascribed to the complexation between the hydroxyl (–OH) group—was reduced to 3529 cm−1 after Cr6+ removal by AEB [1,49]. The unchanged peak noticed at 1604 cm−1 on both spectra of fresh and Cr6+ loaded was attributed to the –C=O (carboxylic) group, whereas the peak at 1456 cm−1, which was shifted to 1436 cm−1, might be due to the complexation between Cr6+ ions and –COOH bending functional group on the AEB surface [47,50]. Notably, the peak at 811 cm−1 (CH out-of-plane deformation) observed earlier on fresh AEB spectrum disappeared after Cr6+ adsorption, indicating that the functional groups are actively involved in the adsorption of the metal ions [51]. Furthermore, the peak at 552 cm−1 shifted to 573 cm−1 as a result of the complexation of Cr6+ with a C-O-H twist [52].
SEM micrographs of AEB samples prior to and after Cr6+ adsorption are displayed in Figure 3. As observed in Figure 3a, numerous well-developed pores were noticed on the surface of the fresh adsorbent. These pores signified a better possibility for the adsorption of hexavalent chromium. However, the surface of the Cr6+ loaded AEB clearly indicated that the adsorbent was covered with chromium ions. A similar observation (in terms of the development of numerous pores in the adsorbent) has been reported in the work of Kabir et al. [15]. They attributed the formation of pores in the adsorbent to several mechanisms, including depolymerization, partial solubilization, and evaporation of key constituents in the adsorbent.

3.2. RSM Model Analysis for the Adsorption Process

Table 5 illustrates the results of the adsorption technique used to remove hexavalent chromium from ZnCl2-modified biochar. The table shows both the measured and prognosticated values. The percentage removal prediction varied from 11.90 to 92.05% (Table 2).
The ANOVA in Table 6 was performed to investigate the observed data’s fit to the proposed quadratic model, which is shown in Equation (13).
E % = + 77.17   0.75 B 1 6.29 B 2 + 2.08 B 3 0.98 B 1 B 2 + 0.26 B 1 B 3 + 8.01 B 2 B 3   0.0022 B 1 2 + 38.35 B 1 2 1.95 B 1 2
The p-value and F-value were used to assess the quadratic model significance and process variables. The significance of the coefficients was established by the p-value [34]. A 95% confidence level was established, suggesting that p-value terms less than 0.05 were significant and those >0.05 were deemed insignificant. The quadratic model was shown to be significant by ANOVA due to its low p-value (0.0451) and F-value of 5.03. Furthermore, it was also observed that the significant terms are quadratic terms of the pH, the interaction between Cr6+ concentration and pH, and a linear term of sorbent amount, while other terms are insignificant. These results are in line with the results obtained from the Pareto graphic (Figure 4). Any term with a longer bar corresponds to a significant term, while any bar not up to the reference line (p = 0.05) is not significant [53]. In assessing model quality and reliability, the adjusted R2, R, and R2 are vital. The validity of the associated model depends on the closeness of R2 towards unity [54]. The quadratic model’s strong R2 (0.9005), R (0.9487), and adjusted R2 (0.7213) demonstrate the model’s ability to reliably predict the experimental data [53]. The adjusted R2 demonstrated the quadratic model’s suitability. The graph in Figure 5 further verifies this result. The data are near the regression line, showing a relationship between the predicted and measured values in the plot.
It is preferable to have a sufficient adequate precision value of at least 4 because this shows that the selected model has adequate model effectiveness to navigate the design space. Therefore, the quadratic model’s acceptability and the model’s reliability in predicting the removal percentage were supported by the adequate precision of 9.096. The lack of fit F-value of 0.97 indicates that it is insignificant in comparison to the pure error. The likelihood that noise is responsible for the lack of fit F-value is 38.01%. Since we desire a good model fit, a non-significant lack of fit is preferred.

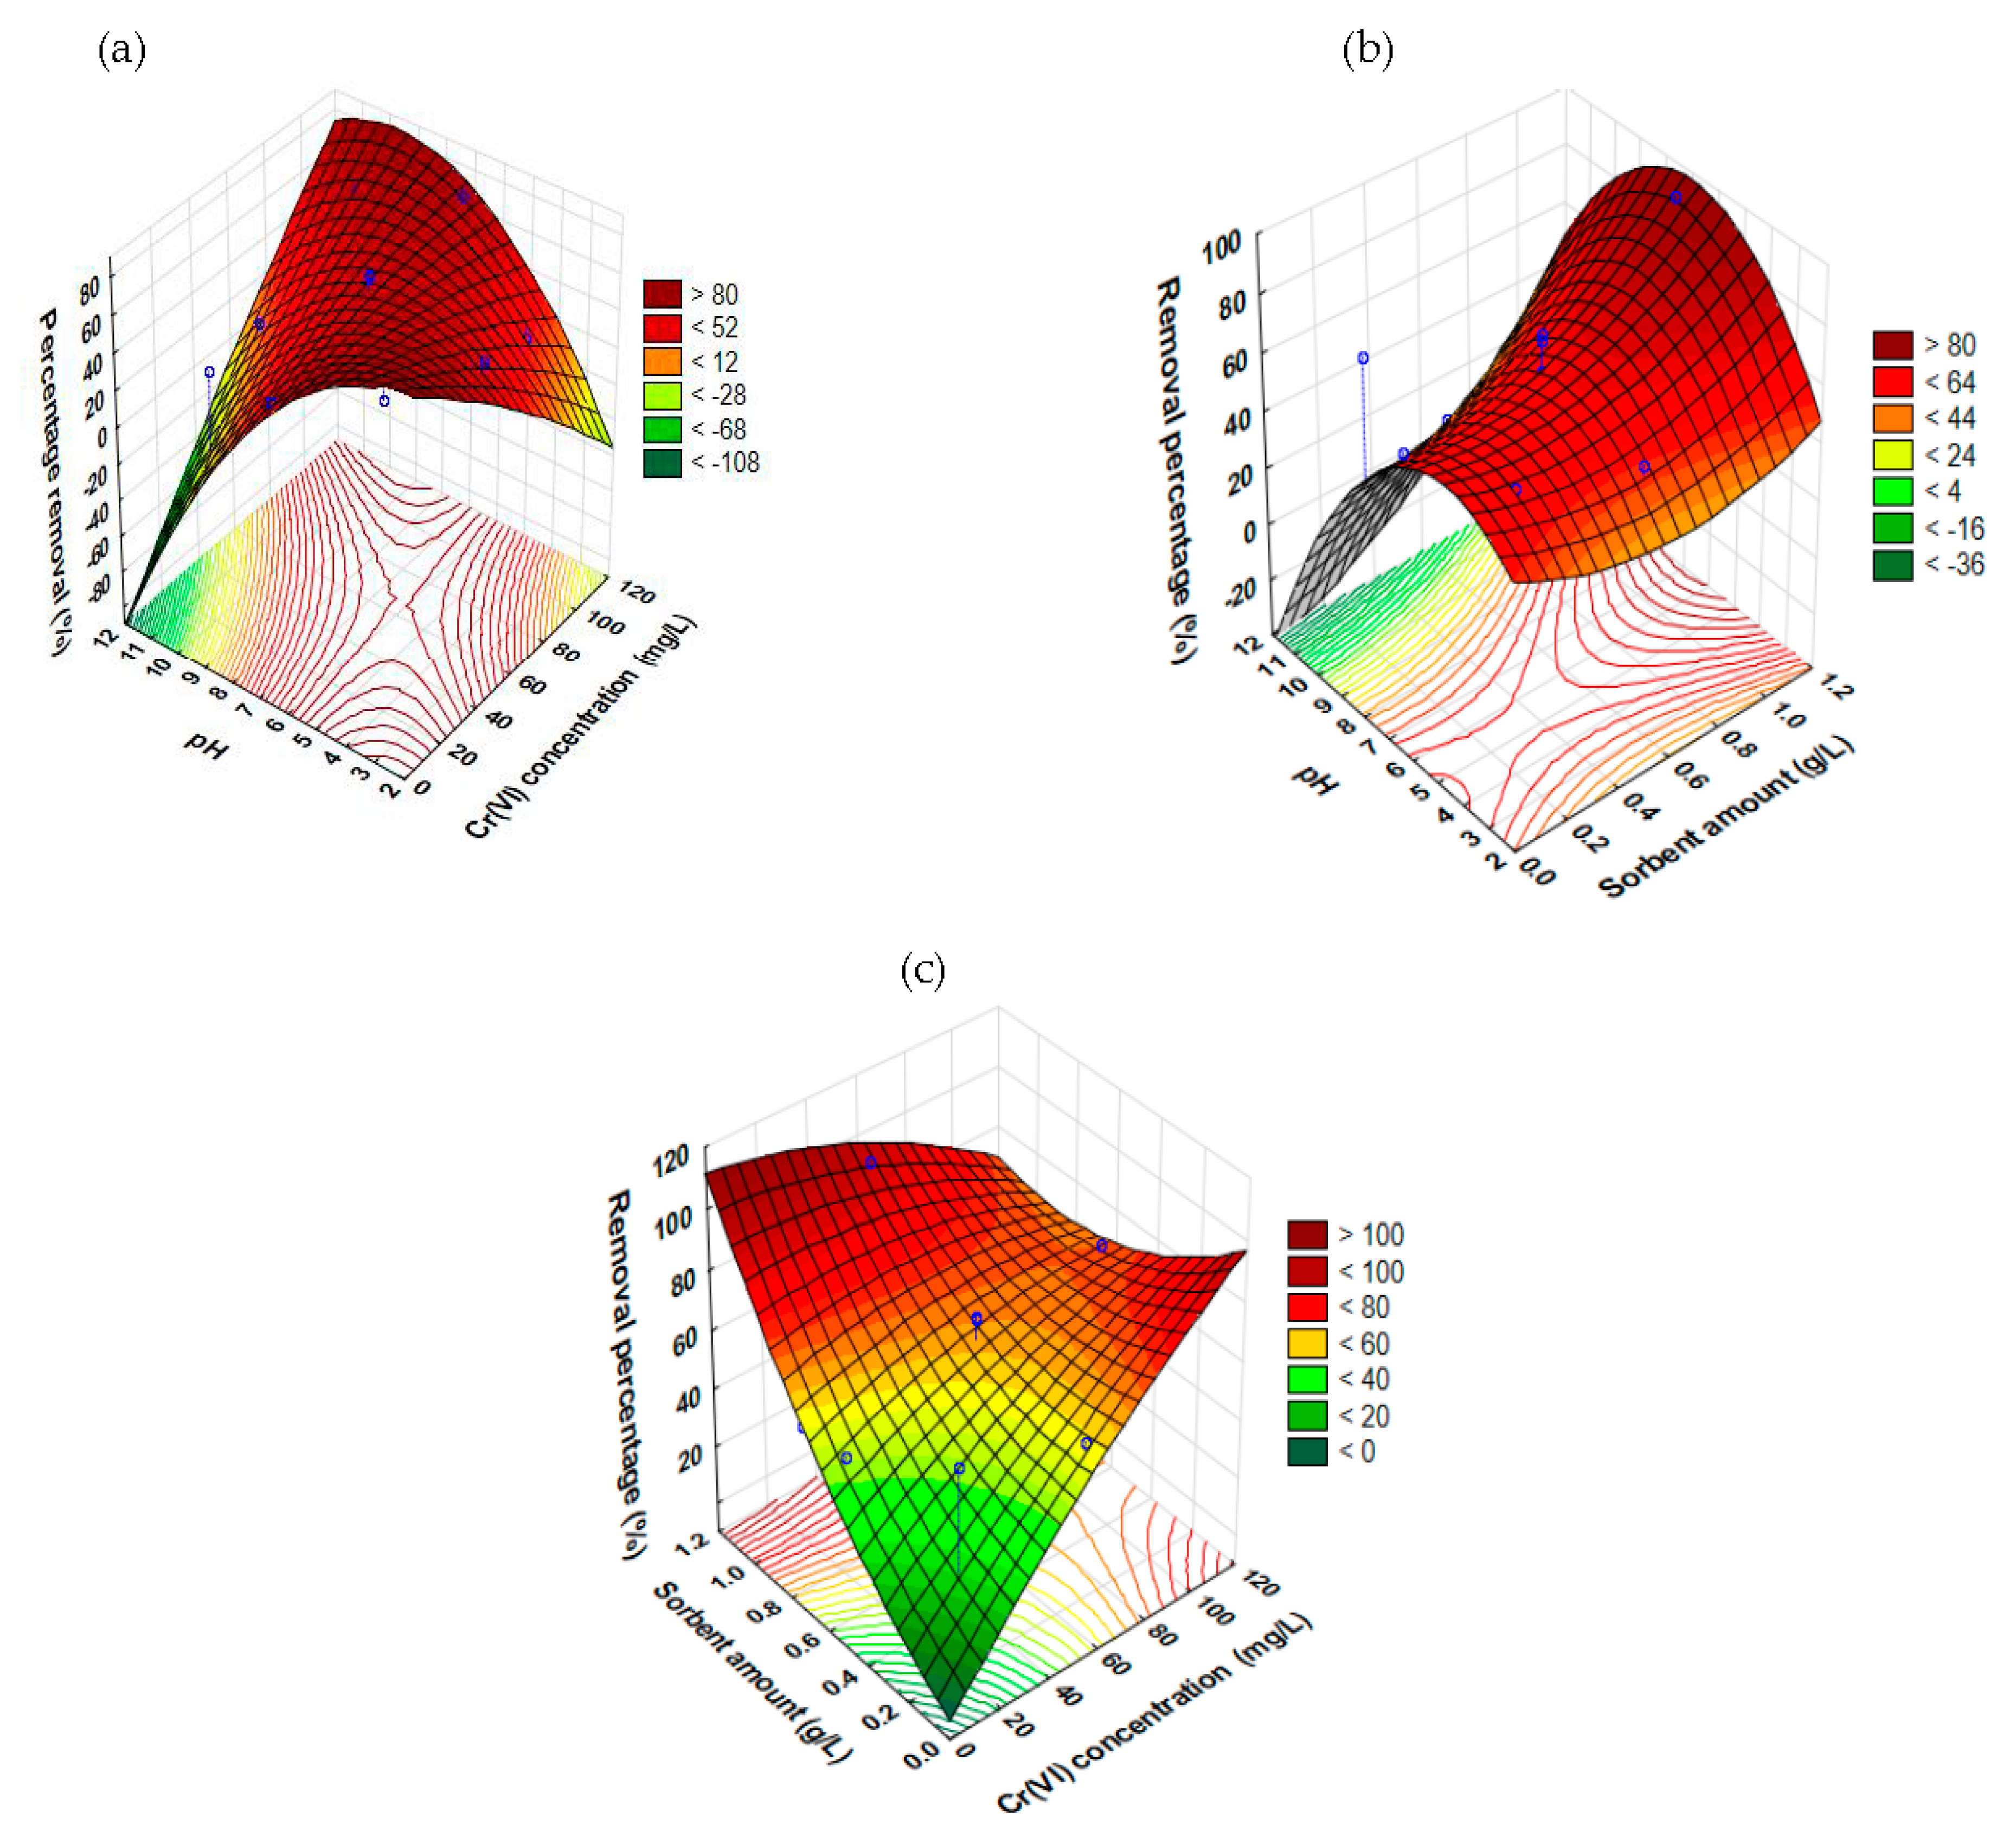
Synergistic Impacts of Factors on the Removal of Cr6+ Using the RSM Model

The major goal of this study was to maximize Cr6+ biosorption from aqueous solutions utilizing ZnCl2-modified biochar as adsorbents and, as a result, improve the uptake of adsorbate removal. The surface and contour plots in Figure 6 were built to demonstrate the interaction effects of the adsorption process variables on the efficacy of removing Cr6+.
  • Influence of pH and Cr6+ concentration
Figure 6a illustrates the surface and contour plots of the percentage removal of Cr6+ as a function of pH and concentration of Cr6+. From the plots, it is obvious that both pH and Cr6+ concentration have an impact on the removal percentage. At maximum pH value and very low Cr6+ concentration, the degree of removal percentage was insignificant, while at low pH value and sufficient amount of Cr6+ concentration, the removal percentage was noticed to be significant. At a considerable amount of these two interacting factors, the percentage removal significantly increased. When the Cr6+-contaminated solution was treated using modified biochar, a rise in Cr6+ uptake was seen with increasing concentration, indicating that the surface sites for sorption were mostly still available and had not yet been saturated [55]. It was also seen that beyond a certain level of pH, it has a negative influence on the removal percentage. These observations agree with some previous studies [1,50,56].
  • Influence of pH and sorbent amount
Figure 6b shows the 3D and contour plots of percentage removal as a function of pH and sorbent amount. The collaborative interaction of pH and sorbent amount influenced the removal percentage, as seen in the plots. Both input factors influence the removal percentage, as depicted in the surface plot. As the amount of the adsorbate is increased with respect to the pH amount, it was observed that the removal percentage increased. The amount of adsorbent used is crucial to the biosorption process since it dictates how much adsorbate will be extracted [1]. Furthermore, in the biosorption process, a solution’s pH is crucial, and changes in pH during the removal of adsorbate are linked to changes in removal uptake [52]. From the surface and contour plots, a minimum pH level is needed to achieve a good degree of removal percentage at a sufficient sorbent amount. The high percentage of removal achieved at a low pH level in this study is in line with some previous studies [1,5,56].
  • Influence of Cr6+ concentration and sorbent amount
Figure 6c displays the surface and contour plots of the Cr6+ concentration and sorbent amount in relation to the removal percentage. The plots showed that there is significant interaction between the Cr6+ concentration and sorbent amount, which affects the removal percentage. Evidently, from the plots, as the sorbent amount and Cr6+ concentration are simultaneously increased, the removal percentage also increased. Maximum percentage removal is seen at a sorbent amount range of 0.2–1.2 g/L and Cr6+ concentration up to 100 mg/L when both surface and contour plots are considered. The lowest sorbent amount and Cr6+ concentration result in the lowest removal percentage (Figure 6c). The study by Yusuff et al. [5] support the observation of increasing percentage removal as sorbent amount and Cr6+ concentration increase.

3.3. ANFIS Model Analysis for the Adsorption Process

For the ANFIS modeling, the generated datasets by CCD were employed, as displayed in Table 2. The percentage removal prediction varied from 16.10 to 95.10% (Table 5). The full data set was randomly grouped into training (60%) and checking (40%) sets to avoid overfitting the model. The network was trained over a hundred epochs. The input membership function was gbellmf, while that of the output was constant. A total of 15 epoch iterations were employed throughout the whole dataset to train the experimental data with no tolerance for error. RMSE was 5.5089 for the overall dataset, with 27 fuzzy rules and 27 nonlinear parameters. Table 2 highlights the main characteristics of the ANFIS model. The estimated RMSE result for the checking (0.2805) and training (0.2290) depict the reliability of the developed ANFIS model. The ANFIS model’s predictive potency is shown in Figure 7, along with the measured and prognosticated values of percentage removal during the training and checking stages. The predicted values and the measured values were in reasonable agreement. The computed R (0.9591), R2 (0.9199), and adjusted R2 (0.8908) values (Table 7)—which are all reasonably high—depict that the developed ANFIS model was statistically reliable and precise. This can be attributed to the ability of the neuro-fuzzy systems to combine the duo predictive potency of neural and fuzzy intelligence. The parity graph of the overall datasets in Figure 8 further elucidates this result. The results closely follow the regression line, demonstrating a substantial link between the predicted and measured values in the Figure 8.

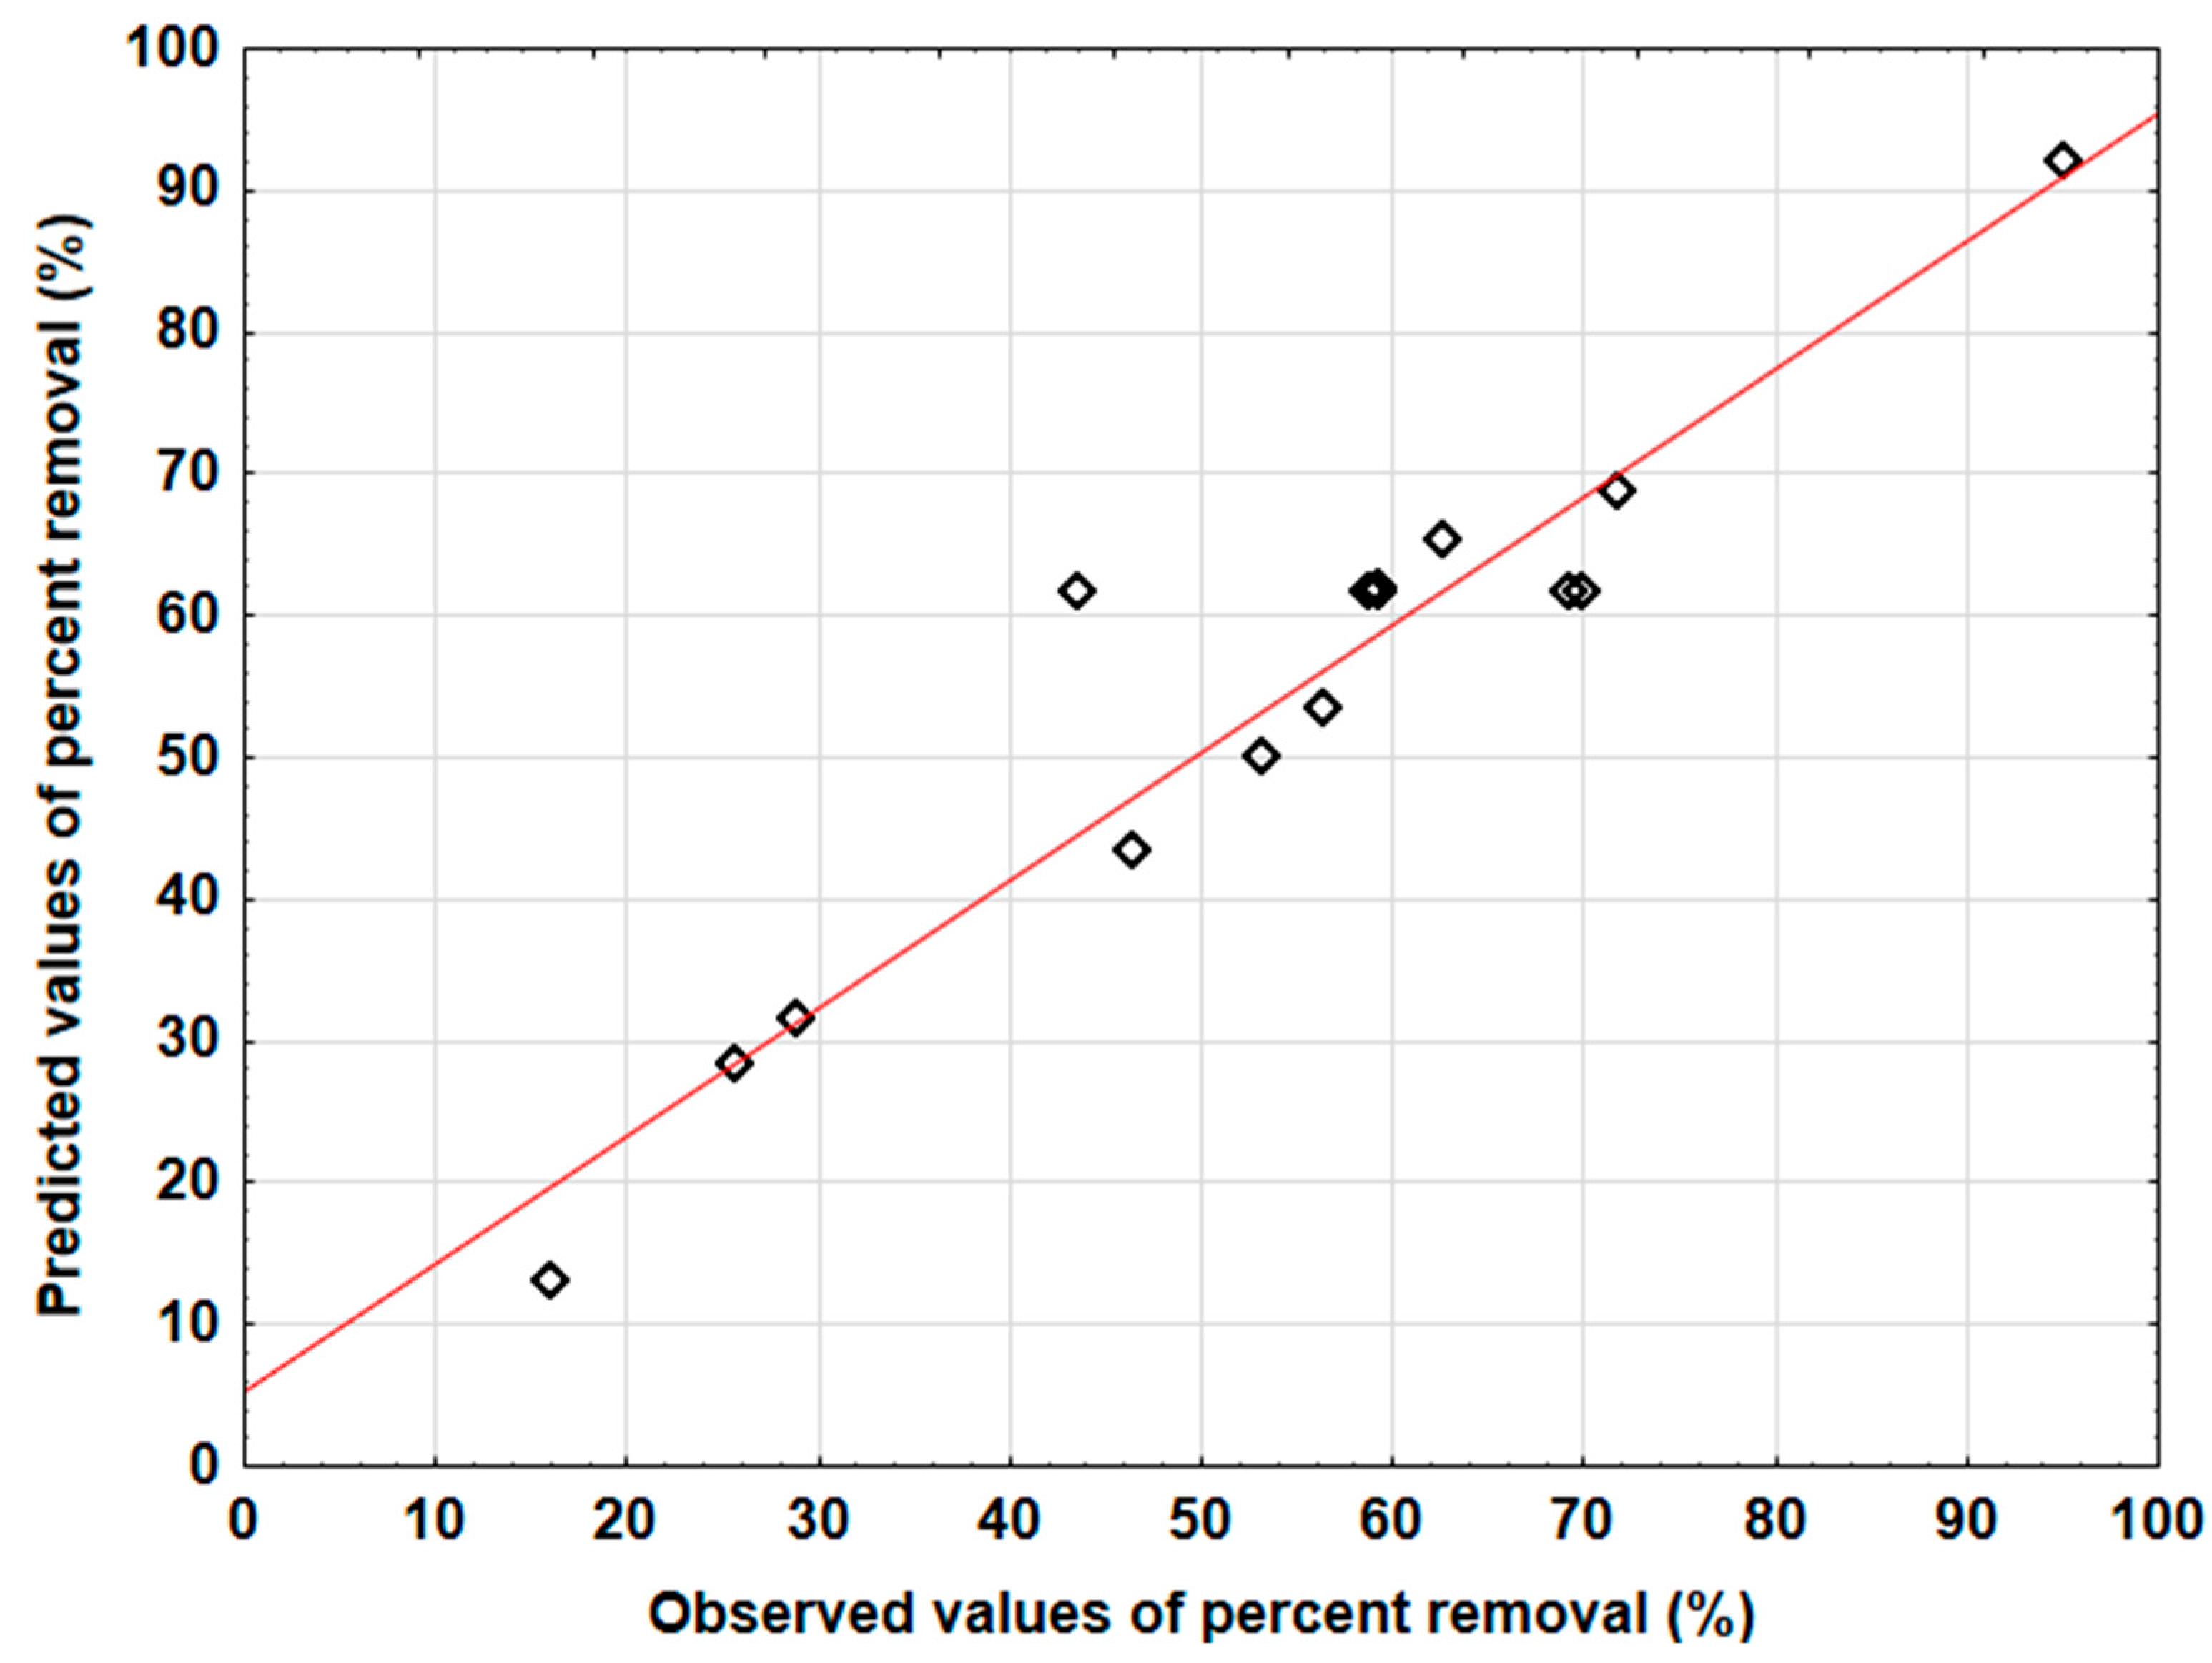
3.4. Evaluation of the Two Models’ Predictive Effectiveness

Several statistical pointers were calculated (Table 6) to gauge how well the ANFIS and RSM models predicted the percentage removal of Cr6+ for the adsorption process. For both models, the correlation (R) between the measured and predicted values is strong, in which the computed values for the ANFIS model are higher than that of the RSM model. The high R2 values show that the models match the data well [14]. The R2 was verified for overestimation employing adjusted R2. The adjusted R2 values of the two models’ show that the computed R2 was not overestimated, indicating their importance. The common error functions, such as RMSE (5.5089) and MAE (2.5120) in the case of the ANFIS model, were lower than that of the RSM model (RSME = 6.1574, MSE = 4.7057). The other pointers used to measure the accuracy of the models, such as MRPD (10.3616) and HYBRID (103.0904) computed for the RSM model, are higher than that of the ANFIS model (MRPD = 4.5950, HYBRID = 74.1853). The low value of these pointers (MRPD and HYBRID) is desirable for good model fitness. For the RSM and ANFIS models, Pearson’s Chi-square ( χ 2 ), which was used to ascertain whether the measured values significantly deviate from the prognosticated values, was computed to be 12.3708 and 8.9022, respectively. These pointers allow us to draw the conclusion that the ANFIS model accurately represented the experimental data and provided a meaningful measuring scale for evaluating the quality of fit. So, in terms of predicting the Cr6+ removal percentage on ZnCl2-modified biochar, the ANFIS model fared better than the RSM model. Furthermore, this observation was buttressed by the plot depicted in Figure 9, which clearly showed that for the ANFIS model, greater alignment between the predicted and measured values was observed in comparison to the RSM model. Prior works that compared the two methodologies noted that the ANFIS model fared better than the RSM model [57,58].

3.5. Results of Operating Parameter Optimization

To determine the ideal process input variable combination for the Cr6+ percentage removal, the following techniques were used: RSM, RSM–ACO, RSM–ACO, ANFIS–GA, and ANFIS–ACO. Table 8 displays the optimal values that each approach predicted. The optimization results were verified and summarized in Table 8, along with the best independent variables. The sequence in which the optimization procedures are performed, as shown in Table 8, is ANFIS–ACO, ANFIS–GA, RSM–ACO, RSM–GA, and RSM. At a Cr6+ concentration of 38.14 mg/L, sorbent amount of 1.33 g/L and pH of 4.35, and maximum percentage removal of 99.8%, ANFIS–ACO gave the best optimal blend of process factors. This can be attributed to the statistical pointer assessments showing that the ANFIS model is superior to the RSM model. It was also observed that the prediction by the global optimization techniques for the current work outstripped that of the RSM model due to the robustness of the GA and ACO to search for solution space globally. The superiority of these global optimizations, due to their robustness, has been previously reported in some chemical processes [59,60].

3.6. Result of the Sensitivity Study

The sensitivity study conducted on the percentage removal of Cr6+ showed that all the operating parameters have an impact on the percentage removal of Cr6+. The result showed that the pattern of the relative impact of individual operating parameters on percentage removal for both is the same, although with a different result. The most influencing operating variable on the percentage removal for models is sorbent amount with RSM (42.62%), ANFIS (47.06%), then pH with RSM (39.17%), ANFIS (38.84%), and lastly, the concentration of Cr6+ with RSM (18.21%) and ANFIS (14.10%), as shown in Figure 10. All the examined operating variables have an influence on the percentage removal of the heavy metal, and none could be disregarded.
This crucial role of the sorbent amount is likely due to the fact that more binding sites become available for the Cr(VI) ions to bind to the adsorbent as the number of sorbents increases—leading to a greater overall removal efficiency. Based on this finding, wastewater treatment facilities aiming to remove this pollutant would need to carefully consider this parameter, in addition to the pollutant Cr6+ concentration, which is usually the first factor to be ascertained. Further techno-economic assessments are required to establish the cost-effectiveness and the potential of the developed adsorbent to be commercially implemented on an industrial scale.

4. Conclusions

In order to remove Cr(VI) from aqueous solutions, this work examined the adsorption behavior of activated eucalyptus biochar (AEB) made from the bark of eucalyptus trees. The AEB had a superior surface area, a well-developed porous structure, and a predominance of active surface functional groups, which were confirmed by BET, SEM, and FTIR. Furthermore, the effectiveness of ANFIS and RSM in modeling the Cr6+ adsorption process was examined in this work. Using GA, ACO, and RSM, the input operating factors involved in the adsorption process were sequentially optimized. Various statistic pointers were used to evaluate the models’ performance, and it was established that they could accurately describe the process. ANFIS, with R = 0.9591 and MAE = 2.5120, was superior to RSM, with R = 0.9487 and MAE = 4.7057 in terms of prediction accuracy. At a Cr6+ concentration of 38.14 mg/L, sorbent amount of 1.33 g/L, pH of 4.35, and maximum percentage removal of 99.8%, ANFIS–ACO gave the best optimal combination of the operating variables. The sensitivity study revealed that all the input factors had a significant impact on the percentage removal of Cr6+, with the sorbent amount having the most influence, followed by pH and then Cr6+ concentration. The results of modeling and optimization have clearly shown that future cost-effective adsorption processes can be achieved by optimizing the process parameters using suitable global optimization techniques. The results obtained herein were also in agreement with recent similar studies in the literature. Incorporating other machine learning technologies, such as extreme learning machines, will be useful for the study of adsorption processes as it has been used in other biochemical separation processes. Other global optimization algorithms, such as cuckoo search and particle swarm optimization, can also be integrated into these machine learning algorithms to obtain the most favorable combination of operating parameters.

Author Contributions

Conceptualization, A.S.Y. and N.B.I.; methodology, A.S.Y. and N.B.I.; software, N.B.I.; validation, N.B.I.; data curation, A.S.Y., N.B.I., A.O.G. and E.I.E.; writing—original draft preparation, A.S.Y. and N.B.I.; writing—review and editing, A.S.Y., N.B.I., A.O.G. and E.I.E. All authors have read and agreed to the published version of the manuscript.

Funding

This research was funded by Afe Babalola University.

Data Availability Statement

All data are contained within the article.

Acknowledgments

The first author acknowledges Afe Babalola University, for providing the facilities used to conduct this research.

Conflicts of Interest

The authors declare that they have no known competing financial interests or personal relationships that could have appeared to influence the work reported in this paper.

References

  1. Gorzin, F.; Bahri Rasht Abadi, M. Adsorption of Cr (VI) from aqueous solution by adsorbent prepared from paper mill sludge: Kinetics and thermodynamics studies. Adsorpt. Sci. Technol. 2018, 36, 149–169. [Google Scholar] [CrossRef] [Green Version]
  2. Awual, M.R. Assessing of lead (III) capturing from contaminated wastewater using ligand doped conjugate adsorbent. Chem. Eng. J. 2016, 289, 65–73. [Google Scholar] [CrossRef]
  3. Awual, M.R.; Yaita, T.; Kobayashi, T.; Shiwaku, H.; Suzuki, S. Improving cesium removal to clean-up the contaminated water using modified conjugate material. J. Environ. Chem. Eng. 2020, 8, 103684. [Google Scholar] [CrossRef]
  4. Bayazit, Ş.S.; Kerkez, Ö. Hexavalent chromium adsorption on superparamagnetic multi-wall carbon nanotubes and activated carbon composites. Chem. Eng. Res. Des. 2014, 92, 2725–2733. [Google Scholar] [CrossRef]
  5. Yusuff, A.S.; Popoola, L.T.; Igbafe, A.I. Response surface modeling and optimization of hexavalent chromium adsorption onto eucalyptus tree bark-derived pristine and chemically-modified biochar. Chem. Eng. Res. Des. 2022, 182, 592–603. [Google Scholar] [CrossRef]
  6. Mitra, S.; Chakraborty, A.J.; Tareq, A.M.; Emran, T.B.; Nainu, F.; Khusro, A.; Idris, A.M.; Khandaker, M.U.; Osman, H.; Alhumaydhi, F.A.; et al. Impact of heavy metals on the environment and human health: Novel therapeutic insights to counter the toxicity. J. King Saud Univ. Sci. 2022, 34, 101865. [Google Scholar] [CrossRef]
  7. Cavaco, S.A.; Fernandes, S.; Quina, M.M.; Ferreira, L.M. Removal of chromium from electroplating industry effluents by ion exchange resins. J. Hazard. Mater. 2007, 144, 634–638. [Google Scholar] [CrossRef] [PubMed]
  8. Kostas, V.; Baikousi, M.; Dimos, K.; Vasilopoulos, K.C.; Koutselas, I.; Karakassides, M.A. Efficient and rapid photocatalytic reduction of hexavalent chromium achieved by a phloroglucinol-derived microporous polymeric organic framework solid. J. Phys. Chem. C 2017, 121, 7303–7311. [Google Scholar] [CrossRef]
  9. Yusuff, A.S.; Ajayi, O.A.; Popoola, L.T. Application of Taguchi design approach to parametric optimization of adsorption of crystal violet dye by activated carbon from poultry litter. Sci. Afr. 2021, 13, e00850. [Google Scholar] [CrossRef]
  10. Fito, J.; Tibebu, S.; Nkambule, T.T. Optimization of Cr (VI) removal from aqueous solution with activated carbon derived from Eichhornia crassipes under response surface methodology. BMC Chem. 2023, 17, 4. [Google Scholar] [CrossRef]
  11. Yang, T.; Han, C.; Tang, J.; Luo, Y. Removal performance and mechanisms of Cr (VI) by an in-situ self-improvement of mesoporous biochar derived from chicken bone. Environ. Sci. Pollut. Res. 2020, 27, 5018–5029. [Google Scholar] [CrossRef]
  12. Kumar, A.; Jena, H.M. Adsorption of Cr (VI) from aqueous solution by prepared high surface area activated carbon from Fox nutshell by chemical activation with H3PO4. J. Environ. Chem. Eng. 2017, 5, 2032–2041. [Google Scholar] [CrossRef]
  13. Yusuff, A.S. Adsorption of hexavalent chromium from aqueous solution by Leucaena leucocephala seed pod activated carbon: Equilibrium, kinetic and thermodynamic studies. Arab. J. Basic Appl. Sci. 2019, 26, 89–102. [Google Scholar] [CrossRef] [Green Version]
  14. Kabir, M.M.; Akter, M.M.; Khandaker, S.; Gilroyed, B.H.; Didar-ul-Alam, M.; Hakim, M.; Awual, M.R. Highly effective agro-waste based functional green adsorbents for toxic chromium (VI) ion removal from wastewater. J. Mol. Liq. 2022, 347, 118327. [Google Scholar] [CrossRef]
  15. Meshram, P.; Ghosh, A.; Ramamurthy, Y.; Pandey, B.D.; Torem, M.L. Removal of hexavalent chromium from mine effluents by ion exchange resins-comparative study of Amberlite IRA 400 and IRA 900. Russ. J. Non Ferr. Met. 2018, 59, 533–542. [Google Scholar] [CrossRef]
  16. Salahshoori, I.; Seyfaee, A.; Babapoor, A.; Cacciotti, I. Recovery of Manganese Ions from Aqueous Solutions with Cyanex 272 Using Emulsion Liquid Membrane Technique: A Design of Experiment Study. J. Sustain. Metall. 2021, 7, 1074–1090. [Google Scholar] [CrossRef]
  17. Yusuff, A.S.; Bhonsle, A.K.; Bangwal, D.P.; Atray, N. Development of a barium-modified zeolite catalyst for biodiesel production from waste frying oil: Process optimization by design of experiment. Renew. Energy 2021, 177, 1253–1264. [Google Scholar] [CrossRef]
  18. Salahshoori, I.; Ramezani, Z.; Cacciotti, I.; Yazdanbakhsh, A.; Hossain, M.K.; Hassanzadeganroudsari, M. Cisplatin uptake and release assessment from hydrogel synthesized in acidic and neutral medium: An experimental and molecular dynamics simulation study. J. Mol. Liq. 2021, 344, 117890. [Google Scholar] [CrossRef]
  19. Zaroual, Z.; Chaair, H.; Essadki, A.; El Ass, K.; Azzi, M. Optimizing the removal of trivalent chromium by electrocoagulation using experimental design. Chem. Eng. J. 2009, 148, 488–495. [Google Scholar] [CrossRef]
  20. Jang, J.-S. ANFIS: Adaptive-network-based fuzzy inference system. IEEE Trans. Syst. Man Cybern. 1993, 23, 665–685. [Google Scholar] [CrossRef]
  21. Malik, Z.; Rashid, K. Comparison of optimization by response surface methodology with neurofuzzy methods. IEEE Trans. Magn. 2000, 36, 241–257. [Google Scholar] [CrossRef]
  22. Garg, U.K.; Kaur, M.; Sud, D.; Garg, V. Removal of hexavalent chromium from aqueous solution by adsorption on treated sugarcane bagasse using response surface methodological approach. Desalination 2009, 249, 475–479. [Google Scholar] [CrossRef]
  23. Jain, M.; Garg, V.; Kadirvelu, K. Investigation of Cr (VI) adsorption onto chemically treated Helianthus annuus: Optimization using response surface methodology. Bioresour. Technol. 2011, 102, 600–605. [Google Scholar] [CrossRef] [PubMed]
  24. Kiran, B.; Kaushik, A.; Kaushik, C. Response surface methodological approach for optimizing removal of Cr (VI) from aqueous solution using immobilized cyanobacterium. Chem. Eng. J. 2007, 126, 147–153. [Google Scholar] [CrossRef]
  25. Tarangini, K.; Kumar, A.; Satpathy, G.; Sangal, V.K. Statistical optimization of process parameters for Cr (VI) biosorption onto mixed cultures of Pseudomonas aeruginosa and Bacillus subtilis. Clean Soil Air Water 2009, 37, 319–327. [Google Scholar] [CrossRef]
  26. Halder, G.; Dhawane, S.; Barai, P.K.; Das, A. Optimizing chromium (VI) adsorption onto superheated steam activated granular carbon through response surface methodology and artificial neural network. Environ. Prog. Sustain. Energy 2015, 34, 638–647. [Google Scholar] [CrossRef]
  27. Khan, H.; Hussain, S.; Hussain, S.F.; Gul, S.; Ahmad, A.; Ullah, S. Multivariate modeling and optimization of Cr (VI) adsorption onto carbonaceous material via response surface models assisted with multiple regression analysis and particle swarm embedded neural network. Environ. Technol. Innov. 2021, 24, 101952. [Google Scholar] [CrossRef]
  28. Krishna, D.; Sree, R.P. Artificial neural network and response surface methodology approach for modeling and optimization of chromium (VI) adsorption from waste water using Ragi husk powder. Indian Chem. Eng. 2013, 55, 200–222. [Google Scholar] [CrossRef]
  29. Oskui, F.N.; Aghdasinia, H.; Sorkhabi, M.G. Modeling and optimization of chromium adsorption onto clay using response surface methodology, artificial neural network, and equilibrium isotherm models. Environ. Prog. Sustain. Energy 2019, 38, e13260. [Google Scholar] [CrossRef]
  30. Sen, S.; Nandi, S.; Dutta, S. Application of RSM and ANN for optimization and modeling of biosorption of chromium (VI) using cyanobacterial biomass. Appl. Water Sci. 2018, 8, 148. [Google Scholar] [CrossRef] [Green Version]
  31. Mandal, S.; Mahapatra, S.; Patel, R. Neuro fuzzy approach for arsenic (III) and chromium (VI) removal from water. J. Water Process Eng. 2015, 5, 58–75. [Google Scholar] [CrossRef]
  32. Rajabi Kuyakhi, H.; Tahmasebi Boldaji, R. Developing an adaptive neuro-fuzzy inference system based on particle swarm optimization model for forecasting Cr (VI) removal by NiO nanoparticles. Environ. Prog. Sustain. Energy 2021, 40, e13597. [Google Scholar] [CrossRef]
  33. Zafar, M.; Aggarwal, A.; Rene, E.R.; Barbusiński, K.; Mahanty, B.; Behera, S.K. Data-Driven Machine Learning Intelligent Tools for Predicting Chromium Removal in an Adsorption System. Processes 2022, 10, 447. [Google Scholar] [CrossRef]
  34. Betiku, E.; Odude, V.O.; Ishola, N.B.; Bamimore, A.; Osunleke, A.S.; Okeleye, A.A. Predictive capability evaluation of RSM, ANFIS and ANN: A case of reduction of high free fatty acid of palm kernel oil via esterification process. Energy Convers. Manag. 2016, 124, 219–230. [Google Scholar] [CrossRef]
  35. Myers, R.H.; Montgomery, D.C.; Christine, M. Anderson Cook, CM: Response Surface Methodology: Process and Product Optimization Using Designed Experiments; John Wiley & Sons: New York, NY, USA, 2009. [Google Scholar]
  36. Chen, M.-J.; Chen, K.-N.; Lin, C.-W. Optimization on response surface models for the optimal manufacturing conditions of dairy tofu. J. Food Eng. 2005, 68, 471–480. [Google Scholar] [CrossRef]
  37. Alhothali, A.; Khurshid, H.; Mustafa, M.R.U.; Moria, K.M.; Rashid, U.; Bamasag, O.O. Evaluation of Contemporary Computational Techniques to Optimize Adsorption Process for Simultaneous Removal of COD and TOC in Wastewater. Adsorpt. Sci. Technol. 2022, 2022, 7874826. [Google Scholar] [CrossRef]
  38. Onu, C.E.; Ohale, P.E.; Ekwueme, B.N.; Obiora-Okafo, I.A.; Okey-Onyesolu, C.F.; Onu, C.P.; Ezema, C.A.; Onu, O.O. Modeling, optimization, and adsorptive studies of bromocresol green dye removal using acid functionalized corn cob. Clean. Chem. Eng. 2022, 4, 100067. [Google Scholar] [CrossRef]
  39. Ramachandran, A.; Rustum, R.; Adeloye, A.J. Review of anaerobic digestion modeling and optimization using nature-inspired techniques. Processes 2019, 7, 953. [Google Scholar] [CrossRef] [Green Version]
  40. Blum, C. Ant colony optimization: Introduction and recent trends. Phys. Life Rev. 2005, 2, 353–373. [Google Scholar] [CrossRef] [Green Version]
  41. Tan, I.; Ahmad, A.; Hameed, B. Preparation of activated carbon from coconut husk: Optimization study on removal of 2, 4, 6-trichlorophenol using response surface methodology. J. Hazard. Mater. 2008, 153, 709–717. [Google Scholar] [CrossRef]
  42. Ishola, N.B.; Okeleye, A.A.; Osunleke, A.S.; Betiku, E. Process modeling and optimization of sorrel biodiesel synthesis using barium hydroxide as a base heterogeneous catalyst: Appraisal of response surface methodology, neural network and neuro-fuzzy system. Neural Comput. Appl. 2019, 31, 4929–4943. [Google Scholar] [CrossRef]
  43. Souza, P.; Dotto, G.; Salau, N. Artificial neural network (ANN) and adaptive neuro-fuzzy interference system (ANFIS) modelling for nickel adsorption onto agro-wastes and commercial activated carbon. J. Environ. Chem. Eng. 2018, 6, 7152–7160. [Google Scholar] [CrossRef]
  44. Franco, D.S.; Duarte, F.A.; Salau, N.P.G.; Dotto, G.L. Adaptive neuro-fuzzy inference system (ANIFS) and artificial neural network (ANN) applied for indium (III) adsorption on carbonaceous materials. Chem. Eng. Commun. 2019, 206, 1452–1462. [Google Scholar] [CrossRef]
  45. Yusuff, A.S.; Ishola, N.B.; Gbadamosi, A.O.; Thompson-Yusuff, K.A. Pumice-supported ZnO-photocatalyzed degradation of organic pollutant in textile effluent: Optimization by response surface methodology, artificial neural network, and adaptive neural-fuzzy inference system. Environ. Sci. Pollut. Res. 2022, 29, 25138–25156. [Google Scholar] [CrossRef] [PubMed]
  46. Mashaly, A.F.; Alazba, A. ANFIS modeling and sensitivity analysis for estimating solar still productivity using measured operational and meteorological parameters. Water Sci. Technol. Water Supply 2018, 18, 1437–1448. [Google Scholar] [CrossRef]
  47. Liu, L.; Li, Y.; Fan, S. Preparation of KOH and H3PO4 modified biochar and its application in methylene blue removal from aqueous solution. Processes 2019, 7, 891. [Google Scholar] [CrossRef] [Green Version]
  48. Ngaosuwan, K.; Goodwin, J.G., Jr.; Prasertdham, P. A green sulfonated carbon-based catalyst derived from coffee residue for esterification. Renew. Energy 2016, 86, 262–269. [Google Scholar] [CrossRef]
  49. Gorzin, F.; Ghoreyshi, A.A. Synthesis of a new low-cost activated carbon from activated sludge for the removal of Cr (VI) from aqueous solution: Equilibrium, kinetics, thermodynamics and desorption studies. Korean J. Chem. Eng. 2013, 30, 1594–1602. [Google Scholar] [CrossRef]
  50. Pal, D.B.; Singh, A.; Jha, J.M.; Srivastava, N.; Hashem, A.; Alakeel, M.A.; Abd_Allah, E.F.; Gupta, V.K. Low-cost biochar adsorbents prepared from date and delonix regia seeds for heavy metal sorption. Bioresour. Technol. 2021, 339, 125606. [Google Scholar] [CrossRef]
  51. Hameed, B.; Krishni, R.; Sata, S. A novel agricultural waste adsorbent for the removal of cationic dye from aqueous solutions. J. Hazard. Mater. 2009, 162, 305–311. [Google Scholar] [CrossRef]
  52. Yusuff, A.S.; Owolabi, J.O.; Igbomezie, C.O. Optimization of process parameters for adsorption of heavy metals from aqueous solutions by alumina-onion skin composite. Chem. Eng. Commun. 2021, 208, 14–28. [Google Scholar] [CrossRef]
  53. Betiku, E.; Akintunde, A.M.; Ojumu, T.V. Banana peels as a biobase catalyst for fatty acid methyl esters production using Napoleon’s plume (Bauhinia monandra) seed oil: A process parameters optimization study. Energy 2016, 103, 797–806. [Google Scholar] [CrossRef]
  54. Mahanty, S.; Chatterjee, S.; Ghosh, S.; Tudu, P.; Gaine, T.; Bakshi, M.; Das, S.; Das, P.; Bhattacharyya, S.; Bandyopadhyay, S.; et al. Synergistic approach towards the sustainable management of heavy metals in wastewater using mycosynthesized iron oxide nanoparticles: Biofabrication, adsorptive dynamics and chemometric modeling study. J. Water Process. Eng. 2020, 37, 101426. [Google Scholar] [CrossRef]
  55. Malkoc, E.; Nuhoglu, Y.; Dundar, M. Adsorption of chromium (VI) on pomace—An olive oil industry waste: Batch and column studies. J. Hazard. Mater. 2006, 138, 142–151. [Google Scholar] [CrossRef] [PubMed]
  56. Bashir, S.; Zhu, J.; Fu, Q.; Hu, H. Comparing the adsorption mechanism of Cd by rice straw pristine and KOH-modified biochar. Environ. Sci. Pollut. Res. 2018, 25, 11875–11883. [Google Scholar] [CrossRef]
  57. Dehghani, M.H.; Gholami, S.; Karri, R.R.; Lima, E.C.; Mahvi, A.H.; Nazmara, S.; Fazlzadeh, M. Process modeling, characterization, optimization, and mechanisms of fluoride adsorption using magnetic agro-based adsorbent. J. Environ. Manag. 2021, 286, 112173. [Google Scholar] [CrossRef]
  58. Ishola, N.B.; Adeyemi, O.O.; Adesina, A.J.; Odude, V.O.; Oyetunde, O.O.; Okeleye, A.A.; Soji-Adekunle, A.R.; Betiku, E. Adaptive neuro-fuzzy inference system-genetic algorithm vs. response surface methodology: A case of optimization of ferric sulfate-catalyzed esterification of palm kernel oil. Process Saf. Environ. Prot. 2017, 111, 211–220. [Google Scholar] [CrossRef]
  59. Jisieike, C.F.; Ishola, N.B.; Latinwo, L.M.; Betiku, E. Crude rubber seed oil esterification using a solid catalyst: Optimization by hybrid adaptive neuro-fuzzy inference system and response surface methodology. Energy 2022, 263, 125734. [Google Scholar] [CrossRef]
  60. Sekulic, M.; Pejic, V.; Brezocnik, M.; Gostimirović, M.; Hadzistevic, M. Prediction of surface roughness in the ball-end milling process using response surface methodology, genetic algorithms, and grey wolf optimizer algorithm. Adv. Prod. Eng. Manag. 2018, 13, 18–30. [Google Scholar] [CrossRef]
Figure 1. ANFIS model structure for the adsorption process.
Environments 10 00055 g001
Figure 2. FFTIR spectra of AEB (a) prior to and (b) after adsorption.
Environments 10 00055 g002
Figure 3. SEM micrographs of AEB (a) prior to and (b) after adsorption.
Environments 10 00055 g003
Figure 4. Adsorption process Pareto graphic showing standardized effects.  B 1 —Cr6+ concentration,  B 2  —sorbent amount,  B 3  —pH, L—linear and Q—quadratic.
Environments 10 00055 g004
Figure 5. Predicted vs. actual percentage removal (%) plot of the adsorption process using the RSM model.
Environments 10 00055 g005
Figure 6. Three-dimensional plots by the developed RSM model, showing the impact of (a) pH and Cr6+ concentration (b) pH and sorbent amount and (c) sorbent amount and Cr6+ concentration on the percentage removal of Cr6+. The vertical blue lines represent the different threshold values.
Environments 10 00055 g006
Figure 7. Plot of percentage removal against the index for developed ANFIS model (a) checking (b) Training phase.
Environments 10 00055 g007
Figure 8. Parity Plot showing predicted and actual percentage removal (%) adsorption process using ANFIS model.
Environments 10 00055 g008
Figure 9. Predicted (RSM and ANFIS models) and observed vs. experimental run.
Environments 10 00055 g009
Figure 10. Relative influence of operating variables on percentage removal of hexavalent chromium using (a) RSM and (b) ANFIS.
Environments 10 00055 g010
Table 1. Operating parameter experimental ranges and levels.
FactorDescriptionLevel
−α−10+1
  B 1 Cr(VI) concentration (mg/L)7.42060100112.6
  B 2 Sorbent amount (g/L)0.070.20.61.01.13
  B 3 pH3.1471010.9
Table 2. Parameters for ANFIS, GA, and ACO for the adsorption process.
ANFISProperty
Type of fuzzySugeno
Input/output3 a/1 b
Membership functiongbellmf
And typeProduct
Or typeProbabilistic
Implication typeProduct
Aggregation typeSum
Optimization typeHybrid
Epochs15
Number of rules27
Linear/nonlinear parameter number27/27
Total number of parameters54
Genetic algorithmValue/commentAnt colony optimization Value
Population size5–20Ant population size10–30
Scaling functionRankpheromone persistence coefficient0.8
SelectionStochastic uniformIteration number10–30
Crossover function0.8penalty factor0.5
MutationConstraint dependent
CrossoverConstraint dependent
a dennotes the set of input parameters; whereas, b is the output paramter.
Table 3. The variables used in the ANFIS sensitivity analysis.
FactorMinimumNominalMaximum
Cr6+ concentration7.460112.6
Sorbent amount0.070.61.13
pH3.1710.1
Table 4. Properties of the prepared AEB sample.
Ultimate PropertyComposition (%)
C68.68
H2.97
N0.92
O26.37
Zn1.23
Textural and proximate propertiesValue
Specific surface area (m2/g)217.29
Pore volume (cm3/g)0.21
Pore diameter (Å)49.91
Ash content (%)2.12
Humidity (%)58.7
Table 5. CCD, actual and predicted values for the adsorption process.
Run No.Cr(VI) Biosorption Process ParametersObserved Removal Percentage (%)Predicted Removal Percentages (%)
Cr(VI) Concentration, (mg/L)Sorbent Amount, (g/L)pH RSMANFIS
1112.60.67.071.868.771.8
27.40.67.046.542.446.5
3200.24.059.362.059.3
41000.21062.665.362.6
5600.077.056.453.456.4
6201.01028.931.628.9
7600.610.916.111.916.1
8601.137.095.192.195.1
9600.63.153.250.053.2
101001.04.025.628.325.6
11600.67.069.961.860.2
12600.67.043.661.860.2
13600.67.058.861.860.2
14600.67.059.361.860.2
15600.67.069.361.860.2
Table 6. ANOVA and the significance test for each regression coefficient.
ParameterSoSdFMSF-Valuep-Value
  B 1 320.0451320.0452.828320.1534
  B 2 748.8451748.8456.617730.0499
  B 3 688.2051688.2056.081840.0568
  B 1 × B 2 460.211460.214.066990.0998
  B 1 × B 3 1848.211848.216.3330.0099
  B 2 × B 3 171.5121171.5121.515690.2730
  B 1 2 74.4126174.41260.65760.4543
  B 2 2 235.7681235.7682.083540.2085
  B 3 2 1937.7611937.7617.12440.0090
ANOVA
Model5121.49569.0455.028790.0450significant
Residual565.7875113.157
Lack of Fit110.5591110.5590.971460.3801not significant
Pure Error455.2284113.807
R20.9005
Adjusted R20.7214
R0.9487
Adequate precision9.096
B 1 —Cr6+ concentration,  B 2 —sorbent amount,  B 3 —pH, SoS—sum of squares, dF—degree of freedom, MS—mean square.
Table 7. RSM and ANFIS model comparison using different statistical pointers.
PointerRSMANFIS
R0.94880.9591
R20.90020.9200
Adjusted R20.86390.8908
RMSE6.15755.5090
MAE4.70572.5120
MRPD10.36164.5950
HYBRID103.090474.1853
  χ 2 12.37088.9022
Table 8. Optimal condition prediction and validation of models.
Optimization TechniqueCr(VI) Concentration (mg/L)Sorbent Amount (g/L)pHPredicted Percentage Removal (%)Observed Percentage Removal (%)
RSM99.101.009.3094.9597.14 ±  0.32
RSM–GA50.461.126.2795.2898.28 ±  0.67
RSM–ACO35.681.095.9497.7298.05 ±  0.05
ANFIS–GA40.311.125.8597.9298.63 ±  0.82
ANFIS–ACO38.141.334.3599.8099.92 ±  0.18
Disclaimer/Publisher’s Note: The statements, opinions and data contained in all publications are solely those of the individual author(s) and contributor(s) and not of MDPI and/or the editor(s). MDPI and/or the editor(s) disclaim responsibility for any injury to people or property resulting from any ideas, methods, instructions or products referred to in the content.

