
Emission of Terpenoid Compounds from Rice Plants

1
Department of Environmental Sciences, School of Food and Nutritional Sciences, University of Shizuoka, Shizuoka 422-8526, Japan
2
Department of Bioresources, Prefectural University of Hiroshima, 5562 Nanatsuka, Shobara 727-0022, Japan
3
Institute for Agro-Environmental Sciences, National Agriculture and Food Research Organization, Tsukuba, Ibaraki 305-8604, Japan
*
Author to whom correspondence should be addressed.
Environments 2023, 10(3), 49; https://doi.org/10.3390/environments10030049
Submission received: 2 February 2023
/
Revised: 5 March 2023
/
Accepted: 6 March 2023
/
Published: 8 March 2023
Abstract
:The global cultivation area of rice is equivalent to 4% of the world’s forest area and may be an important sink and source of trace gases. To produce a precise terpenoid emission inventory, it is essential to obtain reliable data of terpenoid emission from rice plants. In the present study, terpenoid emissions from various rice species were measured using flow-through chamber and tower flux measurement methods. In the flow-through chamber measurement, linalool was emitted from the above-ground parts of the three rice cultivars “Koshihikari”, “Nipponbare” and “IR72”. The emission rates gradually decreased (<0.1 µg gDW−1 h−1) within two days during the measurement periods. As the touching stimulus might have enhanced linalool emission, a non-contact measurement method, i.e., the tower flux measurement method, was applied to a “Koshihikari” paddy. Linalool was not detected, but α-pinene was detected in the atmosphere above the rice paddy. The α-pinene flux (mean ± 95% confidence interval) was 0.006 ± 0.004 nmol m−2 s−1 on a land-area basis. The flux was 1/200 of the previously reported monoterpene emission rate of the rice plants measured in a commercial chamber, but was not largely different from three other reports. We provide terpenoid flux data above a rice paddy for the first time, which is more reliable because the tower flux measurement method can avoid stimuli to rice leaves and stems. Although the obtained terpenoid emission rate is very low, the obtained values can contribute to the establishment of a precise BVOC inventory in Asia.
1. Introduction
Many species of volatile organic compounds (VOCs) are emitted from biogenic sources, including crops, trees, grasses, and weeds. Terpenoids, including isoprene and monoterpenes, are major biogenic VOCs (BVOCs), and their total annual emission is estimated to account for 600–800 TgC [1], which is higher than the annual emission estimates of anthropogenic VOCs (98–158 TgC) [2]. Because of their high reactivity in the atmosphere [3], terpenoids contribute to the production of photochemical oxidants, including ozone, and secondary organic aerosols (SOA). Photochemical oxidants degrade air quality and have negative effects on humans, other animals, and plants [4]. SOA may directly and indirectly affect the global radiation balance by forming cloud condensation nuclei, which reflects sunlight, but the degree of its contribution is still largely unknown [5].
Rice (Oryza sativa) is the most important cereal crop in Asia and other countries. In Japan, the cultivation area is approximately 1.4 × 10⁶ ha, occupying 36% of the country’s entire farmland [6]. Its global cultivation area is approximately 167 × 106 ha [7], which corresponds to 4% of the world’s forest area. In Asia, the area of rice paddies accounts for 87% of the global cultivation area of rice [8]. Trace gas exchange between rice paddies and the atmosphere has been of great concern, including the emission sources of N2O [9] and methane [8]. If terpenoids are abundantly emitted from rice paddies, they might be a strong source of BVOC in rural areas and affect regional atmospheric chemistry and air quality.
To date, several studies have been conducted to qualify and quantify terpenoid emissions from rice paddy fields. In a rice paddy in California, no emission of isoprene or monoterpenes was observed in a flow-through chamber enclosing the rice cultivar “M202” grown in a rice paddy [10]. Redeker et al. [11] employed a static chamber method for the rice cultivar “Cocodrie” grown in a rice paddy and detected no emissions of monoterpenes, but did detect a trace amount of isoprene. The reported isoprene emission rate on a land-area basis was very small (3.7 µg m−2 h−1 ≈ 0.015 nmol m−2 s−1). Our previous study showed that a trace amount of monoterpene species linalool was emitted from the rice cultivar “Mutsuhomare,” but not from “Nipponbare”, “TCM916”, “Tangin-bodzu”, or “Waito C.” The emission rate was not quantified because of the low concentration below the limit of quantification in our previous gas chromatography–mass spectrometry (GC-MS) system [12].
On the other hand, Bao et al. [13] reported that monoterpene species α-pinene, limonene, myrcene, p-cymene, and β-pinene were emitted from Japonica rice (cultivar information was not given), and the total emission rate of the monoterpenes on a land-area basis was 600 µg m−2 h−1. By extrapolating the data, they estimated the monoterpene emission from rice in the Kinki region of Japan to be 5% of that from the whole plant species in the region. As most of the monoterpenes detected by these researchers were reactive in the atmosphere [3], Bao et al. [14] estimated ozone formation using the Community Multiscale Air Quality (CMAQ) model and concluded that paddy fields in the Kinki region contributed to the increase in ozone concentration in the urban area of Osaka City and its surrounding region. Except for Bao’s report [13], no other studies have reported substantial terpenoid emissions from rice. If large amounts of terpenoids are emitted from rice, the emissions might have a great impact on the production of regional photochemical oxidants and SOAs in Asia and other countries where rice is widely grown in rice paddy fields. As there is a discrepancy in terpenoid emission strength from rice plants between published reports, reliable emission data collected based on reliable measurement methods need to be provided.
Terpenoid emissions have been measured using the flow-through chamber [10] and static chamber methods [11,12,13]. The static chamber method has disadvantages, including terpenoid adsorption into, and re-emission from, the inner surface of the chamber, dissolution into condensed water, and difficulty in determining the precise leak rate of the chamber. The flow-through chamber method is more reliable because it can maintain the internal humidity below saturation and avoid water condensation. The disadvantage of both methods involves the stimulation of rice leaves and stems when enclosing them into the chamber, which may induce the emission of so-called green aldehydes and alcohols [15,16] and monoterpene linalool [17].
In contrast, a tower flux measurement of terpenoids based on the micrometeorological theory has been employed for forest ecosystems to collect a land-area-based emission rate or flux (for review, see Tani and Mochizuki [4]). This method is noninvasive and can provide data suitable for land-area-based terpenoid emission inventories. However, no results have been reported for tower flux data of rice paddy fields.
In this study, terpenoid emissions from various rice species were measured using the flow-through chamber method to determine whether terpenoids were abundantly emitted from rice plants. As the stimulus resulting from the contact between rice leaves and hands when enclosing them in the flow-through chamber might enhance the emission of a monoterpene species, the non-contact measurement method or the tower flux method was also applied to a rice paddy field. This study reports terpenoid flux data collected from rice paddies for the first time and provides reliable data for establishing a terpenoid inventory across Asia.
2. Materials and Methods
2.1. Flow-Through Chamber Experiment
2.1.1. Measurement Site and Plant Materials
Japonica rice varieties “Koshihikari” and “Nipponbare” and the Indica rice variety “IR72” were used as plant materials. “Koshihikari” and “Nipponbare” are widely grown in Japan and IR72 was used as a comparison between the Japonica and Indica species. Measurements were conducted in 2009 in an experimental paddy field at the National Agriculture and Food Research Organization in Tsukuba City, Japan. They were planted at every 50 cm square in the paddy field on May 18 to easily avoid overlapping plant bodies during the flow-through chamber measurements. In 2010, the three varieties were individually grown in a 1/5000a Wagner pot filled with paddy soil. Eight pots were used for each variety (24 pots in total). They were used for terpenoid sampling in a controlled environment in a laboratory of University of Shizuoka (Shizuoka City, Japan).
2.1.2. Flow-Through Chamber
Transparent fluorinated ethylene–propylene copolymer (FEP) bags (40–60 L volume each) were used for the flow-through chamber method. The entire above-ground part of the individual rice plant was enclosed in the bag at 9–10 a.m. Dry air was supplied by a compressed air cylinder and purified using a platinum catalyst heated at 400 °C. The air was then sent to the bag at a flow rate of 10 L min−1. Leaf temperature was measured using Teflon-coated 0.1 mm T-type thermocouples in both the field and laboratory experiments. The relative humidity in the bag was measured using a humidity sensor (CHS-UPS, TDK, Tokyo, Japan) and maintained at 50–80% because of the addition of water vapor by transpiration. Light intensity was measured using a semiconductor light sensor (S1133, Hamamatsu Photonics Co., Hamamatsu, Japan) placed outside the bag. The sensor was calibrated using a quantum sensor (LI190, Li-Cor, lincoln, NB, USA) to convert the output voltage to the photosynthetic photon flux density (PPFD) before it was used for the measurements. The measurements were conducted in the field on July 28–31 and 3–4 August 2009.
In the laboratory experiments, air temperature was maintained at 23 °C. A 400 W metal halide lamp (D400, Toshiba LiTec, Yokosuka, Japan) was used as the artificial lighting source. Light intensity was measured using the LI190 quantum sensor. The PPFD was 430–500 µmol m−2 s−1 at the top of the rice plants. A dark period of 4–6 h was included during the 30 h measurement period. On 15–16 July, a stimulus with hands to the rice leaves was provided during the dark period to mimic the enclosure procedure. Measurements were conducted on 14 June, 8 July, and 15 July 2010.
In 2010, an additional experiment was conducted to investigate the effects of wind velocity on the terpenoid emissions from rice. Fifteen 1/5000a Wagner pots of the rice variety “Koshihikari” were placed 15 cm apart and arranged into 3 × 5 rows in an experimental field at the University of Shizuoka. Wind velocity and direction in the field were measured using an ultrasonic anemometer (SAT-550, Tokyo, KAIJO, Japan) and recorded with a data logger (CR1000, Campbell, Logan, UT, USA) every second. Three pots located in the center of the arrangement were used for the measurements because they were surrounded by other pots and subjected to leaf rubbing. Around noon (11–13 local time), one pot was moved to the laboratory and the above-ground parts were immediately enclosed in the bag. The measurements were conducted on 4–12 August 2010.
2.1.3. Gas Sampling
Except for the additional wind velocity experiment, the plant was left for 1 h after being enclosed in the bag. Then, the gas inside was sampled at 90 min to 2 h intervals to investigate the impact of environmental conditions on terpenoid emissions. Air in the enclosure bag was collected into adsorbent tubes containing 200 mg Tenax-TA and 100 mg Carbotrap for 30 min at a flow rate of 200 mL min−1. The adsorbent tubes were stored at 4 °C prior to the GC-MS analysis. In the wind velocity experiment, gas sampling was initiated 10 min after completion of the enclosure.
2.2. Tower Flux Measurement
2.2.1. Measurement Site and Plant Materials
Flux measurements were conducted at the Mase paddy flux site (36°03′ N, 140°01′ E, 15 m a.s.l.), which was located in a rural area of Tsukuba City in central Japan. The site was flat. Around the site, artificially irrigated flat rice fields extended to an area of 1.5 km from north to south by 1 km from east to west. The paddy field soil was composed of clay loam. Saito et al. [18] provide a detailed description of this site.
The site is one of the AsiaFlux monitoring sites where energy and CO2 fluxes are continuously observed using the eddy covariance technique [19,20]. The paddy fields were separated into plots with an area of 100 × 50 m. A meteorological tower (3 m in height) was erected in a selected plot to continuously measure heat, CO2, and water vapor fluxes.
Terpenoid flux measurements were conducted for 2 years. The rice cultivar “Koshihikari” was transplanted on 2 May and harvested on 19 September in 2014 and 2015. The cultivation density was 18.4 hills m−2 (each hill contained a group of transplanted plants). The field was flooded from mid-April to mid-August, except for two temporary drainage periods in the middle of the growing season.
2.2.2. Relaxed Eddy Accumulation Method
Terpenoid flux measurements were conducted on 14–15 and 26–27 June, and 30–31 July 2104. In 2015, the measurement periods were 13–15 June and 25–27 July. Rice was in the vegetative stage in June, and in the reproductive stage in July. The measurements began at 8 a.m. and ended at 5 p.m. The number of samples collected was 49 sets in 2014 and 54 sets in 2015. During all the measurement periods, the rice paddy was flooded.
To determine the terpenoid flux, we employed the relaxed eddy accumulation (REA) method [21]. A portable REA gas sampling system developed by our research group was used to collect samples [22]. The flux (nmol m−2 s−1) was calculated as follows:
where σw (m s−1) is the standard deviation of vertical wind speed measured at 10 Hz. C+ and C− (mol m−3) are the terpenoid concentrations in upward and downward air, respectively. Terpenoids were collected into two adsorbent tubes (one for upward air and the other for downward air) for 55 min every hour. b is an empirical coefficient calculated from the sensible heat flux equation using the eddy covariance method. The b value was determined for each day as the slope of w’T’ against σw (T+ − T−) using hourly measurement data. Here, w’T’ is the covariance of the vertical wind speed and air temperature (°C), and T+ and T− are the air temperatures of upward and downward air, respectively. The calculated slope ranged between 0.38 and 0.42 (r2 > 0.91) in 12 days across 2 years. The terpenoids were sampled at a height of 2.8 m using a meteorological tower.
F = bσw (C+ − C−),
2.3. GC-MS Analysis
The samples collected in the adsorbent tubes underwent two-stage thermal desorption (TurboMatrix 650ATD, Perkin-Elmer, Yokohama, Japan), and the compounds were identified using GC-MS systems (QP5050A and QP2010SE, Shimadzu, Kyoto, Japan) by comparing the mass spectra and retention times of the candidate standards [22]. The desorption, cold trap, and re-desorption temperatures were 280 °C, −20 °C, and 280 °C, respectively. QP5050A was used for the flow-through chamber sampling and QP2010SE for REA sampling. Compounds were separated using an SPB-5 capillary column (60 m × 0.25 mm, 1 µm film thickness, Merck, Darmstadt, Germany). The column temperature was first maintained at 35 °C for 5 min, then raised to 250 °C at a rate of 5 °C min−1 and kept at 250 °C for 10 min. A gaseous internal standard (28 ppm toluene-d8 in N2) was automatically added to the samples by using a thermal desorption system. The adsorbent tubes for target compound calibration were prepared by spiking five different amounts of the standard liquid dissolved in methanol in the adsorbent tubes in a stream of purified helium (100 mL min−1 for 5 min). The detection limits (S/N = 3) of the monoterpenes in our thermal desorption GC-MS system were ~20 pptv for QP5050A and ~4 pptv for QP2010SE.
3. Results
3.1. Flow-Through Chamber Measurement in the Field
One of the monoterpene alcohols, linalool, was detected, and its highest emission rate was observed at the first or second (2.5 h later) sampling session (panels a–c in Figure 1). The linalool emission rate decreased in the late afternoon. Similar time courses of linalool emission were observed in four replications for each of the three cultivars. No other monoterpenes or isoprene were detected in these emissions. Two typical mass spectra of sesquiterpenes were observed, but were not identified because of the limited number of available sesquiterpene standards. The peak heights of the total ion chromatograms of the two sesquiterpenes were less than 1/20 of that of linalool and were not considered for further analysis. The emission rate of “Koshihikari”, “Nipponbare”, and “IR72” ranged between 0.055 and 0.93 µg gDW−1 h−1, 0.35 and 1.26 µg gDW−1 h−1, and 0.01 and 0.53 µg gDW−1 h−1, respectively (Table 1).
The linalool emission rate was plotted against PPFD (panels d–f in Figure 1) and leaf temperature (panels g–i in Figure 1). They seemed to increase with leaf temperature in some cases, but no clear relationships were found in other cases. This is also the case for the relationship between the emission rate and PPFD.
In the enclosing procedure, manipulating rice stems and leaves by hand might cause slight damage to the rice plants and trigger an emission burst of oxidation products [15]. However, the emission of linalool seems to be affected by the temperature and light intensity in some cases (Figure 1). Because the measurements started at 8–9 a.m., it was difficult to separately evaluate individual factors (wounding damage or environmental conditions). To check if the emission was caused by the wounding effect, the emission data were collected under constant temperature and light intensity in the laboratory.
3.2. Flow-Through Chamber Measurement in the Laboratory
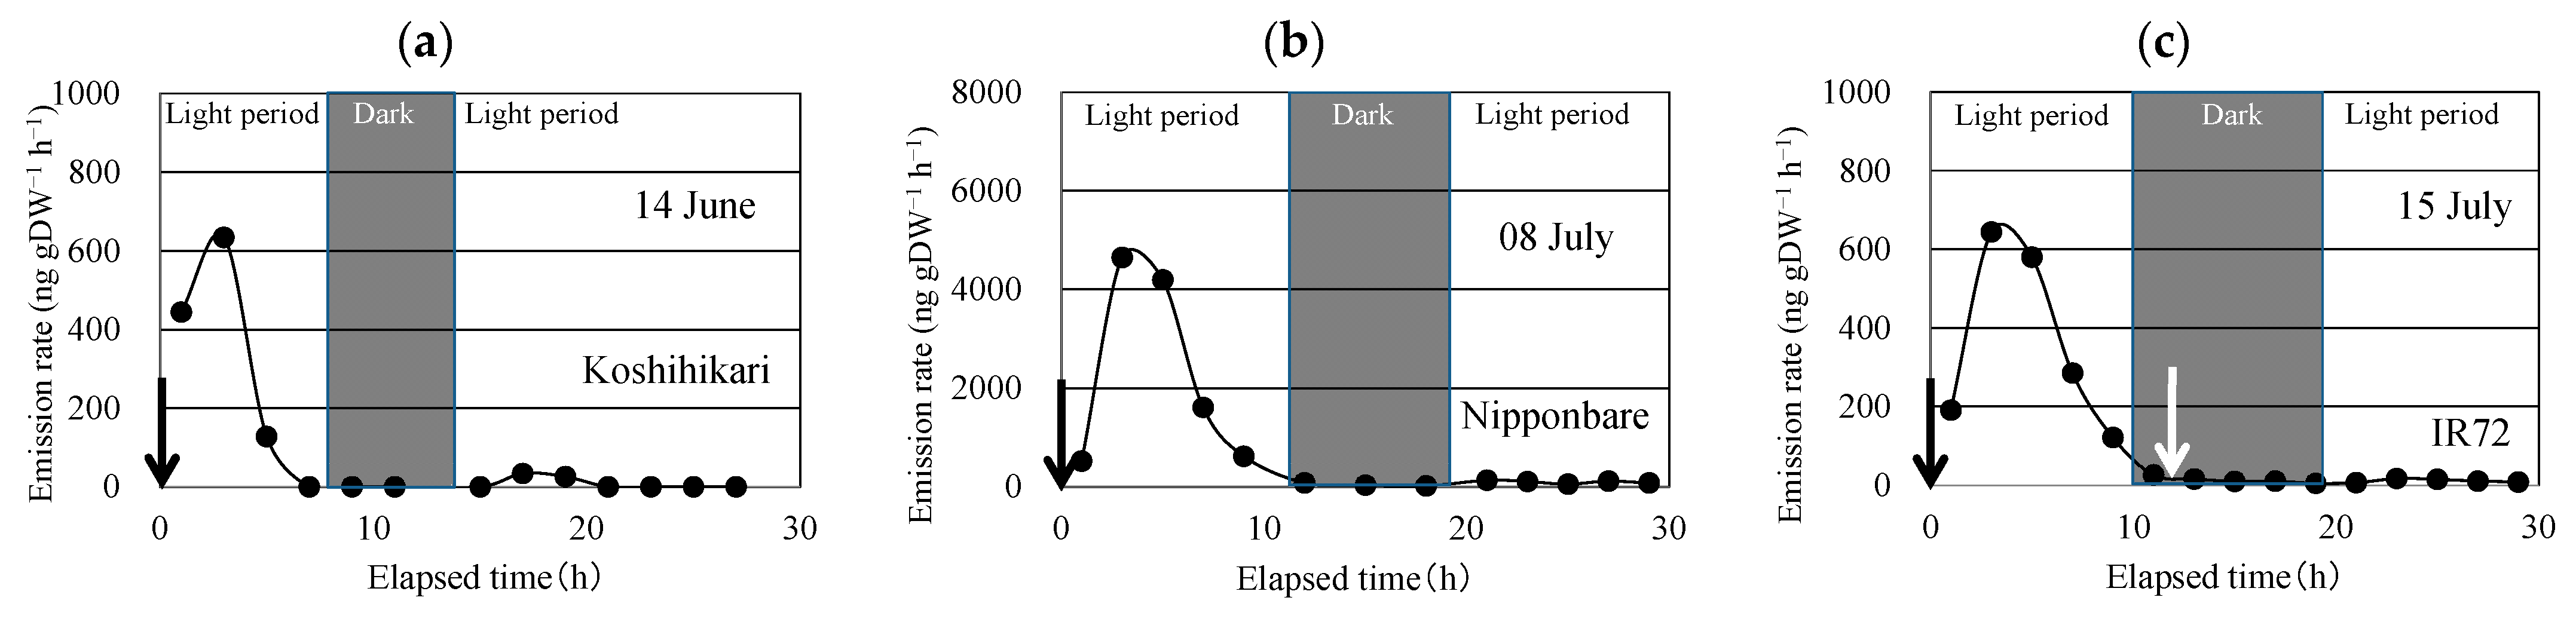
After enclosing the above-ground part of the rice plant, linalool was emitted (Figure 2). Linalool emissions peaked in the second sampling, conducted 3 h after enclosing the plant. The emission rate decreased rapidly and became <1/30 of the peak emission during the dark period. During the next light period, the linalool emission rate increased slightly, but it was <1/10 of the peak emission rate (Table 2). Similar time courses of linalool emission were observed for the three replications for each of the three cultivars.
To check if the enclosing procedure in the dark period enhances linalool emissions, the enclosure bag was removed and immediately applied to the same part of the rice plant (Figure 2). No linalool emission bursts were observed in any of the three cultivars.
3.3. Additional Wind Velocity Experiment
As linalool emission was enhanced 3 h after the completion of the enclosure, wind velocity was averaged for 2 h between 2 and 4 h before the measurements and plotted against the linalool emission rate of the above-ground parts of the rice plant (Figure 3). No clear relationship was observed between them. The effect of the maximum wind velocity was also considered; however, no clear relationship was observed between the maximum wind velocity and linalool emission rate.
3.4. Flux above the Rice Paddy
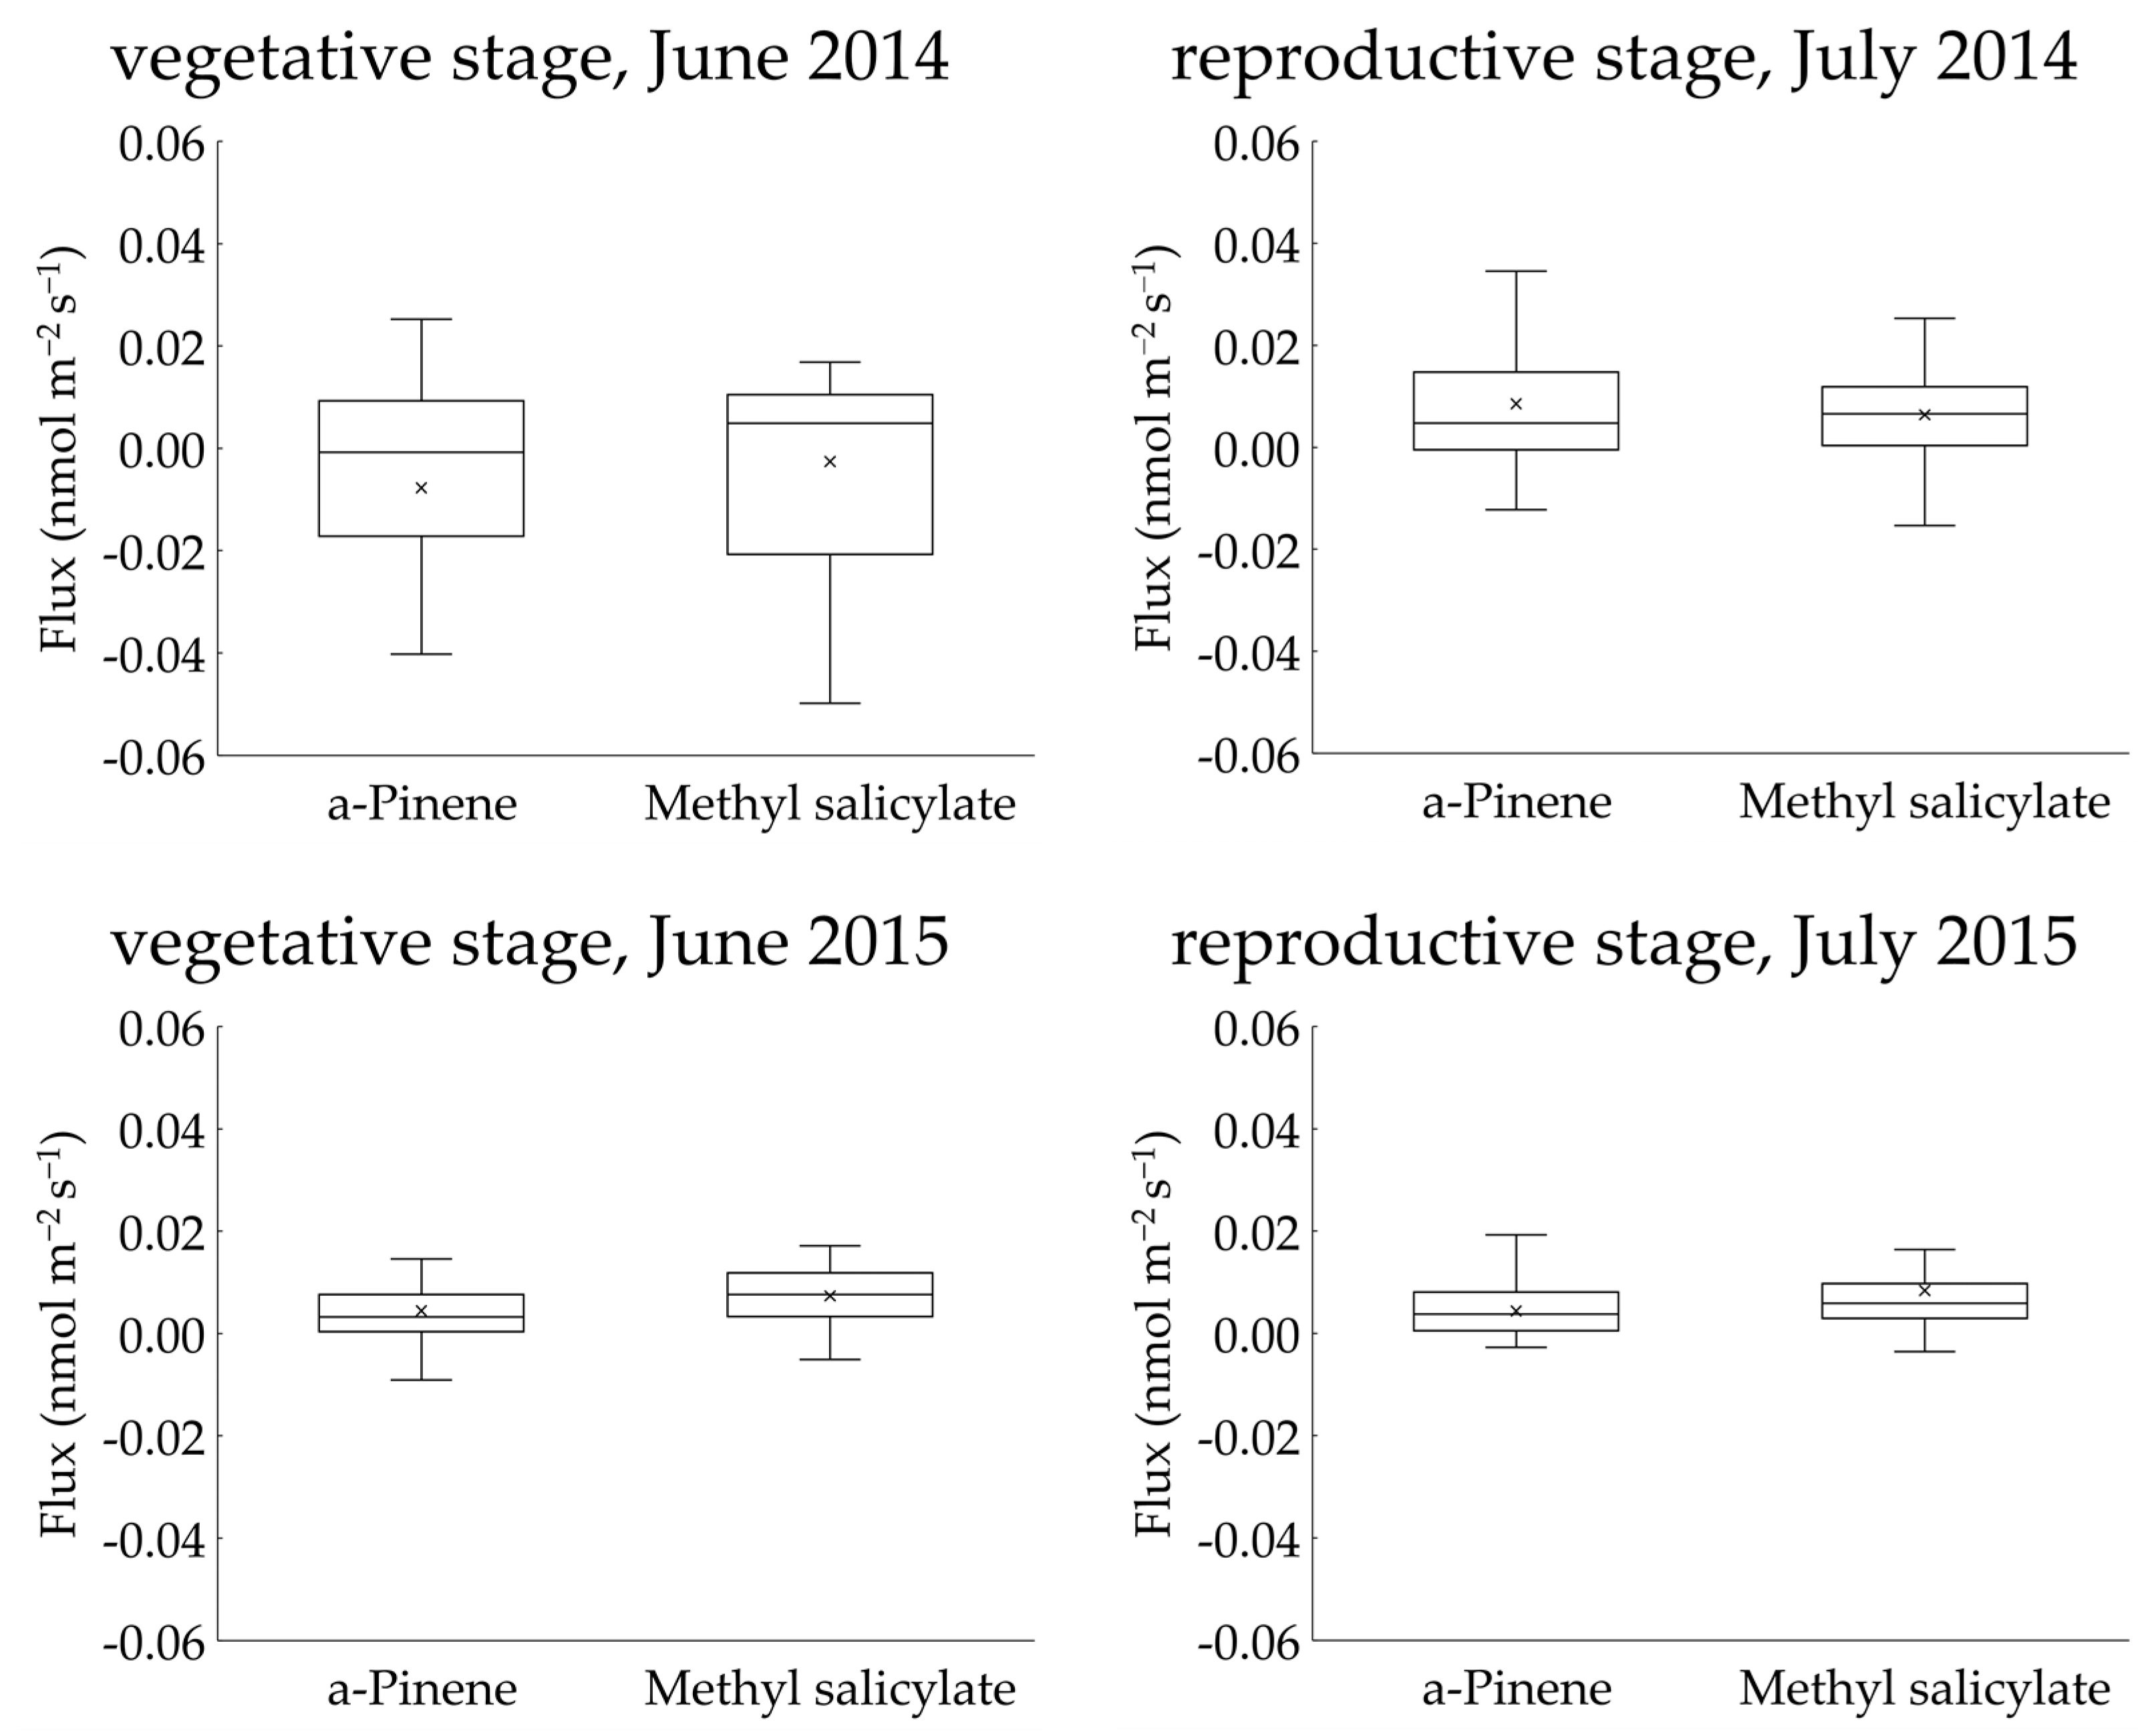
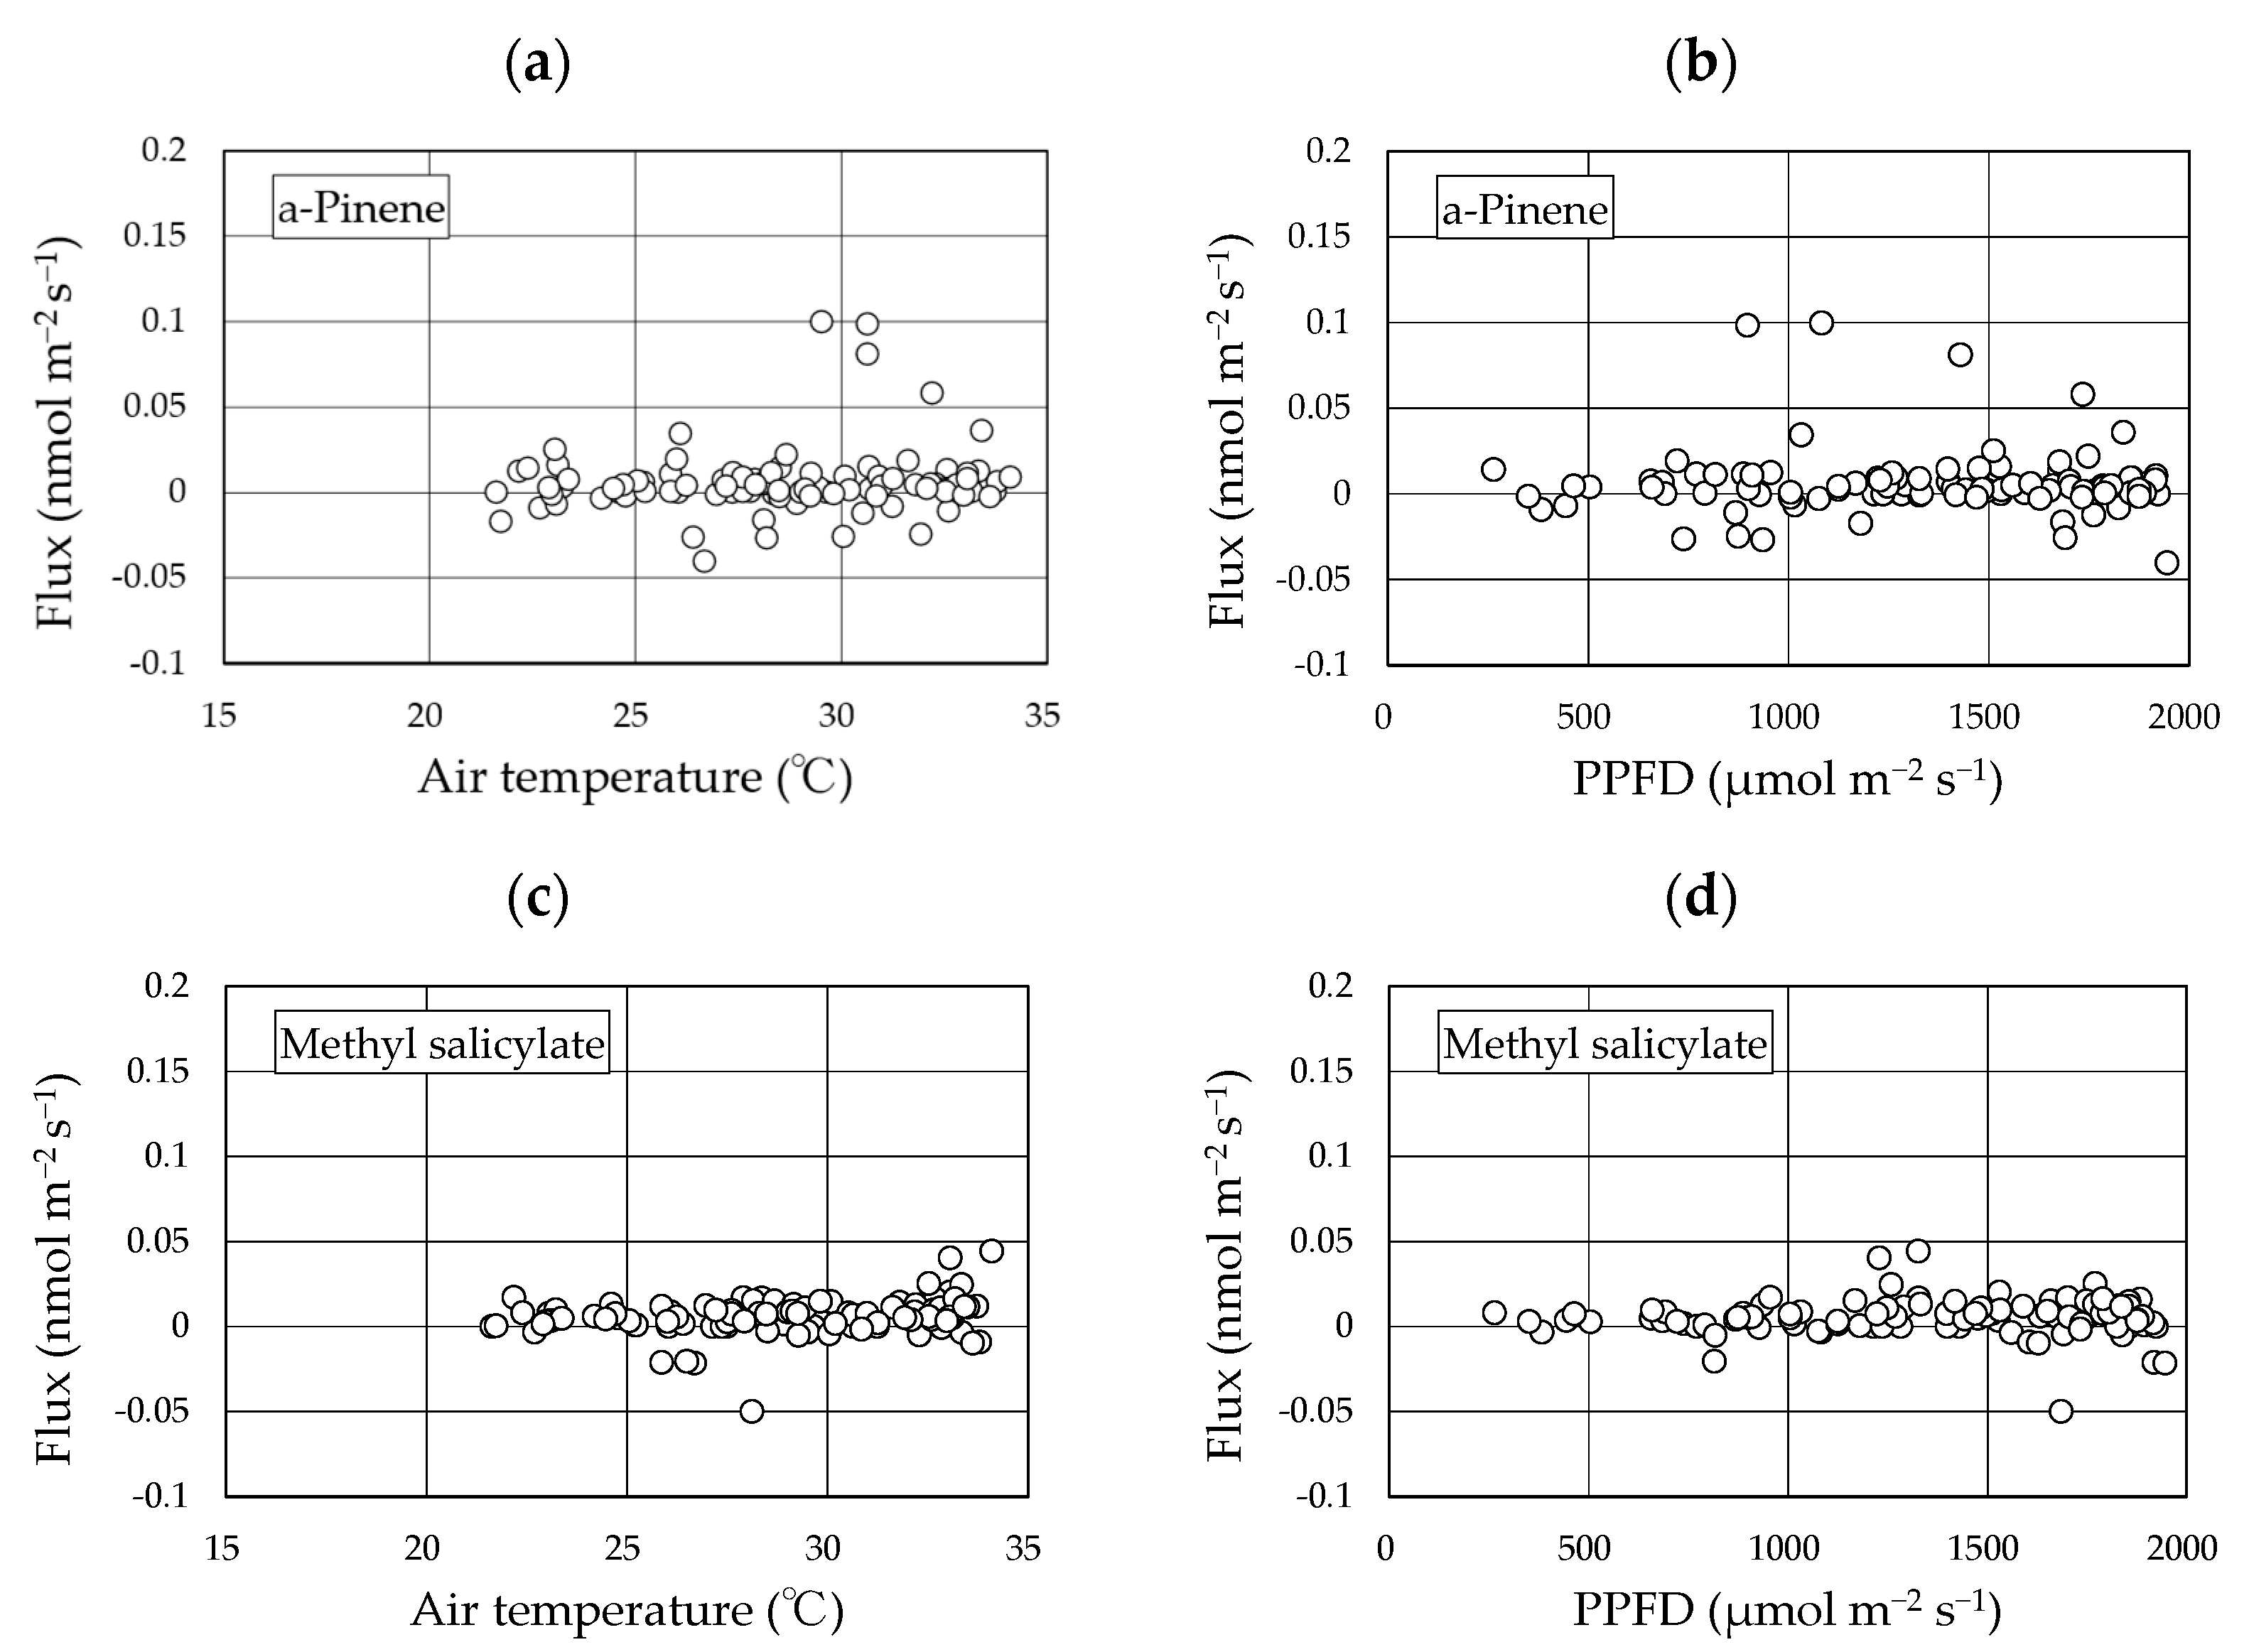
Two BVOCs, α-pinene and methyl salicylate, were detected in the gases collected using the REA method. Linalool was not detected in any of the sampled gases. The concentrations of α-pinene and methyl salicylate in the upward and downward air samples were low and were reported as <4 nmol m−3 in all cases (Figures S1–S4). The calculated fluxes of the two compounds from the “Koshihikari” paddy were very low and were reported as <0.03 nmol m−2 s−1 in most cases (Figure 4). The accumulated data (103 datasets) across two years provided mean ± 95% confidence intervals of α-pinene and methyl salicylate fluxes of 0.006 ± 0.004 nmol m−2 s−1 and 0.006 ± 0.002 nmol m−2 s−1, respectively. These ranges did not include a negative value range, suggesting that the two compounds were emitted from rice paddies. No clear diurnal variation in fluxes was observed for either compound. Using the accumulated data, the relationship of the two compounds against leaf temperature and PPFD were examined (Figure 5). No clear relationships were found in any of these cases. Therefore, we did not apply the light- and temperature-dependent G93 models [23] to determine the basal flux of α-pinene under standard conditions (30 °C leaf temperature and 1000 µmol m−2 s−1 PPFD). Instead, the average flux of α-pinene (0.006 nmol m−2 s−1) was used for further consideration in the Discussion section. Except for α-pinene, no terpenoids were detected in the sampled gases.
4. Discussion
Several species of monoterpenes and sesquiterpenes have been reported to be produced in rice seedlings under biotic and oxidative stress [23,24,25,26,27], and by the induction of chemicals [28,29]. The major genes that encode terpenoids include OsTPS3 [28], OsTPS19 [30], OsTPS20 [26], and OsTPS24 [29]. Linalool burst emission was observed in rice seedlings after wounding damage [31,32], with the highest emission rate found 6 h after wounding [32]. These biochemical studies demonstrated the existence of genes involved in terpenoid production and reported that the emission of some terpenoids occasionally occurs after several stresses. However, the above-cited studies used young rice seedlings at the ≤6 leaf stage or ≤3 weeks old because of their suitability for laboratory experiments. From an atmospheric chemistry point of view, a quantitative study of the terpenoid fluxes of adult rice plants at the vegetative and reproductive growth stages under normal growing conditions is important to evaluate the contribution of terpenoid emissions from rice to regional and global terpenoid emission inventories and atmospheric chemistry, including photochemical ozone formation.
In our flow-through chamber experiments, linalool emission was enhanced 2–3 h after enclosing the above-ground parts. Linalool is a monoterpene alcohol produced from geraniol diphosphate (GPP) via the action of linalool synthases [33]. Mechanical wounding and insect attacks can induce the gene expression of linalool synthases and enhance linalool emission [17,33,34]. As there was no visible injury to the leaves and stems, we could not estimate the degree of the stimulus or damage caused by touching rice leaves and stems. However, the results clearly showed that this stimulus enhanced linalool emission. These results are consistent with those of the aforementioned studies using young seedlings. The linalool emission rate was ≤0.02 µg gDW−1 h−1 on a dry weight basis on the second day. This value is approximately 1/20 of the monoterpene emission rate of the rice plants reported by Bao et al. [13]. However, we could not confirm that linalool was emitted under normal growth conditions because of the short-term experiment (two days).
It is reported that intense winds may cause mechanical damage to leaves and branches of trees, resulting in an increase in monoterpene emissions [35]. Therefore, we suspected that leaf rubbing by the wind influenced linalool emissions. As the enclosing stimulus enhanced linalool emission 2–3 h later, gas sampling was initiated within 20 min after the pots were moved to the laboratory and enclosed with the bag to eliminate the effect of the handling stimulus on the linalool burst. Up to a wind velocity of 4 ms−1 recorded in the period 2–4 h before the gas sampling, no linalool burst was observed, suggesting that leaf rubbing by gentle wind does not enhance the emission of linalool. As we did not consider strong wind stimuli mostly caused by typhoons, we cannot conclude that a wide range of wind velocities has no effect on linalool emission. However, we conclude that gentle winds have no effect on the emission.
In our laboratory experiment, the second stimulus applied during the dark period did not enhance the linalool emission. This means that compound production occurs only during the light period, probably because a series of reactions requires light energy [36,37]. Our flow-through chamber measurements over two years suggest that the stimulus enhances linalool emission from rice plants, and non-contact measurement methods should be employed to obtain reliable quantitative values of monoterpene emission rates of rice plants.
Therefore, we employed REA sampling based on tower flux measurements as a noncontact measurement method. REA sampling was repeated for more than 100 replicates over two years, and we determined the average α-pinene flux to be 0.006 nmol m−2 s−1 on a land-area basis. This is two to three orders of magnitude lower than the fluxes reported for various trees [4]. No other terpenoids, including linalool, were detected in the atmosphere above the rice paddy. This is the first report to provide a quantitative value of monoterpene flux that was micrometeorologically measured above rice paddies.
In the flow-through chamber measurement, including the above-ground parts of the rice plant, monoterpene alcohol linalool was detected. However, it was not detected in the atmosphere collected above the rice paddies. As shown in Figure 2, linalool emission was triggered by the touch stimulus and drastically dropped within 10 h. Under normal rice paddy conditions, wind-flutter rice leaves might be a weak stimulus. However, wind at a speed of <4 m/s recorded in our measurement period did not induce linalool production by rice leaves (data not shown). This was consistent with our flow-through chamber experiment. Instead, monoterpene species α-pinene was emitted from the rice paddies. As we did not detect α-pinene in the flow-through chamber including the same cultivar, the emission source could be weeds grown in the ridge between the rice fields included in the footprint of the flux tower. Further measurements are required to determine the source of the α-pinene.
Here, we compared this flux value with the land-area-based emission rate converted from the dry-weight-basis emission rate. Bao et al. [13] reported that the monoterpene emission rate under standard conditions (30 °C leaf temperature and 1000 µmol m−2 s−1 PPFD) was 0.40 µg gDW−1 h−1. The dry matter of the above-ground parts of rice at the mature stage was reported to be ~1760 g m−2 [18], ~1600 g m−2 in Japan [13], and ~680 g m−2 in China [38]. Assuming that the representative value is ~1500 g m−2, the monoterpene emission rate reported by Bao et al. [13] can be converted to 600 µg m−2 h−1 (1.2 nmol m−2 s−1) on a land-area basis. Our α-pinene flux (0.006 nmol m−2 s−1) was 1/200 of that value. They reported that monoterpene emissions from rice paddies in the Kinki region in Japan corresponded to 5% of the total monoterpene emissions in this region, which significantly contributed to photochemical oxidant formation in urban and suburban areas [14]. Using our flux data, the monoterpene emissions from rice paddies corresponded to <0.025% of the total monoterpene emissions in this region. This may be negligibly small.
Redeker et al. [11] employed a static chamber method for the rice cultivar “Cocodrie” grown in a rice paddy and detected no emissions of monoterpenes, but a trace amount of isoprene (~3.7 µg m−2 h−1). They attributed the isoprene emissions to algae in the paddy water. The value corresponds to 0.015 nmol m−2 s−1, which is very low and of the same order as our results. Our previous report using a closed chamber system detected a trace amount of linalool from the rice cultivar “Mutsuhomare”, but did not detect any terpenoids from “Nipponbare”, “TCM916”, “Tangin-bodzu”, or “Waito C” [12]. Winer et al. [10] detected no emission of isoprene or monoterpenes from a rice “M202” paddy in California using the flow-through chamber method. These three reports suggest that terpenoid emissions from rice and rice paddies are negligible, which is consistent with the results of the present study.
5. Conclusions
Linalool was emitted from the above-ground parts of the three rice cultivars 2–3 h after the parts were enclosed in a transparent FEP bag. The emission rates gradually decreased with time, but the compound was emitted over two days. As the touching stimulus enhanced linalool emission from rice plants and the effect might continue for more than two days, a non-contact measurement method, that is, the micrometeorological flux measurement method, was employed to obtain reliable quantitative values of the monoterpene emission rates of the rice plants. Linalool was not detected; however, α-pinene was detected in the atmosphere above the rice paddy. The obtained flux of α-pinene was 0.006 nmol m−2 s−1 on a land-area basis, with a confidence interval of 0.004 nmol m−2 s−1, suggesting that the compound is significantly emitted from rice paddies. We provided micro-meteorologically measured terpenoid flux data above a rice paddy for the first time, which is more reliable because the flux measurement method is non-invasive. Although the α-pinene emission rate on a land-area basis converted from the flux data is very low, these data can be used to establish precise regional and global BVOC inventories, and atmospheric chemical reaction models.
Supplementary Materials
The following supporting information can be downloaded at: https://www.mdpi.com/article/10.3390/environments10030049/s1, Figure S1: Concentrations of α-pinene and methyl salicylate in upward (red) and downward (blue) airstreams measured in June 2014 (n = 15); Figure S2: Concentrations of α-pinene and methyl salicylate in upward (red) and downward (blue) airstreams measured in July 2014 (n = 34); Figure S3: Concentrations of α-pinene and methyl salicylate in upward (red) and downward (blue) airstreams measured in June 2015 (n = 27); Figure S4: Concentrations of α-pinene and methyl salicylate in upward (red) and downward (blue) airstreams measured in July 2015 (n = 27).
Author Contributions
Conceptualization, A.T.; methodology, K.O., S.Y. and A.T.; software, A.T.; validation, A.T.; formal analysis, A.T.; investigation, T.S., M.Y., K.O., S.Y. and A.T.; resources, A.T.; data curation, M.Y., T.S. and A.T.; writing—original draft preparation, A.T.; writing—review and editing, K.O., S.Y. and A.T.; visualization, A.T.; supervision, A.T.; project administration, A.T.; funding acquisition, A.T. All authors have read and agreed to the published version of the manuscript.
Funding
This work was funded by JSPS KAKENHI, grant numbers 19H04257 and 19H05666.
Informed Consent Statement
Not applicable.
Data Availability Statement
Data available upon request.
Acknowledgments
The authors would like to thank Kan K. and Mochizuki T. for partly assisting in the filed measurements.
Conflicts of Interest
The authors declare no conflict of interest.
References
- Arneth, A.; Monson, R.K.; Schurgers, G.; Niinemets, U.; Palmer, P.I. Why are estimates of global terrestrial isoprene emissions so similar (and why is this not so for monoterpenes)? Atmos. Chem. Phys. 2008, 8, 4605–4620. [Google Scholar] [CrossRef] [Green Version]
- Boucher, O.; Randall, D.; Artaxo, P.; Bretherton, C.; Feingold, G.; Forster, P.; Kerminen, V.-M.; Kondo, Y.; Liao, H.; Lohmann, U.; et al. Clouds and Aerosols. In Climate Change 2013: The Physical Science Basis. Contribution of Working Group I to the Fifth Assessment Report of the Intergovernmental Panel on Climate Change; Stocker, T.F., Qin, D., Plattner, G.-K., Tignor, M., Allen, S.K., Doschung, J., Eds.; IPCC: Geneva, Switzerland, 2013; pp. 571–657. [Google Scholar]
- Atkinson, R.; Arey, J. Gas-phase tropospheric chemistry of biogenic volatile organic compounds: A review. Atmos. Environ. 2003, 37, S197–S219. [Google Scholar] [CrossRef]
- Tani, A.; Mochizuki, T. Review: Exchanges of volatile organic compounds between terrestrial ecosystems and the atmosphere. J. Agric. Meteorol. 2021, 77, 66–80. [Google Scholar] [CrossRef]
- Shrivastava, M.; Cappa, C.D.; Fan, J.; Goldstein, A.H.; Guenther, A.B.; Jimenez, J.L.; Kuang, C.; Laskin, A.; Martin, S.T.; Ng, N.L.; et al. Recent advances in understanding secondary organic aerosol: Implications for global climate forcing. Rev. Geophys. 2017, 55, 509–559. [Google Scholar] [CrossRef] [Green Version]
- Statistics Bureau of Japan 2021 Areas Cultivated Fields, The Portal Site of Official Statistics of Japan. Available online: http://www.maff.go.jp/j/tokei/kouhyou/sakumotu/index.html (accessed on 13 July 2022). (In Japanese).
- Food and Agriculture Organization. Rice Market Monitor; FAO: Rome, Italy, 2018; Volume XXI, pp. 1–36. [Google Scholar]
- Zhang, G.; Xiao, X.; Dong, J.; Xin, F.; Zhang, Y.; Qin, Y.; Doughty, R.B.; Moore, B. Fingerprint of rice paddies in spatial–temporal dynamics of atmospheric methane concentration in monsoon Asia. Nat. Commun. 2020, 11, 554. [Google Scholar] [CrossRef] [PubMed] [Green Version]
- Akiyama, H.; Yagi, K. Direct N2O emissions from rice paddy fields: Summary of available data. Glob. Biogeochem. Cycles 2005, 19, 1–10. [Google Scholar] [CrossRef]
- Winer, A.; Arey, J.; Atkinson, R.; Aschmann, S.; Long, W.; Morrison, C.; Olszyk, D. Emission rates of organics from vegetation in California’s central valley. Atmos. Environ. 1992, 26A, 2647–2659. [Google Scholar] [CrossRef]
- Redeker, K.R.; Meinardi, S.; Blake, D.; Sass, R. Gaseous emissions from flooded rice paddy agriculture. J. Geophys. Res. 2003, 108, 4386. [Google Scholar] [CrossRef] [Green Version]
- Tani, A.; Saito, T.; Hayashi, K.; Sato, H.; Arai, R.; Tako, Y.; Kiyota, M. Identification of volatile organic compounds emitted from and measurement of the rates of ethylene emission, photosynthesis and transpiration of dwarf rice species. CELSS J. 1999, 12, 15–20. [Google Scholar]
- Bao, H.; Kondo, A.; Kaga, A.; Tada, M.; Sakaguti, K.; Inoue, Y.; Shimoda, Y.; Narumi, D.; Machimura, T. Biogenic volatile organic compound emission potential of forests and paddy fields in the Kinki region of Japan. Environ. Res. 2008, 106, 156–169. [Google Scholar] [CrossRef]
- Bao, H.; Lal, K.; Kondo, A.; Kaga, A.; Inoue, Y. Modeling the in fluence of biogenic volatile organic compound emissions on ozone concentration during summer season in the Kinki region of Japan. Atmos. Environ. 2010, 44, 421–431. [Google Scholar] [CrossRef]
- Hatanaka, A. The biogeneration of green odour by green leaves. Biochemistry 1993, 5, 1201–1218. [Google Scholar] [CrossRef]
- Fall, R.; Karl, T.; Jordon, A.; Lindinger, W. Biogenic C5VOCs: Release from leaves after freeze-thaw wounding and occurrence in air at a high mountain observatory. Atmos. Environ. 2001, 35, 3905–3916. [Google Scholar] [CrossRef]
- Engelberth, J.; Alborn, H.T.; Schmelz, E.A.; Tumlinson, J.H. Airborne signals prime plants against insect herbivore attack. Proc. Natl. Acad. Sci. USA 2004, 101, 1781–1785. [Google Scholar] [CrossRef] [Green Version]
- Saito, M.; Miyata, A.; Nagai, H.; Yamada, T. Seasonal variation of carbon dioxide exchange in rice paddy field in Japan. Agric. For. Meteorol. 2005, 135, 93–109. [Google Scholar] [CrossRef]
- Miyata, A.; Iwata, T.; Nagai, H.; Yamada, T.; Yoshikoshi, H.; Mano, M.; Ono, K.; Han, G.H.; Harazono, Y.; Ohtaki, E.; et al. Seasonal variation of carbon dioxide and methane fluxes at single cropping paddy fields in central and western Japan. Phyton-Ann. Rei Bot. 2005, 45, 89–97. [Google Scholar]
- Mano, M.; Miyata, A.; Nagai, H.; Yamada, T.; Ono, K.; Kobayashi, Y.; Saito, M. Random Sampling Errors in CO2Fluxes Measured by the Open-Path Eddy Covariance Method and their Influence on Estimating Annual Carbon Budget. J. Agric. Meteorol. 2007, 63, 67–79. [Google Scholar] [CrossRef] [Green Version]
- Businger, A.; Oncley, P. Flux measurement with conditional sampling. J. Atmos. Ocean. Technol. 1990, 7, 349–352. [Google Scholar] [CrossRef]
- Mochizuki, T.; Tani, A.; Takahashi, Y.; Saigusa, N.; Ueyama, M. Long-term measurement of terpenoid flux above a Larix kaempferi forest using a relaxed eddy accumulation method. Atmos. Environ. 2014, 83, 53–61. [Google Scholar] [CrossRef]
- Guenther, A.B.; Zimmerman, P.R.; Harley, P.C.; Monson, R.K.; Fall, R. Isoprene and monoterpene emission rate variability: Model evaluations and sensitivity analyses. J. Geophys. Res. 1993, 98, 12609–12617. [Google Scholar] [CrossRef] [Green Version]
- Yuan, J.S.; Ko, T.G.; Wiggins, G.; Grant, J. Molecular and genomic basis of volatile-mediated indirect defense against insects in rice. Plant J. 2008, 55, 491–503. [Google Scholar] [CrossRef]
- Taniguchi, S.; Hosokawa-Shinonaga, Y.; Tamaoki, D.; Yamada, S.; Akimitsu, K.; Gomi, K. Jasmonate induction of the monoterpene linalool confers resistance to rice bacterial blight and its biosynthesis is regulated by JAZ protein in rice. Plant Cell Environ. 2014, 37, 451–461. [Google Scholar] [CrossRef]
- Lee, G.W.; Lee, S.; Chung, M.; Jeong, Y.S.; Chung, B.Y. Rice terpene synthase 20 (OsTPS20) plays an important role in producing terpene volatiles in response to abiotic stresses. Protoplasma 2015, 252, 997–1007. [Google Scholar] [CrossRef] [PubMed]
- Lee, G.W.; Chung, M.; Kang, M.; Chung, B.Y.; Lee, S. Direct suppression of a rice bacterial blight (Xanthomonas oryzae pv. oryzae) by monoterpene (S)-limonene. Protoplasma 2016, 253, 683–690. [Google Scholar] [CrossRef]
- Cheng, A.X.; Xiang, C.Y.; Li, J.X.; Yang, C.Q.; Hu, W.L.; Wang, L.J.; Lou, Y.G.; Chen, X.Y. The rice (E)-β-caryophyllene synthase (OsTPS3) accounts for the major inducible volatile sesquiterpenes. Phytochemistry 2007, 68, 1632–1641. [Google Scholar] [CrossRef]
- Yoshitomi, K.; Taniguchi, S.; Tanaka, K.; Uji, Y.; Akimitsu, K.; Gomi, K. Rice terpene synthase 24 (OsTPS24) encodes a jasmonate-responsive monoterpene synthase that produces an antibacterial γ-terpinene against rice pathogen. J. Plant Physiol. 2016, 191, 120–126. [Google Scholar] [CrossRef]
- Chen, Y.; Guo, Y.; Chen, X.; Chen, H.; Yuan, J.S.; Tobias, G.K.; Guo, Z.; Chen, F. The rice terpene synthase gene OsTPS19 functions as an (S)-limonene synthase in planta, and its overexpression leads to enhanced resistance to the blast fungus Magnaporthe oryzae. Plant Biotechnol. J. 2018, 16, 1778–1787. [Google Scholar] [CrossRef] [Green Version]
- Valea, I.; Motegi, A.; Kawamura, N.; Kawamoto, K.; Miyao, A.; Ozawa, R. The rice wound-inducible transcription factor RERJ1 sharing same signal transduction pathway with OsMYC2 is necessary for defense response to herbivory and bacterial blight. Plant Mol. Biol. 2022, 109, 651–666. [Google Scholar] [CrossRef] [PubMed]
- Mujiono, K.; Tohi, T.; Sobhy, I.S.; Hojo, Y.; Shinya, T.; Galis, I. Herbivore-induced and constitutive volatiles are controlled by different oxylipin-dependent mechanisms in rice. Plant Cell Environ. 2021, 44, 2687–2699. [Google Scholar] [CrossRef] [PubMed]
- Mei, X.; Liu, X.; Zhou, Y.; Wang, X.; Zeng, L.; Fu, X.; Li, J.; Tang, J.; Dong, F.; Yang, Z. Formation and emission of linalool in tea (Camellia sinensis) leaves infested by tea green leafhopper (Empoasca (Matsumurasca) onukii Matsuda). Food Chem. 2017, 237, 356–363. [Google Scholar] [CrossRef]
- Piesik, D.; Weaver, D.K.; Peck, G.E.; Morrill, W.L. Mechanically-injured wheat plants release greater amounts of the secondary metabolites linalool and linalool oxide. J. Plant Prot. Res. 2006, 46, 29–39. [Google Scholar]
- Haase, K.B.; Jordan, C.; Mentis, E.; Cottrell, L.; Mayne, H.R.; Talbot, R.; Sive, B.C. Changes in monoterpene mixing ratios during summer storms in rural New Hampshire (USA). Atmos. Chem. Phys. 2011, 11, 11465–11476. [Google Scholar] [CrossRef] [Green Version]
- Sasaki, K.; Takase, H.; Matsuyama, S.; Kobayashi, H.; Matsuo, H.; Ikoma, G.; Takata, R. Effect of light exposure on linalool biosynthesis and accumulation in grape berries. Biosci. Biotechnol. Biochem. 2016, 80, 2376–2382. [Google Scholar] [CrossRef] [PubMed] [Green Version]
- He, J.; Halitschke, R.; Schuman, M.C.; Baldwin, I.T. Light dominates the diurnal emissions of herbivore-induced volatiles in wild tobacco. BMC Plant Biol. 2021, 21, 401. [Google Scholar] [CrossRef] [PubMed]
- Gnyp, M.L.; Miao, Y.; Yuan, F.; Ustin, S.L.; Yu, K.; Yao, Y.; Huang, S.; Bareth, G. Field Crops Research Hyperspectral canopy sensing of paddy rice aboveground biomass at different growth stages. Field Crops Res. 2014, 155, 42–55. [Google Scholar] [CrossRef]
Figure 1.
Time course of the emission rate of linalool (a–c), and its relationships with photosynthetic photon flux density (PPFD) (d–f) and leaf temperature (g–i). Black arrow indicates the time when the aboveground parts of the rice plant were enclosed in the bag.
Figure 1.
Time course of the emission rate of linalool (a–c), and its relationships with photosynthetic photon flux density (PPFD) (d–f) and leaf temperature (g–i). Black arrow indicates the time when the aboveground parts of the rice plant were enclosed in the bag.

Figure 2.
Time course of the emission rate of linalool from Koshihikari (a), Nipponbare (b), and IR72 (c) under constant temperature and light intensity during the light period and under constant temperature during the dark period. Black arrow indicates the time when the aboveground parts of the rice plant were enclosed in the bag. White arrow indicates the time when the bag was removed and then applied again to the above-ground parts.

Figure 3.
Relationships between linalool emission rate of rice against mean (a) and maximum wind velocity (b). The mean wind velocity was averaged for 2 h between 2 and 4 h before the measurements. The maximum wind velocity was the maximum value of 1 min averages recorded 2–4 h before the measurements.

Figure 4.
Interquartile ranges of upward fluxes of α-pinene and methyl salicylate measured above a rice paddy using the REA method.
Figure 4.
Interquartile ranges of upward fluxes of α-pinene and methyl salicylate measured above a rice paddy using the REA method.

Figure 5.
Relationship between the fluxes of two compounds and environmental factors. The data used here include accumulated flux data over two years. (a): α-pinene flux vs air temperature; (b): α-pinene flux vs. PPFD; (c): methyl salicylate flux vs. air temperature; (d): methyl salicylate flux vs. PPFD.


Table 1.
Range of maximum emission rates of linalool observed after enclosing rice leaves and stems with the enclosure bag.
Table 1.
Range of maximum emission rates of linalool observed after enclosing rice leaves and stems with the enclosure bag.
| Measurement Day | Koshihikari | Nipponbare | IR72 |
|---|---|---|---|
| 27 July | 8 | 4 | |
| 28 July | 48 | 349 | |
| 29 July | 162 | 58 | |
| 30 July | 931 | 1259 | |
| 31 July | 72 | 11 | |
| 3 August | 580 | 105 | |
| 4 August | 493 | 528 |
Unit: ng gDW−1 h−1.
Table 2.
Average emission rate of linalool during the light period on the second day.
| Measurement Day | Koshihikari | Nipponbare | IR72 |
|---|---|---|---|
| 14 June | 9 ± 15 | 0 | 0 |
| 8 July | 13 ± 3 | 98 ± 31 | 23 ± 8 |
| 15 July | 11 ± 2 | 16 ± 5 | 12 ± 4 |
Unit: ng gDW−1 h−1.
Disclaimer/Publisher’s Note: The statements, opinions and data contained in all publications are solely those of the individual author(s) and contributor(s) and not of MDPI and/or the editor(s). MDPI and/or the editor(s) disclaim responsibility for any injury to people or property resulting from any ideas, methods, instructions or products referred to in the content. |
© 2023 by the authors. Licensee MDPI, Basel, Switzerland. This article is an open access article distributed under the terms and conditions of the Creative Commons Attribution (CC BY) license (https://creativecommons.org/licenses/by/4.0/).
Share and Cite
MDPI and ACS Style
Tani, A.; Sakami, T.; Yoshida, M.; Yonemura, S.; Ono, K. Emission of Terpenoid Compounds from Rice Plants. Environments 2023, 10, 49. https://doi.org/10.3390/environments10030049
AMA Style
Tani A, Sakami T, Yoshida M, Yonemura S, Ono K. Emission of Terpenoid Compounds from Rice Plants. Environments. 2023; 10(3):49. https://doi.org/10.3390/environments10030049
Chicago/Turabian StyleTani, Akira, Takuya Sakami, Mariko Yoshida, Seiichiro Yonemura, and Keisuke Ono. 2023. "Emission of Terpenoid Compounds from Rice Plants" Environments 10, no. 3: 49. https://doi.org/10.3390/environments10030049
Note that from the first issue of 2016, this journal uses article numbers instead of page numbers. See further details here.