Article

Combining Constructed Wetlands and UV Photolysis for the Advanced Removal of Organic Matter, Nitrogen, and Emerging Pollutants from Wastewater

Department of Chemistry, Faculty of Sciences & CICA, University of A Coruña, Galiza, E-15008 A Coruña, Spain
*
Author to whom correspondence should be addressed.
Environments 2023, 10(3), 35; https://doi.org/10.3390/environments10030035
Submission received: 25 January 2023 / Revised: 17 February 2023 / Accepted: 18 February 2023 / Published: 23 February 2023
(This article belongs to the Special Issue Recent Advances in Technologies for Water and Wastewater Treatment)

Abstract

:
This study reports the performance of a three-step lab-scale system including a hybrid digester (HD), a vertical flow (VF) constructed wetland, and a photodegradation (PD) lamp, with two different arrangements regarding the position of the recirculation point. In addition to total suspended solids (TSS), chemical oxygen demand (COD), and nitrogen compounds, removal of the following pollutants was investigated: paracetamol (ACE), ofloxacin (OFL), caffeine (CAF), ketoprofen (KET), ibuprofen (IBU), clofibric acid (ACB), bisphenol A (BPA), and sotalol (SOT). An excellent performance of HD was achieved on the elimination of TSS (82.2 ± 18.5% on average) and COD (63.9 ± 4.1%). TSS and COD removal increased to 91.2 ± 0.4% and 83.4 ± 2.9%, respectively, for the combined HD–VF system. Ammonia removal was 57.0 ± 7.8% in the VF unit while significant denitrification occurred in the HD. The overall HD–VF–PD system achieved mean removals of 100% for OFL, KET, SOT, and IBU, 98 ± 2% for ACE, 87 ± 8% for CAF, 81 ± 38% for ACB and 26 ± 9% for BPA. The removal of ACE, OFL, CAF, and IBU was mostly by biodegradation in the HD and VF units while the PD unit was responsible for the removal of KET, ACB, and SOT.

1. Introduction

Constructed wetlands (CWs) are non-conventional wastewater treatment systems whose removal mechanisms are based on natural processes. The main CW limitations are clogging of granular media and large land area requirements. In this regard, anaerobic digesters (ADs) have been used as a CW pre-treatment in order to reduce total suspended solids (TSS) and organic matter loading rate, consequently decreasing the required footprint [1,2,3,4]. The combination of CW as green technologies and advanced “grey” technologies also facilitates the reduction of the land footprint in the adoption of nature-based solutions and improves the removal of emerging pollutants as well as disinfection, facilitating decentralized treatment schemes and water reuse in urban and non-urban settlements [5]. As in the case of advanced grey treatment technologies, some schemes combining green-grey technologies can achieve treated effluent quality for diverse water reclamation purposes, including reuse as potable water [5,6].
Combined AD-vertical subsurface flow (VF) CW systems can reach simultaneous organic matter and nitrogen removal through efficient nitrification and denitrification [7]. In addition, nitrogen removal efficiency can be enhanced by recirculating the nitrified effluent from the VF to the denitrifying AD [8,9]. The literature on the combined AD-VF system with recirculation is scarce. However, the first works point to significant results of simultaneous organic matter and nitrogen removal due to advanced denitrification in the AD and nitrification in the VF unit [7,10,11]. However, an important aspect to be taken into account during the operation of the combined AD-VF system with recirculation is the possible biomass washout from the digester, which worsens its efficiency and increases the risk of VF clogging. Thus, new AD models with better biomass retention have to be investigated. In this sense, a hybrid digester (HD) consisting of an up-flow anaerobic sludge bed, with an anaerobic filter coupled to it, resulted in improved organic matter removal and reduced biomass washing, without the need for an additional unit dedicated to sludge retention [12].
On the other hand, the concern about the occurrence of emerging pollutants (EPs) has increased nowadays due to its widespread presence in the environment and the potential harm they can cause to the environment and human health [13,14]. EPs includes pharmaceuticals, personal care products, pesticides, nanoparticles, flame retardants, plasticisers, musks, algal toxins, and chlorinated paraffin. Although identified in low concentrations (µg·L−1 or ng·L−1), EPs can accumulate in the environment and in living organism. Part of these compounds are not eliminated in conventional wastewater treatment plants, with the subsequent entry into the water cycle [15,16,17].
Researchers have recently reported the removal of EPs by different types of CWs: horizontal subsurface flow (HF) [18,19], VF [20,21], surface flow (SF) [22,23], hybrid CWs [20], as well as combined AD-CWs [24]. Photodegradation (PD) occurs in SF [24,25] whilst it is absent from subsurface flow intensified CWs. On the other hand, the use of ultraviolet lamps is a very popular method for disinfecting drinking water, and it might be a useful post-treatment stage in removal EPs.
The elimination of EPs in CW is mainly influenced by redox potential, temperature, hydraulic retention time (HRT), influent concentration, and exposure to sunlight. The removal mechanisms are multiple and complex, including absorption, sedimentation, aerobic biodegradation, anaerobic and anoxic biodegradation, photodegradation, phytoremediation, and volatilization [26,27,28,29]. Hybrid systems that combine different aerobic and anaerobic environments and exposure to light offer the best results, even at high organic loading rates [24,27,30]. These three conditions (anaerobiosis, aerobiosis, and photoexposure) occur specifically in the HF, VF, and SF wetlands, respectively. Hybrid systems can combine these three types of units, although the main tendency is to combine HF and VF units without SF units [31,32]. This is due to the need to reduce the area required by intensifying the processes necessary for the elimination of organic matter and nutrients, based on the combination of anaerobic/anoxic and aerobic environments. Thus, natural PD is restricted in many hybrid combinations. Then, when the advanced elimination of many EPs is sought, interest arises in completing the hybrid systems based on aerobic and anaerobic stages with advanced PD technologies [5,26,33].
PD (usually as photocatalytic processes) was used as both pre-treatment [34,35] and post-treatment [36,37] in combination with CWs to treat different kind of wastewater such as municipal sewage, pesticide-polluted wastewaters, or textile wastewater. The order of treatment is crucial, and optimal configurations can vary according to the nature of the contaminants [38]. Recently, Castellar [5] reviewed the combination of green-grey technologies for wastewater reuse in urban sites. These authors found a very small number of articles that address the coupled operation of these technologies, but they emphasize the growing interest observed in recent years. The predominant configuration consisted of CWs followed by advanced oxidation processes and electrochemical processes. The order in which these technologies are applied can vary, with grey technologies mainly being used as the last step to achieve complete disinfection and removal of persistent compounds, although there are also cases where grey technologies go ahead to remove recalcitrant materials or make them more biodegradable for their subsequent removal in green technologies. The use of final effluent recirculation has very few examples in these combined systems [5].
Gonzalo [39] applied for the first time ultraviolet radiation (UV) for the removal of EPs from CW effluents. As reported by these authors, the UV cell completed the removal of ibuprofen and ketoprofen, being mainly responsible for the removal of sotalol, clofibric acid, and bisphenol A. On the other hand, UV post-treatment was common and effective for the complete disinfection of the effluent end [5], a key aspect for most water reuse options. Both the disinfection capacity of UV radiation and the interesting results found by Gonzalo [39] in the removal of emerging pollutants are indicative of the complementarity of these technologies.
The main hypothesis of the present study is that a PD unit using UV radiation can efficiently complete the removal of several EPs that are not removed or are only partially removed in high loading CWs hybrid systems, which generally are designed for advanced nitrogen removal (i.e., including anaerobic/anoxic and aerobic steps).
In this way, the aim of this work is to study the integrate performance of a combined three step HD–VF–PD system with effluent recirculation regarding the simultaneous removal of organic matter, nitrogen, and EPs from raw municipal wastewater (MW). A UV lamp was selected as PD step. Two different arrangements were checked: (a) (HD–VF)R-PD, in which recirculation was provided from the effluent of the VF unit; and (b) (HD–VF–PD)R, in which recirculation was provided from the PD unit. In addition to TSS, chemical oxygen demand (COD), and nitrogen, the removal of several emerging pollutants was investigated.

2. Materials and Methods

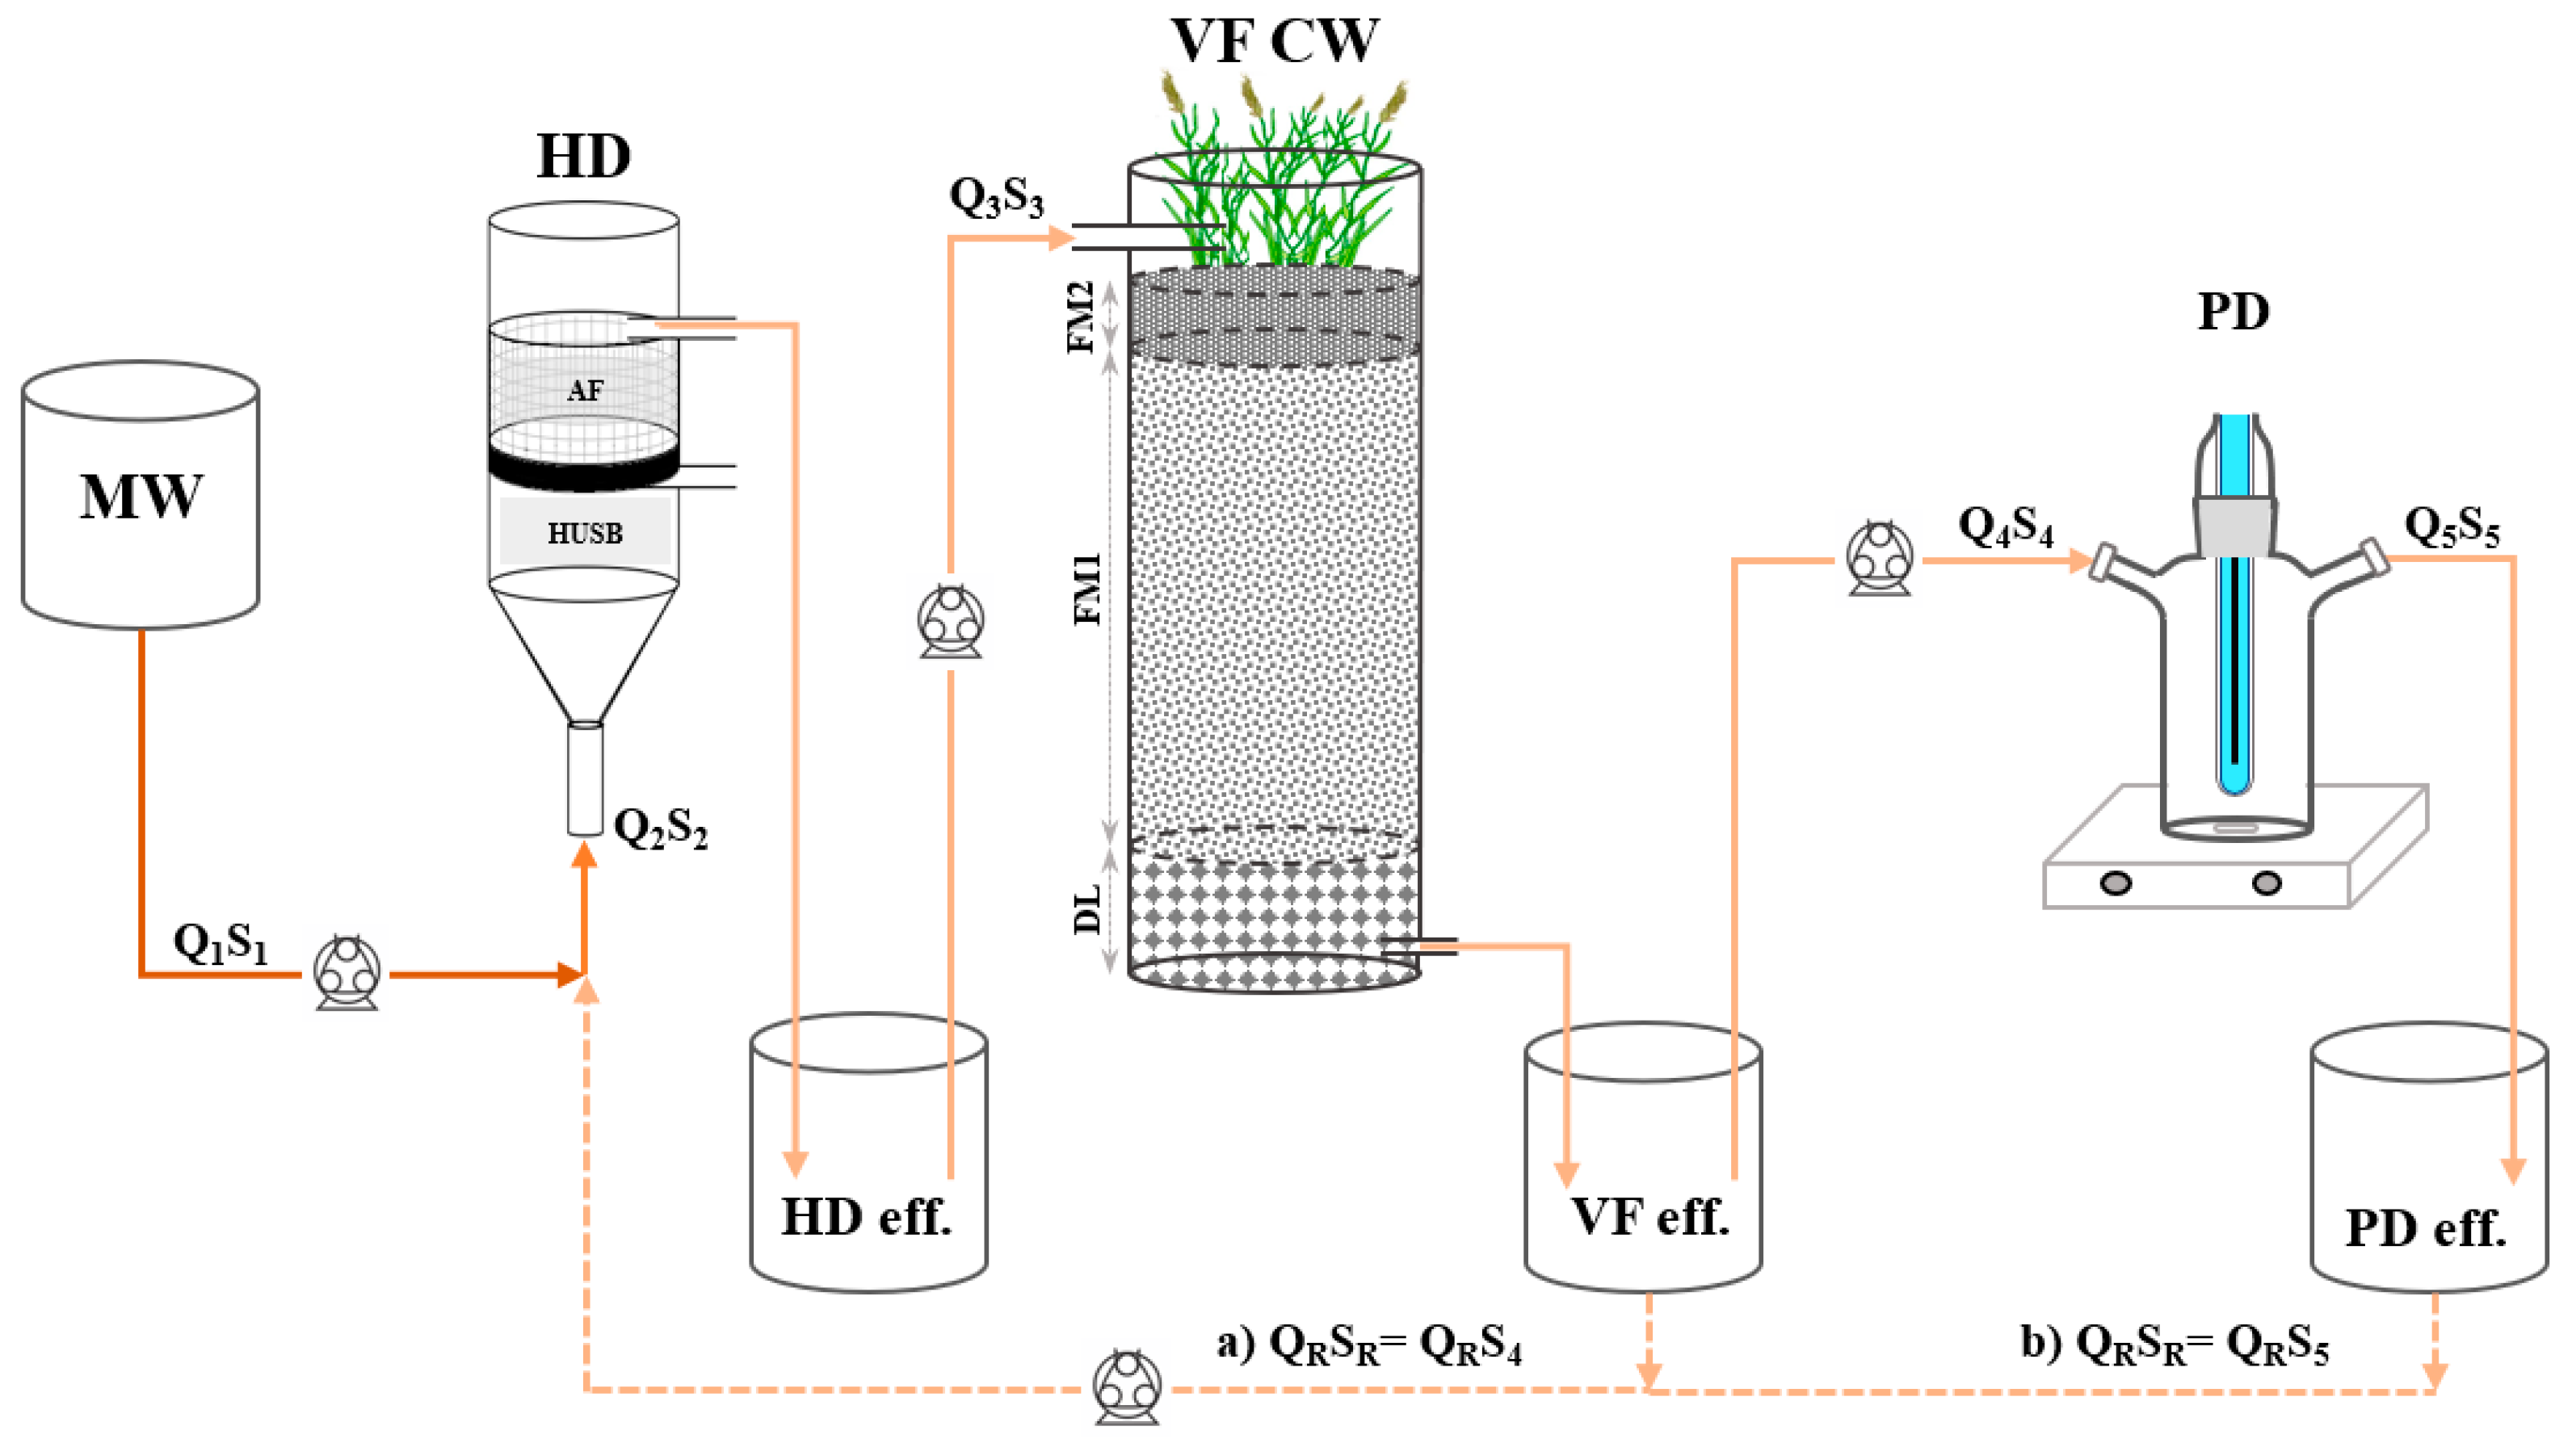
2.1. Combined HD–VF–PD Lab-Scale System

The system was constituted by three lab-scale units connected in series (Figure 1). The first one consisted of a hybrid anaerobic digester (HD), combining a hydrolytic up-flow sludge bed zone (HUSB) and an anaerobic filter zone (AF). The volume of the HD was 879 cm3 with a cross-sectional area of 50.3 cm3. In addition, the anaerobic filter zone was constituted by gravel of 4–8 mm particle size as filter medium. The second unit was a VF. Placed as indicated in Figure 1, the main filtering medium (FM1) consisted of 4–8 mm gravel (with a height of 35 cm and porosity 30.5%), whilst the top 6 cm layer (FM2) consisted of 1–2 mm sand (porosity 18.4%). Beneath the filtering media, there was a 6 cm drainage layer of 8–16 mm gravel (porosity 36.5%). The internal diameter of the VF unit was 13.9 cm, and the active height was 47 cm. The VF unit was planted with six plants of Iris pseudacorus. Finally, the last lab unit was an ultraviolet lamp used for the PD process. This lamp (Heraeus TNN 15/32 low-pressure Hg-vapor lamp) emitted at a wavelength of 254 nm and was placed in a cell of 8 cm of diameter and 700 cm3 of active volume. The PD cell was provided with continuous mixing by means of a magnetic stirrer. Effluent recirculation was provided either from the VF unit effluent or from the PD unit effluent. The influent tank was kept at 9.5 °C.

2.2. Operational Characteristics

In order to determine the viable operating conditions of the HD, this unit was subject to a previous period of adaptation and stabilization of three months. During this previous period, the HD was operated as a single unit at HRT decreasing from approximately 14 to 9 h. In addition, different resting cycles were applied to the HD (7/7 days ON/OFF and 4/3 days ON/OFF). During resting periods, the wastewater in the HD was drained to a level below the AF zone in order to allow the aeration of the accumulated biomass.
During this study, the combined HD–VF system operated for 4 months as indicated in Table 1. The operation time was divided in five periods (Table 1): I, start-up of combined HD–VF system and recycling of the VF effluent; II, the PD cell was connected; III, the recycled flow from VF was doubled, increasing the recirculation rate; IV, the recirculation point was changed to the PD effluent; V, increased influent flow and changing the point of recirculation to VF effluent. Applied recirculation ratio QR/Q1 ranged from 1.0 to 2.5.
The HD unit received the raw influent (MW from A Coruña area, obtained at the entrance of the municipal treatment plant after pre-treatment), and the recycled VF effluent (or PD effluent during period IV). Peristaltic pumps (Dinko Instruments D-21 V) were used to feed the system units. The HD was fed through 16 pulses per day, which lasted 50 min each. HRT in HD ranged from 3.6 to 6.3 h. During resting periods (3 days a week), the AF zone was aerated by draining the required wastewater volume.
The HD effluent entered the VF above the top layer FM2 through 12 pulses per day. Resting of 3 days on a weekly basis was applied to the HD and VF units. The effluent VF was pumped to the PD cell during periods II, III, and IV at 6 pulses per day, when the ultraviolet lamp was switched on. The flow and duration of each pulse to the PD cell were selected in order to reach the established HRT. The pulse lasted for 50 min during periods II, III, and IVa and for 25 min during period IVb, whilst the HRT was 0.50 (II, III, and IVa) and 0.25 (IVb) h.
Overall hydraulic loading rate (HLR) ranged from 166 to 292 mm·d−1 (without recirculation) and overall surface loading rate (SLR) ranged from 45 to 194 g COD m−2·d−1 (42–110 g BOD5 m−2·d−1) due to variations in influent flow and concentration (Table 1). Ammonia SLR ranged from 5.9 to 15.7 g N·m−2·d−1. Total nitrogen load was estimated to be slightly higher than ammonia load because of partial ammonification of the influent nitrogen.
On the other hand, the EPs studied were representative of the different type of compounds commonly found in MW. The selection of EPs was determined by their difficulty to be removed from the different environments present in each of the three treatment units. Thus, the following EPs were investigated: paracetamol (ACE), ofloxacin (OFL), caffeine (CAF), ketoprofen (KET), ibuprofen (IBU), clofibric acid (ACB), bisphenol A (BPA), and sotalol (SOT). According to Gonzalo [39], MW collected from the same wastewater treatment plant as the present MW showed sufficiently high and representative concentrations of IBU, CAF, and ACE while the concentrations for BPA, OFL, ACB, and KET were variable and low. Under this assumption, an external addition of five lower concentration EPs was added to ensure their presence. Thus, the supplement consisted of a stock solution in methanol composed of BPA, OFL, SOT, ACB, and KET with a final concentration in the wastewater of 2 µg·L−1. The concentration of the eight EPs was monitored at the inlet and outlet of each unit during periods II to IV.

2.3. Sampling and Analytical Methodology

Influent samples were obtained from each shipment of wastewater whilst effluent composite samples from each unit were integrated daily. All samples were analyzed in the laboratory for TSS, volatile suspended solids (VSS), COD and biological organic demand (BOD5) following Standard Methods [40]. Allylthiourea was used as nitrification inhibitor in BOD5 assays. The pH values were measured, in situ and daily, using a HANNA HI 208 electrode. Nitrate, nitrite, and ammonium determination was carried out by ionic chromatography (930 Compact IC Flex de Metrohm). Total inorganic nitrogen (TIN) was estimated as the sum of nitrite, nitrate, and ammonia nitrogen. Solids accumulation in the HD as well as its specific methanogenic activity (SMA) and specific denitrifying activity (SDA) were determined periodically. The determination of EPs was carried out by chromatographic analysis by HPLC/HRMS (Thermo Scientific LTQ Orbitrap, from Thermo Fisher Scientific, Bremen, Germany). Samples were previously filtered with 0.2 µm hydrophilic Teflon filter and then diluted 1:1 with the mobile phase.
To obtain the hydraulic capacity and infiltration rate of VF unit, flow profiles of a complete dosing cycle were determined every 2–3 weeks during the study.

2.4. Solids Accumulation and Biological Assays

Solids accumulation in the HD was determined periodically. This included the biomass retained on the gravel of AF zone and the sludge generated in the HUSB zone. Duplicate samples of the AF gravel (about 20 g w. m. each) were taken after draining the system at the beginning of some resting periods, the removed gravel being replaced by an equivalent amount of clean gravel. These samples were used to determine the moisture content and the accumulated volatile solids. On the other hand, it was also determined the volume of the sludge bed in the HUSB zone and its TSS and VSS content.
Batch assays were carried out in order to determine the SMA and the SDA. SMA was determined on sludge samples from the HUSB zone following the method described by Soto [41], by using 120 mL vials with 50 mL of liquid volume and approximately 2.5 g VSS·L−1. Neutralized acetic acid was used as substrate, at a concentration of 500 mg COD·L−1. SDA assays were carried out in 250 mL vials with 100 mL of liquid volume. SDA was determined on both HUSB sludge and AF gravel samples by using approximately 1 and 2.5 g VSS·L−1, respectively. Substrates for SDA assays were neutralized acetic acid (300 mg COD·L−1) and KNO3 (50 mg N·L−1). A pre-feeding with 20% of substrate concentration was applied for SDA assays 24 h before the measuring run. Macro and micronutrients and reducing agent were added in all assays as indicated by Ferreiro and Soto [42]. All assays were carried out in duplicated at 20 °C in a thermostatic chamber and monitored following the headspace gas analysis method [41]. Denitrifying activities were obtained from the rate of nitrate removal after analysis by ionic chromatography.

2.5. Comparative Study of Eps Removal by PD Cell Treating Raw and Pre-Treated Effluent

In addition, a comparative study was carried out on the direct application of the PD cell to the raw MW and the treated effluent from the combined HD–VF system. For this, initially the photoreactor was loaded with 700 mL of MW and the feeding was continued for 140 min applying a flow of 1400 mL·h−1 (HRT of 0.5 h). To determine the effect of PD cell on EPs, the effluent of the last 50 min (that is, after an operation time exceeding 3 times the HRT) was collected and the concentration of EPs was determined. The test was performed in duplicate with raw MW and HD–VF effluent, both supplemented with 2 μg·L−1 of OFL, KET, ACB, BPA, and SOT.

3. Results and Discussion

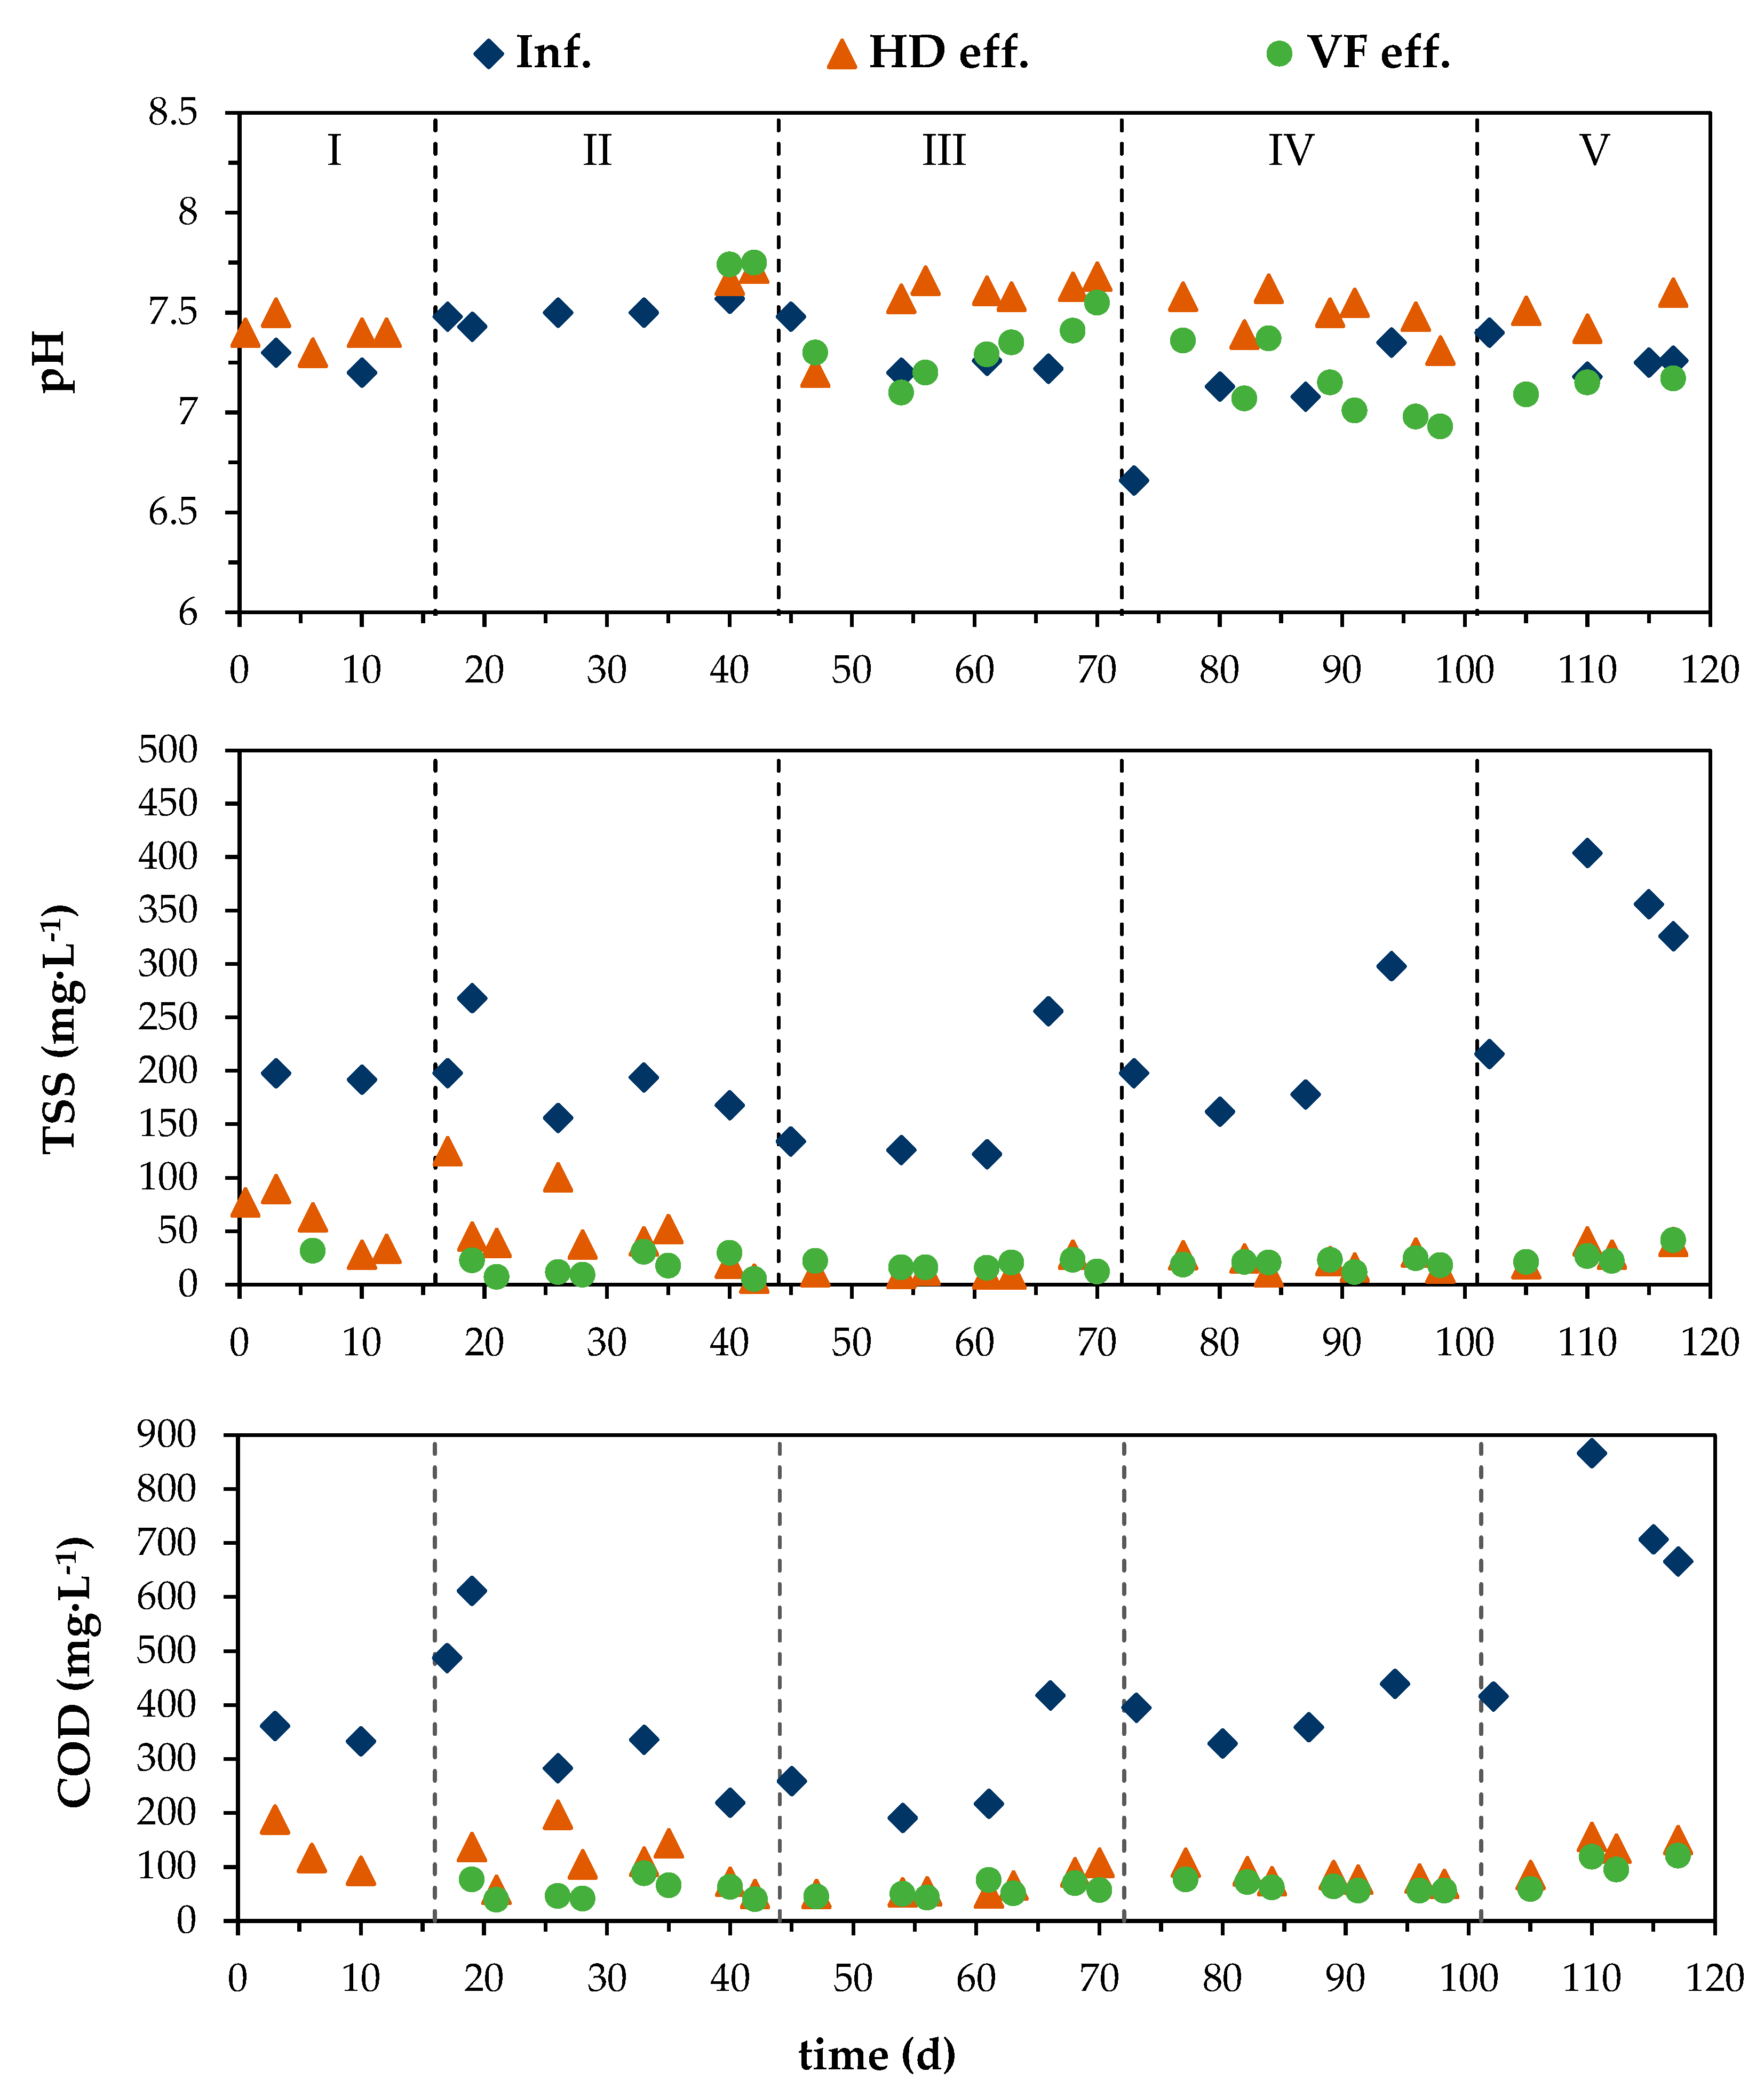
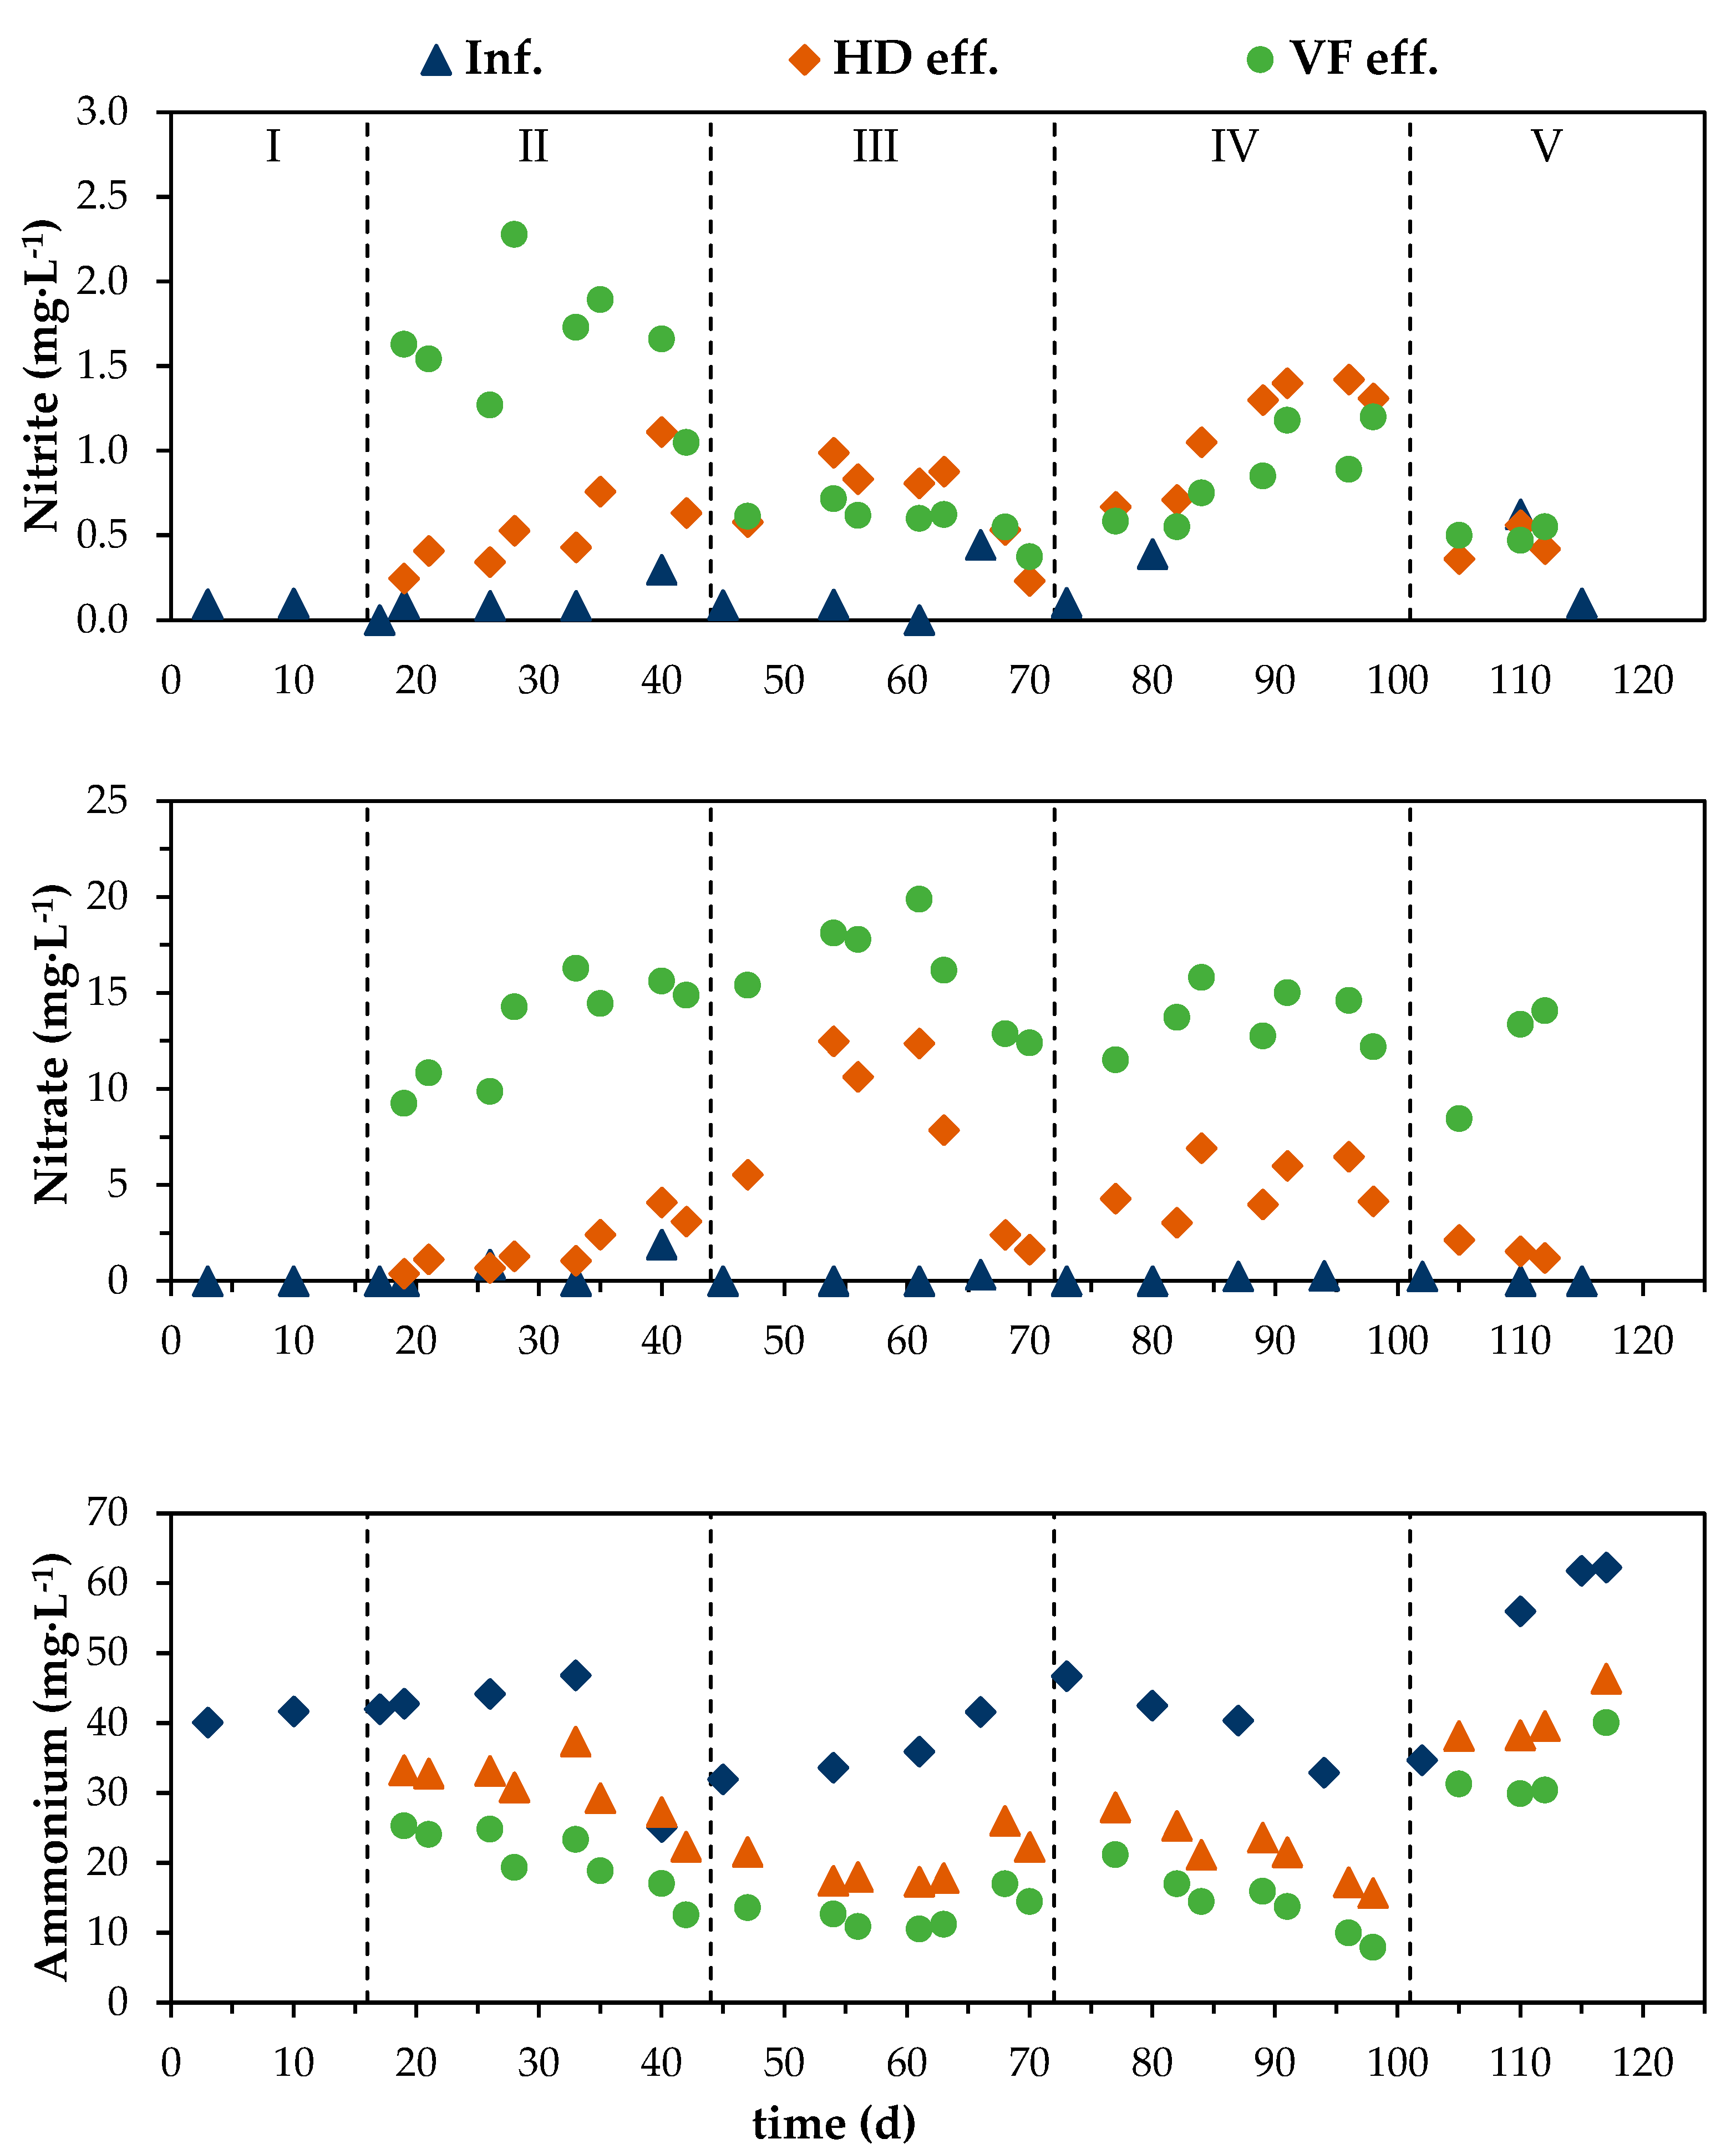
3.1. Evaluation of the Performance of HD and VF Units Regarding Organic Matter and Nitrogen Removal

The performance of HD–VF system was evaluated in terms of water quality parameters related to suspended solids, organic matter, and nitrogen compounds. Figure 2 shows the influent and effluent concentrations of HD and VF units for TSS and COD as well as pH values throughout the study. Figure 3 shows the influent and effluent concentrations for nitrogen compounds. The impact of PD unit on these parameters was reduced and will be described in Section 3.2.
Influent and effluents pH values were maintained practically constant at 6.7–7.5, although HD effluent had slightly higher pH values than the VF effluent during the study. The HD was designed to operate under hydrolytic-acidogenic conditions, so an effluent with a more acidic pH value would be expected due to the generation of volatile fatty acids [43]. However, recirculation of nitrified effluent back to the HD resulted in denitrification processes taking place within the HD unit and thus increasing the alkalinity compared to the nitrification process in the VF unit [44]. This behavior may be a consequence of the denitrification process that occurs in the HD unit and, therefore, increases the alkalinity regarding the nitrification process of the VF unit. In addition, a drop in pH of VF effluent was not observed as would be expected in systems of this type [7,9,31,45].
As for particulate matter, whilst the influent concentration to the HD was in range of 122–404 mg TSS·L−1, the HD effluent concentrations during periods I and II was below 125 mg TSS·L−1 (mean value of 54 mg TSS·L−1). In period III and following, TSS in HD effluent dropped to less than 41 mg TSS·L−1 (mean value of 21 mg TSS·L−1), indicating a very good retention of particulate matter. According to Winter and Goetz [46], VFs should receive a maximum influent concentration of 100 mg TSS·L−1 to avoid clogging, so the HD met this recommendation with an overall average effluent concentration of 34 ± 29 mg TSS·L−1. Overcome the start-up (period I), during periods II to V, the TSS effluent concentration from the VF unit was highly stable and averaged 19 ± 8 mg TSS·L−1. However, this concentration was only slightly lower than the HD effluent concentration, indicating a reduced retention of particulate matter in the VF unit. Total COD had an evolution similar to that of TSS, mean values for periods II to V decreasing from 424 ± 191 (influent) to 94 ± 39 (HD effluent) and 65 ± 22 (VF effluent) mg COD·L−1. During period V, the influent concentration of TSS and COD clearly increased (Figure 2) as well as the HLR (Table 1). However, the increase in TSS and COD effluent concentration was limited indicating the good performance of the combined HD–VF system at high SLR.
The evolution of nitrite over time was irregular, as an intermediate in the nitrogen cycle, but showed in general low values (Figure 3). The highest values of nitrite have been recorded during period II (1.6 mg N·L−1 on average for the effluent of the VF unit) whilst during the rest of the study the average concentration was maintained at values below 1.1 mg N·L−1, following the sequence HD effluent ≥ VF effluent > raw influent.
Nitrate concentration was low in the raw influent, increased in the HD effluent (values below 12.5 mg NO3-N·L−1) because of the recirculated VF effluent, and was higher in the VF effluent due to the nitrification processes (Figure 3). At the beginning of period II, the concentration of nitrate increased in the VF effluent and was maintained in the range of 12–19 mg NO3-N·L−1 during the rest of the study. On the same time, the concentration of ammonia in VF effluent progressively decreased during period II until reach steady values of 13–14 mg NH4+-N·L−1 in the next periods III and IV. This trend indicated an improvement of nitrification capacity of VF unit during period II that was maintained during periods III and IV. During period V, the ammonia concentration of VF effluent clearly increased (Figure 3), which was due to the increase in raw influent concentration and HLR during this period. The treatment capacity and performance of both the HD and VF units will be evaluated in depth in Section 3.3.
Ammonia was mainly removed in the VF unit by the nitrification process. The drop of ammonia concentration from the raw influent to the HD effluent was due to the mixing with the recirculated VF effluent. Thus, ammonia concentration in HD effluent mainly followed the trends of raw influent and VF effluent ammonia (Figure 3). However, nitrate concentration in HD effluent varied largely, the highest values were obtained during period III (7.6 ± 4.5 mg NO3-N·L−1) followed by period IV (5.0 ± 1.5 mg NO3-N·L−1). The higher values of nitrate concentration in HD effluent during periods III and IV could be probably due to the higher recirculation rate (QR/Q1 = 2.2–2.4, Table 1) than during the period II (QR/Q1 = 1.0). In addition to the different recirculation rates, nitrate removal can be influenced by the COD/N ratio [47], since in the denitrification processes a consumption of up to 8.6 mg COD could be required for the conversion of 1 mg NO3 to N2 [48]. The COD/TIN ratio was lower in periods III and IV in relation to periods II and V. COD/TIN ratio (note that we are considering TIN and not total nitrogen, because organic N was not determined in this study) for raw wastewater by period was: 10.1 (I), 9.3 (II), 7.5 (III), 9.2 (IV), and 12.2 (V), which was favorable to denitrification. However, as a result of COD removal in HD and VF units and effluent recirculation, net COD/TIN ratio in HD influent was substantially low, ranging from 3.8–4.9 at periods III and IV, to 5.4–5.7 at periods II and V. Furthermore, high HLR and SLR during period V probably favored anoxic conditions in the HD and nitrate removal, explaining the lower nitrate concentration in HD effluent during period V, in spite of the high loading rates and concentration.

3.2. Effect of PD Unit on Suspended Solids, Organic Matter, and Nitrogen Conversion

The PD cell had a poor effect on TSS, COD and ammonium removal, as the overall removal rates only increased by about 1% for the combined HD–VF–PD system with respect to the HD–VF system. In terms of concentration, the PD lamp showed a reduced effect on several parameters. With respect to the VF effluent, the PD effluent underwent an increase in pH from 7.2 to 7.4, and a reduction of 8.2% TSS, 2.7% VSS, 6.5% total COD, and 9.4% soluble COD, while the reduction was below 1.3% for nitrate and ammonium. In fact, the differences between VF effluent and PD effluent concentrations for all these parameters were not significant (p > 0.1). Only the variation of nitrite concentration throughout the PD unit showed significant differences (p = 0.002), increasing from 0.74 ± 0.27 (VF effluent) to 1.08 ± 0.17 (PD effluent) mg NO2-N·L−1.

3.3. Overall Treatment Performance and Unit Contribution

Figure 4 shows the evolution of performance of the overall system and the contribution of each unit to the overall removal of TSS, COD and ammonia. Considering periods II to V, the overall system removed about 90–92% of TSS (91.2 ± 0.4% on average), 79–85% of COD (83.4 ± 2.9% on average), 39–66% of NH4+-N (52.7 ± 13.2% on average), and 35–45% of TIN (36.0 ± 7.1% on average). Most of the TSS and COD was removed by the HD unit, reaching about 82.2 ± 18.5% TSS and 63.9 ± 4.1% COD removal, whereas the VF unit contributed with 8.4 ± 19.4% TSS and 19.0 ± 5.6% COD removal, respective to the raw influent. These results agree with previous research using combined AD-CW systems where the AD unit was primarily responsible for the removal of influent TSS and COD [1,2,49,50,51]. For example, in the combined AD-VF system with recirculation employed by Gonzalo [7], the AD unit was the one that removed most of the TSS and COD, although these authors obtained lower removal efficiencies (between 59% and 77% of TSS and between 63% and 74% of COD) treating MW. In this way, in the present study using the HD as the first system unit, the VF unit received a low organic matter concentration, which is of high interest to prevent clogging and prolong its lifetime. Some authors pointed out that the maximum values for organic and solids loading to VF are around 20 g COD·m−2·d−1 [46,52,53] and around 5 g TSS·m−2·d−1 [46]. These values were reached during period III and approached during period IV.
On the other hand, ammonia nitrogen was removed only in the VF unit, which reached 57.0 ± 7.8% on average, whilst the HD increased ammonia by 3.7%, probably due to the completion of the ammonification process, as other authors have noted [54,55]. As indicated in Section 3.1 on ammonium concentration, the percentage of ammonium removal also increased from period II to IV, supporting the trend of improvement observed in the nitrification process. However, in period V, the removal efficiency dropped to about 40%, probably due to the increase in ammonium concentration in the influent and the applied HLR (Figure 4). The HD was the unit responsible for nitrogen removal, achieving an average removal efficiency of 47.0 ± 3.6% of TIN, slightly higher than in the overall system, because some TIN was generated in the VF and PD units.

3.4. VF Performance

To evaluate better the efficiency of the VF column, net SLR, and surface removal rate (SRR) were calculated according to the equations given by Gonzalo [7]. The results are indicated in Table 2. HLR applied to VF unit varied between 221 and 389 mm·d−1 (including recirculation flow, the HLR range was 374–1037 mm·d−1), which was well above the recommended values for VF [53]. On the other hand, the VF unit operated with highly variable SLR of TSS and COD, which ranged from 0.8 to 24.2 g TSS·m−2·d−1 and 21.0 to 83.5 g COD·m−2·d−1. In period III, the lowest values of SLR were found, which were due to the high removal obtained in the preceding HD unit. TSS removal in the VF unit was low in general, due not only to the high removal in the HD unit, but also to the usually high TSS concentration of the VF unit. As indicated, the TSS effluent concentration for the VF unit averaged 19 ± 8 mg TSS·L−1 (periods II to V) which was clearly higher than that of about 5 mg TSS·L−1 reported by Gonzalo [7]. The lower TSS removal could be related to the large particle size of the filter media used in the present study respect to that of Gonzalo [7]. In fact, Nivala [56] obtained a worse TSS removal in a VF with 4–8 mm gravel (76.1% of removal) than with 1–3 mm sand (96.6%). Net COD and ammonia removal by the VF unit ranged from 40% to 63% and from 44% to 64%, respectively.
SLR for ammonia ranged from 8.2 to 23.4 g·m−2·d−1 of NH4+-N, being more stable than TSS and COD SLR because the effect of the HD on ammonia removal was negligible. Ammonia removal ranged from 44% to 64% whilst SRR of ammonia remained stable at periods II to IV (5.2–5.5 g NH4+-N·m−2·d−1) and increased to 11.9 g NH4+-N·m−2·d−1 in period V. Thus, the VF unit reached ammonia SRR higher than that reported for conventional VFs [32] but similar to those reported to optimized systems [7,31]. However, the percentage ammonium removal was lower than that reported by Gonzalo [7]. This could probably be due to the large gravel used in the VF unit of the present study (4–8 mm) in comparison to that (1–4 mm) of the system of Gonzalo [7]. As indicated, the VF unit reached steady effluent values of 13–14 mg NH4+-N·L−1 in the present study, while Gonzalo [7] reported mean VF values of approximately 6 mg NH4+-N·L−1 and percentage removals around 80%. Nivala [56] worked with 4–8 mm gravel and achieved an intermediate ammonia removal efficiency (between 67% and 71%) but applying lower SLR (4.7 g NH4+-N·m−2·d−1) than that of the present study.
The rate of infiltration of the influent into the VF unit is a direct measure of the risk of clogging. The limitation of the influent load of suspended solids and organic matter allows avoiding this risk and maintaining good infiltration conditions throughout the operation time. Data on flow profiles from the VF unit indicate mean retention time of an influent pulse was 4.5 ± 0.7 min during periods I, II, III and IV and increase to 8.4 ± 0.8 min for the last period with the highest HLR. This retention times were very short, indicating that the column was far from clogging conditions. These results contract with those of Gonzalo [7] who reported a higher degree of clogging level when treating pre-treated MW during the periods of greater SLR (between 17 and 38 g TSS·m−2·d−1 and 37 and 63 g COD·m−2·d−1) and using a minor particle size in FM1. On the other hand, the high risk of clogging reported by Gonzalo [7] could be partly related to the occasional but unavoidable sludge washout from the AD digester, a factor that in the present study was completely eliminated by presence of the filter body of the HD.

3.5. HD Performance and Biomass Characteristics

Hydraulic retention time of digester ranged from 3.6 to 6.3 h (Table 1). Solid accumulation in both the HUSB zone and the filtering zone of the HD are shown in Table 3, as well as surface denitrification rate (SDR). Volatile solids concentrations in both the sludge bed and the filter of the HD, as well as the sludge bed volume, were maintained practically constant. Volatile solids accumulation in the filtering gravel ranged from 0.84% to 1.78% d. m. (accounting the amounts withdrawn with gravel samples), so the AF remained far from clogging risk. Furthermore, no direct effect on the reduction in volatile solids in the filtering media of AF was observed during the resting period.
On the other hand, the amount of suspended solids in the HUSB sludge bed showed a clear reduction during period I, from 5.9 to 1.1 g TSS (or from 4.8 to 0.8 g VSS). Afterwards, from the beginning of period II to the end of period V, the amount of sludge in the HUSB remained nearly constant at 1.44 ± 0.24 g TSS (or 1.06 ± 0.29 g VSS). Furthermore, the purged sludge corresponding to the samples withdrawn for analysis and activity assays account for 1.3 g TSS (1.0 g VSS). From this data, a mass balance (periods II–V) clearly indicated that most of the influent TSS and VSS (on average 82.1% TSS and 83.3% VSS) were hydrolyzed in the HD under the applied conditions and 8.0% of VSS remained as sludge and biofilm. The minimum solid retention time (calculated as indicated by Ruiz [2]) varied from 4 to 22 days and could be increased by reducing the purge and raising the VSS concentration in the sludge bed. The application of low HRT and solid retention time establishes the hydrolytic-acidogenic conditions in the HD, hence the methanogenic stage in ADs operating at 13–20 °C need a solid retention time of 50–80 days [57].
SMA of the HUSB sludge remained very low, particularly considering the large latency period in SMA assays (Table 3). On the other hand, we assumed that SMA of the AF sludge was null because of aeration effect during the resting periods. Considering the potential methane production depending on the SMA, the average emission factor was 1.75% of COD (calculated as indicated by De la Varga [58]). These values indicated a low or no methane production in the HD under the operating conditions. In addition, the recirculation of nitrified effluent from the VF may have influenced the reduction in methane generated by the HD [7]. SDA was maintained during periods II to IV, at about 6.5 mg N·g VSS−1·h−1 for the sludge of the HUSB zone and between 2.6 and 3.1 mg N·g VSS−1·h−1 for the sludge of AF zone. Potential denitrification rate, referred to the overall HD–VF system area, was 31.6–36.1 g N·m−2·d−1 (periods II and IV). It was found that 75% of the potential denitrification rate was provided by the sludge retained in the AF zone. Consequently, the HD reached high denitrification efficiency, as indicated by the low nitrate concentration in the HD effluent (mean of 4.3 ± 3.5 mg N·L−1).
SDR (Table 3) for the HD system was calculated following the simplifying assumptions made by Torrijos [59] and Gonzalo [7]. Simplifications considered that nitrogen was removed only by the nitrification–denitrification pathway, then the SDR of the HD would equal the surface rate of TIN removal. SDRHD remained between 14.2 and 19.3 g N·m−2·d−1 in periods II-IV and increased to 39.7 g N·m−2·d−1 in period V.
Taking into consideration the same simplifications expressed above [7,59], the surface nitrification rate (SNR) would be equal to the ammonia SRR (calculated in Section 3.4 for VF unit). Referred to the overall system, SNR and SDR showed values close to each other (SDR of 5.6 ± 2.9 g N·m−2·d−1 and SNR of 6.0 ± 2.9 g N·m−2·d−1). These surface denitrification and nitrification rates were similar to those obtained by Gonzalo [7] working with a HUSB–VF combined system, but higher than those obtained for VF–HF hybrid systems [48,59]. On the other hand, the fact that SDR and SNR took similar values in combination with the fact that the effluents from both units had a notable concentration of both nitrate and ammonia (i.e., non substrate limiting conditions) means that improving the TIN removal efficiency will require improving both denitrification and nitrification capacities.

3.6. Emerging Pollutant Removal

3.6.1. Presence of EPs in Influent Wastewater

Table 4 shows the presence of several EPs in the wastewater fed to the system. Except for IBU, in general mean concentrations were sustained during the study period, as indicated by variation coefficients lower than 20%. High concentrations (>20 µg·L−1) were registered for ACE, OFL, and CAF. Other compounds such as KET, ACB, BPA, and SOT showed low but sustained concentrations in the range of 1–7 µg·L−1.
As indicated in Section 2 and shown in Table 4, a supplementary amount of 2 µg/L of some compounds was added to the raw wastewater. Despite this addition, ACB showed concentrations lower than 2 µg·L−1 in the influent, which could be due to the tendency for this compound to sorb in the feed tank [26]. IBU was not supplemented because in previous studies showed a concentration sufficiently high [39]. However, in the present study, IBU concentration was higher than the detection limit only during period II (0.76 µg·L−1) whilst during the other periods remained below 0.10 µg·L−1. Other compounds such as carbamazepine (CBZ) and diclofenac (DCL) were always below the detection limit (0.10 µg·L−1) in both raw wastewater and treated effluents and were no further considered in this study.

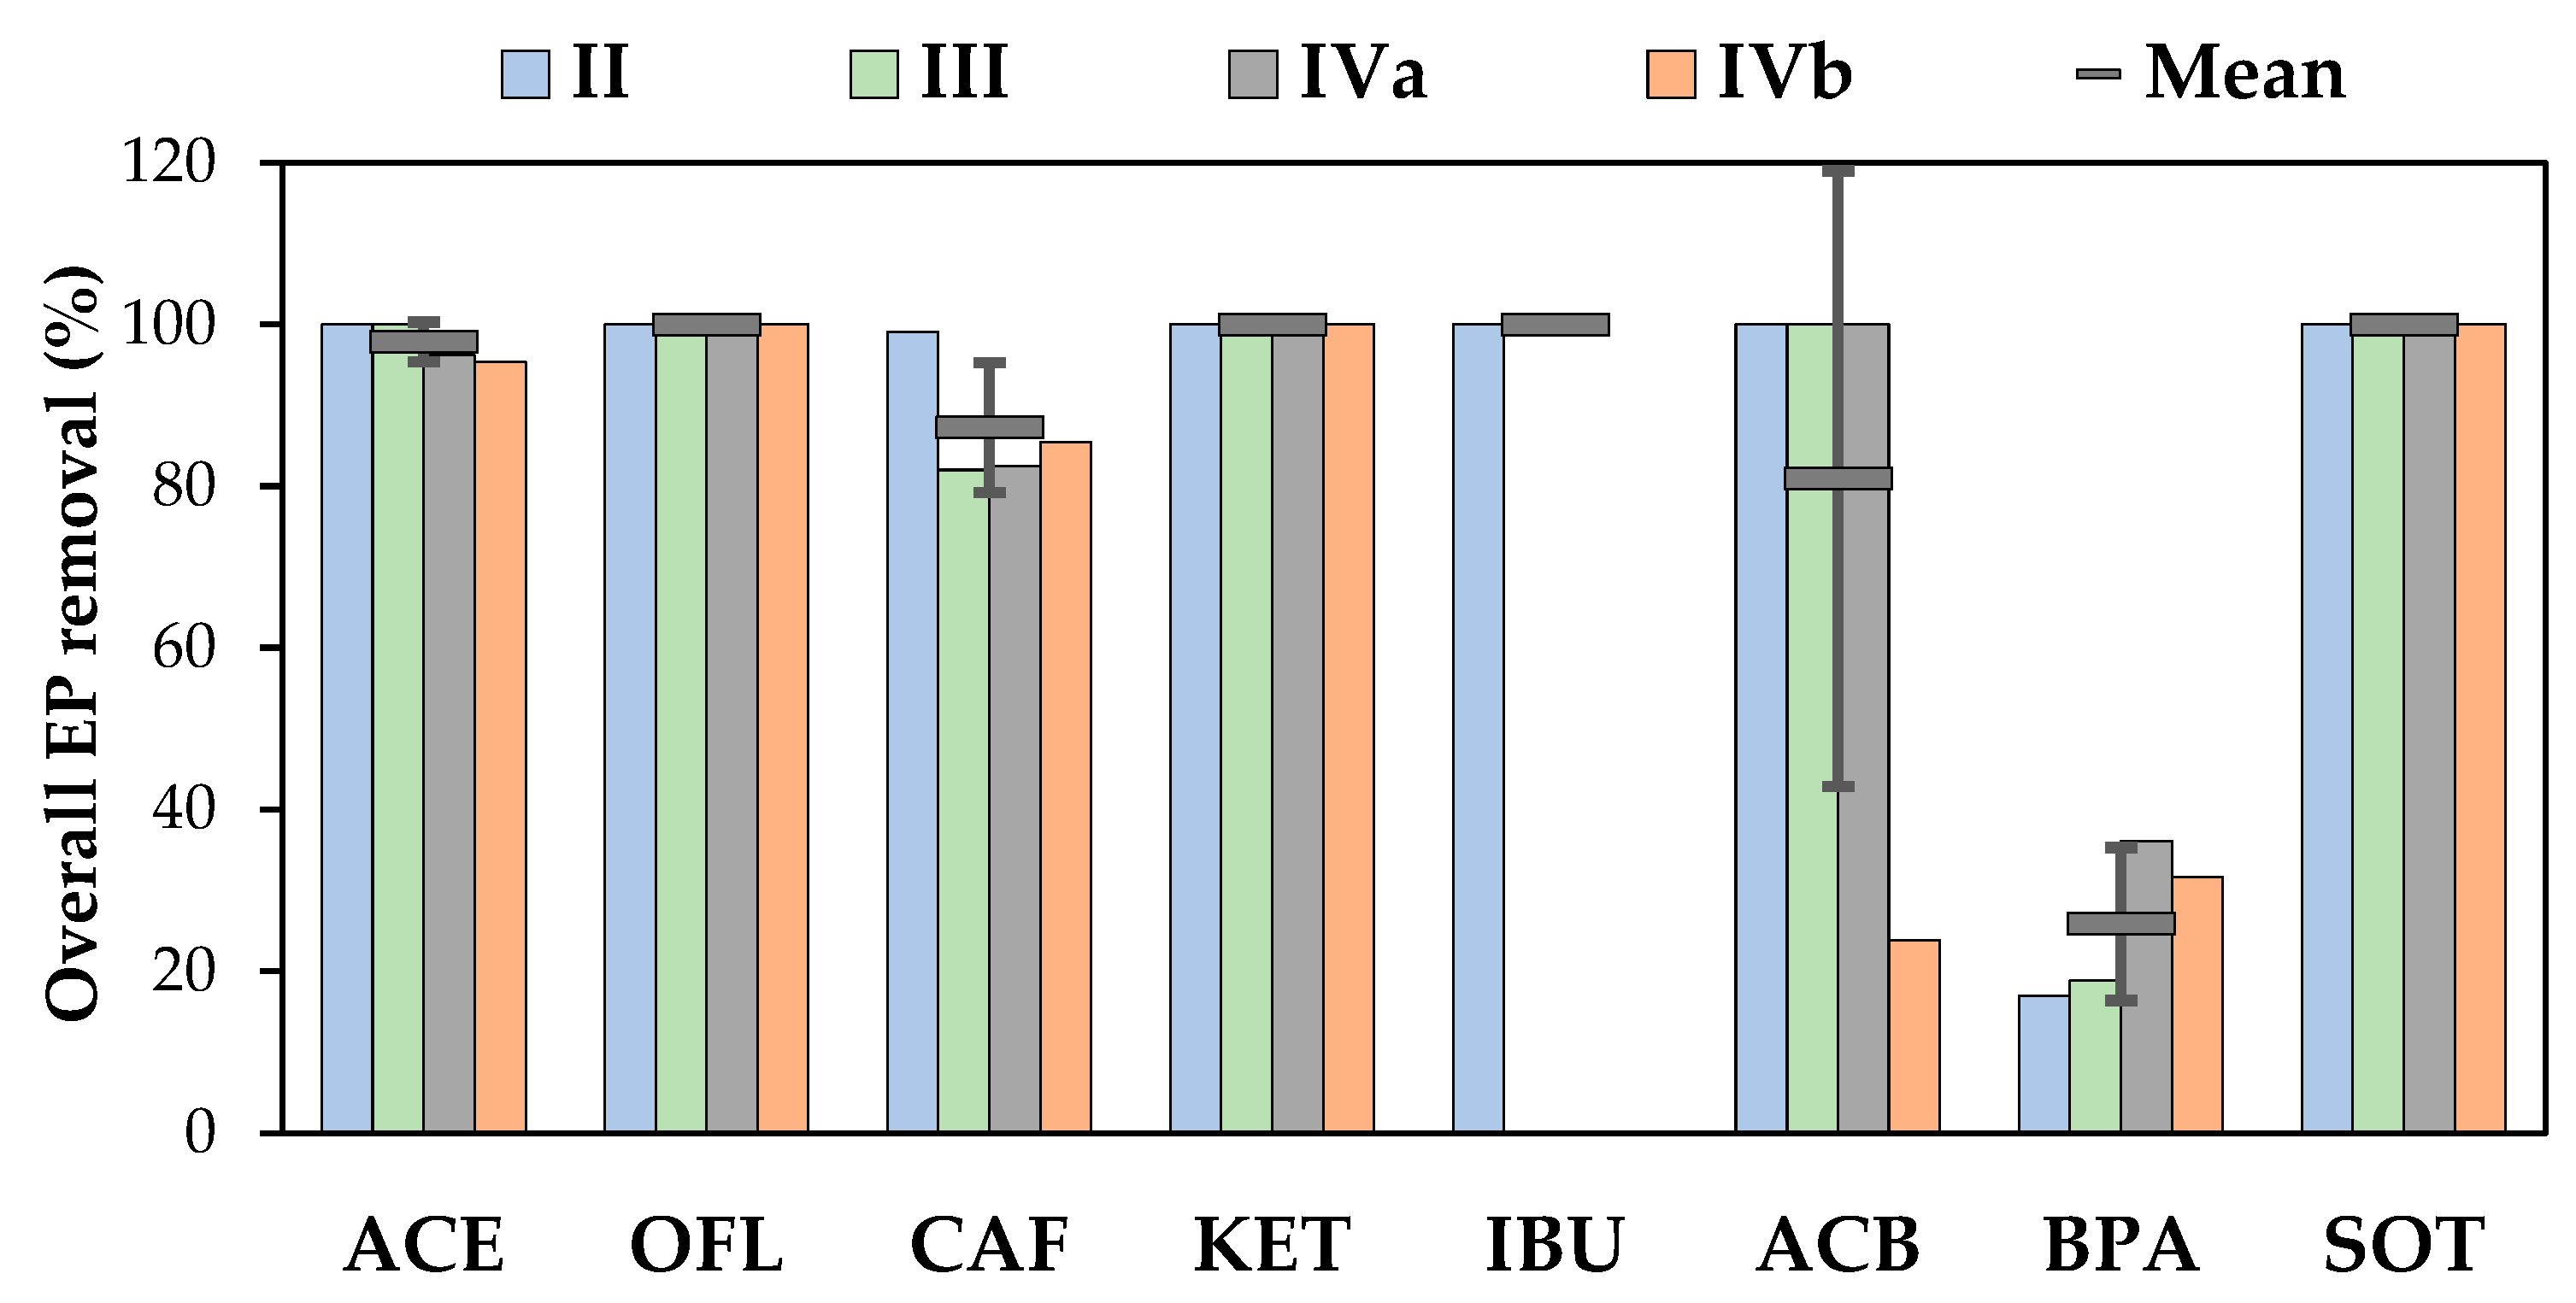
3.6.2. Overall EP Removal per Periods

Removal of individual EPs in the overall system is shown in Figure 5. Three compounds, OFL, KET, and SOT always reached 100% removal in the overall system. Nearly complete removal was obtained for ACE (98 ± 2%), CAF (87 ± 8%), and ACB (81 ± 38%) showing a slightly lower removal that indicated by Gonzalo [39], whilst BPA showed a very low removal of 26 ± 9%, as opposed to the 90% removal achieved by Gonzalo [38]. As indicated above, the IBU data were limited to period I, in which 100% overall removal was achieved.
Figure 5 shows that both the configuration relating the point of recirculation (i.e., the configuration (HD–VF)R-PD applied at periods II–III and the configuration (HD–VF–PD)R applied at period IV) as well as the recirculation rate (QR/Q1 = 1 in period II and 2.2–2.4 in periods III and IV, Table 1) had minor effects on the overall efficiency of EP removal. Higher recirculation rate seems to reduce CAF removal slightly, from 99% to 88%. Gonzalo [38] also found a reduced effect of recirculation rate with higher efficiencies at QR/Q1 = 1 than at QR/Q1 = 2. However, a larger recirculation rate favors the removal of total nitrogen in the HD–VF system. On the other hand, including PD unit in the recirculation loop (period IV) slightly reduced ACE removal from 100% to 96% but increased BPA removal from 19% (III) to 36% (IVa), on average.
The effect derived from the position of the recirculation will require additional research, particularly with the aim of studying its influence on potential by-products generated in the PD stage [5,26]. One of the arguments in favor of using PD as a pre-treatment or first stage has to do with the positive effect of CWs in removing those possible by-products [5]. The application of recirculation, currently uncommon in studies that combine green and grey technologies, makes it possible to take advantage of the benefits of green-grey schemes and at the same time the advantages of grey-green schemes referring to the elimination of by-products. However, the monitoring of by-products of the PD stage was not included in the present study.
Reducing the HRT in PD step from 0.5 to 0.25 h (change from period IVa to IVb) only shown effect on ACB removal, as the overall removal drastically decreased from 100% to 24%. As will be shown below (see Section 3.6.3), this is because PD was the only effective unit in removing ACB in the conditions of the present study.
The four solid phases of the system units (that is, HUSB sludge and AF media in the HD, FM1, and FM2 filtering media in VF unit) were analyzed for EP accumulation at the end of the period of study (Table 5). None of the studied EP was detected in HD filter material or in the FM1 bed material (detection limit of 0.5 ng·g−1 d.m.). ACE and BPA were found in FM2 bed material at concentrations of 1.6 and 2.4 ng·g−1 d.m., respectively. The presence of EP in the HD sludge was more generalized, being 0 for SOT, KET, and ACB, and ranging from 2 to 10 ng·g−1 d.m. for CAF, DCL, ACE, CBZ, IBU, and OFL (ordered from lower to higher concentration), and finally to 21.4 ng·g−1 d.m. for BPA. However, mass balances for the EP monitored period (periods II to IV) indicated that EP accumulated throughout the system was below 0.02% of the amount fed for all compounds, except for BPA that reached 0.21%. Thus, EP accumulation must be considered negligible and the overall removal efficiencies show in Figure 5 correspond to the actual elimination of these compounds during the treatment. Low accumulation of EPs on the bed materials is consistent with the used bed materials, as gravel and sand showed low or negligible sorption capacity [60].

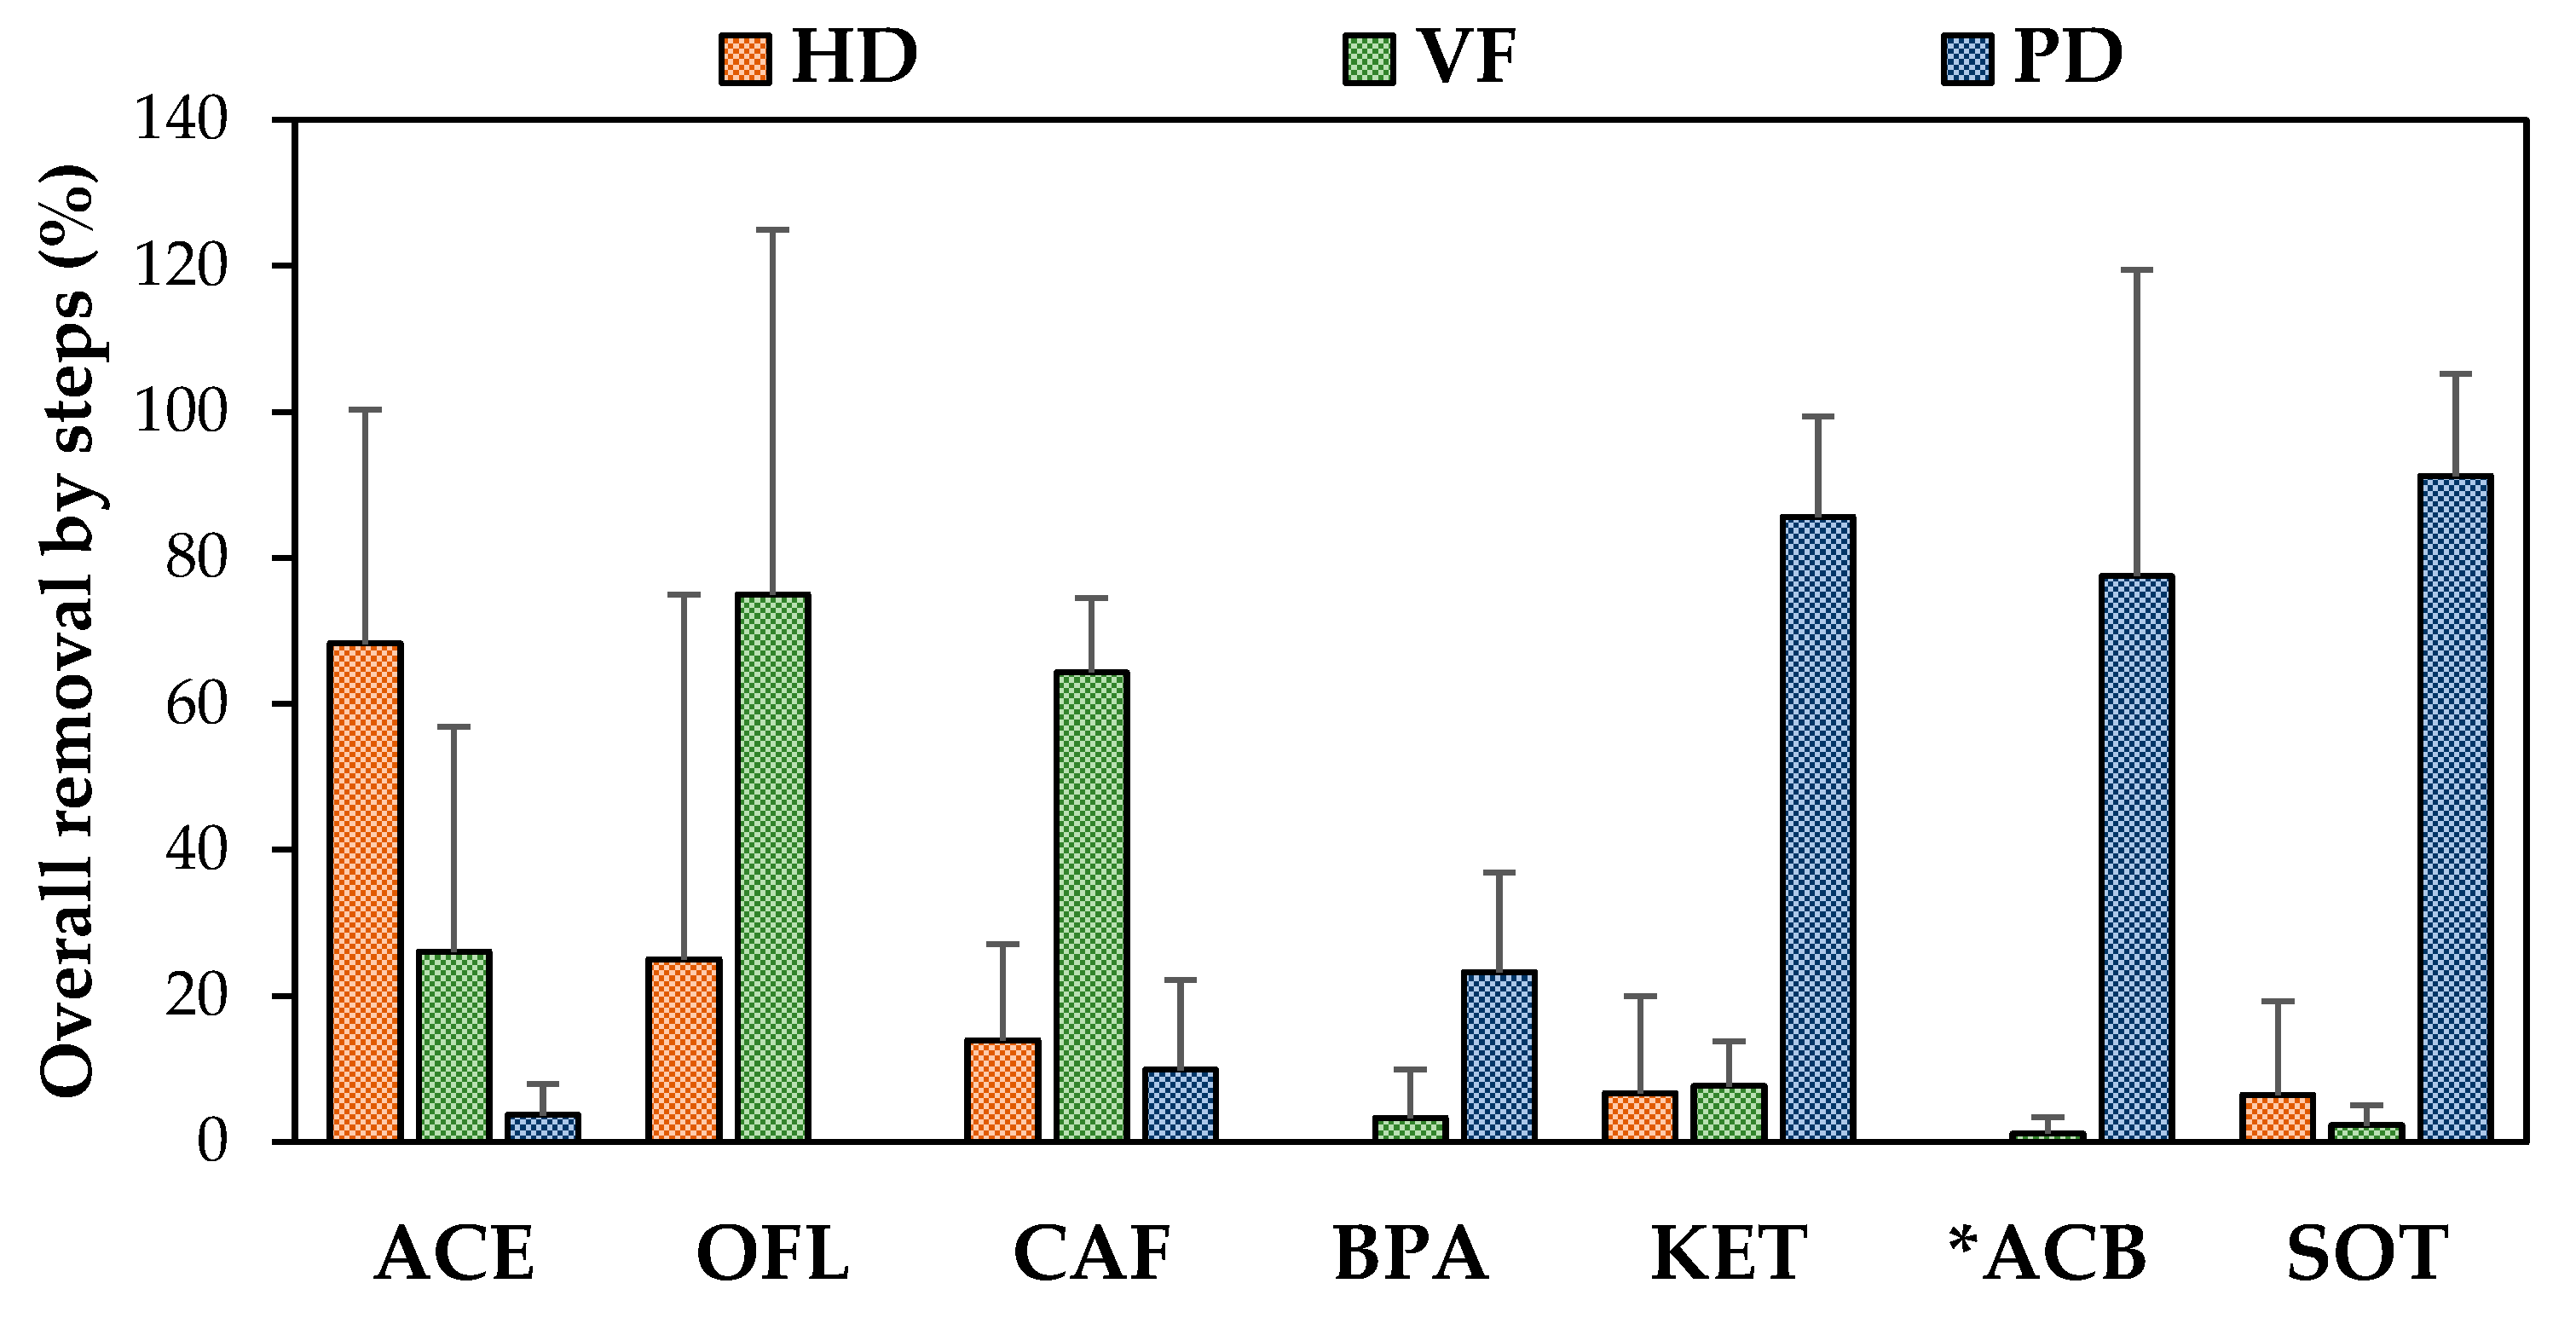
3.6.3. EP Removal by System Steps

Figure 6 shows the contribution of each step of the combined system to the removal of each one of the studied EPs. ACE removal mainly occurred in the HD unit which contributed with 65% to 97% removal of this compound during periods III and IV. ACE removal during period II was 25%, suggesting that doubling the recirculation rate (period III and IV) improved the ACE removal by the HD. However, increasing efficiency in ACE removal from period II to period III could also be due to biomass growth and adaptation. Secondly, the VF unit also contributed to ACE removal, given that ACE was not previously removed in the HD unit, as in periods II and IVb. Therefore, the biological units were responsible for removing most of the influent ACE (mean removal of 94 ± 5% for combined HD–VF system). Literature reports a high removal efficiency of ACE due to biodegradation mechanisms under both anaerobic and aerobic conditions [20,61,62,63,64]. Chen [61] obtained high removal efficiencies (between 95% and 100%) in three HF operating at low HLR (15–40 mm·d−1). Ranieri [62] found that HLR greatly affected the percentage of ACE removal in three HF, ranging from 97% to 100% removal at 30 mm·d−1 to 47–52% at HLR of 240 mm·d−1. These authors also indicate that more aerobic conditions would increase ACE removal, whilst sorption was not a dominant mechanism. In our study, high removals were obtained in HD and VF units at high HLR (circa 177 mm·d−1 in the overall system and 235 mm·d−1 in the VF unit). Vo [63] worked with high influent doses of ACE (10 ACE mg·L−1) in a VF and found low effluent concentrations (>0.4 µg·L−1) after 15 days of operation. On the other hand, in the conditions of the present study, the PD unit did not contribute to the removal of ACE (Figure 6). In fact, PD cell showed minimal effect on the residual ACE concentration (about 3 µg·L−1) that received during periods IVa and IVb. Kim and Tanaka [65] classified ACE as a slow-degrading compound using UV lamp emitting at 254 nm wavelength, while Kim [66] indicated a 1% elimination with single exposure to UV light.
On the other hand, CAF removal was mainly due to the action of the VF unit, which reached 52–76% removal. The contribution of anaerobic and photodegradation processes to CAF removal were limited, ranging from 0% to 28% removal depending on the period of the study. In overall, HD and VF units together removed most of the CAF (71–86%). Poor HD efficiency has previously been observed in other ADs [24] while HF with predominantly anaerobic conditions have obtained removals above 80% [61,67,68,69]. Thus, aerobic biodegradation appeared as the dominant mechanism [70] although other mechanisms may be involved in the removal of CAF in CWs [68]. Carranza-Diaz [71] found an average efficiency of 66% of CAF in high organic load HF with predominant anaerobic conditions (median dissolved oxygen of 0.15 mg·L−1 and redox potential of −120 mV) whilst other compounds (among then IBU, KET, and BPA) showed average removal efficiency below 30%. On the other hand, Zhang [72] reported that removal of CAF and IBU (as well as for KET but not for ACB) in HF was significantly enhanced under the batch (fill and drain) versus continuous mode, due to the fact that fill and drain works as a passive pump to replenish oxygen to the wetlands. In our study, data available for IBU (limited to period II) suggest that this compound can be removed in all units, as observed by Gonzalo [39]. However, a recalcitrant behavior of IBU under AD treatment was reported by Alvarino [73]. Furthermore, the performance of the UV lamp was low in the removal of CAF and IBU (28% and 43%, respectively), agreeing with Matamoros [74] on its scarce photodegradability. Thus, biodegradation of IBU seemed to be favored due to aerobic conditions [70,75].
The antibiotic OFL was completely removed in the biological units. The concentration of OFL in the effluent of the VF unit was always bellow the detection limit. Thus, the potential effect of the PD unit on this compound was not determined. However, the HD only contributed to the removal of OFL during period II. This fact suggests that OFL cannot be biodegraded in anaerobic conditions but absorbed on the biomass and the filtering bed. Once the absorption capacity was overpassed, OFL was not at all removed in the HD unit. In these conditions, OFL reached the VF unit where was completely removed. Conkle [76] highlighted the importance of sorption as a removal pathway for OFL and reported a sorption of 72–90%, most occurring in the first 20 h. Verlicchi [77] mentioned 84% removal of OFL in HF used as tertiary treatment. Chen [78] reported 100% removal of OFL in a five-stage integrated CW (including horizontal surface and subsurface flow and floating units) at HLR of 7 mm·d−1. Yan [79] found OFL removal in flooded mesocosm-scale CWs ranging from 78% to 93%.
KET, ACB, and SOT were efficiently removed in the PD unit, whilst the HD and VF units showed minimal effect on these compounds (Figure 6). The PD lamp was able to eliminate 78% of ACB, 86% of KET, and 91% of SOT. On the other hand, system configuration and operational conditions did not affect the removal efficiency of these compounds, except for the reduction in the PD HRT from 0.5 to 0.25 h, which drastically reduced the removal of ACB. The non-elimination of KET in the biological units was in contrast with the literature on biodegradation as a feasible mechanism [61,80,81]. In fact, Reyes-Contreras [24] reported about 30% removal in an AD in both winter and summer conditions, while Gonzalo [39] achieved 47% removal in a VF. The removal of KET and other photodegradable emerging contaminants during tertiary treatment based on filtration-UV light radiation–chlorination was previously reported by Matamoros and Salvadó [82]. In the same way, Cardinal [83] indicated the dominance of photolytic processes in the removal of ACB in SF units, while Mathon [84] classified SOT as a medium photodegradable compound in SF exposed to sunlight. However, under biological treatment, such as wastewater treatment plants or subsurface CWs, SOT removal was low [29,85]. Conkle [86] worked with a system that included aerated ponds, hybrid CWs, and a natural wetland and found that 82% SOT removal was achieved with the overall system.
BPA was not removed in HD and VF units, and only partially (6% to 36%) in the PD unit. Ávila [87] found that BPA was readily removed in units where the removal of TSS was high, probably due to sorption on the particulate matter because of their high hydrophobicity. In our system, removal of particulate matter occurred mainly in the HD unit, but the amount of BPA accumulated in the HD sludge at the end of the study, as well as in FM1 and FM2 materials of VF unit (see Section 3.6.2), was negligible. As hydrolysis of suspended solids was very high, it is possible that absorbed compounds were rapidly dissolved and washed-out of the unit. Biodegradation stands as the major pathway of BPA removal, being promoted under aerobic conditions [20,88,89]. Removal enhancement under batch mode operation of HF was reported by Ávila [88] for IBU and BPA. These authors highlighted the great dependence on the redox status of the wetlands of BPA degradation, which ranged from 65% to 89% removal depending on the oxygenation conditions.
High removal efficiencies for BPA (57–98%) were also reported by Ávila [89] in VF units operated at 95 mm·d−1 of HLR. Once again, Ávila [89] found that BPA removal improved with better aerobic conditions, whilst large bed particle size (4–8 mm gravel) offered the lower removals in comparison to small particle size (1–3 mm sand). Probably the very low removal of BPA in our system could be related to the low absorption capacity of the bed materials and the very low HRT in both the HD and VF units derived from the high HLR applied (177 mm·d−1 for the overall system in comparison to 28.5 mm·d−1 for the HF units of Ávila [88] and 95 mm·d−1 for the VF units of Ávila [89]. However, Ávila [27] reported high removal rates of BPA in VF units of a hybrid CW at high HLR of up to 180 mm·d−1, in spite of the use of bed media for the VF units similar to those of the present study (an upper 10 cm layer of 1–2 mm sand and a main layer of 3–8 mm fine gravel).

3.6.4. Removal Efficiency of the PD Cell Treating Raw Wastewater and CW Effluent

Table 6 shows influent and effluent concentration of EPs during the comparative study of PD treating raw MW (simulating PD as single unit pre-treatment) and biologically treated MW (simulating PD as single unit post-treatment, treating HD–VF system effluent). The results indicated that the PD cell effectively eliminated KET and SOT in both conditions (100% removal), whilst it was ineffective in removing OFL, CAF, and BPA (net removals in the range of 1–21% with pre-treated effluent and negative removals of 5–6% with raw MW). An effective removal of IBU was achieved in raw MW while its effect was not determined in the pre-treated effluent as its concentration was below the detection limit (Table 6). However, the results obtained during period II indicated that the PD unit was able to completely remove IBU from the pre-treated effluent.
ACE was not affected by PD cell in raw MW treatment, but it was removed from the pre-treated effluent although the concentration was very low. Removal of ACB was 19% with raw MW and 29% with pre-treated effluent. Briefly, four compounds (ACE, OFL, CAF, and BPA) showed negative removals in raw MW (−4.4 ± 2.0%) and variable but positive removals (range 1 to 100, mean 34 ± 45%) in pre-treated effluent, suggesting a better behavior of the PD cell in pre-treated effluents. A similar response in both situations occurred for ACB, however, the differences were not statistically significant (p > 0.1). On the other hand, the PD unit showed a high removal efficiency for KET, SOT, and IBU compounds in both raw and pre-treated water. The order of treatment (green-grey or grey-green) has been discussed by several authors [5,26]. However, these results reinforce the idea that the PD step should be used as the final stage to achieve a better removal efficiency for all the compounds studied.

4. Conclusions and Future Research

The potential of the combined HD–VF system with PD as a post-treatment (UV light at λ = 254 nm) for advanced removal of various pollutants during raw MW treatment was investigated on a lab-scale. Monitored contaminants were suspended solids, organic matter, nitrogen compounds, and eight emerging pollutants (ACE, OFL, CAF, KET, IBU, ACB, BPA, and SOT). The performance of the combined HD–VF system with recirculation was successful in removing 90–92% TSS and 79–85% COD. In fact, the HD unit was able to highly reduce the influent concentration to the VF unit (82.2 ± 18.5% of TSS and 63.9 ± 4.1% of COD) helping to prevent bed clogging and reduce the required VF surface area. On the other hand, the VF unit achieved stable effluent concentrations although its removal efficiency was low (8 ± 19% TSS and 19 ± 6% COD). This low contribution of the VF unit to particulate and organic matter removal was probably due to the large particle size used as filtering media.
As for total nitrogen, 39.0 ± 8.1% removal was estimated for the combined (HD–VF)R system. The anoxic character of the HD resulted in denitrification leading to an average effluent concentration of 4.5 ± 3.5 mg NO3-N·L−1 where the largest values corresponded to the higher recirculation rate. Meanwhile, nitrification occurred in the VF unit due to its mostly aerobic environment which reached removal between 51% and 67% of NH4+-N. In addition, it was observed that the use of a relatively coarse filtering media in the VF provided good surface removal capacity under non-clogging conditions and high SRL, although with medium percent removal efficiencies. This clogging-free and sustainable operation of the VF unit also contributed to the high solid retention efficiency of the HD, which completely prevented sludge washing from the anaerobic digester, which would otherwise enter the VF unit. The combined system showed a similar relative denitrification and nitrification capacity, slightly lower for denitrification. Therefore, increasing the TIN removal efficiency requires an improvement in denitrification in the HD as well as nitrification in the VF. This could be achieved by using large recirculation rates and a smaller particle size in the VF filtering media.
Regarding the PD unit, no effect was observed on the removal of nitrogen, particles, and organic matter, while it had a clear role in the removal of some recalcitrant emerging pollutants. ACE, OFL, CAF, and IBU compounds were effectively removed through the biological treatment units while KET, ACB, and SOT required PD processes for their removal from MW. In this way, the overall HD–VF–PD system achieved a removal efficiency of 100% for OFL, KET, SOT, and IBU, greater than 80% for ACE, CAF, and ACB, and only 26% for BPA. The accumulation of EPs in the solid phases of the system (HD and VF units) was found to be negligible. In addition, this study also found that the PD unit was more efficient in the post-treatment position than as a first pre-treatment step. Variations in recirculation point and recirculation rate within the HD–VF–PD system had no relevant effect on the overall EP removal efficiency. The reduction in the HRT of UV lamp from 0.5 to 0.25 h drastically reduced the removal of ACB while did not affect the removal of the other compounds.
The results of this study indicate that photodegradation with UV lamps is an interesting option to include in combined systems that aim for more complete removal of emerging pollutants. Following the interesting results obtained at the laboratory scale, the order of the units in the hybrid system and the position of the recirculation require further investigation, in particular in relation to the possible generation of by-products and also the overall efficiency in the removal of parent pollutants. These aspects are related to the composition of the water matrix, which is an important factor because both dissolved organic matter and inorganic species can act as radical scavengers with an inhibitory or promoting effect on EPs degradation [26].
New research should address these aspects and should preferably be conducted on a pilot plant or field scale. UV radiation lamps are currently available on the market, while anaerobic digesters and CWs are considered established technologies. Thus, the research gap is in the integration and complementary nature of the technologies involved. An additional issue of great relevance is the energy demand and costs of the proposed systems. In this regard, Capodaglio [90] described methods to estimate the energy efficiency of different advanced treatment processes. This author concludes that ionizing radiation—including UV—could provide economical, reliable, and safer wastewater treatment.

Author Contributions

M.S. (Marta Sánchez): data curation, formal analysis, investigation, methodology, visualization, writing—original draft, writing—review and editing; M.I.F.: data curation, formal analysis, methodology, supervision, validation; I.R.: conceptualization, data curation, investigation, supervision, validation; M.C.: conceptualization, methodology, supervision, funding acquisition, project administration, resources, writing—review and editing; M.S. (Manuel Soto): conceptualization, formal analysis, methodology, supervision, visualization, writing—original draft, writing—review and editing. All authors have read and agreed to the published version of the manuscript.

Funding

This research is part of the project CTQ2015-71238-R (MINECO/FEDER, funded by the Spanish Ministerio de Economía y Competitividad), the project TED2021-132667B-I00 funded by MCIN/AEI/10.13039/501100011033 and by the European Union NextGenerationEU/PRTR, and projects GPC ED431B 2020/52 and GPC ED431B 2019/44 (funded by the Xunta de Galicia).

Data Availability Statement

The data that support the findings of this study are available from the corresponding author (M. Soto), upon reasonable request.

Conflicts of Interest

The authors declare no conflict of interest.

Abbreviations

Acronyms used in this paper (in alphabetical order): ACB = clofibric acid; ACE = paracetamol; AD = anaerobic digester; AF = anaerobic filter; BOD5 = biological oxygen demand; BPA = bisphenol A; CAF = caffeine; CBZ = carbamazepine; COD = chemical oxygen demand; CW = constructed wetland; DCL = diclofenac; EP = emerging pollutant; FM1 = main filtering medium of vertical subsurface flow constructed wetland; FM2 = top filtering medium of vertical subsurface flow constructed wetland; HD = hybrid digester; HF = horizontal subsurface flow constructed wetland; HLR = hydraulic loading rate; HRT = hydraulic retention time; HUSB = hydrolytic up-flow sludge bed; IBU = ibuprofen; KET = ketoprofen; MW = municipal wastewater; OFL = ofloxacin; PD = photodegradation; Q = flow rate; R = recirculation; SDA = specific denitrifying activity; SDR = surface denitrification rate; SF = surface flow constructed wetland; SLR = surface loading rate; SMA = specific methanogenic activity; SNR = surface nitrification rate; SOT = sotalol; SRR = surface removal rate; TIN = total inorganic nitrogen; TSS = total suspended solids; UV = ultraviolet radiation; VF = vertical subsurface flow constructed wetland; VSS = volatile suspended solids.

References

  1. Álvarez, J.A.; Ruíz, I.; Soto, M. Anaerobic Digesters as a Pretreatment for Constructed Wetlands. Ecol. Eng. 2008, 33, 54–67. [Google Scholar] [CrossRef]
  2. Ruiz, I.; Díaz, M.A.; Crujeiras, B.; García, J.; Soto, M. Solids Hydrolysis and Accumulation in a Hybrid Anaerobic Digester-Constructed Wetlands System. Ecol. Eng. 2010, 36, 1007–1016. [Google Scholar] [CrossRef]
  3. Pedescoll, A.; Corzo, A.; Álvarez, E.; García, J.; Puigagut, J. The Effect of Primary Treatment and Flow Regime on Clogging Development in Horizontal Subsurface Flow Constructed Wetlands: An Experimental Evaluation. Water Res. 2011, 45, 3579–3589. [Google Scholar] [CrossRef]
  4. del Castillo, A.F.; Garibay, M.V.; Senés-Guerrero, C.; Orozco-Nunnelly, D.A.; de Anda, J.; Gradilla-Hernández, M.S. A Review of the Sustainability of Anaerobic Reactors Combined with Constructed Wetlands for Decentralized Wastewater Treatment. J. Clean. Prod. 2022, 133428. [Google Scholar] [CrossRef]
  5. Castellar, J.A.C.; Torrens, A.; Buttiglieri, G.; Monclús, H.; Arias, C.A.; Carvalho, P.N.; Galvao, A.; Comas, J. Nature-Based Solutions Coupled with Advanced Technologies: An Opportunity for Decentralized Water Reuse in Cities. J. Clean. Prod. 2022, 340, 130660. [Google Scholar] [CrossRef]
  6. Pinto da Silva, C.; Xavier de Campos, S. Combined Process of Chemically Enhanced Sedimentation and Rapid Filtration for Urban Wastewater Treatment for Potable Reuse. Environ. Technol. 2022, 1–12. [Google Scholar] [CrossRef]
  7. Gonzalo, O.G.; Ruiz, I.; Soto, M. Integrating Pretreatment and Denitrification in Constructed Wetland Systems. Sci. Total Environ. 2017, 584–585, 1300–1309. [Google Scholar] [CrossRef] [PubMed]
  8. Ayaz, S.C.; Aktaş, Ö.; Fındık, N.; Akça, L.; Kınacı, C. Effect of Recirculation on Nitrogen Removal in a Hybrid Constructed Wetland System. Ecol. Eng. 2012, 40, 1–5. [Google Scholar] [CrossRef]
  9. Tanner, C.C.; Sukias, J.P.S.; Headley, T.R.; Yates, C.R.; Stott, R. Constructed Wetlands and Denitrifying Bioreactors for on-Site and Decentralised Wastewater Treatment: Comparison of Five Alternative Configurations. Ecol. Eng. 2012, 42, 112–123. [Google Scholar] [CrossRef]
  10. Duarte, N.C.; Barbosa, A.C.; Magalhães, T.M.; Montagner, C.C.; de Oliveira Cruz, L.M.; Tonetti, A.L. Conventional Anaerobic Reactors Applied to Denitrification: A Comparison Between Packed Bed and UASB Reactors under Low COD Conditions. Water Air Soil Pollut. 2021, 232, 54. [Google Scholar] [CrossRef]
  11. Magalhães, T.M.; Duarte, N.C.; de Alencar Neves, T.; Bueno, D.A.C.; Delforno, T.P.; de Oliveira, V.M.; Tonetti, A.L. The Challenge of Making Wastewater Treatment Plants Composed by Anaerobic Reactors Capable of Removing Nitrogen. Water Air Soil Pollut. 2019, 230, 234. [Google Scholar] [CrossRef]
  12. Ramakrishnan, A.; Surampalli, R.Y. Comparative Performance of UASB and Anaerobic Hybrid Reactors for the Treatment of Complex Phenolic Wastewater. Bioresour. Technol. 2012, 123, 352–359. [Google Scholar] [CrossRef] [PubMed]
  13. Gogoi, A.; Mazumder, P.; Tyagi, V.K.; Tushara Chaminda, G.G.; An, A.K.; Kumar, M. Occurrence and Fate of Emerging Contaminants in Water Environment: A Review. Groundw. Sustain. Dev. 2018, 6, 169–180. [Google Scholar] [CrossRef]
  14. Saidulu, D.; Gupta, B.; Gupta, A.K.; Ghosal, P.S. A Review on Occurrences, Eco-Toxic Effects, and Remediation of Emerging Contaminants from Wastewater: Special Emphasis on Biological Treatment Based Hybrid Systems. J. Environ. Chem. Eng. 2021, 9, 105282. [Google Scholar] [CrossRef]
  15. Khasawneh, O.; Palaniandy, P. Occurrence and Removal of Pharmaceuticals in Wastewater Treatment Plants. Process Saf. Environ. Prot. 2021, 150, 532–556. [Google Scholar] [CrossRef]
  16. Rout, P.R.; Zhang, T.C.; Bhunia, P.; Surampalli, R.Y. Treatment Technologies for Emerging Contaminants in Wastewater Treatment Plants: A Review. Sci. Total Environ. 2021, 753, 141990. [Google Scholar] [CrossRef]
  17. Tran, N.H.; Reinhard, M.; Gin, K.Y.H. Occurrence and Fate of Emerging Contaminants in Municipal Wastewater Treatment Plants from Different Geographical Regions—A Review. Water Res. 2018, 133, 182–207. [Google Scholar] [CrossRef]
  18. Matamoros, V.; Caselles-Osorio, A.; García, J.; Bayona, J.M. Behaviour of Pharmaceutical Products and Biodegradation Intermediates in Horizontal Subsurface Flow Constructed Wetland. A Microcosm Experiment. Sci. Total Environ. 2008, 394, 171–176. [Google Scholar] [CrossRef]
  19. Ilyas, H.; Masih, I.; van Hullebusch, E.D. The Anaerobic Biodegradation of Emerging Organic Contaminants by Horizontal Subsurface Flow Constructed Wetlands. Water Sci. Technol. 2021, 83, 2809–2828. [Google Scholar] [CrossRef]
  20. Ávila, C.; Bayona, J.M.; Martín, I.; Salas, J.J.; García, J. Emerging Organic Contaminant Removal in a Full-Scale Hybrid Constructed Wetland System for Wastewater Treatment and Reuse. Ecol. Eng. 2015, 80, 108–116. [Google Scholar] [CrossRef] [Green Version]
  21. Venditti, S.; Brunhoferova, H.; Hansen, J. Behaviour of 27 Selected Emerging Contaminants in Vertical Flow Constructed Wetlands as Post-Treatment for Municipal Wastewater. Sci. Total Environ. 2022, 819, 153234. [Google Scholar] [CrossRef]
  22. Mathon, B.; Ferreol, M.; Coquery, M.; Choubert, J.M.; Chovelon, J.M.; Miège, C. Direct Photodegradation of 36 Organic Micropollutants under Simulated Solar Radiation: Comparison with Free-Water Surface Constructed Wetland and Influence of Chemical Structure. J. Hazard. Mater. 2021, 407, 124801. [Google Scholar] [CrossRef] [PubMed]
  23. Nuel, M.; Laurent, J.; Bois, P.; Heintz, D.; Wanko, A. Seasonal and Ageing Effect on the Behaviour of 86 Drugs in a Full-Scale Surface Treatment Wetland: Removal Efficiencies and Distribution in Plants and Sediments. Sci. Total Environ. 2018, 615, 1099–1109. [Google Scholar] [CrossRef]
  24. Reyes-Contreras, C.; Matamoros, V.; Ruiz, I.; Soto, M.; Bayona, J.M. Evaluation of PPCPs Removal in a Combined Anaerobic Digester-Constructed Wetland Pilot Plant Treating Urban Wastewater. Chemosphere 2011, 84, 1200–1207. [Google Scholar] [CrossRef]
  25. Matamoros, V.; García, J.; Bayona, J.M. Organic Micropollutant Removal in a Full-Scale Surface Flow Constructed Wetland Fed with Secondary Effluent. Water Res. 2008, 42, 653–660. [Google Scholar] [CrossRef] [PubMed]
  26. Sánchez, M.; Ruiz, I.; Soto, M. The Potential of Constructed Wetland Systems and Photodegradation Processes for the Removal of Emerging Contaminants—A Review. Environments 2022, 9, 116. [Google Scholar] [CrossRef]
  27. Ávila, C.; Matamoros, V.; Reyes-Contreras, C.; Piña, B.; Casado, M.; Mita, L.; Rivetti, C.; Barata, C.; García, J.; Bayona, J.M. Attenuation of Emerging Organic Contaminants in a Hybrid Constructed Wetland System under Different Hydraulic Loading Rates and Their Associated Toxicological Effects in Wastewater. Sci. Total Environ. 2014, 470–471, 1272–1280. [Google Scholar] [CrossRef] [PubMed]
  28. Garcia-Rodríguez, A.; Matamoros, V.; Fontàs, C.; Salvadó, V. The Ability of Biologically Based Wastewater Treatment Systems to Remove Emerging Organic Contaminants—A Review. Environ. Sci. Pollut. Res. 2014, 21, 11708–11728. [Google Scholar] [CrossRef] [PubMed]
  29. Li, Y.; Zhu, G.; Ng, W.J.; Tan, S.K. A Review on Removing Pharmaceutical Contaminants from Wastewater by Constructed Wetlands: Design, Performance and Mechanism. Sci. Total Environ. 2014, 468–469, 908–932. [Google Scholar] [CrossRef]
  30. Verlicchi, P.; Zambello, E. How Efficient Are Constructed Wetlands in Removing Pharmaceuticals from Untreated and Treated Urban Wastewaters? A Review. Sci. Total Environ. 2014, 470–471, 1281–1306. [Google Scholar] [CrossRef]
  31. Torrijos, V.; Gonzalo, O.G.; Trueba-Santiso, A.; Ruiz, I.; Soto, M. Effect of by-Pass and Effluent Recirculation on Nitrogen Removal in Hybrid Constructed Wetlands for Domestic and Industrial Wastewater Treatment. Water Res. 2016, 103, 92–100. [Google Scholar] [CrossRef] [PubMed]
  32. Vymazal, J. The Use of Hybrid Constructed Wetlands for Wastewater Treatment with Special Attention to Nitrogen Removal: A Review of a Recent Development. Water Res. 2013, 47, 4795–4811. [Google Scholar] [CrossRef]
  33. Dhangar, K.; Kumar, M. Tricks and Tracks in Removal of Emerging Contaminants from the Wastewater through Hybrid Treatment Systems: A Review. Sci. Total Environ. 2020, 738, 140320. [Google Scholar] [CrossRef] [PubMed]
  34. Araña, J.; Garriga i Cabo, C.; Fernández Rodríguez, C.; Herrera Melián, J.A.; Ortega Méndez, J.A.; Doña Rodríguez, J.M.; Pérez Peña, J. Combining TiO2-Photocatalysis and Wetland Reactors for the Efficient Treatment of Pesticides. Chemosphere 2008, 71, 788–794. [Google Scholar] [CrossRef]
  35. Colina-Márquez, J.; Machuca-Martínez, F.; Salas, W. Enhancement of the Potential Biodegradability and the Mineralization of a Pesticides Mixture after Being Treated by a Coupled Process of TiO2-Based Solar Photocatalysis with Constructed Wetlands. Ing. Compet. 2013, 15, 181–190. [Google Scholar]
  36. Mahne, D.; Štangar, U.L.; Trebše, P.; Bulc, T.G. TiO2-Based Photocatalytic Treatment of Raw and Constructed-Wetland Pretreated Textile Wastewater. Int. J. Photoenergy 2012, 2012, 725692. [Google Scholar] [CrossRef] [Green Version]
  37. Horn, T.B.; Zerwes, F.V.; Kist, L.T.; Machado, Ê.L. Constructed Wetland and Photocatalytic Ozonation for University Sewage Treatment. Ecol. Eng. 2014, 63, 134–141. [Google Scholar] [CrossRef]
  38. Lazar, M.; Varghese, S.; Nair, S. Photocatalytic Water Treatment by Titanium Dioxide: Recent Updates. Catalysts 2012, 2, 572–601. [Google Scholar] [CrossRef] [Green Version]
  39. Gonzalo, O.G.; Marín, Z.; Fernández, M.I.; Santaballa, J.A.; Ruiz, I.; Torres, E.; Canle, M.; Soto, M. Combination of Constructed Wetlands and Photodegradation Processes for the Elimination of Persistent Organic Pollutants from Municipal Wastewater. In Proceedings of the 14th International IWA Conference on Sustainable Solutions for Small Water and Wastewater Treatment Systems (S2Small2017), Nantes, France, 22–26 October 2017; IWA Publishing: Nantes, France, 2017. [Google Scholar]
  40. APHA-AWWA-WEF. Standard Methods for the Examination of Water and Wastewater, 23rd ed.; American Public Health Association, American Water Works Association, and Water Environment Federation: Washington, DC, USA, 2017; ISBN 978-0-87553-287-5. [Google Scholar]
  41. Soto, M.; Méndez, R.; Lema, J.M. Methanogenic and Non-Methanogenic Activity Tests. Theoretical Basis and Experimental Set up. Water Res. 1993, 27, 1361–1376. [Google Scholar] [CrossRef]
  42. Ferreiro, N.; Soto, M. Anaerobic Hydrolysis of Primary Sludge: Influence of Sludge Concentration and Temperature. Water Sci. Technol. 2003, 47, 239–246. [Google Scholar] [CrossRef]
  43. Álvarez, J.A.; Zapico, C.A.; Gómez, M.; Presas, J.; Soto, M. Anaerobic Hydrolysis of a Municipal Wastewater in a Pilot-Scale Digester. Water Sci. Technol. 2003, 47, 223–230. [Google Scholar] [CrossRef] [PubMed]
  44. Saeed, T.; Sun, G. A Comprehensive Review on Nutrients and Organics Removal from Different Wastewaters Employing Subsurface Flow Constructed Wetlands. Crit. Rev. Environ. Sci. Technol. 2017, 47, 203–288. [Google Scholar] [CrossRef]
  45. Torrijos, V.; Ruiz, I.; Soto, M. Microbial Activities and Process Rates in Two-Step Vertical and Horizontal Subsurface Flow Gravel and Sand Filters. Water Air Soil Pollut. 2018, 229, 290. [Google Scholar] [CrossRef]
  46. Winter, K.J.; Goetz, D. The Impact of Sewage Composition on the Soil Clogging Phenomena of Vertical Flow Constructed Wetlands. In Water Science and Technology; IWA Publishing: London, UK, 2003; Volume 48, pp. 9–14. [Google Scholar]
  47. Fan, J.; Wang, W.; Zhang, B.; Guo, Y.; Ngo, H.H.; Guo, W.; Zhang, J.; Wu, H. Nitrogen Removal in Intermittently Aerated Vertical Flow Constructed Wetlands: Impact of Influent COD/N Ratios. Bioresour. Technol. 2013, 143, 461–466. [Google Scholar] [CrossRef] [PubMed]
  48. Gonzalo, O.G.; Ruiz, I.; Soto, M. Effect of Different Bypass Rates and Unit Area Ratio in Hybrid Constructed Wetlands. Environ. Sci. Pollut. Res. 2020, 27, 40355–40369. [Google Scholar] [CrossRef] [PubMed]
  49. De la Varga, D.; Díaz, M.A.; Ruiz, I.; Soto, M. Avoiding Clogging in Constructed Wetlands by Using Anaerobic Digesters as Pre-Treatment. Ecol. Eng. 2013, 52, 262–269. [Google Scholar] [CrossRef]
  50. Pascual, A.; de la Varga, D.; Arias, C.A.; Van Oirschot, D.; Kilian, R.; Álvarez, J.A.; Soto, M. Hydrolytic Anaerobic Reactor and Aerated Constructed Wetland Systems for Municipal Wastewater Treatment—HIGHWET Project. Environ. Technol. 2017, 38, 209–219. [Google Scholar] [CrossRef] [PubMed]
  51. Ruiz, I.; Álvarez, J.A.; Díaz, M.A.; Serrano, L.; Soto, M. Municipal Wastewater Treatment in an Anaerobic Digester-Constructed Wetland System. Environ. Technol. 2008, 29, 1249–1256. [Google Scholar] [CrossRef]
  52. Hua, G.F.; Zhu, W.; Zhao, L.F.; Huang, J.Y. Clogging Pattern in Vertical-Flow Constructed Wetlands: Insight from a Laboratory Study. J. Hazard. Mater. 2010, 180, 668–674. [Google Scholar] [CrossRef]
  53. Nivala, J.; Van Afferden, M.; Hasselbach, R.; Langergraber, G.; Molle, P.; Rustige, H.; Nowak, J. The New German Standard on Constructed Wetland Systems for Treatment of Domestic and Municipal Waste Water. Water Sci. Technol. 2018, 78, 2414–2426. [Google Scholar] [CrossRef] [Green Version]
  54. Ávila, C.; García, J.; Garfí, M. Influence of Hydraulic Loading Rate, Simulated Storm Events and Seasonality on the Treatment Performance of an Experimental Three-Stage Hybrid CW System. Ecol. Eng. 2016, 87, 324–332. [Google Scholar] [CrossRef] [Green Version]
  55. Moharram, M.A.; Abdelhalim, H.S.; Rozaik, E.H. Anaerobic up Flow Fluidized Bed Reactor Performance as a Primary Treatment Unit in Domestic Wastewater Treatment. HBRC J. 2016, 12, 99–105. [Google Scholar] [CrossRef] [Green Version]
  56. Nivala, J.; Boog, J.; Headley, T.; Aubron, T.; Wallace, S.; Brix, H.; Mothes, S.; van Afferden, M.; Müller, R.A. Side-by-Side Comparison of 15 Pilot-Scale Conventional and Intensified Subsurface Flow Wetlands for Treatment of Domestic Wastewater. Sci. Total Environ. 2019, 658, 1500–1513. [Google Scholar] [CrossRef]
  57. Henze, M.; Harremoës, P.; Cour Jansen, J.; Arvin, E. Wastewater Treatment; Springer: Berlin/Heidelberg, Germany, 1997; ISBN 978-3-662-22607-0. [Google Scholar]
  58. De la Varga, D.; Ruiz, I.; Álvarez, J.A.; Soto, M. Methane and Carbon Dioxide Emissions from Constructed Wetlands Receiving Anaerobically Pretreated Sewage. Sci. Total Environ. 2015, 538, 824–833. [Google Scholar] [CrossRef]
  59. Torrijos, V.; Ruiz, I.; Soto, M. Effect of Step-Feeding on the Performance of Lab-Scale Columns Simulating Vertical Flow-Horizontal Flow Constructed Wetlands. Environ. Sci. Pollut. Res. 2017, 24, 22649–22662. [Google Scholar] [CrossRef]
  60. Dordio, A.V.; Carvalho, A.J.P. Organic Xenobiotics Removal in Constructed Wetlands, with Emphasis on the Importance of the Support Matrix. J. Hazard. Mater. 2013, 252–253, 272–292. [Google Scholar] [CrossRef] [Green Version]
  61. Chen, Y.; Vymazal, J.; Březinová, T.; Koželuh, M.; Kule, L.; Huang, J.; Chen, Z. Occurrence, Removal and Environmental Risk Assessment of Pharmaceuticals and Personal Care Products in Rural Wastewater Treatment Wetlands. Sci. Total Environ. 2016, 566–567, 1660–1669. [Google Scholar] [CrossRef] [PubMed]
  62. Ranieri, E.; Verlicchi, P.; Young, T.M. Paracetamol Removal in Subsurface Flow Constructed Wetlands. J. Hydrol. 2011, 404, 130–135. [Google Scholar] [CrossRef]
  63. Vo, H.N.P.; Koottatep, T.; Chapagain, S.K.; Panuvatvanich, A.; Polprasert, C.; Nguyen, T.M.H.; Chaiwong, C.; Nguyen, N.L. Removal and Monitoring Acetaminophen-Contaminated Hospital Wastewater by Vertical Flow Constructed Wetland and Peroxidase Enzymes. J. Environ. Manag. 2019, 250, 109526. [Google Scholar] [CrossRef]
  64. Vymazal, J.; Dvořáková Březinová, T.; Koželuh, M.; Kule, L. Occurrence and Removal of Pharmaceuticals in Four Full-Scale Constructed Wetlands in the Czech Republic—The First Year of Monitoring. Ecol. Eng. 2017, 98, 354–364. [Google Scholar] [CrossRef]
  65. Kim, I.; Tanaka, H. Photodegradation Characteristics of PPCPs in Water with UV Treatment. Environ. Int. 2009, 35, 793–802. [Google Scholar] [CrossRef] [PubMed]
  66. Kim, I.; Yamashita, N.; Tanaka, H. Performance of UV and UV/H2O2 Processes for the Removal of Pharmaceuticals Detected in Secondary Effluent of a Sewage Treatment Plant in Japan. J. Hazard. Mater. 2009, 166, 1134–1140. [Google Scholar] [CrossRef]
  67. He, Y.; Sutton, N.B.; Lei, Y.; Rijnaarts, H.H.M.; Langenhoff, A.A.M. Fate and Distribution of Pharmaceutically Active Compounds in Mesocosm Constructed Wetlands. J. Hazard. Mater. 2018, 357, 198–206. [Google Scholar] [CrossRef]
  68. Hijosa-Valsero, M.; Reyes-Contreras, C.; Domínguez, C.; Bécares, E.; Bayona, J.M. Behaviour of Pharmaceuticals and Personal Care Products in Constructed Wetland Compartments: Influent, Effluent, Pore Water, Substrate and Plant Roots. Chemosphere 2016, 145, 508–517. [Google Scholar] [CrossRef]
  69. Kahl, S.; Nivala, J.; van Afferden, M.; Müller, R.A.; Reemtsma, T. Effect of Design and Operational Conditions on the Performance of Subsurface Flow Treatment Wetlands: Emerging Organic Contaminants as Indicators. Water Res. 2017, 125, 490–500. [Google Scholar] [CrossRef] [PubMed]
  70. Ilyas, H.; van Hullebusch, E.D. Performance Comparison of Different Types of Constructed Wetlands for the Removal of Pharmaceuticals and Their Transformation Products: A Review. Environ. Sci. Pollut. Res. 2020, 27, 14342–14364. [Google Scholar] [CrossRef] [PubMed]
  71. Carranza-Diaz, O.; Schultze-Nobre, L.; Moeder, M.; Nivala, J.; Kuschk, P.; Koeser, H. Removal of Selected Organic Micropollutants in Planted and Unplanted Pilot-Scale Horizontal Flow Constructed Wetlands under Conditions of High Organic Load. Ecol. Eng. 2014, 71, 234–245. [Google Scholar] [CrossRef]
  72. Zhang, D.Q.; Gersberg, R.M.; Zhu, J.; Hua, T.; Jinadasa, K.B.S.N.; Tan, S.K. Batch versus Continuous Feeding Strategies for Pharmaceutical Removal by Subsurface Flow Constructed Wetland. Environ. Pollut. 2012, 167, 124–131. [Google Scholar] [CrossRef] [PubMed]
  73. Alvarino, T.; Suarez, S.; Lema, J.M.; Omil, F. Understanding the Removal Mechanisms of PPCPs and the Influence of Main Technological Parameters in Anaerobic UASB and Aerobic CAS Reactors. J. Hazard. Mater. 2014, 278, 506–513. [Google Scholar] [CrossRef] [PubMed]
  74. Matamoros, V.; Nguyen, L.X.; Arias, C.A.; Salvadó, V.; Brix, H. Evaluation of Aquatic Plants for Removing Polar Microcontaminants: A Microcosm Experiment. Chemosphere 2012, 88, 1257–1264. [Google Scholar] [CrossRef]
  75. Nivala, J.; Kahl, S.; Boog, J.; van Afferden, M.; Reemtsma, T.; Müller, R.A. Dynamics of Emerging Organic Contaminant Removal in Conventional and Intensified Subsurface Flow Treatment Wetlands. Sci. Total Environ. 2019, 649, 1144–1156. [Google Scholar] [CrossRef]
  76. Conkle, J.L.; Lattao, C.; White, J.R.; Cook, R.L. Competitive Sorption and Desorption Behavior for Three Fluoroquinolone Antibiotics in a Wastewater Treatment Wetland Soil. Chemosphere 2010, 80, 1353–1359. [Google Scholar] [CrossRef] [PubMed]
  77. Verlicchi, P.; Galletti, A.; Petrovic, M.; Barceló, D.; Al Aukidy, M.; Zambello, E. Removal of Selected Pharmaceuticals from Domestic Wastewater in an Activated Sludge System Followed by a Horizontal Subsurface Flow Bed—Analysis of Their Respective Contributions. Sci. Total Environ. 2013, 454–455, 411–425. [Google Scholar] [CrossRef]
  78. Chen, J.; Liu, Y.S.; Su, H.C.; Ying, G.G.; Liu, F.; Liu, S.S.; He, L.Y.; Chen, Z.F.; Yang, Y.Q.; Chen, F.R. Removal of Antibiotics and Antibiotic Resistance Genes in Rural Wastewater by an Integrated Constructed Wetland. Environ. Sci. Pollut. Res. 2015, 22, 1794–1803. [Google Scholar] [CrossRef] [PubMed]
  79. Yan, Q.; Xu, Y.; Yu, Y.; Zhu, Z.W.; Feng, G. Effects of Pharmaceuticals on Microbial Communities and Activity of Soil Enzymes in Mesocosm-Scale Constructed Wetlands. Chemosphere 2018, 212, 245–253. [Google Scholar] [CrossRef] [PubMed]
  80. Zhang, X.; Jing, R.; Feng, X.; Dai, Y.; Tao, R.; Vymazal, J.; Cai, N.; Yang, Y. Removal of Acidic Pharmaceuticals by Small-Scale Constructed Wetlands Using Different Design Configurations. Sci. Total Environ. 2018, 639, 640–647. [Google Scholar] [CrossRef] [PubMed]
  81. Francini, A.; Mariotti, L.; Di Gregorio, S.; Sebastiani, L.; Andreucci, A. Removal of Micro-Pollutants from Urban Wastewater by Constructed Wetlands with Phragmites Australis and Salix Matsudana. Environ. Sci. Pollut. Res. 2018, 25, 36474–36484. [Google Scholar] [CrossRef] [PubMed]
  82. Matamoros, V.; Salvadó, V. Evaluation of a Coagulation/Flocculation-Lamellar Clarifier and Filtration-UV-Chlorination Reactor for Removing Emerging Contaminants at Full-Scale Wastewater Treatment Plants in Spain. J. Environ. Manag. 2013, 117, 96–102. [Google Scholar] [CrossRef]
  83. Cardinal, P.; Anderson, J.C.; Carlson, J.C.; Low, J.E.; Challis, J.K.; Beattie, S.A.; Bartel, C.N.; Elliott, A.D.; Montero, O.F.; Lokesh, S.; et al. Macrophytes May Not Contribute Significantly to Removal of Nutrients, Pharmaceuticals, and Antibiotic Resistance in Model Surface Constructed Wetlands. Sci. Total Environ. 2014, 482–483, 294–304. [Google Scholar] [CrossRef] [PubMed]
  84. Mathon, B.; Coquery, M.; Miège, C.; Vandycke, A.; Choubert, J.M. Influence of Water Depth and Season on the Photodegradation of Micropollutants in a Free-Water Surface Constructed Wetland Receiving Treated Wastewater. Chemosphere 2019, 235, 260–270. [Google Scholar] [CrossRef]
  85. Gabet-Giraud, V.; Miège, C.; Choubert, J.M.; Ruel, S.M.; Coquery, M. Occurrence and Removal of Estrogens and Beta Blockers by Various Processes in Wastewater Treatment Plants. Sci. Total Environ. 2010, 408, 4257–4269. [Google Scholar] [CrossRef] [PubMed]
  86. Conkle, J.L.; White, J.R.; Metcalfe, C.D. Reduction of Pharmaceutically Active Compounds by a Lagoon Wetland Wastewater Treatment System in Southeast Louisiana. Chemosphere 2008, 73, 1741–1748. [Google Scholar] [CrossRef] [PubMed]
  87. Ávila, C.; Pedescoll, A.; Matamoros, V.; Bayona, J.M.; García, J. Capacity of a Horizontal Subsurface Flow Constructed Wetland System for the Removal of Emerging Pollutants: An Injection Experiment. Chemosphere 2010, 81, 1137–1142. [Google Scholar] [CrossRef] [PubMed]
  88. Ávila, C.; Reyes, C.; Bayona, J.M.; García, J. Emerging Organic Contaminant Removal Depending on Primary Treatment and Operational Strategy in Horizontal Subsurface Flow Constructed Wetlands: Influence of Redox. Water Res. 2013, 47, 315–325. [Google Scholar] [CrossRef]
  89. Ávila, C.; Nivala, J.; Olsson, L.; Kassa, K.; Headley, T.; Mueller, R.A.; Bayona, J.M.; García, J. Emerging Organic Contaminants in Vertical Subsurface Flow Constructed Wetlands: Influence of Media Size, Loading Frequency and Use of Active Aeration. Sci. Total Environ. 2014, 494–495, 211–217. [Google Scholar] [CrossRef]
  90. Capodaglio, A.G. Critical Perspective on Advanced Treatment Processes for Water and Wastewater: AOPs, ARPs, and AORPs. Appl. Sci. 2020, 10, 4549. [Google Scholar] [CrossRef]
Figure 1. Scheme of the combined HD–VF–PD system with recirculation of VF effluent (a) or PD effluent (b). Acronyms: MW, municipal wastewater; HD, hybrid digester; VF, vertical flow unit; FM, filtering medium; DL, drainage layer; PD, photodegradation lamp; Q, flow; S, substrate concentration. Recirculation options: (a) from VF unit, (b) from PD unit.
Environments 10 00035 g001
Figure 2. Evolution of several operational parameters in the raw influent and effluent of HD and VF units. Acronyms: TSS = total suspended solids; COD = chemical oxygen demand; Inf = municipal wastewater influent; HD eff = hybrid digester effluent; VF eff = vertical flow constructed wetland effluent.
Environments 10 00035 g002
Figure 3. Concentration of nitrogen compounds in raw influent and effluent of HD and VF units. Acronyms: Inf = municipal wastewater influent; HD eff = hybrid digester effluent; VF eff = vertical flow constructed wetland effluent.
Environments 10 00035 g003
Figure 4. Evolution of percentage removal of TSS, COD, NH4+-N, and TIN in the overall system and contribution of each unit. Acronyms: TSS = total suspended solids; COD = chemical oxygen demand; NH4+-N = ammonium; TIN = total inorganic nitrogen; HD = hybrid digester; VF = vertical flow constructed wetland; PD = photodegradation lamp.
Environments 10 00035 g004
Figure 5. Removal efficiency of each EP through the overall HD–VF–PD system by period (bars) and mean and standard deviation in the overall period (marker and error bars). See Table 1 for operational conditions for the different periods and Table 4 for pollutant abbreviations.
Environments 10 00035 g005
Figure 6. Overall removal of several EPs in the different steps of the combined HD–VF–PD system (* for ACB, mean of periods II and III only, because the intermediate concentration for period IV was not available) (Error bars: only value + standard deviation is shown). See Table 4 for pollutant abbreviations.
Environments 10 00035 g006
Table 1. Operational characteristics of the combined HD–VF–PD system.
PeriodIIIIIIIVV
Operation time (d)0–1617–4546–7475–101102–122
System configuration a(1)(2)(2)(3)(1)
Q1 (L·d−1)4.28 ± n.d.3.76 ± 0.093.36 ± 0.963.60 ± 0.325.77 ± 0.58
Recirculation ratio, QR/Q1 b1.03 (VF)1.03 (VF)2.37 (VF)2.20 (PD)2.54 (VF)
External addition EPsnoyesyesyesno
Overall HLR (mm·d−1)212184166178292
Overall TSS SLR (g·m−2·d−1)48.036.226.537.295.2
Overall COD SLR (g·m−2·d−1)87.371.445.167.7193.8
Overall NH4+-N SLR (g·m−2·d−1)8.67.45.97.215.7
HD HRT (h)4.95.76.35.93.6
HD v (m·h−1)0.1300.1130.1690.1720.313
VF HLR (mm·d−1)282245221237389
PD HRT (h)-0.50.50.25–0.5 c-
a System configuration: (1) (HD–VF)R, (2) (HD–VF)R-PD, (3) (HD–VF–PD)R. b The point from which the recirculation was taken is indicated into brackets. c HRT was 0.5 during the first part of this period (IVa) and 0.25 during the second part (IVb). Acronyms: Q1 = municipal wastewater flow rate; QR = recirculation flow rate; EPs = emerging pollutants; HLR = hydraulic loading rate; SLR = surface loading rate; HRT = hydraulic retention time; v = up-flow velocity.
Table 2. Net surface loading rate received and removed by the VF unit.
PeriodSLR (g·m−2·d−1)Removal (%)SRR (g·m−2·d−1)
TSSCODNH4+-NTSSCODNH4+-NNH4+-N
II21.539.810.179.363.248.75.2
III0.821.08.2−407.640.163.65.5
IV5.631.59.317.947.459.45.5
V16.583.523.433.252.143.611.9
Acronyms: SLR = surface loading rate; SRR = surface removal rate; TSS = total suspended solids; COD = chemical oxygen demand; NH4+-N = ammonium.
Table 3. Solid characteristics in both the HUSB zone and the filtering zone of the HD at the end of each operational period.
PeriodIIIIIIIVV
Biomass of AF gravel
VS (% d.m.)1.781.15n.d.1.231.59
H2O (% d.m.)13.7516.46n.d.19.0421.46
VS (g)10.97.1n.d.7.59.7
SDA (mg N·g VS−1·h−1)n.d.3.05n.d.2.57n.d.
Biomass of HUSB zone
Sludge bed volume (mL)140.0143.6n.d.149.8152.2
TSS (g·L−1)8.008.63n.d.11.359.08
VSS (g·L−1)5–765.78n.d.9.286.33
SMA (g COD·g VSS−1·d−1)0.0230.039n.d.0.017n.d.
SMA latency (h)150300n.d.100n.d.
SDA (mg N·g VSS−1·h−1)4.716.65n.d.6.48n.d.
Overall HD
SDR (g N·m−2·d−1)n.d.16.8714.1919.2339.70
Acronyms: VS = volatile solids; SMA = specific methanogenic activity; SDA = specific denitrifying activity; SDR = surface denitrification rate; AF = anaerobic filter zone; HUSB = hydrolytic up-flow sludge bed zone; HD = hybrid digester; n.d. = not determined.
Table 4. Concentration of several EPs in the influent to the combined HD–VF–PD system.
ACEOFLCAFKETIBUACBBPASOTDCLCBZ
Mean (µg·L−1)68.120.027.34.500.191.107.402.11<0.10<0.10
St. Dev. (µg·L−1)10.61.23.40.390.380.150.950.41n.a.n.a.
VC (%)15.66.012.68.7200.013.712.919.5n.a.n.a.
Acronyms: ACE = paracetamol; OFL = ofloxacin; CAF = caffeine; KET = ketoprofen; IBU = ibuprofen; ACB = clofibric acid; BPA = bisphenol A; SOT = sotalol; DCL = diclofenac; CBZ = carbamazepine. Concentration and standard deviation in µg·L−1 (n = 4). VC: variation coefficient. n.a.: not applicable. Influent concentrations measured after supplementing 2 µg·L−1 of OFL, KET, ACB, BPA, and SOT to the raw wastewater.
Table 5. Concentrations of EPs in the solid phases of the HD and VF treatment units.
ACEOFLCAFKETIBUACBBPASOTCBZDCL
Hybrid digester
 HUSB sludge5.32.410.3<0.53.2<0.521.4<0.54.28.4
 AF gravel<0.5<0.5<0.5<0.5<0.5<0.5<0.5<0.5<0.5<0.5
Vertical Flow CW
 FM2<0.5<0.5<0.5<0.5<0.5<0.5<0.5<0.5<0.5<0.5
 FM11.6<0.5<0.5<0.5<0.5<0.52.4<0.5<0.5<0.5
Concentration units: ng·g−1 (dry matter). Acronyms: HUSB = hydrolytic up-flow sludge bed; AF = anaerobic filter; FM2 = top filtering media of vertical flow CW; FM1 = main filtering media of vertical flow CW. See Table 4 for pollutant abbreviations.
Table 6. Results for PD cell treating raw MW and HD–VF effluent.
ACEOFLCAFKETIBUACBBPASOT
Raw MW
 Influent91.0917.8344.175.950.891.176.403.09
 Effluent92.4618.7446.43<0.10<0.100.946.79<0.10
 Removal (%)−1.5−5.1−5.1100.0100.019.2−6.0100
HD–VF effluent
 Influent1.3819.3317.624.58<0.101.167.372.38
 Effluent<0.1019.114.0<0.10<0.100.836.32<0.10
 Removal (%)100.01.320.8100n.a.28.914.1100
n.a.: not available; Concentrations in µg·L−1. See Table 4 for pollutant abbreviations.
Disclaimer/Publisher’s Note: The statements, opinions and data contained in all publications are solely those of the individual author(s) and contributor(s) and not of MDPI and/or the editor(s). MDPI and/or the editor(s) disclaim responsibility for any injury to people or property resulting from any ideas, methods, instructions or products referred to in the content.

