
An Analysis of Multigenerational Issues of Generation X and Y Employees in Small- and Medium-Sized Enterprises in Thailand: The Moderation Effect of Age Groups on Person–Environment Fit and Turnover Intention


Abstract
:1. Introduction
2. Review of the Related Literature and Theoretical Development
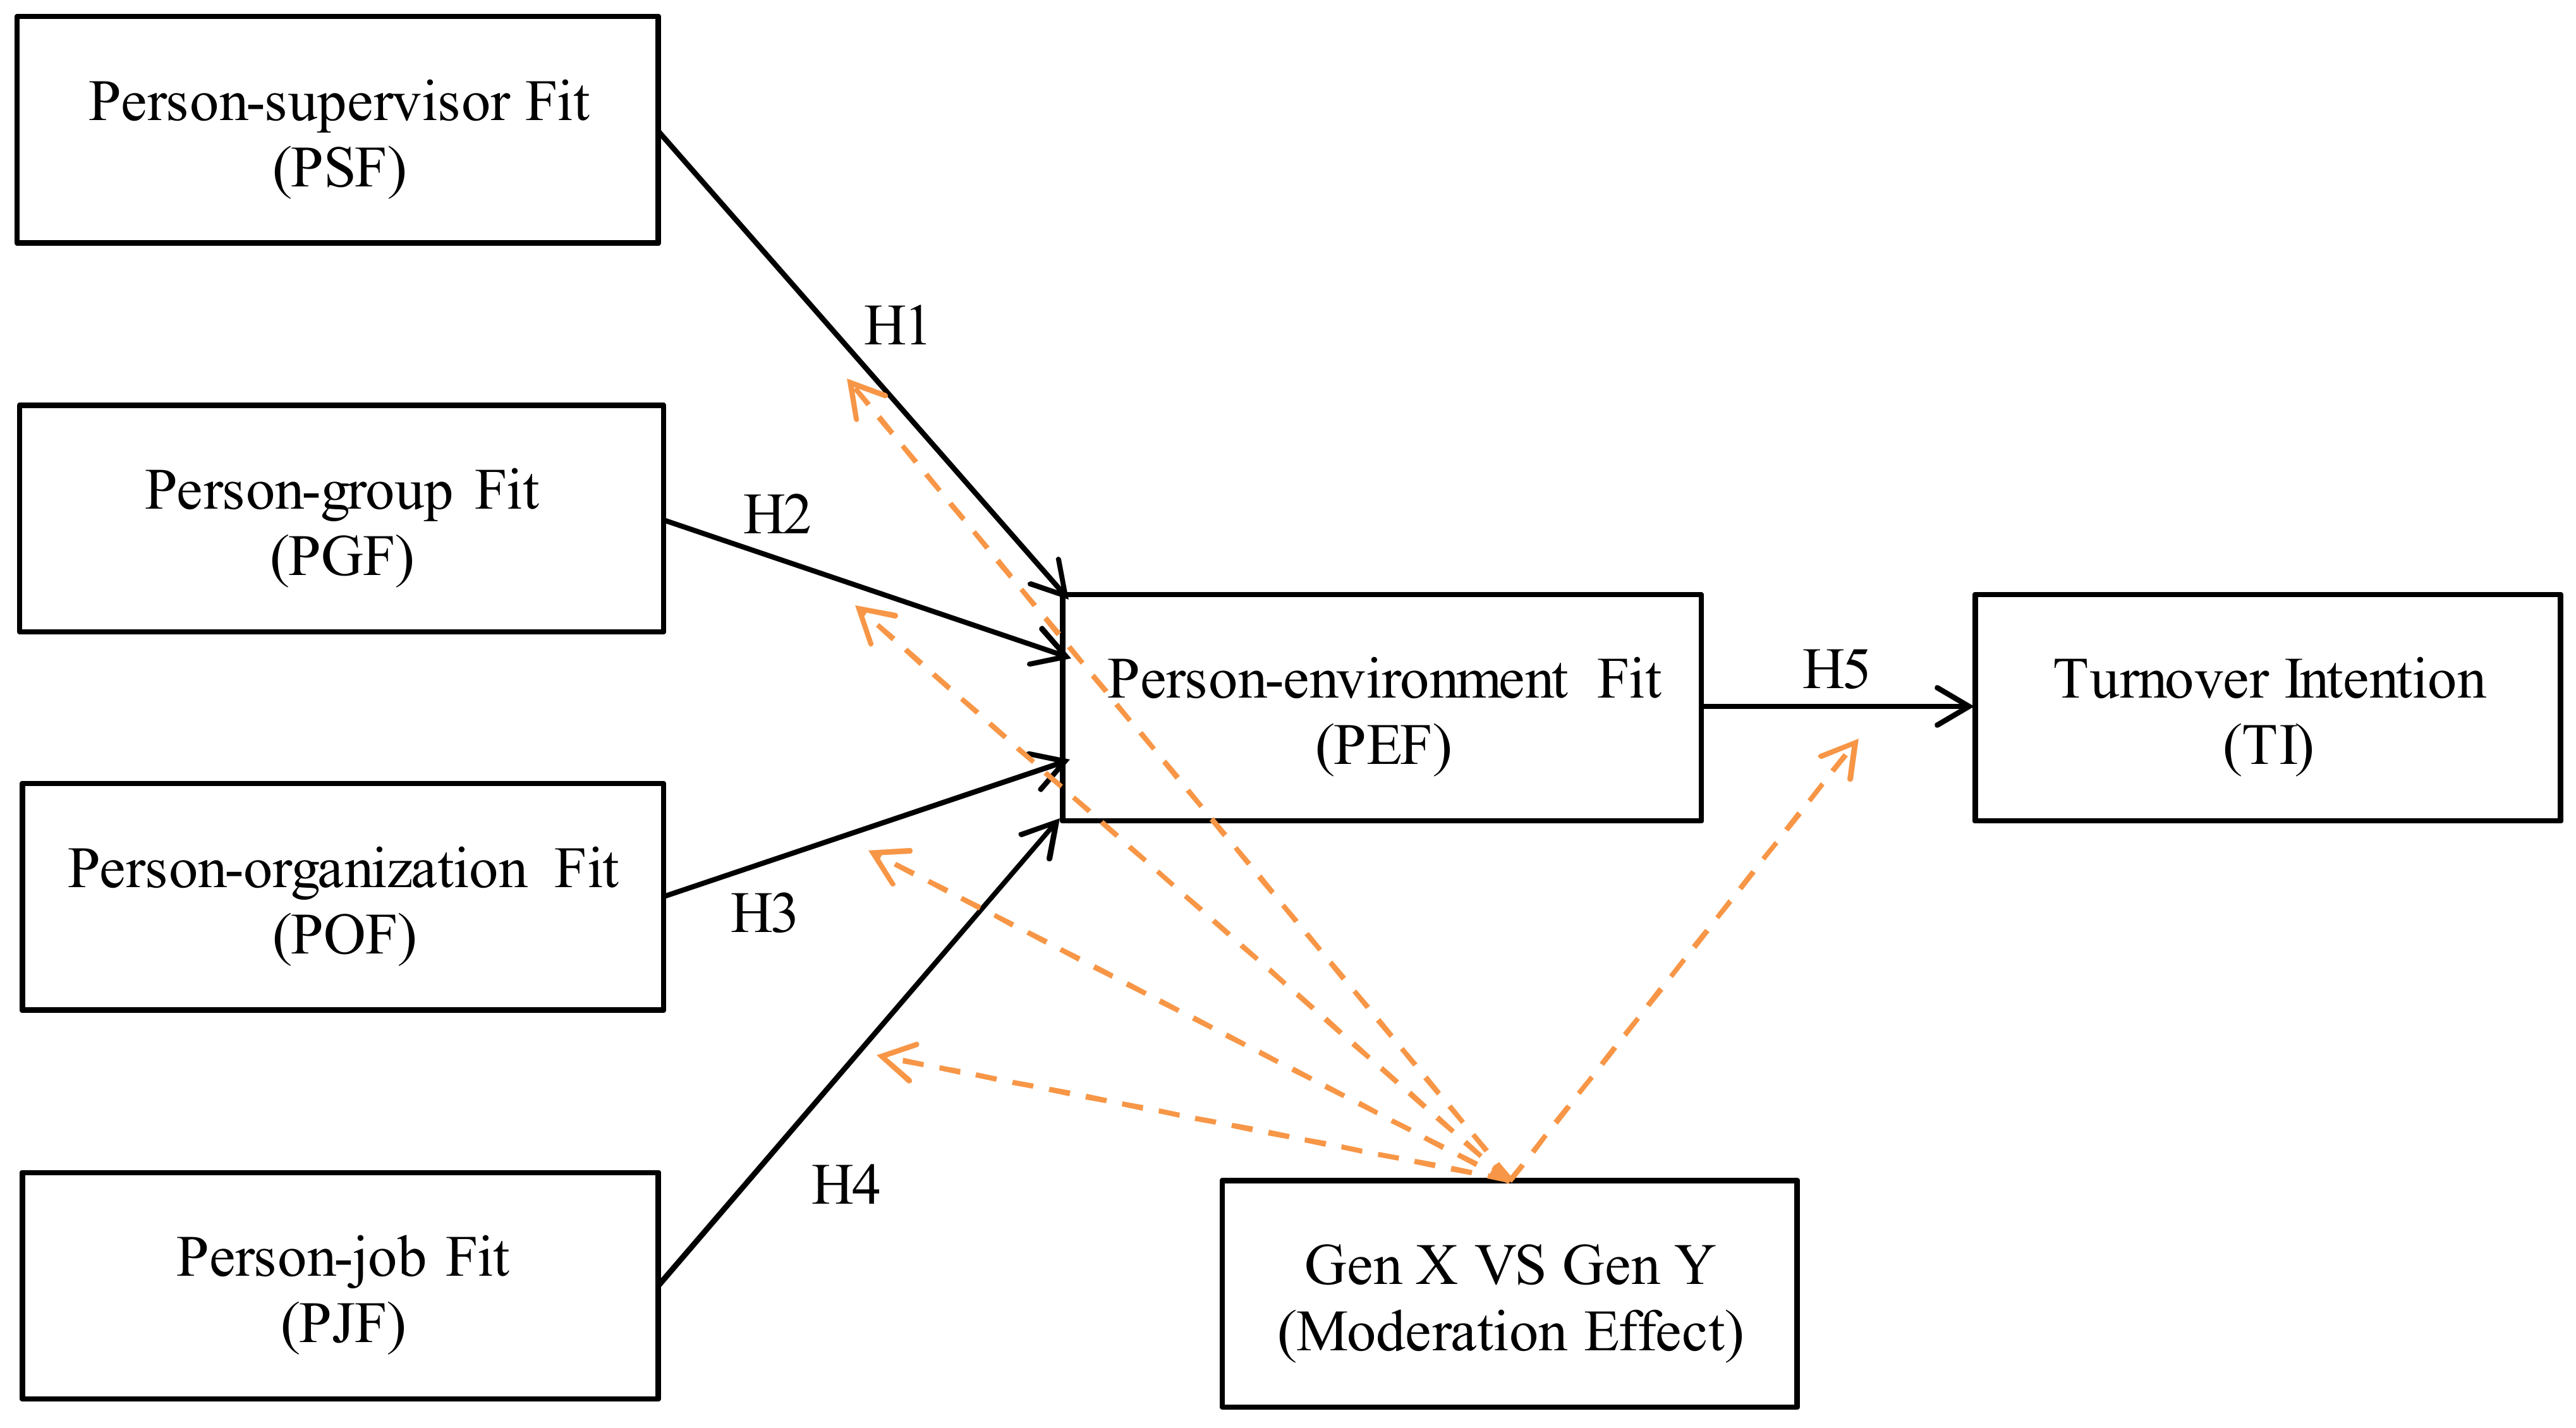
2.1. Person–Environment Fit (PEF) Theory and Turnover Intention (TI)
2.2. Person–Supervisor Fit (PSF)
2.3. Person–Group Fit (PGF)
2.4. Person–Organization Fit (POF)
2.5. Person–Job Fit (PJF)
2.6. Moderating Roles of Generational Differences
3. Methodology
3.1. Participants, Sampling, and Data Collection
3.2. Measures
3.3. Statistical Procedure and Analysis
4. Results
4.1. Step 1: Measurement Model (Confirmatory Analysis)
4.1.1. Goodness of Fit
4.1.2. Convergent Validity
4.1.3. Discriminant Validity
4.2. Step 2: Structural Model
4.3. Step 3: Multigroup Moderation Analysis
4.3.1. Measurement Invariance Analysis
4.3.2. Z-Test for Loading Differences between Generation X and Y
5. Main Discussion
6. Conclusions
6.1. General Findings
6.2. Implications
6.2.1. Theoretical Implications
6.2.2. Practical Implications
6.3. Limitations and Future Research
Author Contributions
Funding
Institutional Review Board Statement
Informed Consent Statement
Data Availability Statement
Acknowledgments
Conflicts of Interest
Appendix A. Construct, Scales, and Measures
| Construct | Indicator | Scale | Measure/Question |
| Turnover Intention | TI1 | Likert scale | I am currently seriously considering leaving my current job to work at another company. 1. 2. 3. 4. 5. |
| TI2 | Likert scale | I will quit this company if the given working condition gets even a little worse than now. 1. 2. 3. 4. 5. | |
| TI3 | Likert scale | I will quit my job at my current organization in 1 year or less. 1. 2. 3. 4. 5. | |
| TI4 | Likert scale | I will probably search for a new job in the next year. 1. 2. 3. 4. 5. | |
| Person–Organization Fit | POF1 | Likert scale | My organization meets my major needs well. 1. 2. 3. 4. 5. |
| POF2 | Likert scale | My personal values match my organization’s values and culture. 1. 2. 3. 4. 5. | |
| POF3 | Likert scale | I feel that my personal values are a good fit for this organization. 1. 2. 3. 4. 5. | |
| POF4 | Likert scale | I feel that I am a good fit for this organizational culture. 1. 2. 3. 4. 5. | |
| Person–Job Fit | PJF1 | Likert scale | I am the right type of person for this type of work. 1. 2. 3. 4. 5. |
| PJF2 | Likert scale | My personality is a good match for my job. 1. 2. 3. 4. 5. | |
| PJF3 | Likert scale | There is a good match between the requirements of this job and my skills. 1. 2. 3. 4. 5. | |
| PJF4 | Likert scale | My education and knowledge are a good match for my job. 1. 2. 3. 4. 5. | |
| Person–Supervisor Fit | PSF1 | Likert scale | My manager is supportive of my ideas and ways of getting things done. 1. 2. 3. 4. 5. |
| PSF2 | Likert scale | My boss is flexible about how I accomplish my job. 1. 2. 3. 4. 5. | |
| PSF3 | Likert scale | My boss gives me the authority to do my job. 1. 2. 3. 4. 5. | |
| PSF4 | Likert scale | I can trust my boss to back me up on decisions I make in the field. 1. 2. 3. 4. 5. | |
| Person–Group Fit | PGF1 | Likert scale | Working with the other people in my group is one of the best parts of this job. 1. 2. 3. 4. 5. |
| PGF2 | Likert scale | I get along well with the people I work with on a day-to-day basis. 1. 2. 3. 4. 5. | |
| PGF3 | Likert scale | There is not much conflict among the members of my group. 1. 2. 3. 4. 5. | |
| PGF4 | Likert scale | If I had more free time, I would enjoy spending more time with my co-worker. 1. 2. 3. 4. 5. | |
| Person–Environment Fit | PEF1 | Likert scale | There is a good fit between what my job offers me and what I am looking for in a job. 1. 2. 3. 4. 5. |
| PEF2 | Likert scale | The attributes that I look for in a job are fulfilled very well by my present job. 1. 2. 3. 4. 5. | |
| PEF3 | Likert scale | This organization fulfills my needs. 1. 2. 3. 4. 5. | |
| PEF4 | Likert scale | I feel that this organization enables me to do the kind of work I want to do. 1. 2. 3. 4. 5. | |
| Source: Data adapted from [16,28]. | |||
References
- Strauss, W.; Howe, N. The Fourth Turning: What the Cycles of History Tell Us about America’s Next Rendezvous with Destiny: Crown; Broadway Book: New York, NY, USA, 2009. [Google Scholar]
- McGarry Wolf, M.; Carpenter, S.; Qenani-Petrela, E. A comparison of X, Y, and Boomer Generation Wine Consumers in California. J. Food Distrib. Res. 2005, 36, 186–191. [Google Scholar]
- Cox, A.; Hannif, Z.; Rowley, C. Leadership styles and generational effects: Examples of US companies in Vietnam. Int. J. Hum. Resour. Manag. 2014, 25, 1–22. [Google Scholar] [CrossRef] [Green Version]
- Bartlett, M. Analyst: Understanding what shapes generation can help the CU market to that generation. Credit. Union J. 2004, 8, 14–17. Available online: https://clutejournals.com/index.php/JBER/article/view/2272/2320 (accessed on 6 June 2023).
- Smola, W.K.; Sutton, C.D. Generational differences: Revisiting generational work values for the new millennium. J. Organ. Behav. Int. J. Ind. Occup. Organ. Psychol. Behav. 2002, 23, 363–382. [Google Scholar] [CrossRef]
- Mahmoud, A.B.; Hack-Polay, D.; Reisel, W.D.; Fuxman, L.; Grigoriou, N.; Mohr, I.; Aizouk, R. Who’s more vulnerable? A generational investigation of COVID-19 perceptions’ effect on Organisational citizenship Behaviours in the MENA region: Job insecurity, burnout and job satisfaction as mediators. BMC Public Health 2021, 21, 1951. [Google Scholar] [CrossRef]
- Bressler, M.S. COVID reboot: Making a case for cultural change to increase employee engagement. J. Bus. Entrep. 2022, 31, 7. [Google Scholar]
- Napathorn, C. How Should the Labor Market Adapt When Most Salaried People Continue to Resign? 2022. Available online: https://tu.ac.th/thammasat-260965-tbs-expert-talk-the-great-resignation (accessed on 10 January 2023).
- Dols, J.D.; Chargualaf, K.A.; Martinez, K.S. Cultural and generational considerations in RN retention. JONA J. Nurs. Adm. 2019, 49, 201–207. [Google Scholar] [CrossRef]
- Na-Nan, K.; Kanthong, S.N.; Dhienhirun, A. Development and validation of an instrument to measure turnover intention of Generation Y in Thailand. Int. J. Organ. Anal. 2020, 29, 682–698. [Google Scholar] [CrossRef]
- Hitka, M.; Lorincová, S.; Potkány, M.; Balážová, Ž.; Caha, Z. Differentiated approach to employee motivation in terms of finance. J. Bus. Econ. Manag. 2021, 22, 118–134. [Google Scholar] [CrossRef]
- National Statistical Office (2022). Skill Development and Labour Potential: Population 15 Years and Over by Age Group, Desirability to Develop and Sex Whole Kingdom: 2014–2021. Available online: http://statbbi.nso.go.th/staticreport/page/sector/en/02.aspx (accessed on 9 January 2023).
- George, F., Jr. Ethical person-environment fit: An integrative definition, key findings, and a call for future research. Hum. Res. Manag. Rev. 2022, 32, 100840. [Google Scholar] [CrossRef]
- Vleugels, W.; Verbruggen, M.; De Cooman, R.; Billsberry, J. A systematic review of temporal person-environment fit research: Trends, developments, obstacles, and opportunities for future research. J. Organ. Behav. 2022, 44, 376–398. [Google Scholar] [CrossRef]
- Howard, M.C.; Cogswell, J.E. A meta-analysis of polychronicity: Applying modern perspectives of multitasking and person-environment fit. Organ. Psychol. Rev. 2022, 2022, 3370. [Google Scholar] [CrossRef]
- Ketkaew, C.; Manglakakeeree, O.; Naruetharadhol, P. The interrelationships of work-related factors, person-environment fit, and employee turnover intention. Cogent Bus. Manag. 2020, 7, 1823580. [Google Scholar] [CrossRef]
- Ramos, J.R.; Ferreira, M.C.; Martins, L.F. Person-Organization Fit and Turnover Intentions: Organizational Trust as a Moderator. Psico-USF 2022, 26, 707–717. [Google Scholar] [CrossRef]
- Hoole, C.; Bonnema, J. Work engagement and meaningful work across generational cohorts. SA J. Hum. Resour. Manag. 2015, 13, a681. [Google Scholar] [CrossRef]
- Kerse, G.; Koçak, D.; Babadağ, M. Relationship between Person–Environment Fit Types and Turnover Intention: A Moderated Mediation Model. Organ. Mark. Emerg. Econ. 2022, 13, 384–405. [Google Scholar] [CrossRef]
- Zyl van, L.E.; Vuuren van, H.A.; Roll, L.C.; Stander, M.W. Person-environment fit and task performance: Exploring the role (s) of grit as a personal resource. Curr. Psychol. 2022, 1–20. [Google Scholar] [CrossRef]
- Amarneh, S.; Raza, A.; Matloob, S.; Alharbi, R.K.; Abbasi, M.A. The influence of person-environment fit on the turnover intention of nurses in Jordan: The moderating effect of psychological empowerment. Nurs. Res. Pract. 2021, 2021, 6688603. [Google Scholar] [CrossRef]
- Zhuo, F.; Yuan, L. The impact of knowledge distance on turnover intention of millennial employees: From the perspective of Mianzi. J. Knowl. Manag. 2021, 26, 2558–2578. [Google Scholar] [CrossRef]
- Goetz, N.; Wald, A.; Freisinger, E. A person-environment-fit-model for temporary organizations-Antecedents for temporary working settings. Int. J. Proj. Manag. 2021, 39, 1–9. [Google Scholar] [CrossRef]
- Wang, D.; Zong, Z.; Mao, W.; Wang, L.; Maguire, P.; Hu, Y. Investigating the relationship between person–environment fit and safety behavior: A social cognition perspective. J. Saf. Res. 2021, 79, 100–109. [Google Scholar] [CrossRef] [PubMed]
- Kyeong, K.; Kim, M. Why and how are millennials sensitive to unfairness? Focusing on the moderated mediating role of generation on turnover intention. Asia Pac. J. Public Adm. 2022, 1–24. [Google Scholar] [CrossRef]
- Lee, C.C.; Lim, H.S.; Seo, D.J.; Kwak, D.H.A. Examining employee retention and motivation: The moderating effect of employee generation. In Evidence-Based HRM: A Global Forum for Empirical Scholarship; Emerald Publishing Limited: Bingley, UK, 2022. [Google Scholar]
- Kristof-Brown, A.I. Person-organization fit: An integrative review of its conceptualizations, measurement, and implication. Pers. Psychol. 1996, 49, 1–49. [Google Scholar] [CrossRef]
- Abbas, A.; Shah, S.H.A.; Deen, K.A. The effect of person-environment fit on turnover intentions of employees with the mediating role of job satisfaction in banking sector of Pakistan. Eur. J. Bus. Manag. 2015, 7, 47–59. Available online: https://iiste.org/Journals/index.php/EJBM/article/view/26951/27634 (accessed on 2 June 2023).
- Pariyanti, E.; Adawiyah, W.R.; Wulandari, S.Z. We need to talk about kinship: How kinship weakens turnover intentions among academicians at private higher education institutions in Indonesia. J. Appl. Res. High. Educ. 2022; ahead of print. [Google Scholar] [CrossRef]
- Phonthanukitithaworn, C.; Ketkaew, C.; Naruetharadhol, P. Relevant factors for success as an online entrepreneur in Thailand. SAGE Open 2019, 9, 1757. [Google Scholar] [CrossRef]
- Roman-Calderon, J.P.; Gonzales-Miranda, D.R.; García, G.A.; Gallo, O. Colombian millennials at the workplace. Evid. Based HRM 2019, 7, 249–261. [Google Scholar] [CrossRef]
- Moreno, A.; Navarro, C.; Fuentes-Lara, C. Factors affecting turnover intentions among Millennial public relations professionals: The Latin American case. Public Relat. Inq. 2022, 11, 81176. [Google Scholar] [CrossRef]
- Berber, N.; Gašić, D.; Katić, I.; Borocki, J. The Mediating Role of Job Satisfaction in the Relationship between FWAs and Turnover Intentions. Sustainability 2022, 14, 4502. [Google Scholar] [CrossRef]
- Lewin, K. Dynamic Theory of Personality; McGraw-Hill: New York, NY, USA, 1935. [Google Scholar]
- Liao, P.Y. Proactive personality, job crafting, and person-environment fit: Does job autonomy matter? Curr. Psychol. 2022, 1–12. [Google Scholar] [CrossRef]
- Mitchell, T.R.; Holtom, B.C.; Lee, T.W.; Erez, M. Why people stay: Using job embeddedness to predict voluntary turnover. Acad. Manag. J. 2001, 44, 1102–1121. [Google Scholar] [CrossRef]
- Dawis, R.V.; Lofquist, L.H. A Psychological Theory of Work Adjustment; University of Minnesota Press: Minneapolis, MN, USA, 1984. [Google Scholar]
- Kristof-brown, A.L.; Zimmerman, R.D.; Johnson, E.C. Consequences of individuals’ fit at work: A meta-analysis of person-job, person-organization, person-group, and person-supervisor fit. Pers. Psychol. 2005, 58, 281–342. [Google Scholar] [CrossRef]
- March, J.; Simon, H. Organizations; John Wiley & Sons: New York, NY, USA, 1958. [Google Scholar]
- Ajzen, I. Perceived behavioral control, self-efficacy, locus of control, and the theory of planned behavior. J. Appl. Soc. Psychol. 2002, 32, 665–683. [Google Scholar] [CrossRef]
- Krishnan, D.S.G.; Wesley, D.J.; Bhaskaran, R. Perceived person-environment fit and employees’ turnover intention. Int. J. Curr. Adv. Res. 2017, 6, 5218–5224. [Google Scholar]
- Takase, M.; Maude, P.; Manias, E. Nurses’ job dissatisfaction and turnover intention: Methodological myths and an alternative approach. Nurs. Health Sci. 2005, 7, 209–217. [Google Scholar] [CrossRef]
- Bluedorn, A.C. The Theories of Turnover: Causes, Effects, and Meaning; JAI Press: Greenwich, CT, USA, 1982. [Google Scholar]
- Price, J. Reflection on the determinants of voluntary turnover. Int. J. Manpow. 2001, 22, 600–624. [Google Scholar] [CrossRef]
- Bigliardi, B.; Petroni, A.; Dormio, A.I. Organizational socialization career aspirations and turnover intentions among design engineers. Leadersh. Organ. Dev. J. 2005, 26, 424–441. [Google Scholar] [CrossRef]
- Antonioni, D.; Park, H. The effects of personality similarity on peer ratings of contextual work behaviors. Pers. Psychol. 2001, 54, 331–360. [Google Scholar] [CrossRef]
- Graves, L.M.; Powell, G.N. The effect of sex similarity on recruiters’ evaluations of actual applicants: A test of the similarity–attraction paradigm. Pers. Psychol. 1995, 48, 85–98. [Google Scholar] [CrossRef]
- Turban, D.B.; Jones, A.P. Supervisor–subordinate similarity: Types, effects, and mechanisms. J. Appl. Psychol. 1988, 73, 228–234. [Google Scholar] [CrossRef] [Green Version]
- Guzman, F.A.; Fu, X. Leader–subordinate congruence in power distance values and voice behaviour: A person–supervisor fit approach. Appl. Psychol. 2022, 71, 271–295. [Google Scholar] [CrossRef]
- Adkins, C.L.; Russell, C.J.; Werbel, J.D. Judgments of fit in the selection process: The role of work value congruence. Pers. Psychol. 1994, 47, 605–623. [Google Scholar] [CrossRef]
- Van Vianen, A.E.M. Person–organization fit: The match between newcomers’ and recruiters’ preferences for organizational cultures. Pers. Psychol. 2000, 53, 113–149. [Google Scholar] [CrossRef]
- Colbert, A.E. Understanding the Effects of Transformational Leadership: The Mediating Role of Leader-Follower Value Congruence. Ph.D. Thesis, University of Iowa, Iowa, IA, USA, 2004. [Google Scholar]
- Krishnan, V.R. Transformational leadership and value system congruence. Int. J. Value Based Manag. 2002, 15, 19–33. [Google Scholar] [CrossRef]
- Schaubroeck, J.; Lam, S.S.K. How similarity to peers and supervisors influences organizational advancement in different cultures. Acad. Manag. J. 2002, 45, 1120–1136. [Google Scholar] [CrossRef] [Green Version]
- Witt, L.A. Enhancing goal congruence: A solution to organizational politics. J. Appl. Psychol. 1998, 83, 666–674. [Google Scholar] [CrossRef]
- Becker, T.E. Foci and bases of commitment: Are they distinctions worth making? Acad. Manag. J. 1992, 35, 232–244. [Google Scholar] [CrossRef]
- Becker, T.E.; Billings, R.S.; Eveleth, D.M.; Gilbert, N.L. Foci and bases of employee commitment: Implications for job performance. Acad. Manag. J. 1996, 39, 464–482. [Google Scholar] [CrossRef]
- Jena, L.K.; Goyal, S. Emotional intelligence and employee innovation: Sequential mediating effect of person-group fit and adaptive performance. Eur. Rev. Appl. Psychol. 2022, 72, 100729. [Google Scholar] [CrossRef]
- Chuang, A.; Shen, C.T.; Judge, T.A. Development of a multidimensional instrument of person-environment fit: The perceived person-environment fit scale (PPEFS). Appl. Psychol. Int. Rev. 2016, 65, 66–98. [Google Scholar] [CrossRef]
- Riordan, C.M. Relational Demography within Groups: Past Developments, Contradictions, and New Directions. In Research in Personnel and Human Resource Management; Ferris, G.R., Ed.; JAI Press: Stamford, CT, USA, 2000; Volume 19, pp. 131–173. [Google Scholar]
- Kristof-Brown, A.L.; Jansen, K.J.; Colbert, A.E. A policy-capturing study of the simultaneous effects of fit with jobs, groups, and organizations. J. Appl. Psychol. 2002, 87, 985–993. [Google Scholar] [CrossRef]
- Seong, J.Y.; Kristof-Brown, A.L. Testing multidimensional models of person-group fit. J. Manag. Psychol. 2012, 27, 536–556. [Google Scholar] [CrossRef]
- Kristof-Brown, A.L.; Stevens, C.K. Goal congruence in project teams: Does the fit between members’ personal mastery and performance goals matter? J. Appl. Psychol. 2001, 86, 1083–1095. [Google Scholar] [CrossRef]
- Hoffman, B.J.; Woehr, D.J. A quantitative review of the relationship between person-organization fit and behavioral outcomes. J. Vocat. Behav. 2006, 68, 389–399. [Google Scholar] [CrossRef]
- Srisathan, W.A.; Ketkaew, C.; Naruetharadhol, P. The intervention of organizational sustainability in the effect of organizational culture on open innovation performance: A case of Thai and Chinese SMEs. Cogent Bus. Manag. 2020, 7, 1717408. [Google Scholar] [CrossRef]
- Arthur, W., Jr.; Bell, S.T.; Villado, A.J.; Doverspike, D. The use of person-organization fit in employment decision making: An assessment of its criterion-related validity. J. Appl. Psychol. 2006, 91, 786–801. [Google Scholar] [CrossRef] [Green Version]
- Kim, T.-Y.; Aryee, S.; Loi, R.; Kim, S.-P. Person–organization fit and employee outcomes: The test of a social exchange model. Int. J. Hum. Resour. Manag. 2013, 24, 3719–3737. [Google Scholar] [CrossRef]
- Schneider, B. Fits about fit. Appl. Psychol. Int. Rev. 2001, 50, 141–152. [Google Scholar] [CrossRef]
- Verquer, M.L.; Beehr, T.A.; Wagner, S.H. A meta-analysis of relations between person-organization fit and work attitudes. J. Vocat. Behav. 2003, 63, 473–489. [Google Scholar] [CrossRef]
- Edwards, J.R. Person–job fit: A conceptual integration, literature review, and methodological critique. In International Review of Industrial and Organizational Psychology; Cooper, C., Ed.; Wiley: London, UK, 1991; Volume 6, pp. 283–357. [Google Scholar]
- Goetz, N.; Wald, A. Similar but different? The influence of job satisfaction, organizational commitment and person-job fit on individual performance in the continuum between permanent and temporary organizations. Int. J. Proj. Manag. 2022, 40, 251–261. [Google Scholar] [CrossRef]
- Caplan, R.D. Person–environment fit: Past, present, and future. In Stress Research; Cooper, C.L., Ed.; Wiley: New York, NY, USA, 1983; pp. 35–78. [Google Scholar]
- Naruetharadhol, P.; Wongsaichia, S.; Van Wouwe, M.; Ketkaew, C. Career status, retirement readiness, and age differences: Empirical evidence from skilled immigrants in Thailand. Cogent Bus. Manag. 2021, 8, 1885572. [Google Scholar] [CrossRef]
- Vraňaková, N.; Gyurák Babeľová, Z.; Chlpeková, A. Sustainable human resource management and generational diversity: The importance of the age management pillars. Sustainability 2021, 13, 8496. [Google Scholar] [CrossRef]
- Çelik, A.A.; Kılıç, M.; Altındağ, E.; Öngel, V.; Günsel, A. Does the Reflection of Foci of Commitment in Job Performance Weaken as Generations Get Younger? A Comparison between Gen X and Gen Y Employees. Sustainability 2021, 13, 9271. [Google Scholar] [CrossRef]
- Weerarathne, R.S.; Walpola, M.D.C.P.; Piyasiri, A.D.W.D.; Jayamal, I.; Wijenayaka, T.; Pathirana, Y. ‘Leave or remain’: Intentions of Gen X and Y employees. Qual. Quant. 2023, 57, 2249–2268. [Google Scholar] [CrossRef]
- Hair, J.F.; Anderson, R.E.; Babin, B.J.; Black, W.C. Multivariate Data Analysis: A Global Perspective, 7th ed.; Pearson Education: London, UK, 2010. [Google Scholar]
- Phonthanukitithaworn, C.; Naruetharadhol, P.; Gebsombut, N.; Chanavirut, R.; Onsa-ard, W.; Joomwanta, P.; Chanyuan, Z.; Ketkaew, C. An Investigation of the Relationship Among Medical Center’s Image, Service Quality, and Patient Loyalty. SAGE Open 2020, 10, 2304. [Google Scholar] [CrossRef]
- Open Government Data of Thailand (2021), Data of Small and Medium Enterprises 2012–2021. Available online: https://data.go.th/dataset/https-sme-go-th-th-page-php-modulekey-348 (accessed on 2 June 2023).
- Kline, R.B. Methodology in the Social Sciences. Principles and Practice of Structural Equation Modeling; Guilford Press: New York, NY, USA, 2016. [Google Scholar]
- Buschmann, A. Conducting a street-intercept survey in an authoritarian regime: The case of Myanmar. Soc. Sci. Q. 2019, 100, 857–868. [Google Scholar] [CrossRef]
- Cooksey, R.W. Illustrating Statistical Procedures: For Business, Behavioural and Social Science Research; Tilde University Press: Prahran, Australia, 2007. [Google Scholar]
- MacKenzie, S.B.; Podsakoff, P.M. Common method bias in marketing: Causes, mechanisms, and procedural remedies. J. Retail. 2012, 88, 542–555. [Google Scholar] [CrossRef]
- Podsakoff, P.M.; MacKenzie, S.B.; Podsakoff, N.P. Sources of method bias in social science research and recommendations on how to control it. Annu. Rev. Psychol. 2012, 63, 539–569. [Google Scholar] [CrossRef] [PubMed] [Green Version]
- Ahmad, S.; Islam, T.; Sadiq, M.; Kaleem, A. Promoting green behavior through ethical leadership: A model of green human resource management and environmental knowledge. Leadersh. Organ. Dev. J. 2021, 42, 531–547. [Google Scholar] [CrossRef]
- Anderson, J.C.; Gerbing, D.W. Structural equation modeling in practice: A review and recommended two-step approach. Psychol. Bull. 1988, 103, 411–423. [Google Scholar] [CrossRef]
- Fornell, C.; Larcker, D.F. Structural Equation Models with Unobservable Variables and Measurement Error: Algebra and Statistics. J. Mark. Res. 1981, 18, 382. [Google Scholar] [CrossRef]
- Bacon, D.R.; Sauer, P.L.; Young, M. Composite Reliability in Structural Equations Modeling. Educ. Psychol. Meas. 1995, 55, 394–406. [Google Scholar] [CrossRef]
- Steenkamp, J.E.M.; Baumgartner, H. Assessing measurement invariance in cross-national consumer research. J. Consum. Res. 1998, 25, 78–107. [Google Scholar] [CrossRef] [Green Version]
- Byrne, B.M. Structural Equation Modeling with Mplus: Basic Concepts, Applications, and Programming, 1st ed.; Routledge: New York, NY, USA, 2016. [Google Scholar] [CrossRef]
- Gao, S.; Mokhtarian, P.L.; Johnston, R.A. Nonnormality of data in structural equation models. Transp. Res. Rec. 2008, 2082, 116–124. [Google Scholar] [CrossRef] [Green Version]
- Sekaran, U. Research Methods for Business, 4th ed.; John Wiley & Sons: Hoboken, NJ, USA, 2003. [Google Scholar]
- Tabachnick, B.G.; Fidell, L.S. Using Multivariate Statistics, 5th ed.; Pearson: Boston, MA, USA, 2007. [Google Scholar]
- Byrne, B.M. Structural Equation Modeling with AMOS: Basic Concepts, Applications, and Programming (Multivariate Applications Series); Taylor & Francis Group: New York, NY, USA, 2010; Volume 396, p. 7384. [Google Scholar]
- Hair, J.F.; Celsi, M.; Ortinau, D.J.; Bush, R.P. Essentials of Marketing Research; McGraw-Hill: New York, NY, USA, 2008. [Google Scholar]
- Sahoo, M. Structural Equation Modeling: Threshold Criteria for Assessing Model Fit. In Methodological Issues in Management Research: Advances, Challenges, and the Way Ahead; Emerald Publishing Limited: Bingley, UK, 2019. [Google Scholar]
- Browne, M.W.; Cudeck, R. Alternative ways of assessing model fit. Sociol. Methods Res. 1992, 21, 230–258. [Google Scholar] [CrossRef]


| Demographic Variables | Categories | Amount | Percentage |
|---|---|---|---|
| Gender | Male | 166 | 41.50 |
| Female | 234 | 58.50 | |
| Total | 400 | 100 | |
| Age | Generation X (43 to 57 years old) | 294 | 73.50 |
| Generation Y (27 to 42 years old) | 106 | 26.50 | |
| Total | 400 | 100 | |
| Education | High school | 120 | 30 |
| Bachelor’s degree | 235 | 58.75 | |
| Graduate degree | 35 | 8.75 | |
| Diploma | 10 | 2.50 | |
| Total | 400 | 100 |
| Fit Indices | Value | Threshold | Assessment |
|---|---|---|---|
| Chi-Square | 512.633 | ||
| df | 237 | ||
| p-value | 0.000 | Acceptable for complex model | |
| Chi-Square/df | 2.163 | ≤5.00 | Pass |
| CFI | 0.945 | ≥0.90 | Pass |
| IFI | 0.945 | ≥0.90 | Pass |
| TLI | 0.936 | ≥0.90 | Pass |
| RMSEA | 0.055 | ≤0.08 | Pass |
| Indicator | Construct | Estimate | p-Value | Cronbach Alpha | AVE | CR |
|---|---|---|---|---|---|---|
| PSF1 | PSF | 0.84 | *** | |||
| PSF2 | PSF | 0.787 | *** | |||
| PSF3 | PSF | 0.745 | *** | |||
| PSF4 | PSF | 0.818 | *** | 0.875 | 0.637 | 0.875 |
| PGF1 | PGF | 0.749 | *** | |||
| PGF2 | PGF | 0.723 | *** | |||
| PGF3 | PGF | 0.652 | *** | |||
| PGF4 | PGF | 0.72 | *** | 0.804 | 0.507 | 0.804 |
| POF1 | POF | 0.652 | *** | |||
| POF2 | POF | 0.831 | *** | |||
| POF3 | POF | 0.836 | *** | |||
| POF4 | POF | 0.818 | *** | 0.868 | 0.621 | 0.866 |
| PJF1 | PJF | 0.826 | *** | |||
| PJF2 | PJF | 0.826 | *** | |||
| PJF3 | PJF | 0.776 | *** | |||
| PJF4 | PJF | 0.681 | *** | 0.892 | 0.673 | 0.892 |
| PEF1 | PEF | 0.556 | *** | |||
| PEF2 | PEF | 0.689 | *** | |||
| PEF3 | PEF | 0.748 | *** | |||
| PEF4 | PEF | 0.797 | *** | 0.798 | 0.497 | 0.796 |
| TI1 | TI | 0.87 | *** | |||
| TI2 | TI | 0.712 | *** | |||
| TI3 | TI | 0.919 | *** | |||
| TI4 | TI | 0.88 | *** | 0.912 | 0.721 | 0.911 |
| TI | PEF | PJF | POF | PGF | PSF | |
|---|---|---|---|---|---|---|
| TI | 0.849 | |||||
| PEF | −0.338 | 0.705 | ||||
| PJF | −0.429 | 0.657 | 0.82 | |||
| POF | −0.391 | 0.672 | 0.677 | 0.788 | ||
| PGF | −0.12 | 0.304 | 0.48 | 0.517 | 0.712 | |
| PSF | −0.223 | 0.491 | 0.521 | 0.513 | 0.354 | 0.798 |
| Fit Indices | Value | Threshold | Assessment |
|---|---|---|---|
| Chi-Square | 541.185 | ||
| df | 241 | ||
| p-value | 0.000 | Acceptable for complex model | |
| Chi-Square/df | 2.246 | ≤5.00 | Pass |
| CFI | 0.940 | ≥0.90 | Pass |
| IFI | 0.941 | ≥0.90 | Pass |
| TLI | 0.931 | ≥0.90 | Pass |
| RMSEA | 0.057 | ≤0.08 | Pass |
| Hypothesis | Endovenous Variable | Exogenous Variable | Standardized Estimate | p-Value | Result |
|---|---|---|---|---|---|
| H1 | PSF | PEF | 0.122 | 0.039 ** | Supported |
| H2 | PGF | PEF | −0.153 | 0.015 ** | Contradicted |
| H3 | POF | PEF | 0.443 | >0.001 *** | Supported |
| H4 | PJF | PEF | 0.39 | >0.001 *** | Supported |
| H5 | PEF | TI | −0.394 | >0.001 *** | Supported |
| Fit Indices | Configural Invariance | Metric Invariance | Scalar Invariance | Threshold |
|---|---|---|---|---|
| p-value | 0 | 0 | 0 | |
| Chi-Square/df | 1.691 | 1.679 | 1.639 | ≤5.00 |
| CFI | 0.935 | 0.934 | 0.935 | ≥0.90 |
| IFI | 0.936 | 0.935 | 0.936 | ≥0.90 |
| TLI | 0.925 | 0.926 | 0.930 | ≥0.90 |
| RMSEA | 0.043 | 0.042 | 0.041 | ≤0.08 |
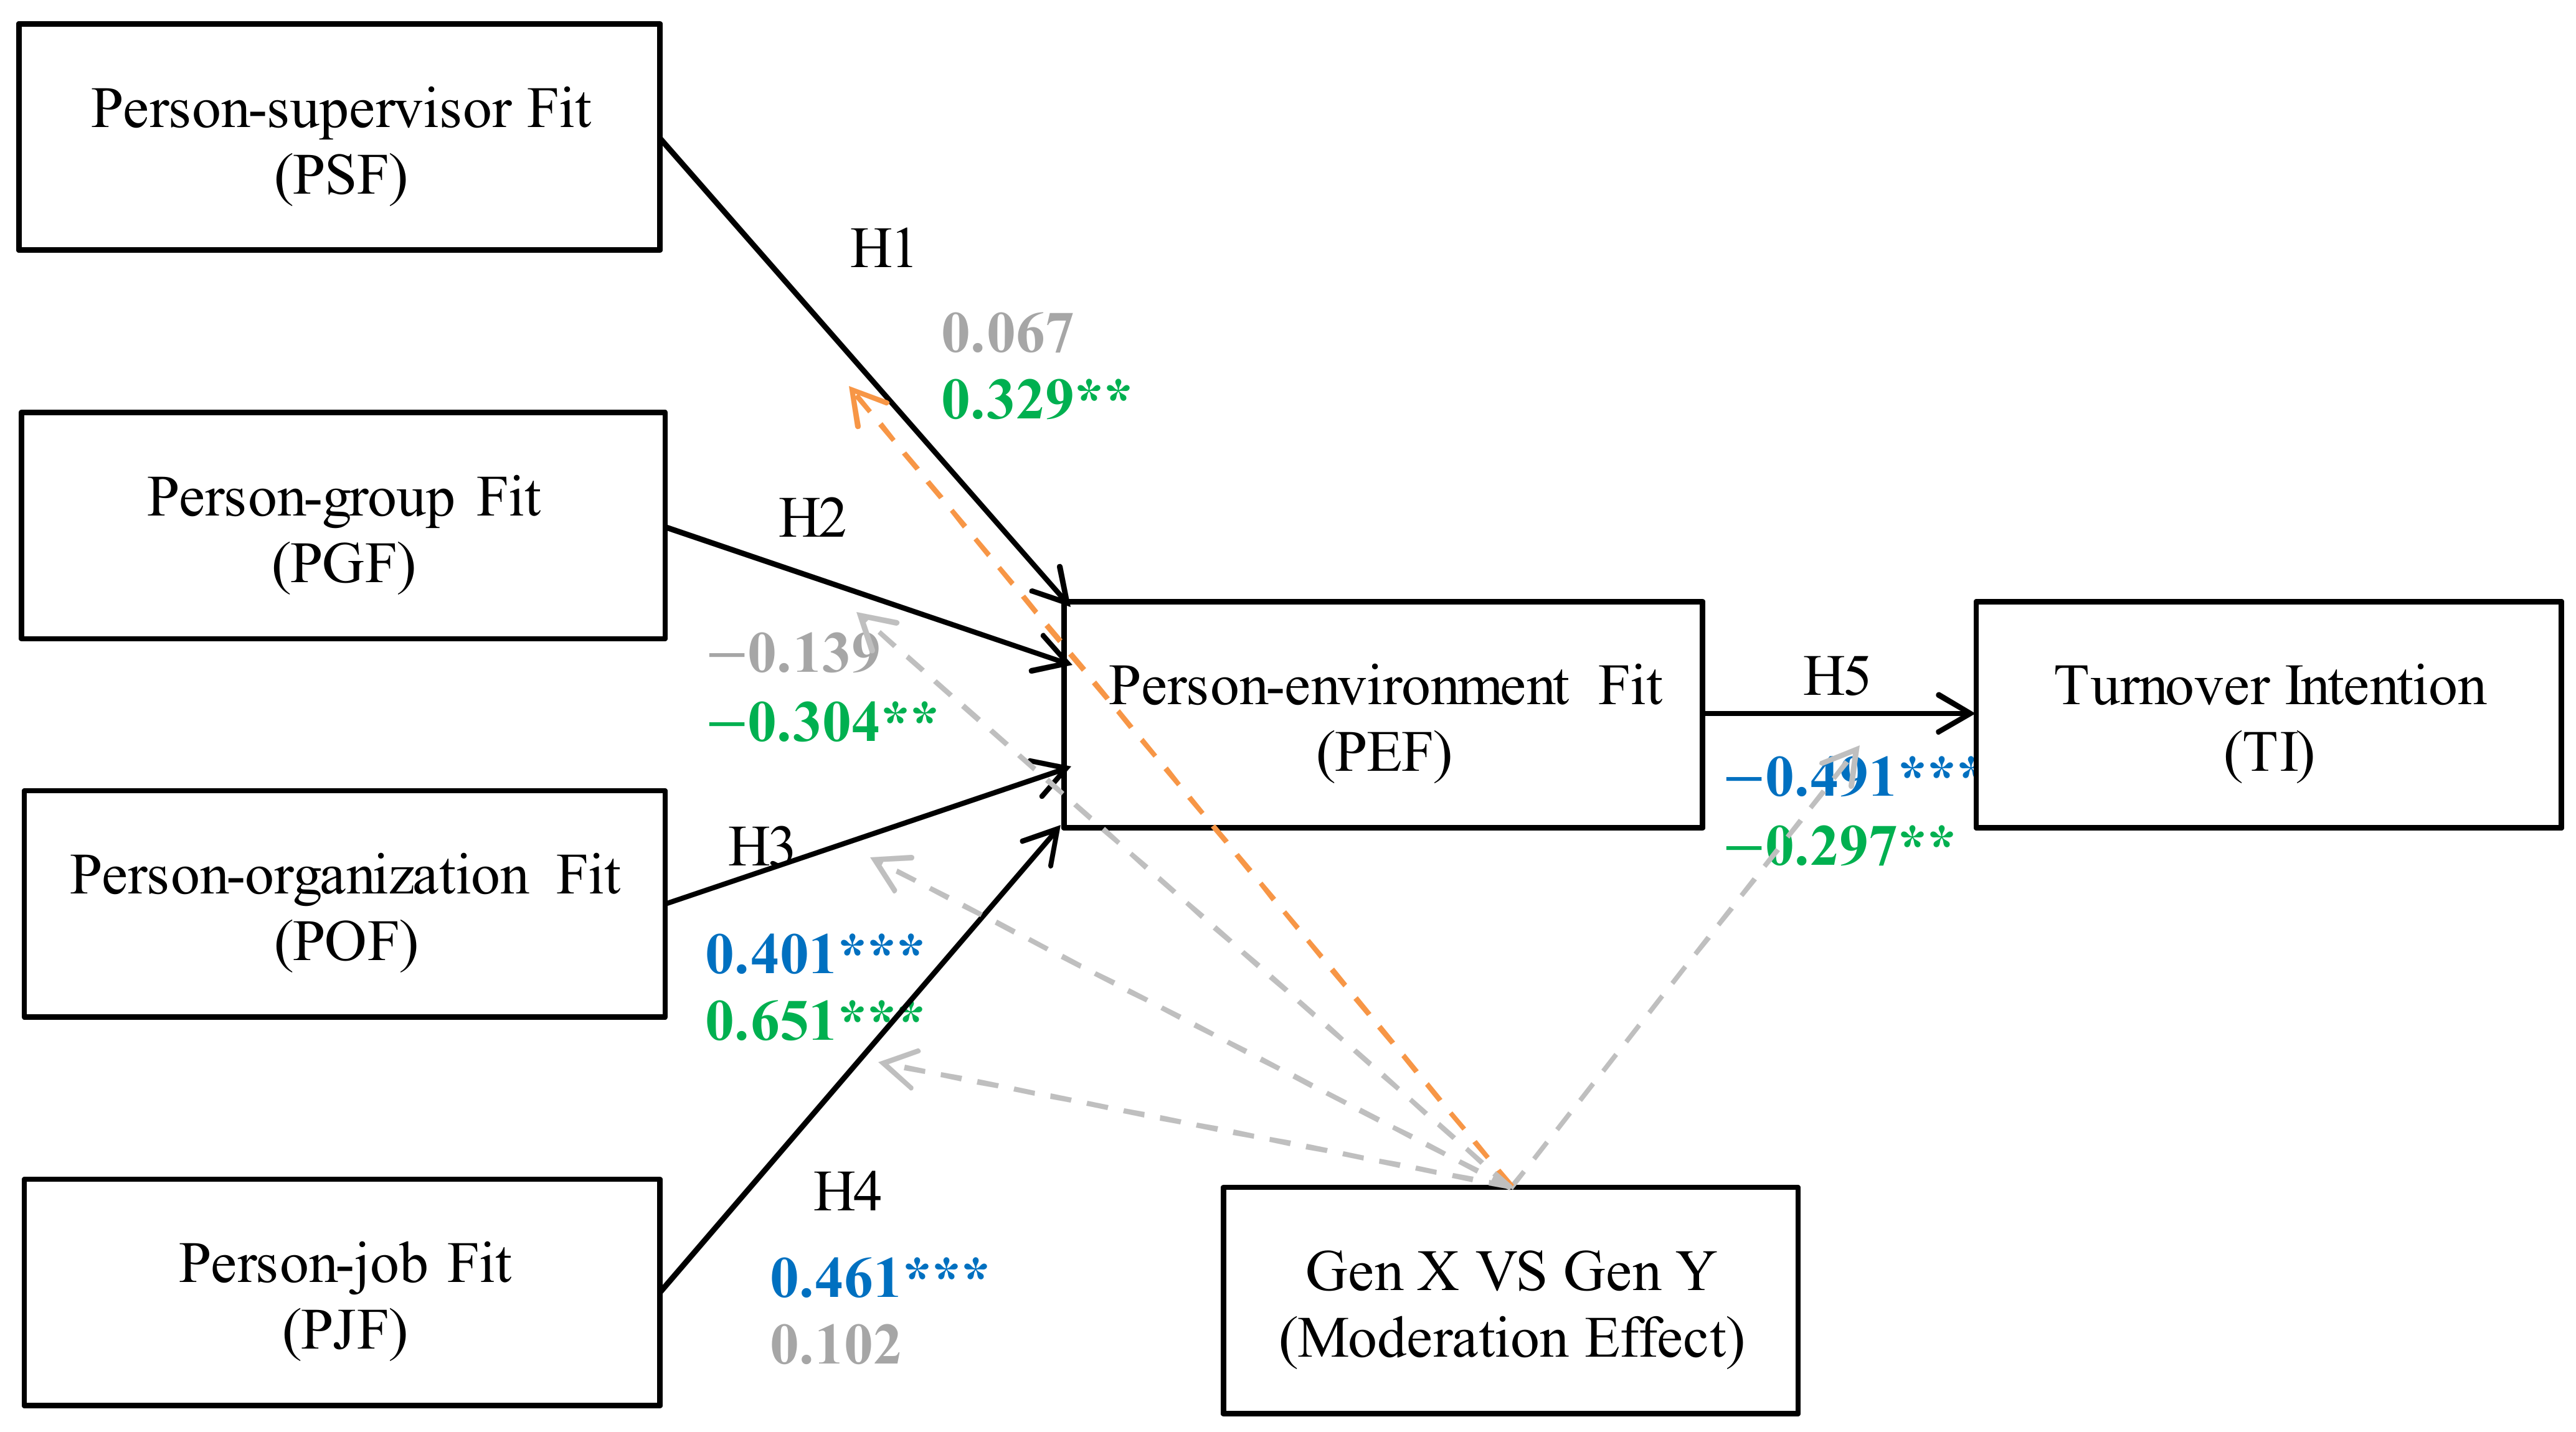
| Path | Relationship | Standardized Loading | Critical Ratio Difference | Threshold | |
|---|---|---|---|---|---|
| Gen X | Gen Y | ||||
| H1 | PSF --> PEF | 0.067 | 0.329 ** | 2.052 ** | 1.96 |
| H2 | PGF --> PEF | −0.139 | −0.304 ** | −1.518 | −1.96 |
| H3 | POF --> PEF | 0.401 *** | 0.651 *** | 1.156 | 1.96 |
| H4 | PJF --> PEF | 0.461 *** | 0.102 | −1.474 | −1.96 |
| H5 | PEF --> TI | −0.419 *** | −0.297 ** | 1.38 | 1.96 |
Disclaimer/Publisher’s Note: The statements, opinions and data contained in all publications are solely those of the individual author(s) and contributor(s) and not of MDPI and/or the editor(s). MDPI and/or the editor(s) disclaim responsibility for any injury to people or property resulting from any ideas, methods, instructions or products referred to in the content. |
© 2023 by the authors. Licensee MDPI, Basel, Switzerland. This article is an open access article distributed under the terms and conditions of the Creative Commons Attribution (CC BY) license (https://creativecommons.org/licenses/by/4.0/).
Share and Cite
Rattanapon, K.; Jorissen, A.; Jones, K.P.; Ketkaew, C. An Analysis of Multigenerational Issues of Generation X and Y Employees in Small- and Medium-Sized Enterprises in Thailand: The Moderation Effect of Age Groups on Person–Environment Fit and Turnover Intention. Behav. Sci. 2023, 13, 489. https://doi.org/10.3390/bs13060489
Rattanapon K, Jorissen A, Jones KP, Ketkaew C. An Analysis of Multigenerational Issues of Generation X and Y Employees in Small- and Medium-Sized Enterprises in Thailand: The Moderation Effect of Age Groups on Person–Environment Fit and Turnover Intention. Behavioral Sciences. 2023; 13(6):489. https://doi.org/10.3390/bs13060489
Chicago/Turabian StyleRattanapon, Kanokon, Ann Jorissen, Kevin Paul Jones, and Chavis Ketkaew. 2023. "An Analysis of Multigenerational Issues of Generation X and Y Employees in Small- and Medium-Sized Enterprises in Thailand: The Moderation Effect of Age Groups on Person–Environment Fit and Turnover Intention" Behavioral Sciences 13, no. 6: 489. https://doi.org/10.3390/bs13060489