Article

A Psychometric Study of the Prosocial Behavior Scale: Differential Item Functioning by Gender

by
Sara Martínez-Gregorio
*,
José M. Tomás
and
Amparo Oliver
Department of Methodology for the Behavioral Sciences, Faculty of Psychology and Speech Therapy, University of Valencia, Av. Blasco Ibáñez 21, 46010 Valencia, Spain
*
Author to whom correspondence should be addressed.
Behav. Sci. 2023, 13(3), 259; https://doi.org/10.3390/bs13030259
Submission received: 25 January 2023 / Revised: 7 March 2023 / Accepted: 9 March 2023 / Published: 15 March 2023
(This article belongs to the Section Educational Psychology)

Abstract

:
Some scales co-exist in the literature to measure prosocial behavior in adolescents. Gender differences in prosocial behavior have been a controversial topic of research. To strengthen future research in the area, the psychometric properties of the most used instruments must be guaranteed, especially its gender non-bias. Our study provides psychometric evidence for the Prosocial Behavior Scale in a sample of adolescents, exploring: (a) its factor structure; (b) reliability; (c) gender-related differential item functioning (DIF); (d) nomological validity. A sample of 512 high school students (mean age = 13.62 (SD = 1.34), 51.6% females) participated in the research. Confirmatory Factor Analysis (CFA) was used to test the factor structure of the scale, which adequately fitted the data (χ2 (35) = 152.224, p < 0.001, Comparative Fit Index (CFI) = 0.905, Root Mean Squared Error of Approximation (RMSEA) = 0.085 90%CI [0.072–0.099], Standardized Root Mean Squared Residual (SRMR) = 0.079). Reliability results were good (α = 0.74, ω = 0.74). Regarding the DIF, five items presented some gender-related bias, generally benefiting females. However, the DIF impact could be considered negligible. Correlations with the subdimensions of the psychological capital offered evidence of the nomological validity of the scale. In conclusion, the scale presented adequate psychometric properties that support its ability to effectively assess prosocial behavior and gender differences in the prosocial behavior samples of adolescents. Additionally, the results obtained imply that gender differences in the manifestations of prosocial behavior require measurements that can fairly sample behaviors characteristic of each gender.

1. Introduction

Prosocial behavior refers to voluntary actions conducted to benefit others [1]. Although this behavioral tendency would be positive along the lifespan, it may be crucial in some early stages as adolescence. Previous empirical research supports the idea that prosocial behavior promotes positive academic outcomes [2], psychosocial adjustment [3,4], and well-being [5,6].
Different self-reported scales for assessing prosocial behavior in adolescents co-exist in the literature. Table 1 includes the scales most widely used internationally. Some of them approach the construct from multidimensional perspectives, whereas others present a unidimensional structure. The Objective Measure of Prosocial Reasoning (PROM) method [7] includes stories that invoke a conflict between adolescent needs, wants, and desires and those of others. The respondents are asked to decide what the main character of the story should do, showing their prosocial reasoning. Another multidimensional worldly spread instrument is the Prosocial Tendencies Measure—Revised (PTM-R) [8]. This is the adapted version for adolescents of the Prosocial Tendencies Measure (PTM) [9]. Not being that common, the Teenage Inventory of Social Skills (TISS) [10] measures prosocial behaviors such as cooperation or altruism in one of their two sub-scales. Complementary, the other one assesses asocial behaviors such as aggression or social anxiety.
Broad instruments for adolescent adjustment can also include a dimension for prosociality. That is the case for the Strengths and Difficulties Questionnaire (SDQ) [11]. The SDQ is a screening tool for assessing psychosocial adjustment in children and adolescents. Despite not being prosocial-specific, it presents a five-item subdimension that measures prosocial behavior. The use of this dimension as a prosociality scale is interesting because it has been included in the National Health Survey in Europe [12]; therefore, a large quantity of data is available. The SDQ has alternative versions wherein the rater is a teacher or the parents [12,13]. Although our work is focused on self-reported prosociality scales, there are other alternatives for assessing prosocial behavior with external raters, such as the prosocial with peers subscale in the Child Behavior Scale (CBS) [14] or the parent-report Brief Adolescent Prosocial Perceptions Scale (BAPPS-P) [15]. The latter has a self-reported alternative, the BAPPS-S. However, to date, it has been scarcely used.
The last scale widely used to assess prosocial behavior is the Prosocial Behavior Scale (PBS) [16], which is different from the Adult Prosocial Behavior Scale [17]. PBS is a 10-item unidimensional scale. Originally, it included 15 items; however, five of them are control items that are not taken into consideration for the total prosocial behavior score. It has been mainly used in a Spanish-speaking context, where we can find many articles using it in the last 20 years [18,19,20,21,22,23,24,25,26,27,28,29,30,31,32]. Although being widely used, a proper psychometric study for the Spanish adaptation has never been carried out. Some papers refer to Del Barrio et al. [33] to justify the adequate psychometric properties of the instrument. However, it is a widespread mislead. Del Barrio et al. [33] studied the psychometric properties of the Aggression and Emotional Instability scales from Caprara and Pastorelli [16], but not the psychometric properties of the PBS. Through previously cited research, we know that its reliability results range between 0.60 and 0.85 [18,19,20,21,22,23,24,25,26,27,28,29,30,31,32]. However, only two previous studies have reported evidence about its factor structure [19,26]. Carlo et al. [19] found problems with one item and reported the Confirmatory Factor Analysis (CFA) results of a reduced version with nine items. Consequently, as far as our concern, Malonda et al. [26] were the first authors to report a satisfactory adjustment of the unidimensional structure.
This lack of a properly complete and more updated psychometric study of the PBS affects specifically the validity related evidence. For example, some relevant aspects such as the gender-related differential item functioning remain understudied. By gender-related differential item functioning, we refer to the fact that the item score depends not just on the prosocial behavior of the respondent, as it would also vary considering their gender. Gender differences, while studying global prosocial behavior, consistently benefit females [34]. Some authors have argued that, rather than a matter of grade differences in the actual prosocial behavior, there are perhaps differences in how each individual, females and males, acts prosocially [35]. Eagly [36] concluded that females present more prosocial behavior related to communal attributes, whereas males’ prosocial behavior may be more agentic. Consequently, it has been criticized that the items of prosocial behavior scales may typically reflect gender-role stereotypes, being more prevalent on the female-type of prosocial behavior [37]. Xiao et al. [38] conducted a meta-analysis of gender differences in adolescents using the PTM-R. They found that gender differences were higher in those dimensions considered “gender-type prosocial behavior”. Females report higher levels of altruistic, compliant, and emotional prosocial behavior, whereas males present higher levels of public prosocial behavior [38]. Similarly, Nielson et al. [37] noticed that, on prosocial behaviors oriented to peers, females presented higher emotional support, inclusion, and sharing.
Table 1. Instruments for assessing prosocial behavior in adolescents.
ScaleOriginal AuthorsN ItemsDimensionsPsychometric StudiesRecent Applications
Objective Measure of Prosocial Reasoning (PROM)Carlo et al. [7]56 itemsHedonistic, needs-oriented, approval, stereotypic, and internalizedEnglish [7]; Spanish [27,39]; Chinese [40]; Portuguese [41][42,43]
Prosocial Behavior Scale (PBS)Caprara and Pastorelli [16]10 itemsUnidimensionalItalian [16]; Spanish [26][20,32]
Prosocial Tendencies Measure—Revised (PTM-R)Carlo et al. [8]25 itemsAltruistic, compliant, emotional, dire, public and anonymousEnglish [8]; German [44]; Lithuanian [41]; Chinese [45]; Portuguese [46]; Spanish [30][38,47]
Strengths and Difficulties Questionnaire (SDQ)—Prosocial dimensionGoodman [11]5 itemsUnidimensionalEnglish [11]; Chinese [48]; Dutch [49,50]; German [51]; Norwegian [52] Spanish [12,53,54]; French [55]; Swedish [51,56]; Cypriot Greek [51]; Italian [51][57,58]
Teenage Inventory of Social Skills (TISS)Inderbitzen and Foster [10]40 itemsProsocial behavior and asocial behaviorEnglish [10]; Spanish [59][60]
The complexity of the measurement of gender differences in prosocial behavior requires robust psychometric studies that guarantee adequate item functioning. These efforts have been previously carried out when studying the gender invariance of the SDQ [12,53], the PTM-R [18,30], and the PROM [39]. All of them were reported in a multigroup CFA analysis conducted to examine invariance across gender. However, not all of them achieved a scalar gender invariance. Ortuño-Sierra et al. [53] did not test scalar invariance, and only tested the equivalences of the structure and factor loadings, that is, metric invariance. Carlo et al. [39] did not find support for the scalar gender invariance of the PROM, finding differences in five-item intercepts.
Although previous research has used the PBS to explore gender differences in prosocial behavior [18,24,61], its gender-related differential item functioning has never been analyzed. Research with other scales of prosociality suggests that this aspect is crucial to effectively measure prosociality in both genders, not being affected by a gendered vision of prosociality. Consequently, given the importance of the PBS in a Spanish context, a proper psychometric study to guarantee its reliability and validity in its Spanish form is required. Therefore, our study aims to evaluate the psychometric properties in its Spanish adaptation. The study has four objectives: (a) to verify its one-dimensionality; (b) to test its reliability; (c) to explore its gender-related differential item functioning; (d) to collect evidence of its nomological validity. The following hypotheses are derived from these objectives:
Hypothesis 1 (H1).
The PBS has a unidimensional structure.
Hypothesis 2 (H2).
The reliability results of the scale in Spanish adolescents are adequate.
Hypothesis 3 (H3).
The items of the PBS do not present gender-related differential functioning.
Hypothesis 4 (H4).
The results of the PBS are positively related to the psychological capital of the students, as evidence of nomological validity [62,63].

2. Materials and Methods

2.1. Participants

The sample was composed of 512 high school students from Valencia, Spain. The mean age was 13.62 (SD = 1.34). Of the participants, 51.6% (n = 264) were females and 45.5% (n = 233) were males. Nine students (1.8%) self-identified themselves as “other” and six did not answer the question. Regarding their high schools, 57.22% (n = 293) attended public ones, whereas 26.37% (n = 135) attend private or semi-private ones. Most of the respondents were studying compulsory secondary education: 132 (25.8%) in their first course, 83 (16.2%) in their second course, 190 (37.1%) in their third course, and 72 (14.1%) in the fourth course. Twenty-five students were in post-compulsory secondary education, baccalaureate: 21 (14.1%) were in their first year and 4 (0.8%) were in the second and final year. The remaining 2% (n = 10) did not declare which course they were attending.

2.2. Procedure

The sampling for the study was performed at the convenience of the educational centers that were supportive of the research. The only inclusion criteria were that the students were in secondary education and that their families agreed to their participation; no exclusion criteria were considered. The survey and procedure met the American Psychological Association (APA) Ethical Standards for human research and were approved by the Research Ethics Committee of the University of Valencia as well as the Educational Government of Valencia (UV-INV_ETICA-1218680). The research team contacted the high school education authorities to present the research project and ask for their authorization to send the information to the families. In those high schools willing to participate, the families and students were informed about the research, and they signed informed consent. Participation in the survey was anonymous, voluntary, and non-rewarded.
Once informed consent was received, students answered the survey in class. The estimated duration for the entire survey was 20–25 min; however, there was no time constraint for any of the participants. Students who did not wish to participate remained in the classroom studying on their own until the rest of the classmates finished the questionnaire. As data were recruited in class, the lack of response from the participants was negligible (less than 1%).

2.3. Instruments

Alongside the socio-demographic questions (age, gender, course, and high school), two questionnaires were administered for the current research:
  • Prosocial Behavior Scale (PBS) [16]. Although this scale includes 15 items, just 10 of them ask for prosocial behavior. The remaining five items are control items that do not contribute to the total prosocial behavior score (items PB3, PB6, PB8, PB11, and PB14). This research only analyzes those items measuring prosocial behavior. However, the items are named through the manuscript, retaining their original numeration from 1 to 15. The item content is presented in Table 2. In this study, the items were administered in its Spanish form. The answer format is a 3-point Likert scale (1—never, 2—sometimes, and 3—often).
  • Psychological Capital Questionnaire (PCQ-12) [64]. This questionnaire was recently adapted and validated for Spanish adolescent samples by Tomás et al. [65]. It measures the four subdimensions of psychological capital in the educational context: self-efficacy (three items), hope (four items), resilience (three items), and optimism (two items). An example item is “I usually take stressful things at school in stride”. Following Tomás et al.’s [65] adaptation, we used a 5-point Likert response format, ranging from 1—strongly disagree to 5—strongly agree. The four-factor structure with a second-order factor fits adequately our data: χ2(50) = 269.181, p < 0.001, Comparative Fit Index (CFI) = 0.936, Root Mean Squared Error of Approximation (RMSEA) = 0.095 90%CI [0.084–0.106], and Standardized Root Mean Squared Residual (SRMR) = 0.052. The reliability results for our sample administration were for self-efficacy (α = 0.81, Ω = 0.85), hope (α = 0.76, Ω = 0.81), resilience (α = 0.37, Ω = 0.38), and optimism (α = 0.61; Ω = 0.67).

2.4. Data Analysis

The psychometric properties of the PBS were assessed following four steps: (1) factor structure, (2) descriptive statistics and reliability, (3) differential item functioning, and (4) nomological validity.
The factor structure was assessed using Confirmatory Factor Analysis (CFA) carried out in Mplus 8.7 [66]. Due to the categorical nature of the response scale, corrected Weighted Least Square Mean and Variance (WLSMV) was used as the estimation method. Some indices were considered to evaluate the adequacy of the unidimensional structure of the data [67], including (1) the chi-square test; (2) the CFI (adequate if above 0.9); (3) the RMSEA (adequate if below 0.08); (4) the SRMR (adequate if below 0.08). Full Information Maximum Likelihood methods were used for missing data, as they are reliable for missing at random (MAR) and missing completely at random (MCAR) missingness [68].
Some descriptive statistics for the items were calculated with IBM SPSS Statistics 26, i.e., means, standard deviations, skewness, kurtosis, inter-items correlations, and corrected item-total correlations. Reliability was assessed via Cronbach’s alpha and McDonald’s omega. Both indicators are considered adequate if their value is above 0.7 [69].
Next, the Differential Item Functioning (DIF) was evaluated in R [70], using the lordif package [71]. Based on the Graded Response Model, the lordif package tests DIF, estimating three nested proportional-odds logistic regression models. Model 1 expresses the cumulative probabilities that the true item response falls into if a specific response category is higher based on one’s level in the trait (in this case, the prosocial behavior). Model 2 adds the effect of the grouping variable (gender) on this probability, or uniform DIF. Model 3 includes the interaction of the trait and the grouping variable to assess non-uniform DIF. From this framework [72], the contrast of the fit of the models, in terms of the likelihood ratio test (χ2), allows us to detect different kinds of DIF. Uniform DIF is tested by comparing likelihood values for Models 1 and 2, whereas non-uniform DIF is tested by comparing Models 2 and 3. Additionally, a statistically significant result in the chi-square test between Models 1 and 3 could be interpreted as a “total DIF effect” [71]. Some authors also propose that the magnitude of DIF could be measured through changes in the pseudo-R2 statistics. We employed the McFadden pseudo-R square. Zumbo [73] set some cut-off criteria to interpret them, being results under 0.13 and 0.26 and thus considered negligible and moderate, respectively. Results above 0.26 were considered large. The DIF analysis was followed with some visual analyses of the plots the lordif package offers for items with DIF and the individual-level DIF impact.
Lastly, nomological validity was assessed through Pearson’s correlations between psychological capital subdimensions and the total score of prosocial behavior (PB). Based on previous literature, the psychological capital could be consider as a precursor of prosocial behavior [62,63]. Consequently, positive correlations between both constructs indicated the nomological validity of the PBS. This analysis was performed in IBM SPSS Statistics 26. To complement DIF analyses, a new aggregate measure of prosocial behavior (PB *), without including items with DIF, was computed and correlated with the psychological capital subdimensions and PB. Correlation comparisons were conducted between PB and PB * correlations with the psychosocial capital dimensions to assess DIF’s impact on nomological validity.

3. Results

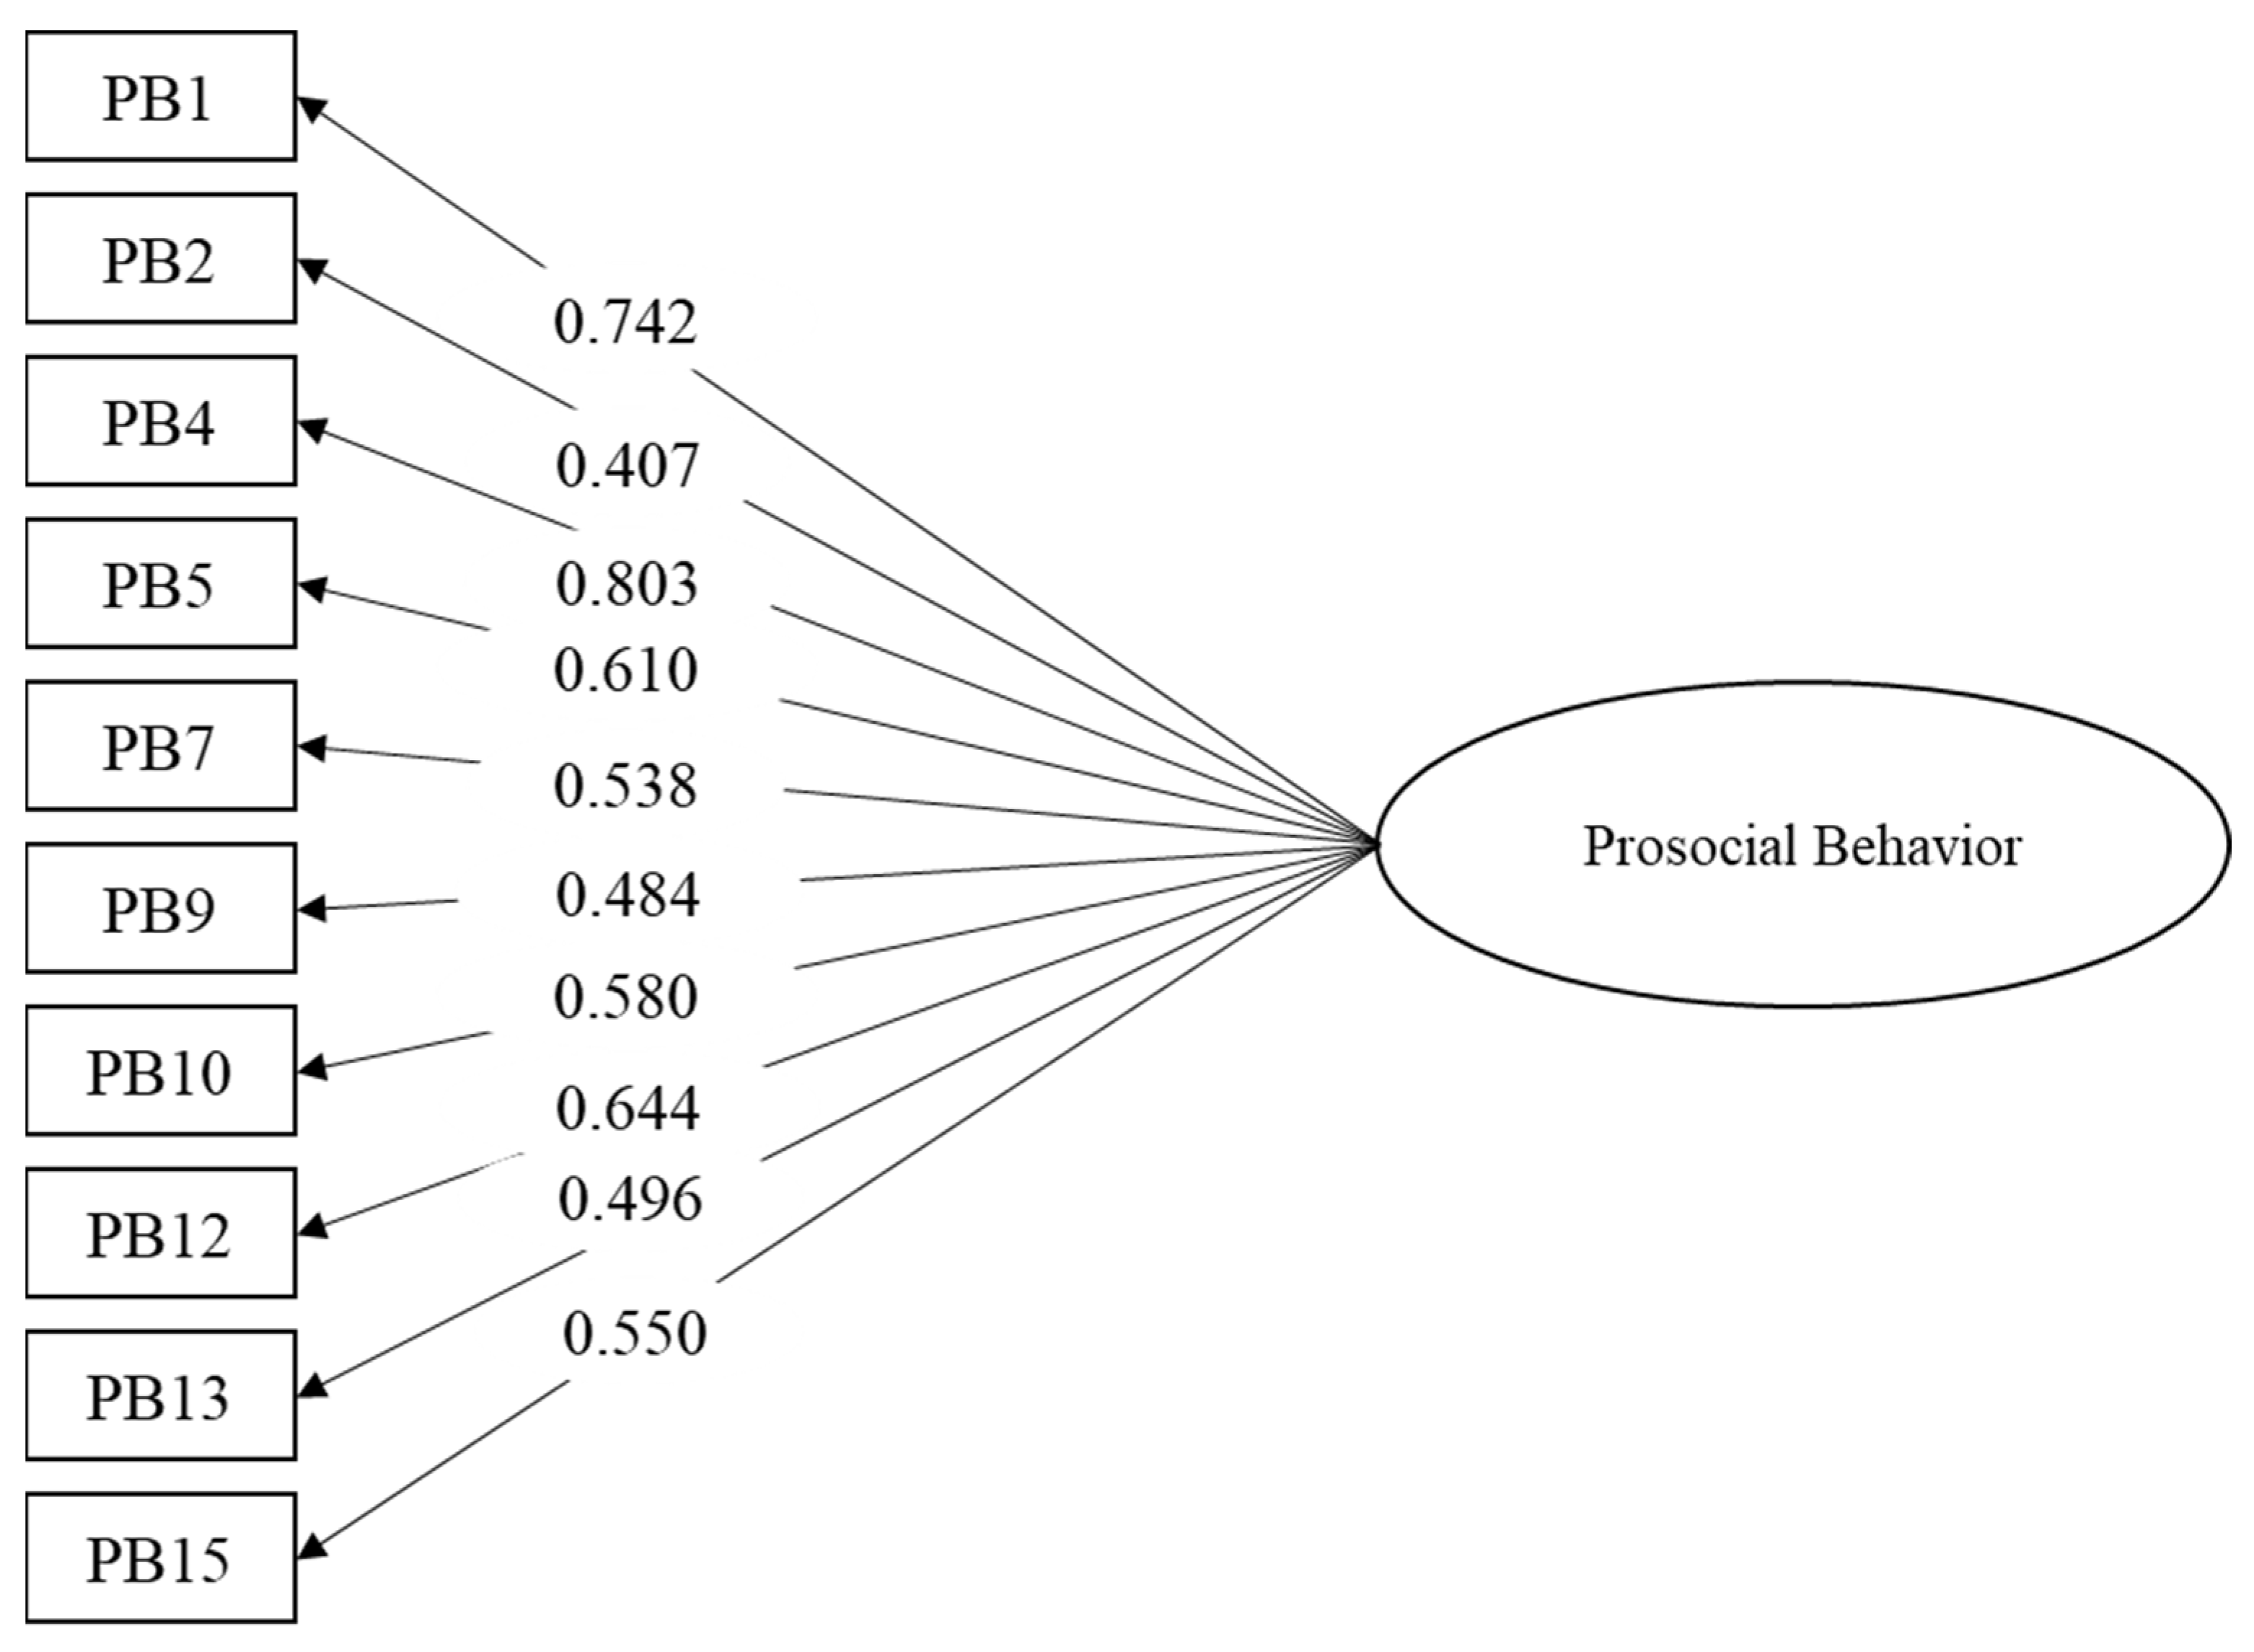
3.1. Factorial Structure

A CFA was specified and tested to verify the theoretical unidimensional structure. The model fit adequately with the data: χ2 (35) = 152.224, p < 0.001, CFI = 0.905, RMSEA = 0.085 90%CI [0.072–0.099], SRMR = 0.079. Figure 1 shows the standardized factor loadings of the items. All of them are well above 0.3, ranging between 0.407 and 0.803.

3.2. Descriptive Statistics and Internal Consistency

Table 3 includes the descriptive statistics (mean, standard deviation, skewness, kurtosis, inter-item correlation, and corrected item-total correlation) of the items. Considering that the Likert scale ranges between 1 and 3, all the item means are above the mid-point. The item-total correlations are all above 0.3. However, item 2 presents the lowest item-total correlations with non-statistically significant inter-item correlations in items 4, 5, and 9. Item 2 had the lowest factor loading, as shown in Figure 1. The reliability results for the scale are good, with a Cronbach’s alpha of 0.74 and a McDonald’s omega of 0.74.

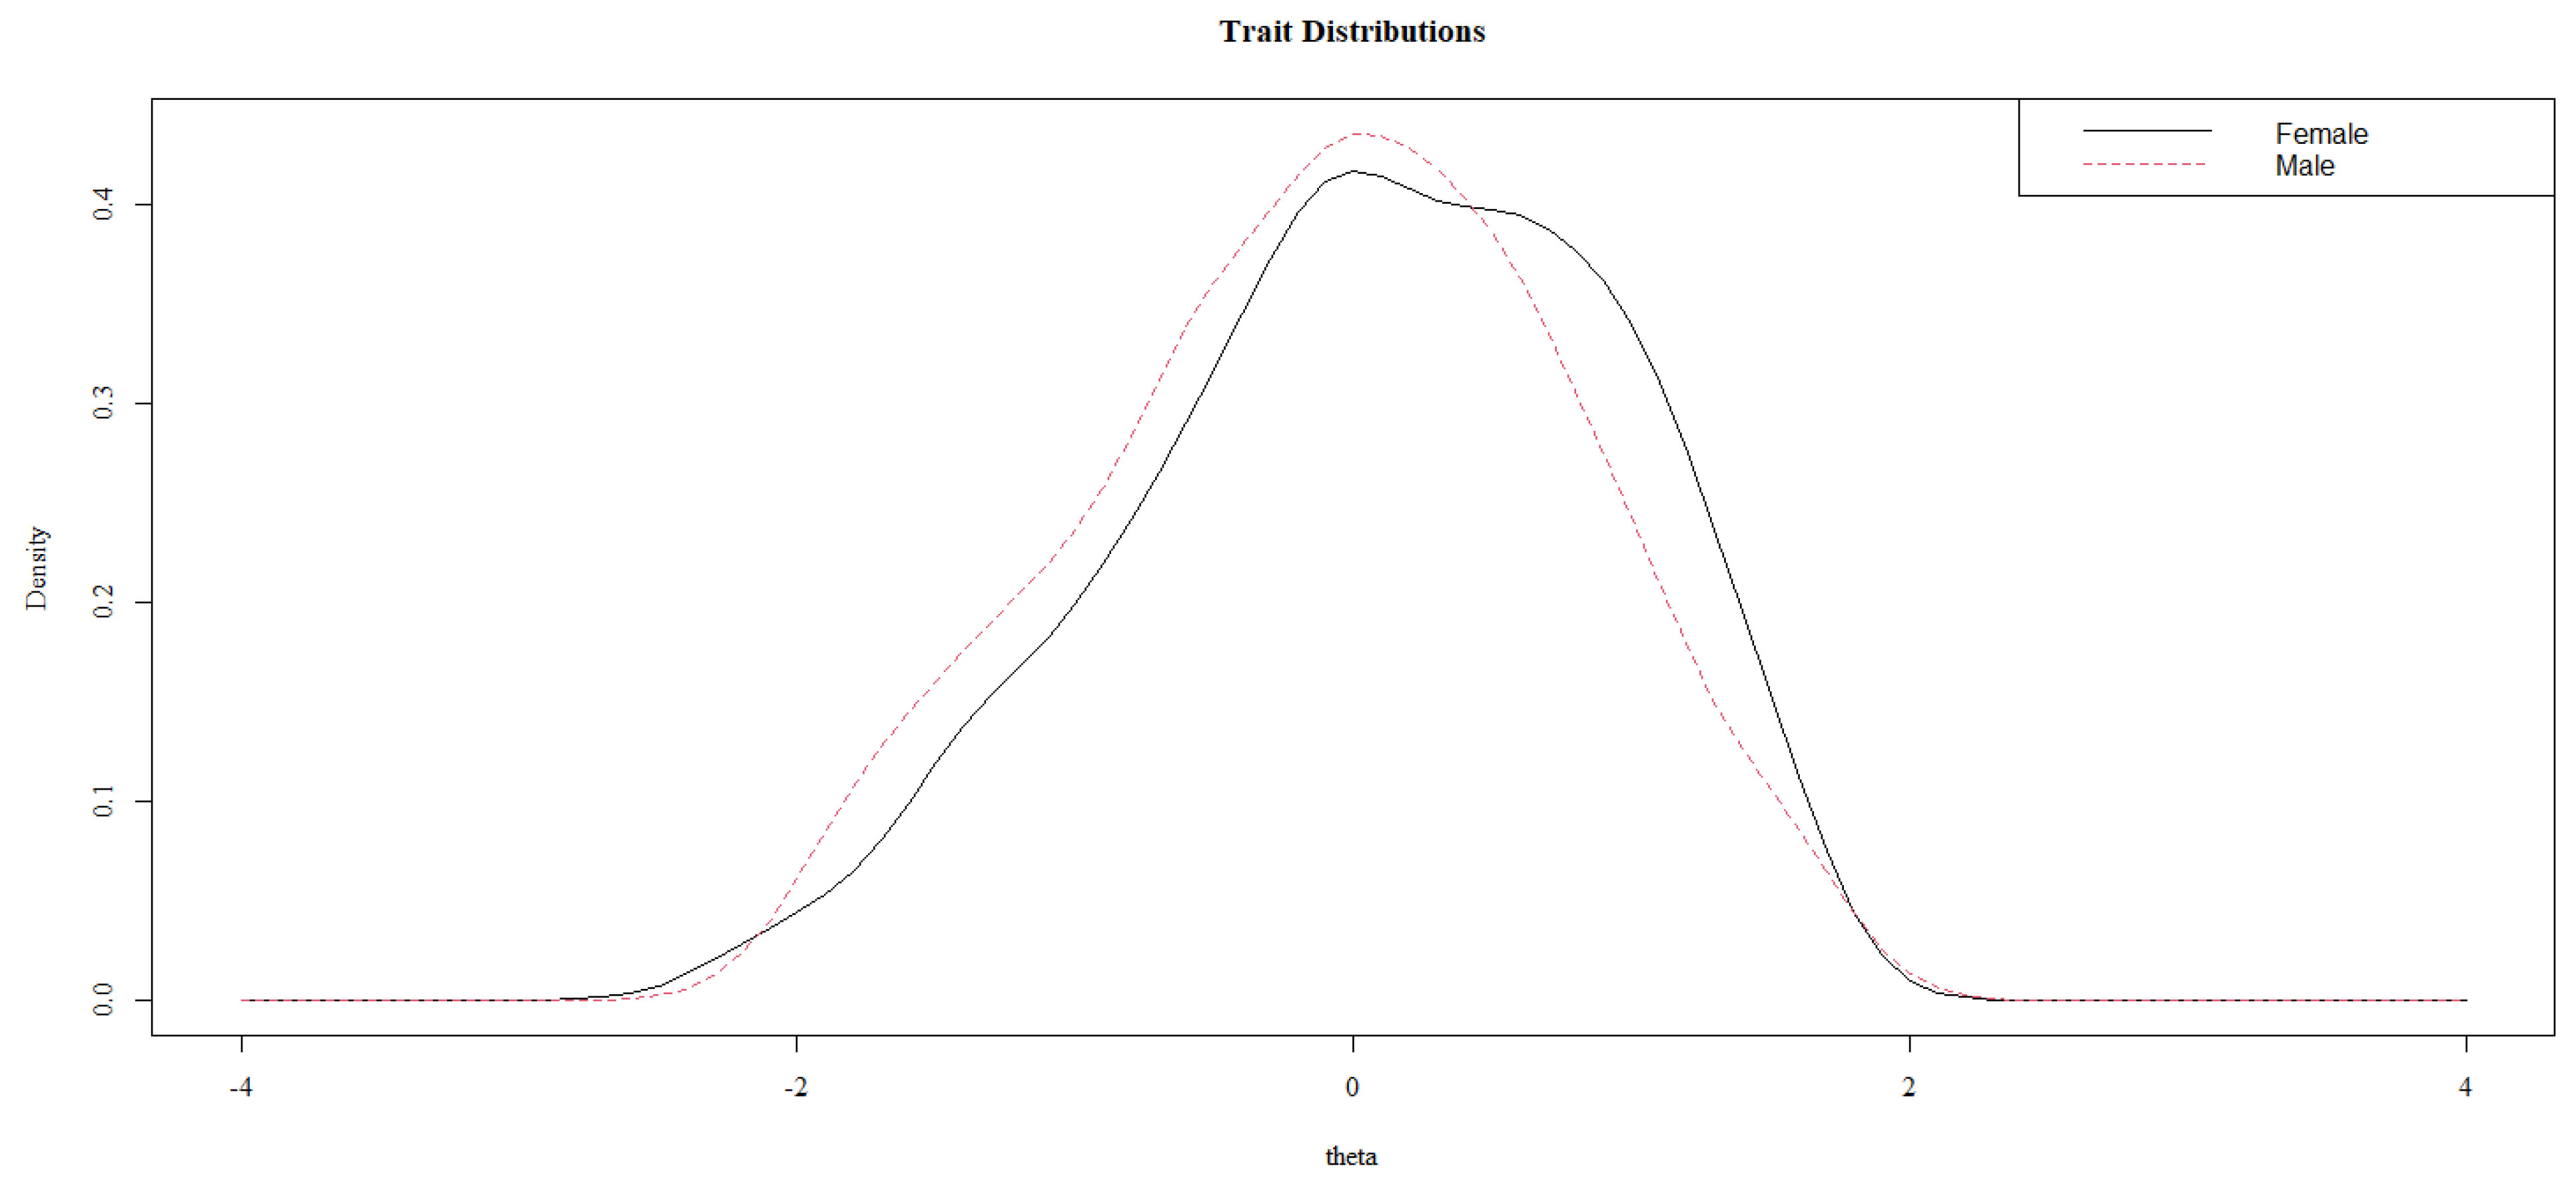
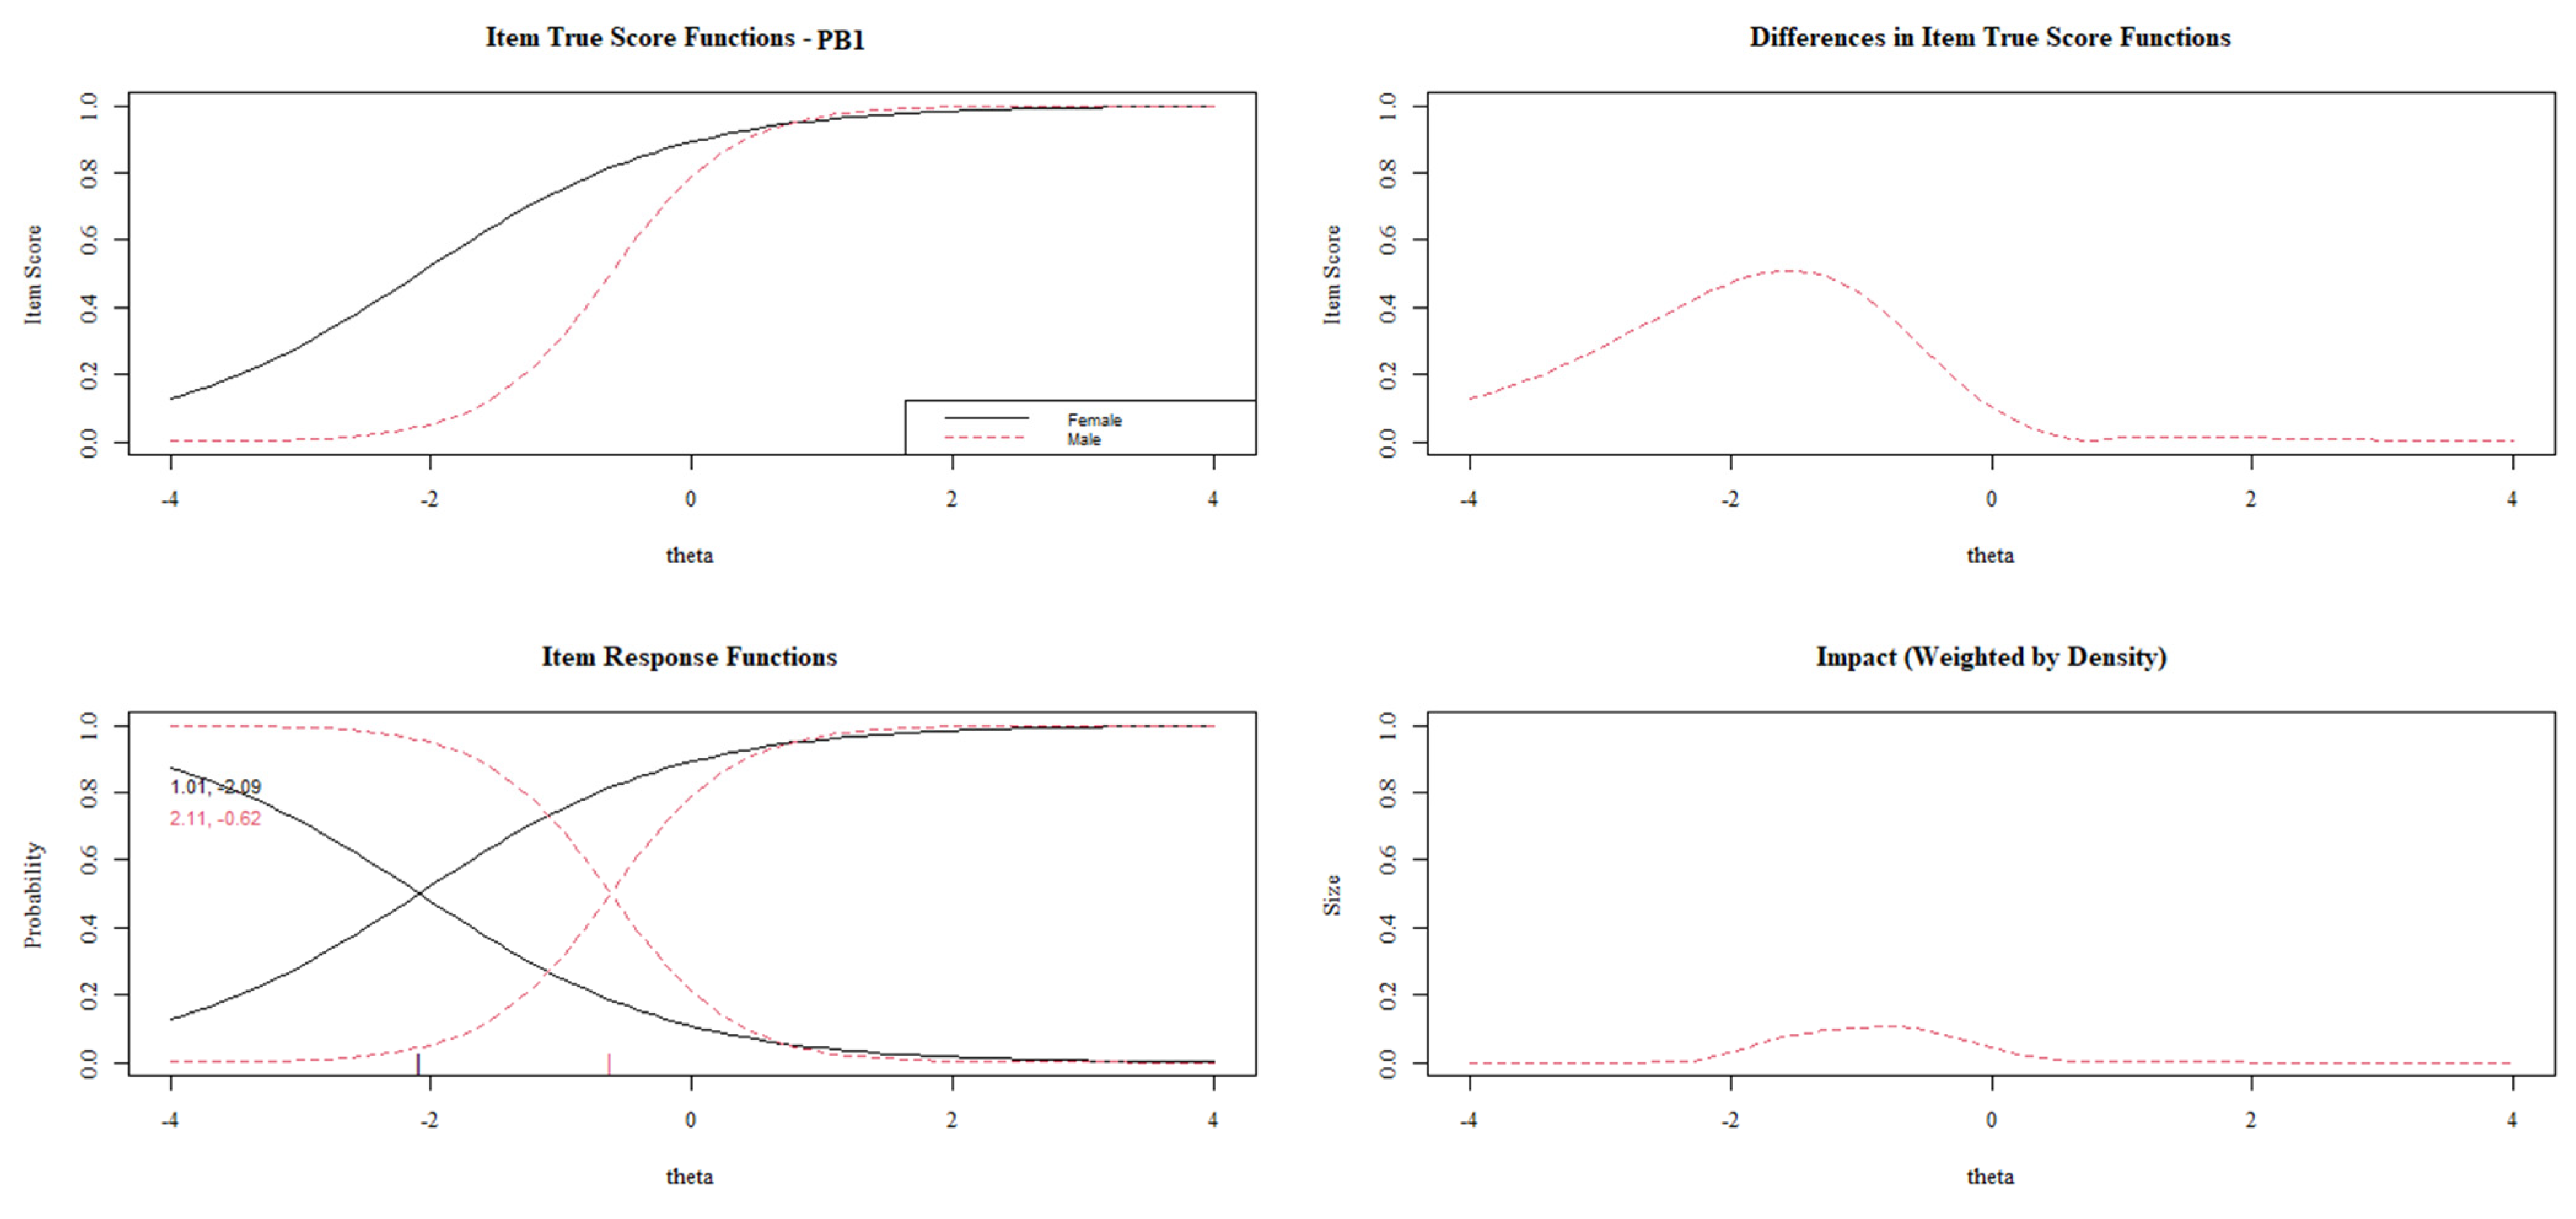
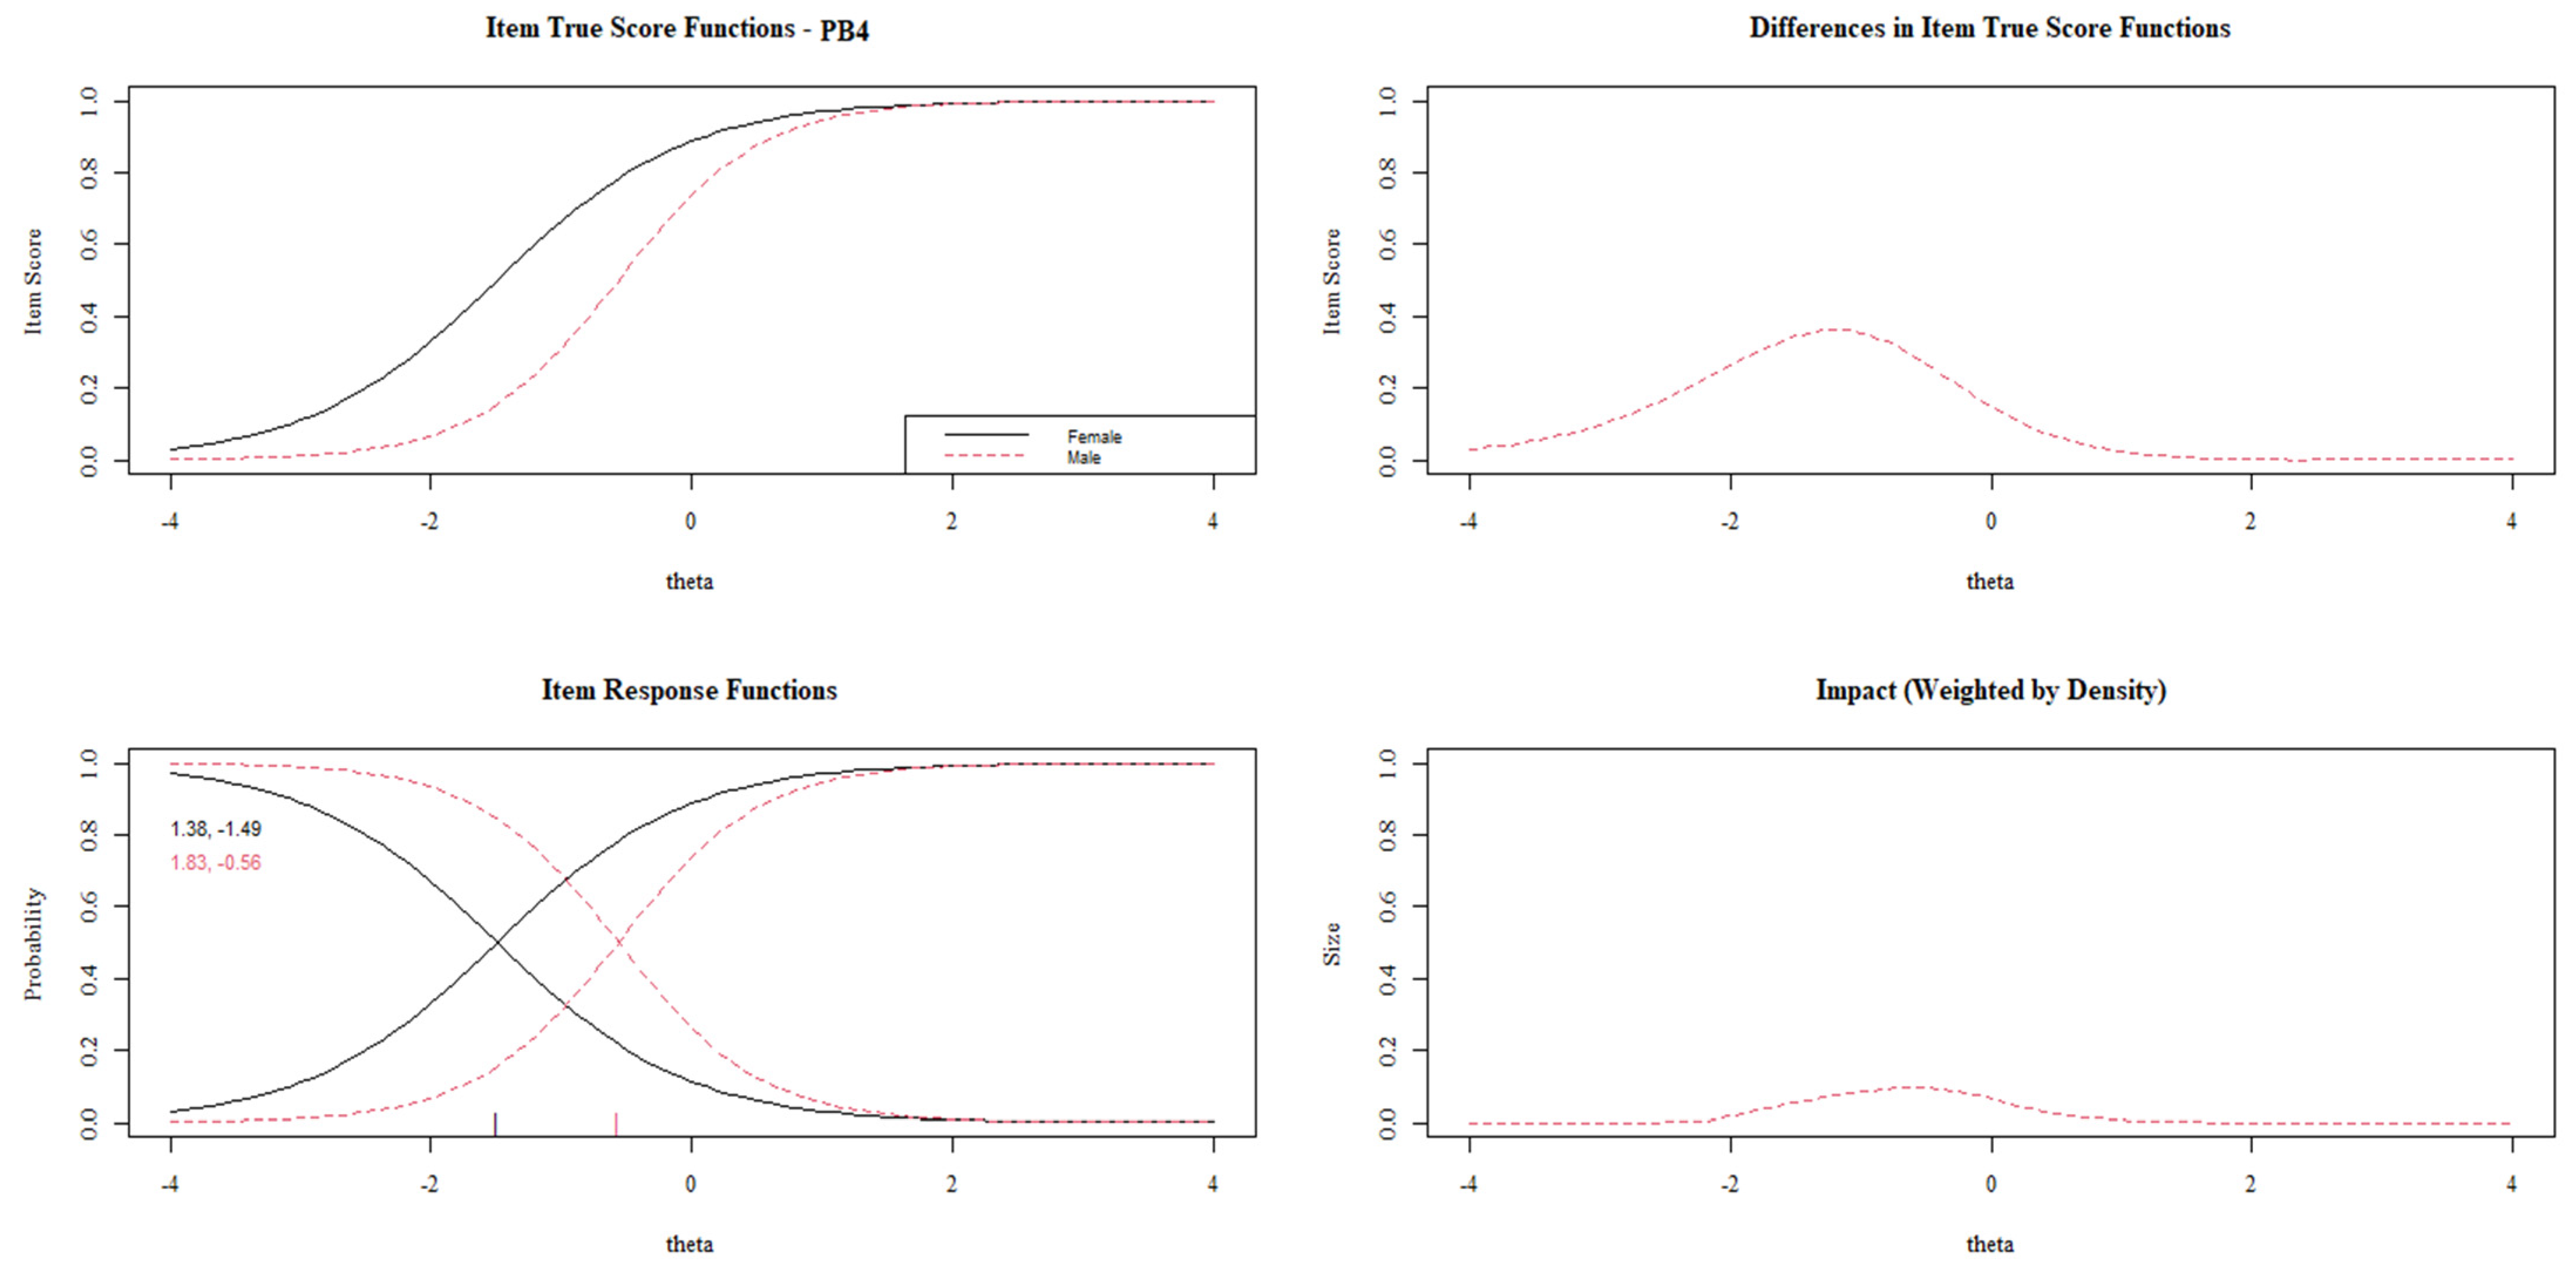
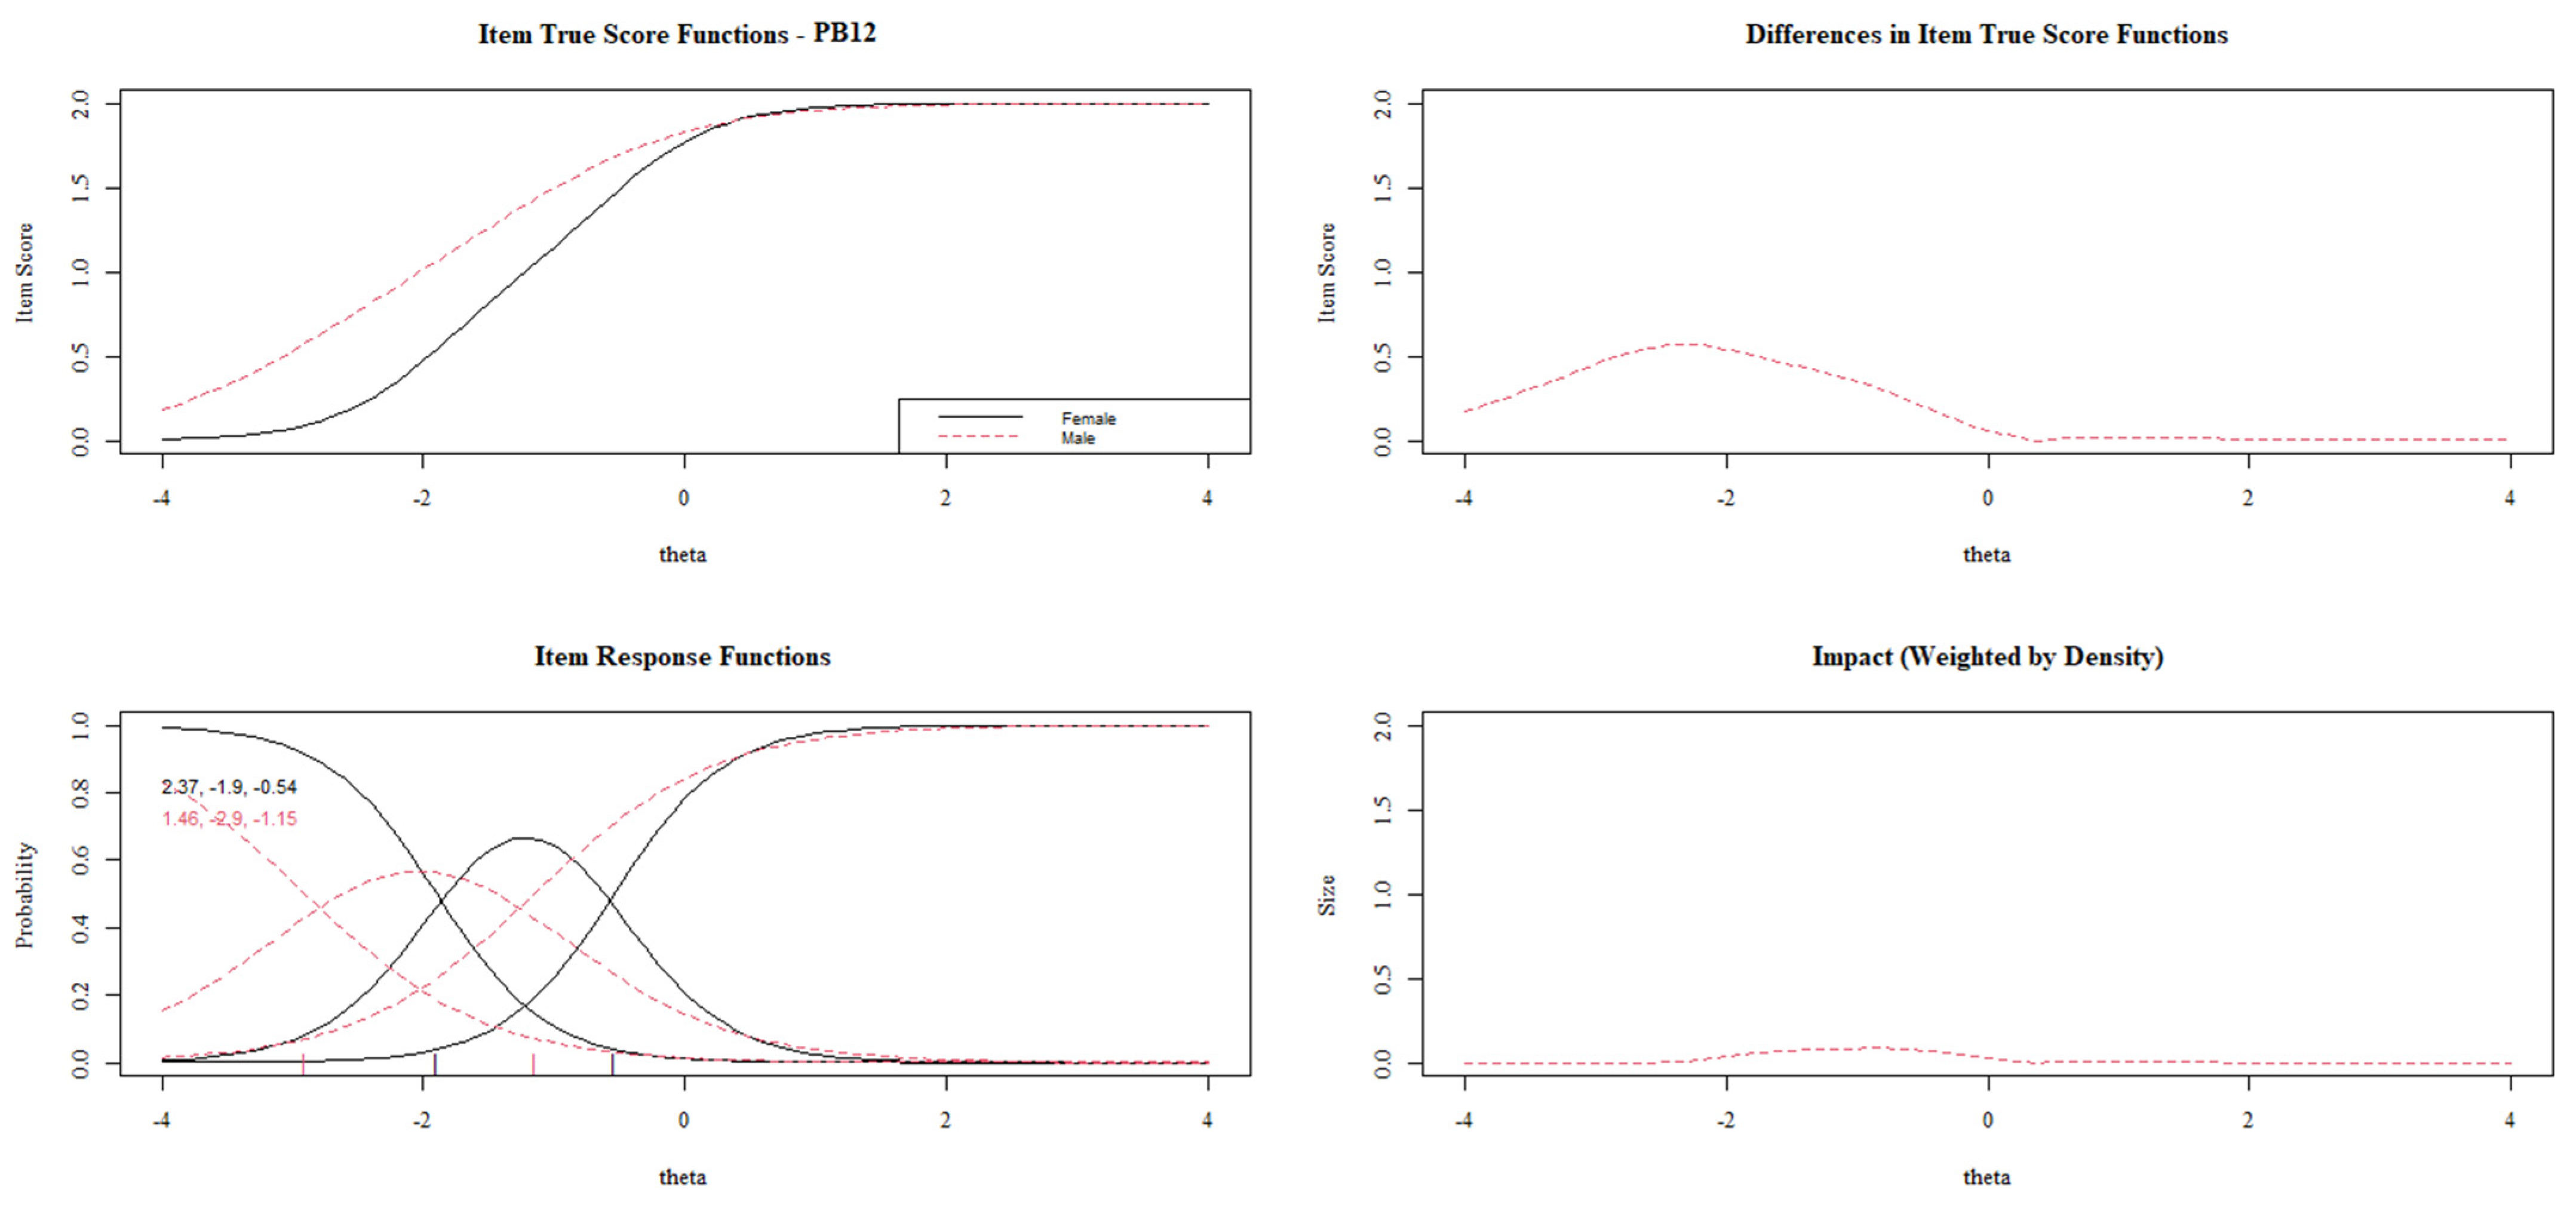
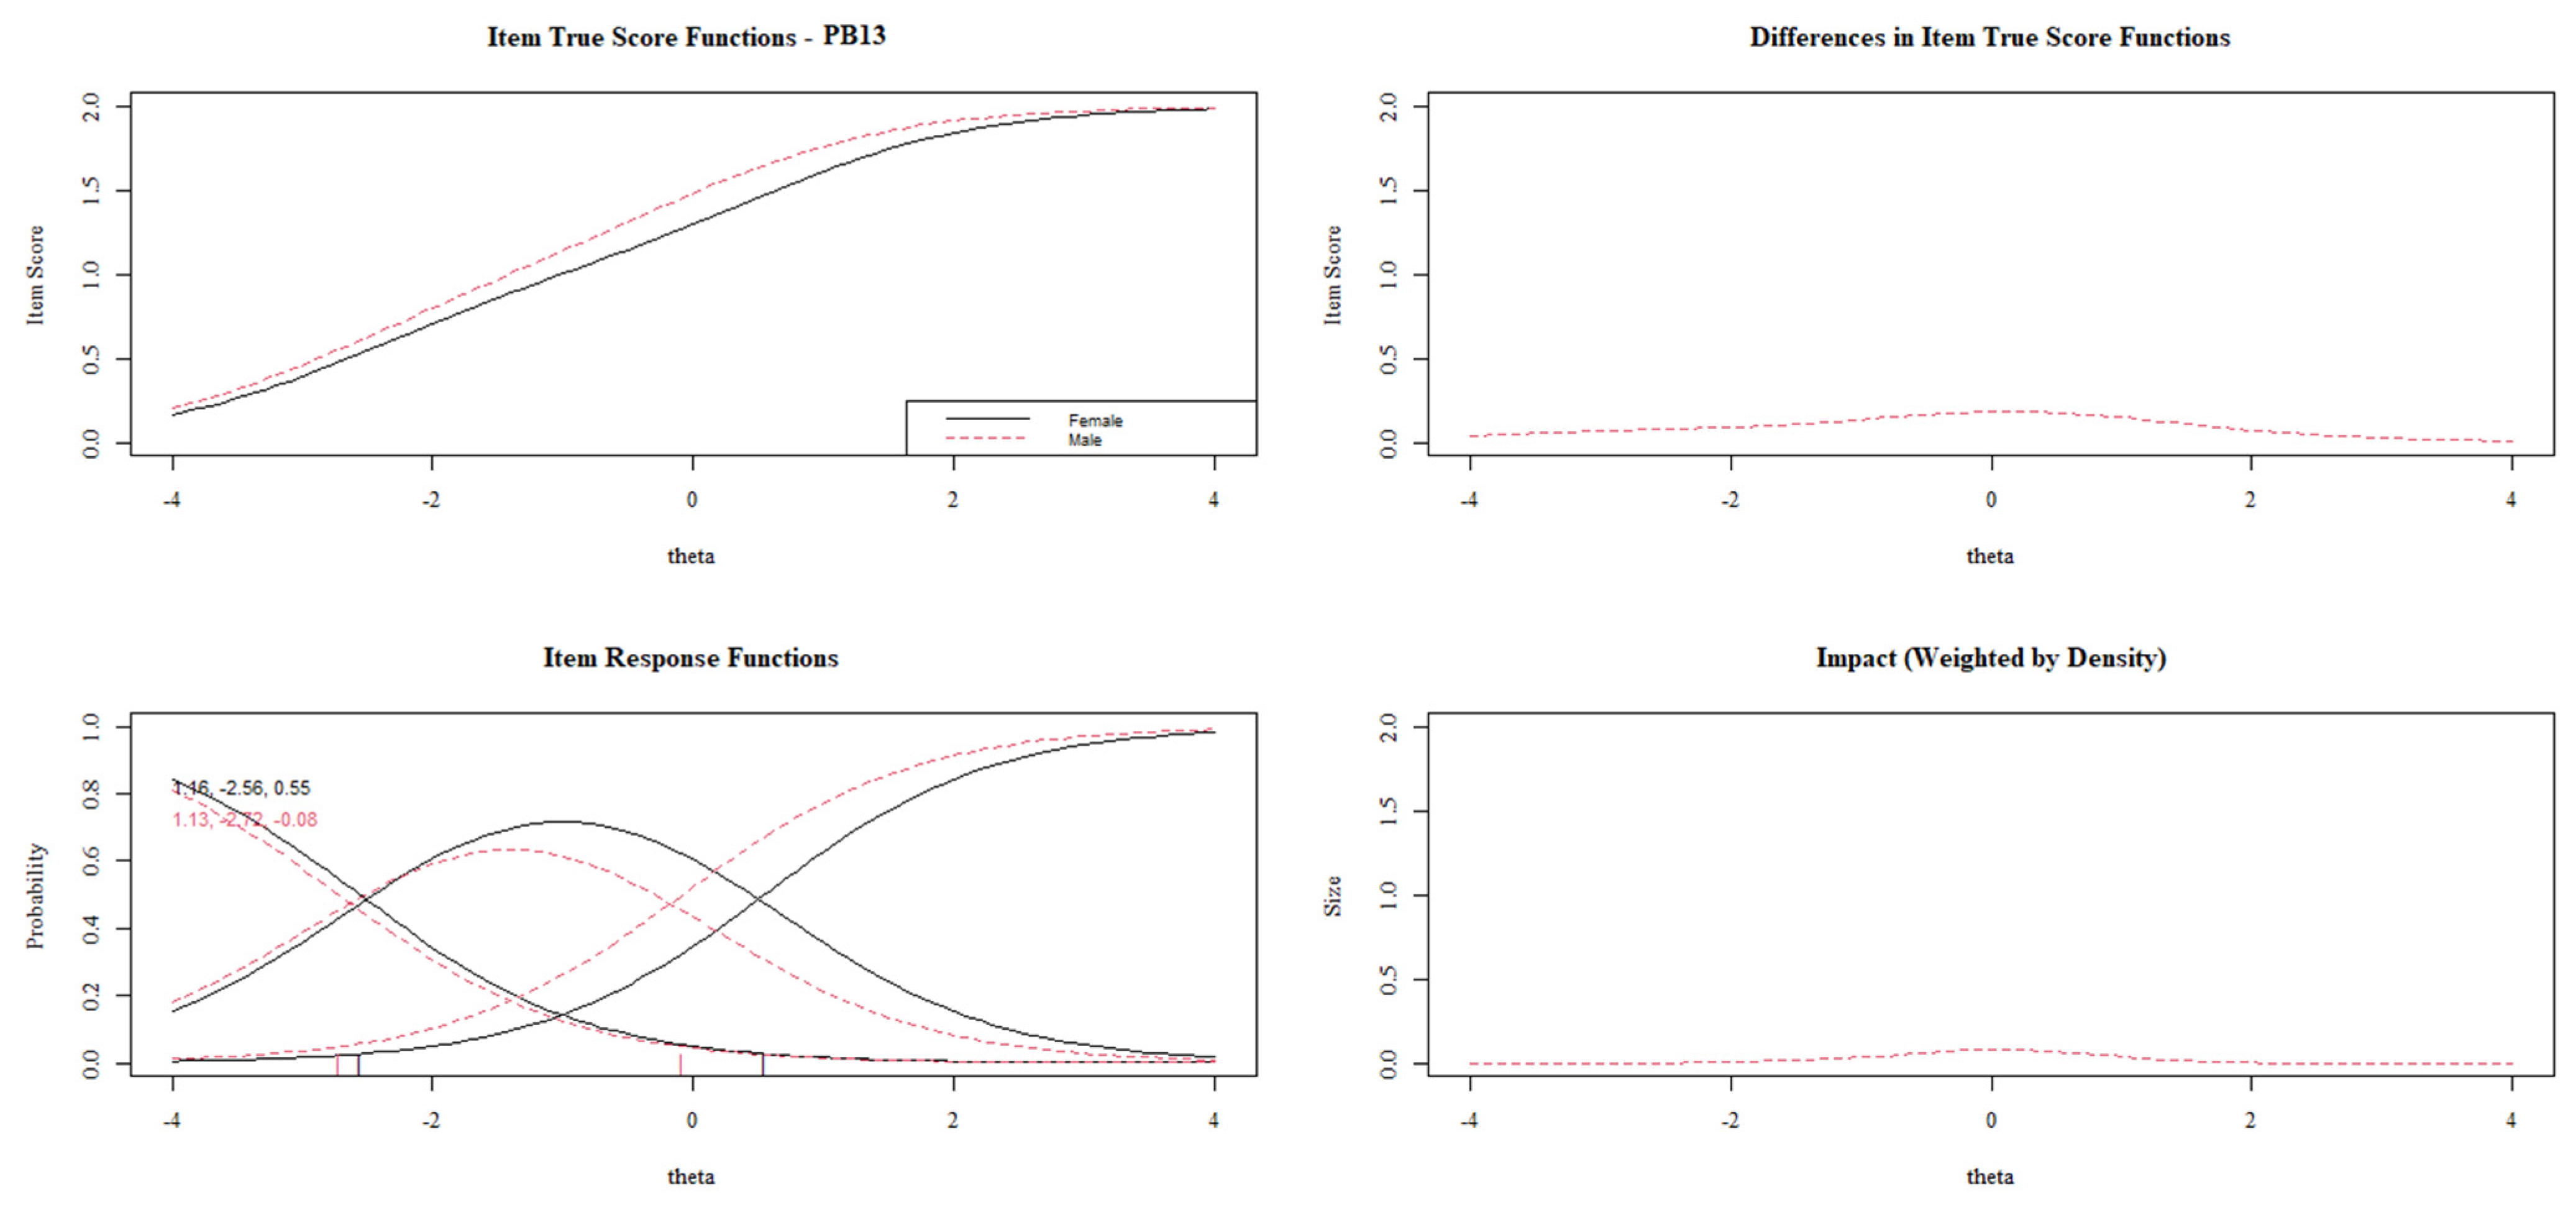
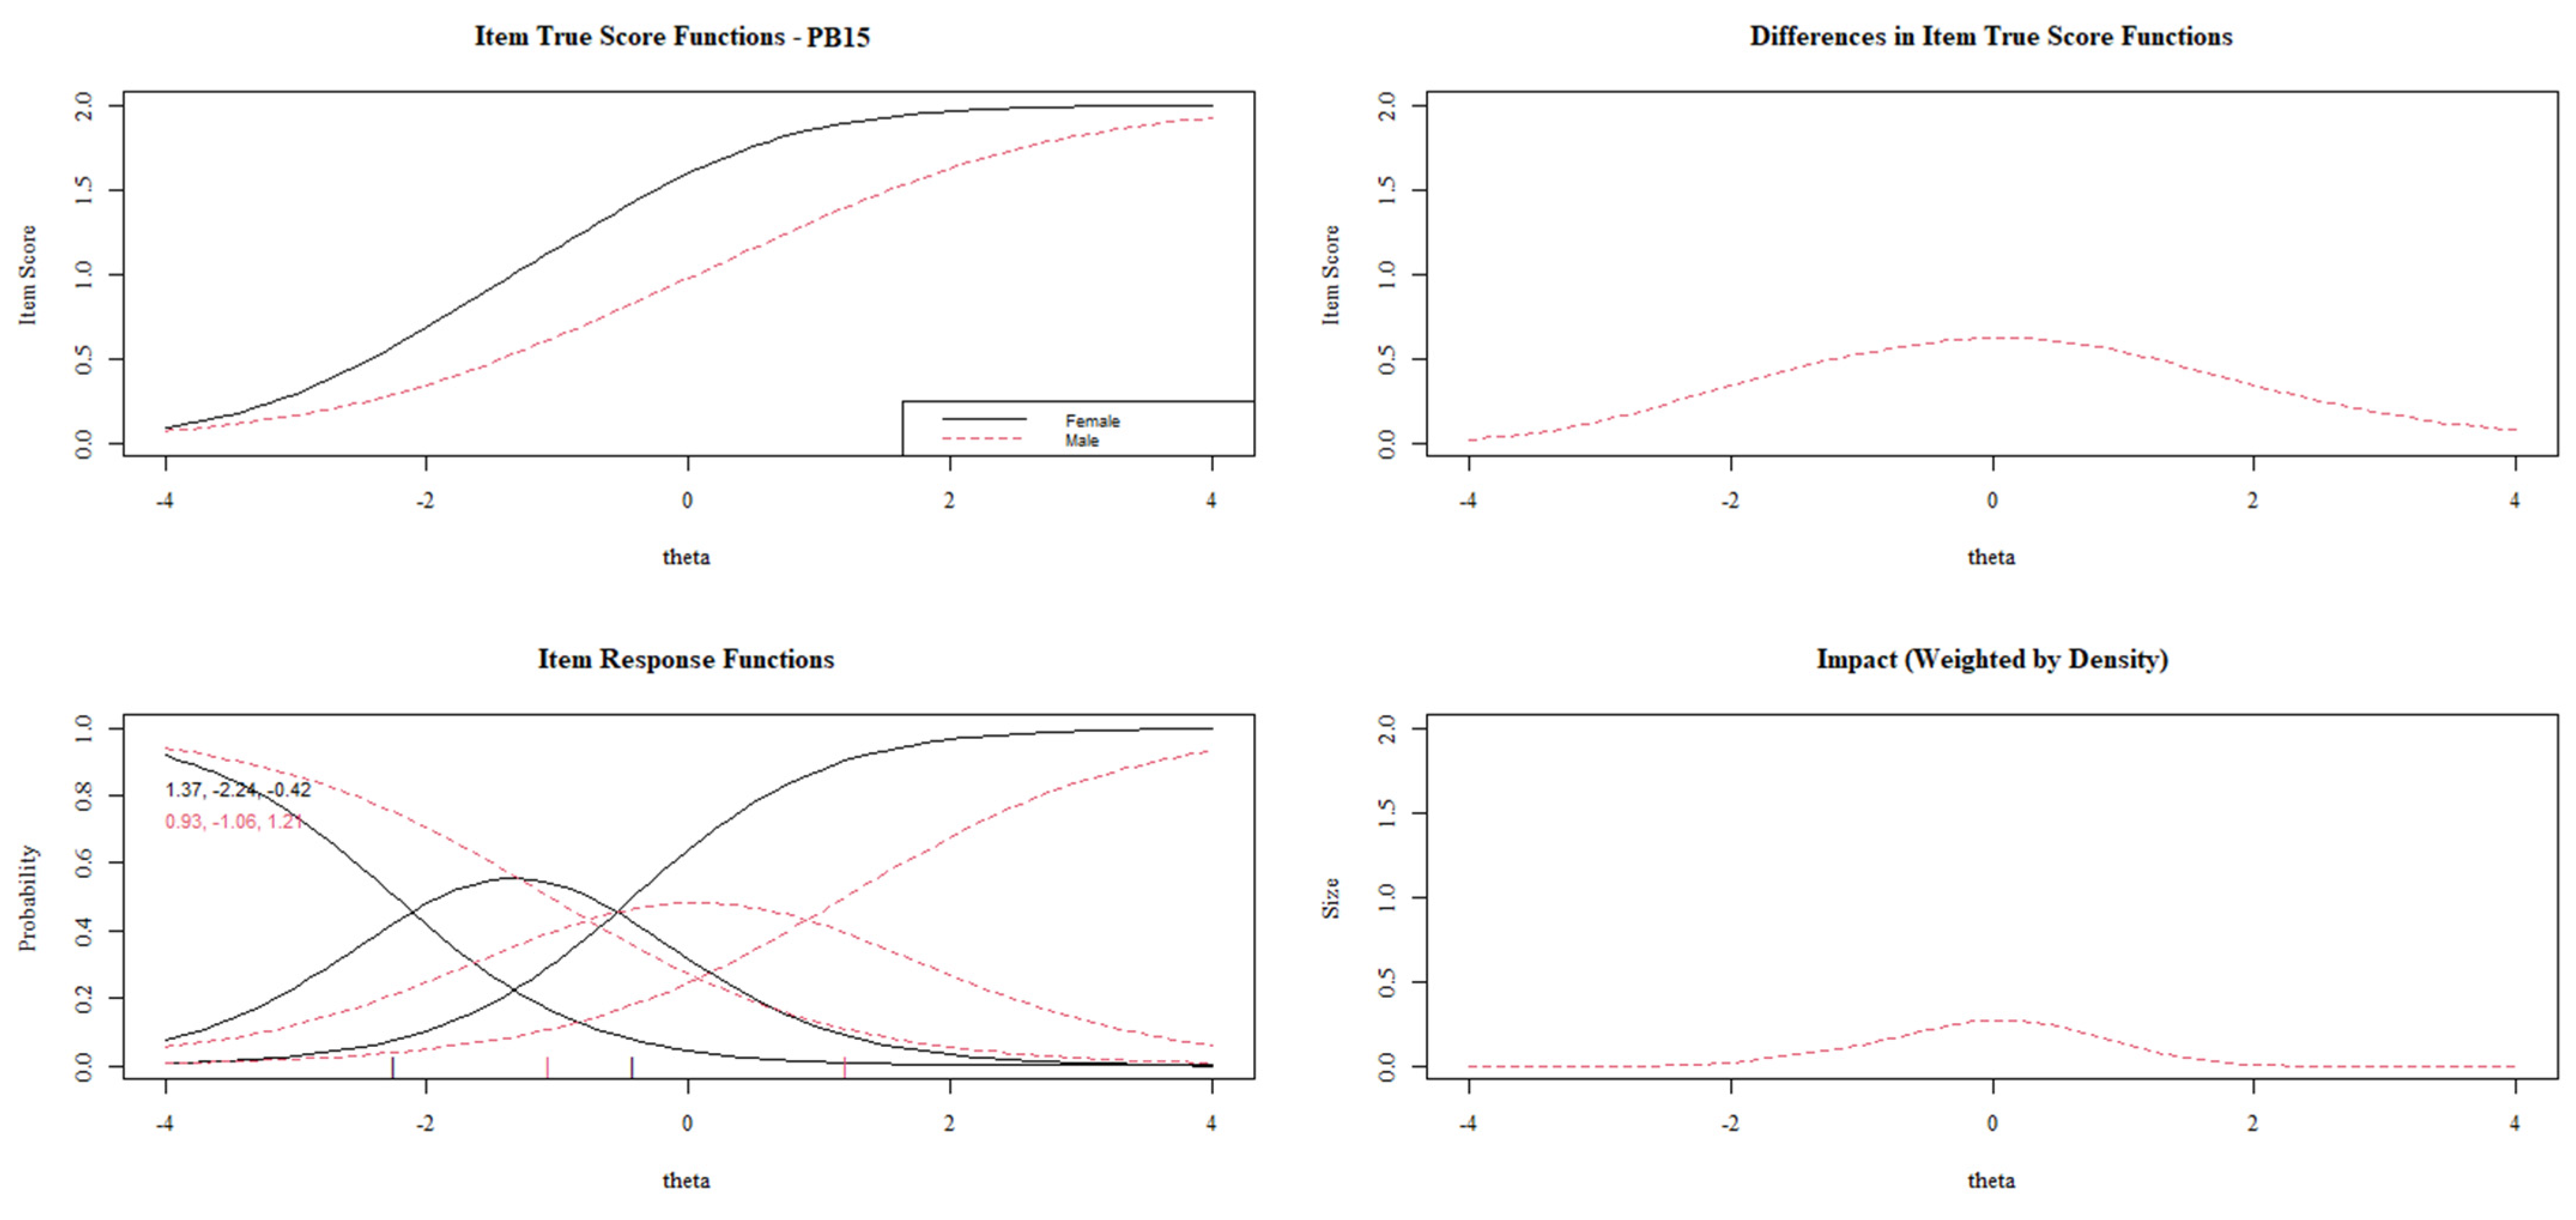
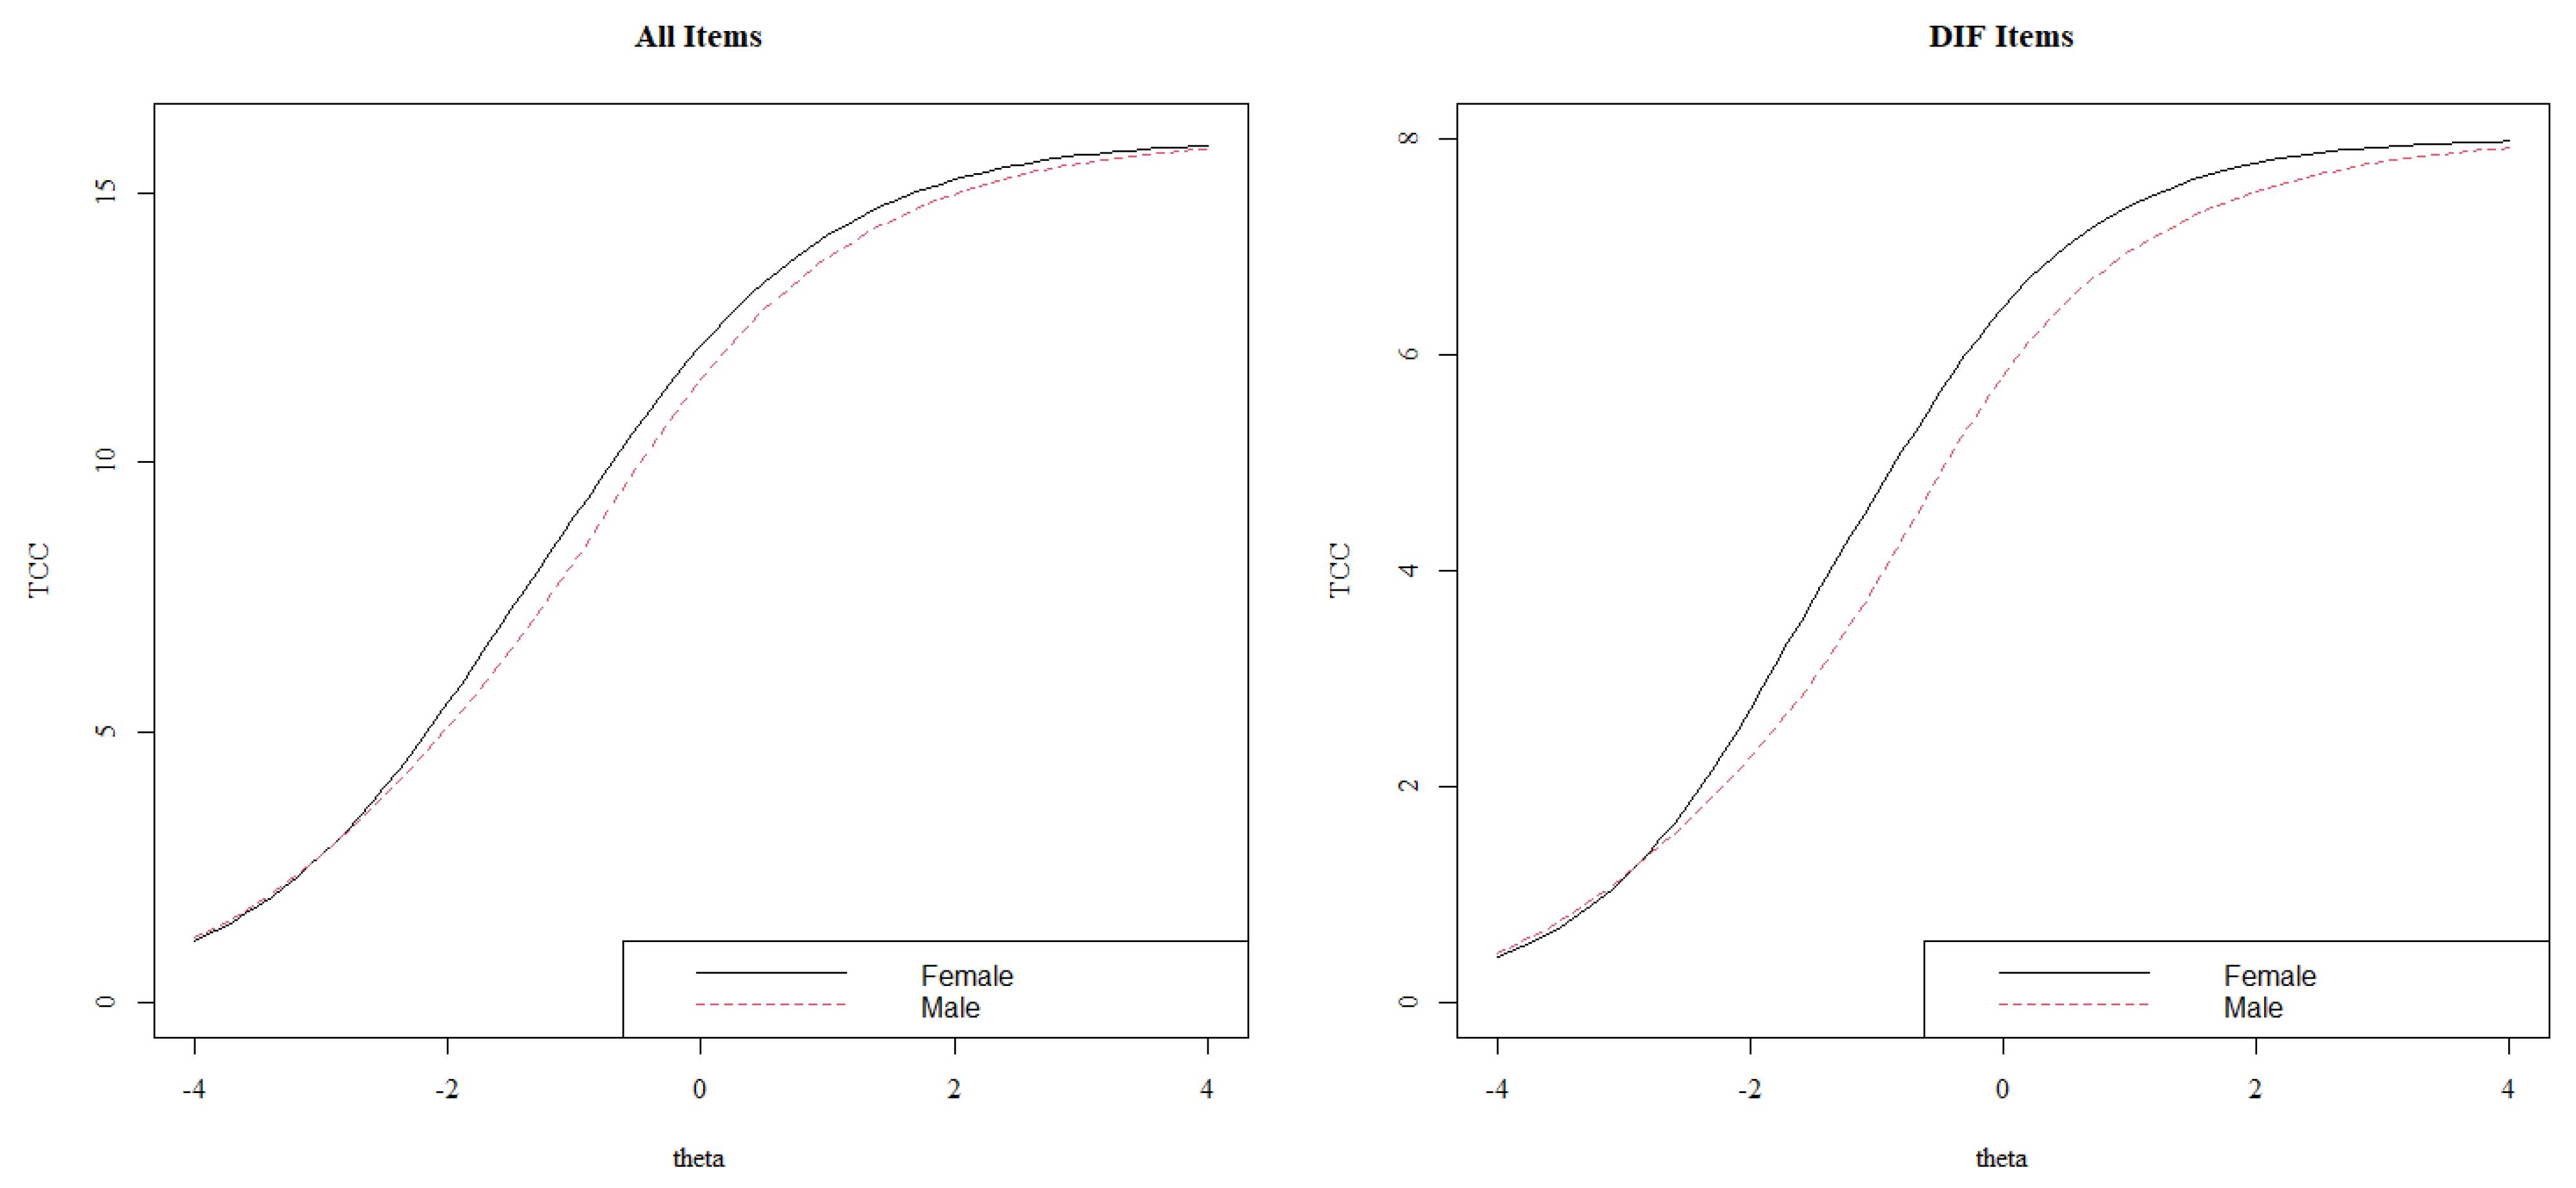
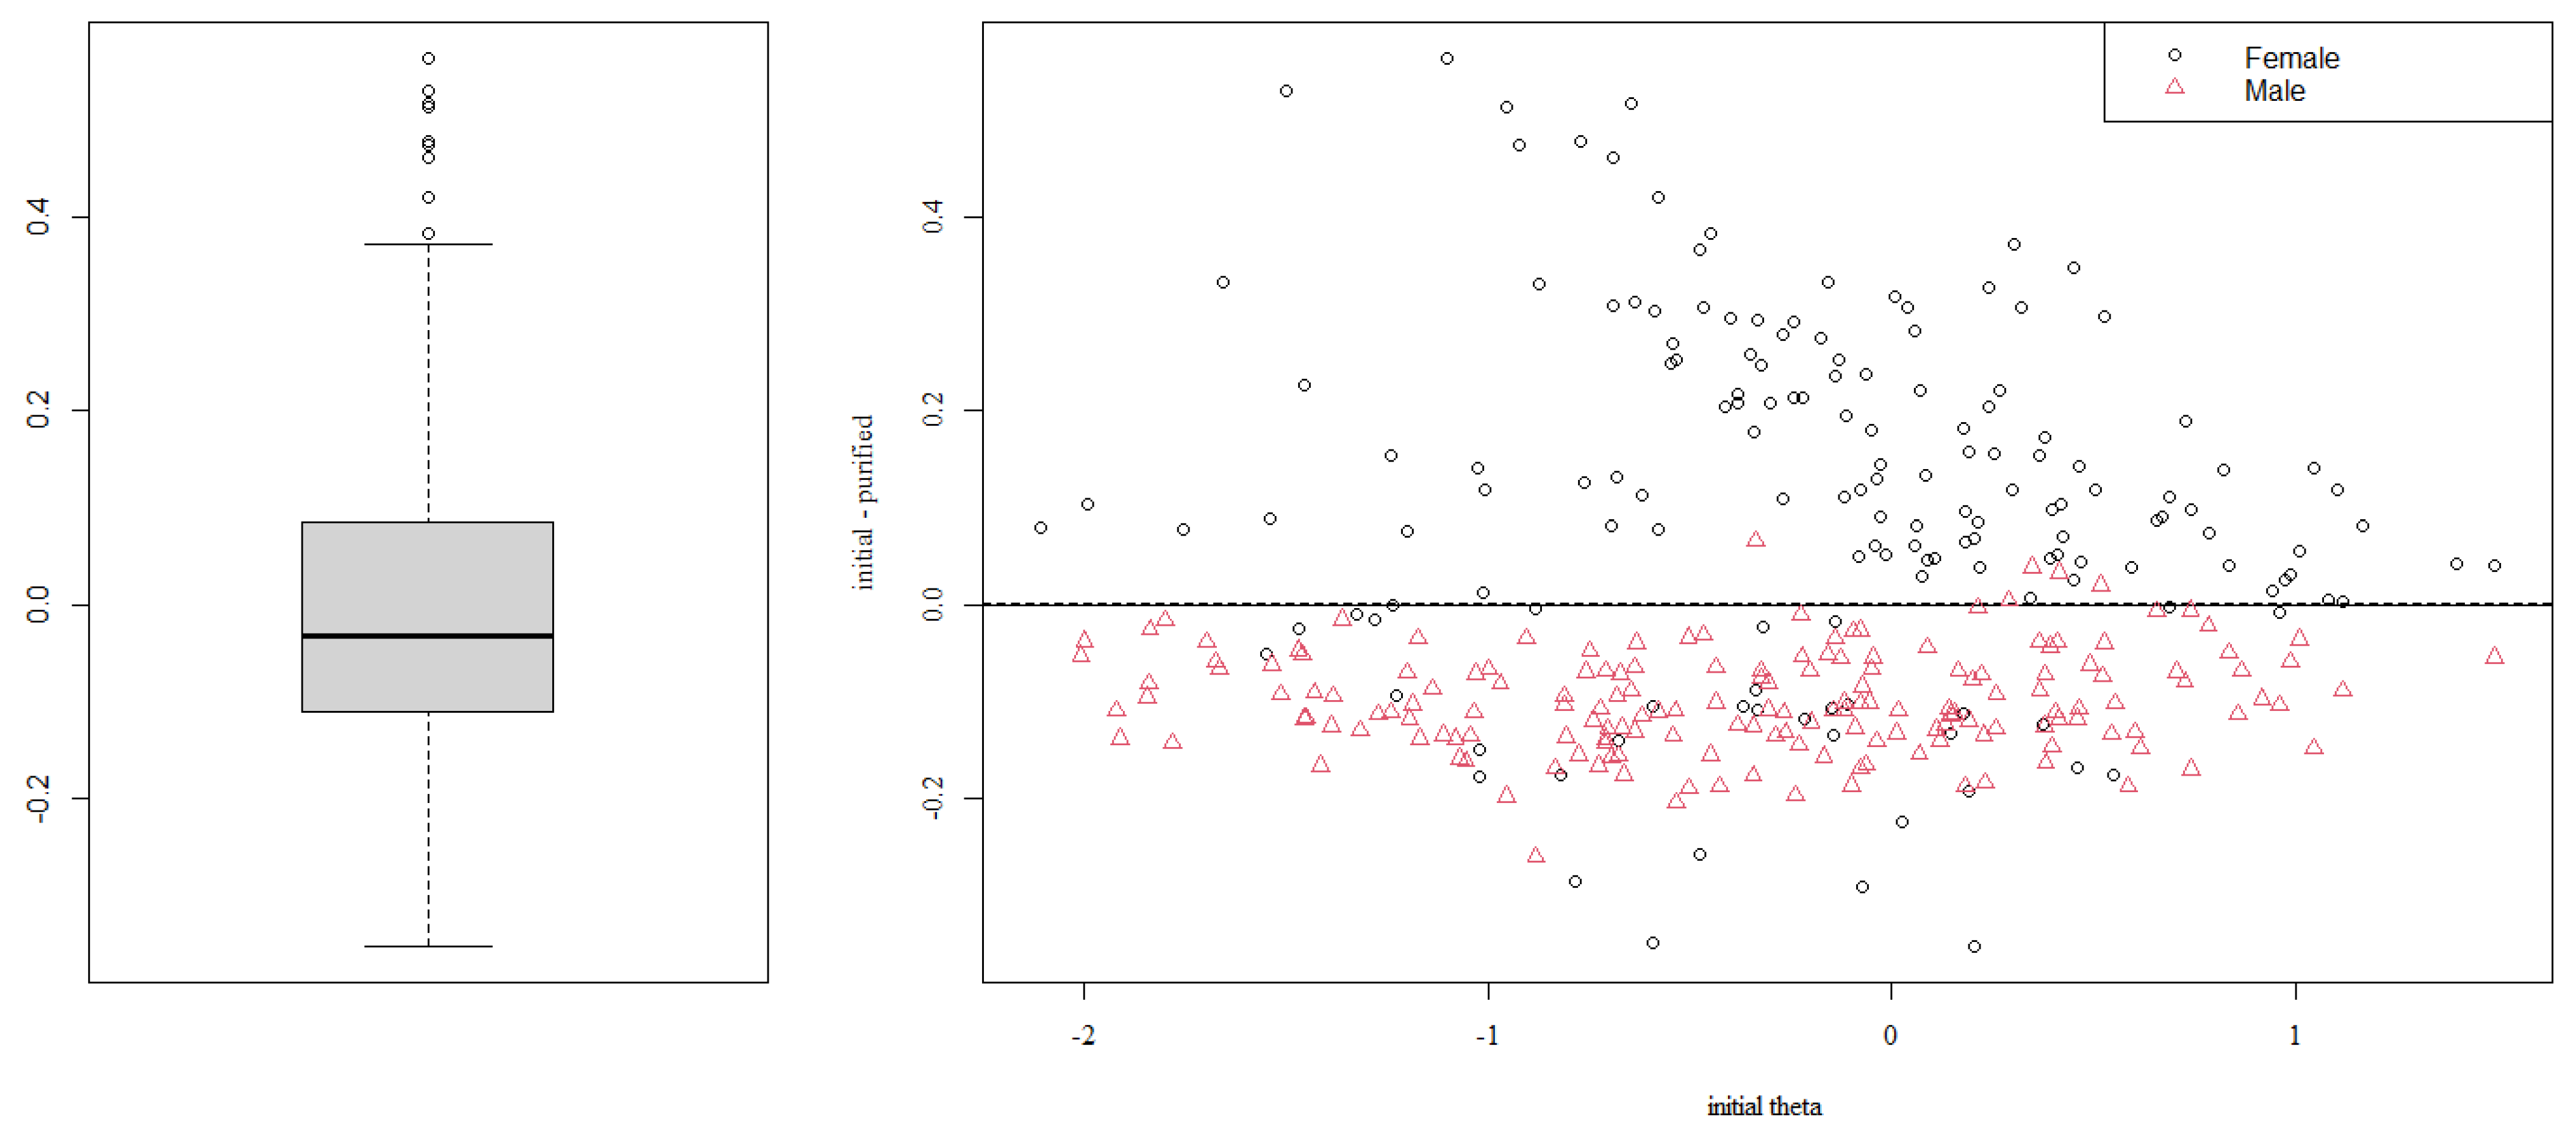
3.3. Gender-Related Differential Item Functioning

Figure 2 shows the theta distribution for females and males. Although males show a slightly lower level of prosocial behavior, there is a broad overlap in the distributions. Table 4 presents the results for the χ2 tests between Model 1 and Model 2, Model 1 and Model 3, and Model 2 and Model 3 for all items. The statistically significant difference between Model 1 and Model 2 indicates the presence of a uniform DIF, whereas the statistically significant difference between Model 2 and Model 3 denotes a non-uniform DIF in the item. The statistically significant chi-square test between Model 1 and 3 may be interpreted as an overall test of the “total DIF effect”. The results in Table 4 indicate that items PB1, PB4, PB12, PB13, and PB15 present DIF. All of them present uniform DIF; however, items PB1 and PB12 also present non-uniform DIF. The non-uniform DIF in these items indicates that the DIF varies depending on the prosocial behavior level. However, considering the pseudoR2 changes, the DIF in all the items may be considered negligible [73].
Figure 3, Figure 4, Figure 5, Figure 6 and Figure 7 show the diagnosis plots for each item with DIF. While interpreting the plots, we should keep in mind that items PB1 to PB4 retain two response categories from the original 3-point Likert scale because the program, by default, retains those categories with a minimum of five cases per cell. Each figure displays four graphics: (1) the upper-left graphic presents the item characteristic curves (ICCs) for each group; (2) the upper-right plot shows the differences between the ICCs for each group; (3) the lower-left graphic shows item response functions for each group and the values for the slopes and category threshold values (in that order); (4) the lower-right plot shows the ICCs’ differences when weighted by the distribution for the focal group (males).
The visual analysis of item PB1 (Figure 3) indicates a DIF, especially on the lower levels of prosocial behavior, where females present higher item scores with the same theta value. Additionally, the item presents a non-uniform DIF, being more discriminant for males (2.11 vs. 1.01).
As can be seen in Figure 4, item PB4 only presents uniform DIF, which is more prevalent in the lower levels of prosocial behavior. As in item PB1, females tend to select higher categories than males with the same overall prosocial behavior. The graphics show the lack of large changes in the item slope between groups (1.38 vs. 1.83), which supports the null non-uniform DIF.
Figure 5 offers DIF results for item PB12. Although the DIF is mainly due to the first threshold (−1.9 vs. −2.9), as in previous items, item PB12 shows the opposite DIF. In this case, the males present a higher item score with the same level of overall prosocial behavior. Additionally, item PB12 shows a non-uniform DIF, with a higher slope value for females (2.37 vs. 1.46).
Figure 6 demonstrates that item PB13 presents a slightly uniform DIF, benefiting male results. Contrary to the previous items, in this case, the DIF is more pronounced in the middle levels of prosocial behavior.
Lastly, Figure 7 displays a uniform DIF for item PB15. As in most of the items with DIF, females present a higher item score than their male counterparts with the same overall prosocial behavior. Once the DIF has been analyzed item by item, Figure 8 shows the impact of these DIFs on the test characteristic curves (TCCs). The DIF effect on TCCs seems to be scarce while considering all the items, which is in line with the interpretations of the pseudoR2 differences.
The analysis of the individual-level DIF impact complements the DIF exploration. The boxplot in Figure 9 indicates the differences between the individual scores ignoring DIF and those that consider it (purified). The median difference in theta estimation for the global sample is close to zero. However, the second plot in Figure 9 indicates that, in all levels of prosocial behavior, the females, in almost all cases, would receive a lower score if we account for DIF. Contrarily, the correction for DIF would lead to higher scores in males.

3.4. Nomological Evidences for Validity

The nomological validity of the scale was assessed by correlating the prosocial behavior (PB) results with other theoretically related constructs, such as the psychological capital subdimensions, namely, self-efficacy, hope, resilience, and optimism. Table 5 presents all the correlations. Additionally, an aggregated measure of the items without DIF (PB*) was calculated and included in the correlations. All the correlations were positive and statistically significant (p < 0.001). The correlation between the Prosocial Behavior Scale with and without items with DIF is positive and high (r = 0.89, p < 0.001). Contrasts between the validity coefficients obtained with PB and PB* show no statistically significant differences (p > 0.05), indicating a small or null impact of the DIF in the nomological validity of the scale.

4. Discussion

This paper aims to conduct the first psychometric study of the PBS in a Spanish sample. In doing so, we offer evidence of its one-dimensionality, reliability, differential item functioning, and nomological validity. Our results support the use of the scale in Spanish-speaking contexts as a brief and robust measure of global prosocial behavior. Additionally, we develop the study of the conceptualization of prosocial behavior by considering gender differences.
The unidimensional factor structure adequately fitted the data, and all the items presented factor loadings above 0.3, which is in line with the previous study that reported PBS factor structure in a similar sample [26]. Its reliability was also adequate and fit into the range of reliability results of previous studies [18,19,20,21,22,23,24,25,26,27,28,29,30,31,32].
Regarding the DIF study of PBS items, our results could be considered consistent with previous literature. Although half of the items presented DIF, its effect on the global scale functioning may be considered negligible. However, some insights arise from them. Firstly, the measurement of prosocial behavior using this scale benefits females’ scores. The DIF analysis could help us to understand those behaviors that are more characteristic in males and those that are more prevalent in females’ prosocial behavior. The items that did not present a DIF were the ones related to sharing behaviors, such as PB7 (“I share things I like with my friends”) or PB10 (“I let others use my games”), the helping behavior with classmates’ homework (PB9), and items PB2 and PB5, related to the time spent with friends and kindness, respectively. These results are similar to those reported by Eisenberg and Fabes [34].
Our results suggest that these kinds of prosocial behaviors would be equally present in females and males. Contrarily, differences emerged in the rest of the scale. Females presented a higher probability to manifest a higher score on those items related to emotional support as PB1 (“I try to make sad people happier”), PB4 (“I try to help others”), and PB15 (“I hug my friends”). This result agrees with Xiao et al. [38], who found that females present higher results on the emotional dimension of the PTM-R as well as in the results of the qualitative studies with adolescents [74]. The only items where males performed better were PB12 (“I like to play with others”) and PB13 (“I trust others”).
These results should not be interpreted as innate differences between men and women. For example, although some studies presented gender differences in empathy [75], these differences could not exist on natal levels of empathy [76]. Rather, they would be attributable to different patterns of socialization [77]. It would be the predominant culture that favors the appearance of some behaviors and not others in each gender [78]. Additionally, another factor that could artificially generate gender differences is the self-reported method, where females could tend to declare higher prosocial behavior to show congruency with the female stereotype of “kindness” [34,78,79]. All of these aspects should be kept in mind while developing prosocial behavior measures and when studying gender differences. Nielson et al. [37] developed a longer multidimensional scale that includes twenty items classified into five categories (defending, emotional helping, inclusion, physical helping, and sharing), trying to balance male characteristics behaviors with female ones. They did this to generate a scale that offers a comparable total score.
Finally, we tested the nomological validity of the scale by correlating the total prosocial behavior score with the subdimensions of the psychological capital. As expected, all the correlations were positive and statistically significant. Our results were similar to those found in an adult sample by Aydin and Aslan [80], who also found that the subdimension with the lowest relationship with prosocial behavior was resilience. Zhang et al. [63], through a longitudinal study, tested the predictive power of psychological capital on prosocial behavior, verifying its antecedent role. In this case, only optimism and self-efficacy showed statistically significant coefficients. Studies that included psychological capital as a global dimension also reported a positive effect on prosocial behavior [63,81]. Consequently, the PBS scores reproduce the relationships previously found in the literature with other prosocial behavior scales.
Our study presents some limitations. First of all, it is based on a cross-sectional sample of high school students from Spain. Consequently, the generalizability of the psychometric properties reported to primary students or Latin American countries requires further research. Future studies may propose longitudinal investigations to ensure scale invariance over time. These studies will make the results obtained from different educational levels comparable and will guarantee the robustness of the studies of the development of prosocial behavior during education. Additionally, the inclusion of more than one time measurement would allow future researchers to complement the psychometric study with evidence of test–retest reliability. As another limitation to be acknowledge, gender has been considered only as a dichotomous variable. Other variables, such as gender-role orientation, would be also interesting to understand regarding the interaction of the individual gender alignment with the DIF.
In summary, the PBS has shown adequate psychometric properties and, when the items are administered together, their gender bias is negligible. Consequently, it could be a good alternative for researchers or practitioners who need to administer a global and relatively short prosocial behavior scale. Additionally, our results indicate that a consideration of the specific characteristics of the prosocial behavior in each gender is crucial to properly understand gender differences without biases that systematically benefit females or, less frequently, males. Once we more accurately approach an understanding of these differences, we could better design more effective initiatives to promote sustainable prosociality.

Author Contributions

Conceptualization, S.M.-G.; methodology, S.M.-G. and J.M.T.; formal analysis, S.M.-G. and J.M.T.; investigation, S.M.-G. and A.O.; data curation, S.M.-G.; writing—original draft preparation, S.M.-G.; writing—review and editing, A.O. and J.M.T.; supervision, A.O. All authors have read and agreed to the published version of the manuscript.

Funding

This research was funded by the Spanish Ministry of Universities, grant number FPU18/03710.

Institutional Review Board Statement

The study was conducted in accordance with the Declaration of Helsinki and approved by the Ethics Committee of the University of Valencia (protocol code UV-INV_ETICA-1806947 and 4 November 2021).

Informed Consent Statement

Written informed consent has been obtained from the legal tutors and participants.

Data Availability Statement

The data presented in this study are available on request from the corresponding author.

Acknowledgments

Sara Martínez-Gregorio is a researcher beneficiary of the FPU grant from the Spanish Ministry of Universities (FPU18/03710). This study is framed according to the goals of the consolidated teaching innovation group CIDES-CR “Competencies and teaching innovation in higher education with vulnerable groups” (GCID23_2577102) and the consolidated teaching innovation group IDEEA “Teaching Innovation in Statistics and Related Subjects” (GCID23_2574917), of which the authors are members. We would like to thank the management teams and teachers of the high schools that participated in the research on a voluntary basis.

Conflicts of Interest

The authors declare no conflict of interest.

References

  1. Eisenberg, N.; Eggum, N.D.; Spinrad, T.L. The Development of Prosocial Behavior. In The Oxford Handbook of Prosocial Behavior; Schroeder, D.A., Graziano, W.G., Eds.; Oxford University Press: Oxford, UK, 2013; pp. 114–136. [Google Scholar]
  2. Gerbino, M.; Zuffianò, A.; Eisenberg, N.; Castellani, V.; Luengo Kanacri, B.P.; Pastorelli, C.; Caprara, G.V. Adolescents’ Prosocial Behavior Predicts Good Grades Beyond Intelligence and Personality Traits. J. Personal. 2018, 86, 247–260. [Google Scholar] [CrossRef]
  3. Flynn, E.; Ehrenreich, S.E.; Beron, K.J.; Underwood, M.K. Prosocial Behavior: Long-Term Trajectories and Psychosocial Outcomes. Soc. Dev. 2015, 24, 462–482. [Google Scholar] [CrossRef] [Green Version]
  4. Zuffianò, A.; Alessandri, G.; Luengo Kanacri, B.P.; Pastorelli, C.; Milioni, M.; Ceravolo, R.; Caprara, M.G.; Caprara, G.V. The Relation between Prosociality and Self-Esteem from Middle-Adolescence to Young Adulthood. Personal. Individ. Differ. 2014, 63, 24–29. [Google Scholar] [CrossRef]
  5. Layous, K.; Nelson, S.K.; Oberle, E.; Schonert-Reichl, K.A.; Lyubomirsky, S. Kindness Counts: Prompting Prosocial Behavior in Preadolescents Boosts Peer Acceptance and Well-Being. PLoS ONE 2012, 7, e51380. [Google Scholar] [CrossRef] [Green Version]
  6. Weinstein, N.; Ryan, R.M. When Helping Helps: Autonomous Motivation for Prosocial Behavior and Its Influence on Well-Being for the Helper and Recipient. J. Personal. Soc. Psychol. 2010, 98, 222–244. [Google Scholar] [CrossRef] [PubMed]
  7. Carlo, G.; Eisenberg, N.; Knight, G.P. An Objective Measure of Adolescents’ Prosocial Moral Reasoning. J. Res. Adolesc. 1992, 2, 331–349. [Google Scholar] [CrossRef]
  8. Carlo, G.; Hausmann, A.; Christiansen, S.; Randall, B.A. Sociocognitive and Behavioral Correlates of a Measure of Prosocial Tendencies for Adolescents. J. Early Adolesc. 2003, 23, 107–134. [Google Scholar] [CrossRef]
  9. Carlo, G.; Randall, B.A. The Development of a Measure of Prosocial Behaviors for Late Adolescents. J. Youth Adolesc. 2002, 31, 31–44. [Google Scholar] [CrossRef] [Green Version]
  10. Inderbitzen, H.M.; Foster, S.L. The Teenage Inventory of Social Skills: Development, Reliability, and Validity. Psychol. Assess. 1992, 4, 451–459. [Google Scholar] [CrossRef]
  11. Goodman, R. Psychometric Properties of the Strengths and Difficulties Questionnaire. J. Am. Acad. Child Adolesc. Psychiatry 2001, 40, 1337–1345. [Google Scholar] [CrossRef]
  12. Español-Martín, G.; Pagerols, M.; Prat, R.; Rivas, C.; Sixto, L.; Valero, S.; Artigas, M.S.; Ribasés, M.; Ramos-Quiroga, J.A.; Casas, M.; et al. Strengths and Difficulties Questionnaire: Psychometric Properties and Normative Data for Spanish 5- to 17-Year-Olds. Assessment 2021, 28, 1445–1458. [Google Scholar] [CrossRef] [PubMed]
  13. Rodríguez-Hernández, P.J.; Betancort, M.; Ramírez-Santana, G.M.; García, R.; Sanz-Álvarez, E.J.; De las Cuevas-Castresana, C. Psychometric Properties of the Parent and Teacher Versions of the Strength and Difficulties Questionnaire (SDQ) in a Spanish Sample. Int. J. Clin. Health Psychol. 2012, 12, 265–279. [Google Scholar]
  14. Ladd, G.W.; Profilet, S.M. The Child Behavior Scale: A Teacher-Report Measure of Young Children’s Aggressive, Withdrawn, and Prosocial Behaviors. Dev. Psychol. 1996, 32, 1008–1024. [Google Scholar] [CrossRef]
  15. Taylor, P.J.; Wood, A.M. Psychometric Properties and Development of the Brief Adolescent Prosocial Perception Scales (BAPPS). J. Child Fam. Stud. 2014, 23, 1417–1429. [Google Scholar] [CrossRef]
  16. Caprara, G.V.; Pastorelli, C. Early Emotional Instability, Prosocial Behaviour, and Aggression: Some Methodological Aspects. Eur. J. Personal. 1993, 7, 19–36. [Google Scholar] [CrossRef]
  17. Caprara, G.V.; Steca, P.; Zelli, A.; Capanna, C. A New Scale for Measuring Adults’ Prosocialness. Eur. J. Psychol. Assess. 2005, 21, 77–89. [Google Scholar] [CrossRef]
  18. Carlo, G.; Mestre, M.V.; Samper, P.; Tur, A.; Armenta, B.E. Feelings or Cognitions? Moral Cognitions and Emotions as Longitudinal Predictors of Prosocial and Aggressive Behaviors. Personal. Individ. Differ. 2010, 48, 872–877. [Google Scholar] [CrossRef]
  19. Carlo, G.; Mestre, M.V.; McGinley, M.M.; Samper, P.; Tur, A.; Sandman, D. The Interplay of Emotional Instability, Empathy, and Coping on Prosocial and Aggressive Behaviors. Personal. Individ. Differ. 2012, 53, 675–680. [Google Scholar] [CrossRef]
  20. Sporzon, G.; López-López, M.C. Evaluación de La Inteligencia Emocional y La Conducta Prosocial y Su Correlación En Alumnado de Educación Primaria. Estud. Sobre Educ. 2021, 40, 51–73. [Google Scholar] [CrossRef]
  21. Tur-Porcar, A.M.; Doménech, A.; Mestre, V. Vínculos Familiares e Inclusión Social. Variables Predictoras de La Conducta Prosocial En La Infancia. An. Psicol. 2018, 34, 340–348. [Google Scholar] [CrossRef]
  22. De Minzi, M.C.R.; Lemos, V.; Mesurado, B. Relaciones Entre La Percepción Que Tienen Los Niños de Los Estilos de Relación y de La Empatía de Los Padres y La Conducta Prosocial En La Niñez Media y Tardía. Av. Psicol. Latinoam. 2011, 29, 330–343. [Google Scholar]
  23. Alvarez, P.; Carrasco, M.; Fustos, J. Relationship of Empathy and Gender in Prosocial and Aggressive Behavior in Teenagers Form Different School Establishments. Rev. Iberoam. Psicol. Cienc. Tecnol. 2010, 3, 27–36. [Google Scholar]
  24. Tur-Porcar, A.; Llorca, A.; Malonda, E.; Samper, P.; Mestre, M.V. Empatía En La Adolescencia. Relaciones Con Razonamiento Moral Prosocial, Conducta Prosocial y Agresividad. Acción Psicol. 2016, 13, 3–14. [Google Scholar] [CrossRef] [Green Version]
  25. Malonda, E.; Tur-Porcar, A.; Llorca, A. Sexism in Adolescence: Parenting Styles, Division of Housework, Prosocial Behaviour and Aggressive Behaviour. Rev. Psicol. Soc. 2017, 32, 333–361. [Google Scholar] [CrossRef]
  26. Malonda, E.; Llorca, A.; Mesurado, B.; Samper, P.; Mestre, M.V. Parents or Peers? Predictors of Prosocial Behavior and Aggression: A Longitudinal Study. Front. Psychol. 2019, 10, 2379. [Google Scholar] [CrossRef] [PubMed]
  27. Mestre, M.; Samper, P.; Frías, M.D. Procesos Cognitivos y Emocionales Predictores de La Conducta Prosocial y Agresiva: La Empatía Como Factor Modulador. Psicothema 2002, 14, 227–232. [Google Scholar]
  28. Mestre, M.V.; Samper, P.; Frías, D. Personalidad y Contexto Familiar Como Factores Predictores de La Disposición Prosocial y Antisocial de Los Adolescentes. Rev. Latinoam. Psicol. 2004, 36, 445–457. [Google Scholar]
  29. Mestre, M.V.; Tur, A.M.; Samper, P.; Nácher, M.J.; Cortés, M.T. Estilos de Crianza En La Adolescencia y Su Relación Con El Comportamiento Prosocial. Rev. Latinoam. Psicol. 2007, 39, 211–225. [Google Scholar]
  30. Mestre, M.V.; Carlo, G.; Samper, P.; Tur-Porcar, A.M.; Mestre, A.L. Psychometric Evidence of a Multidimensional Measure of Prosocial Behaviors for Spanish Adolescents. J. Genet. Psychol. 2015, 176, 260–271. [Google Scholar] [CrossRef]
  31. Mestre, M.V. Desarrollo Prosocial: Crianza y Escuela. Rev. Mex. Investig. Psicol. 2017, 6, 115–134. [Google Scholar]
  32. Sancho, P.; Suero-Maloney, C.; Tomás, J.M.; Córdoba, A.I.; Jiménez, D.; Esnaola, I. Validating the Spanish Version of the Aggression Scale in Adolescents. Int. J. Sch. Educ. Psychol. 2022, 10, 248–257. [Google Scholar] [CrossRef]
  33. del Barrio, V.; Moreno, C.; López, R. Evaluación de la Agresión y la Inestabilidad Emocional en Niños Españoles: Su Relación con la Depresión. Clín. Salud 2001, 12, 33–50. [Google Scholar]
  34. Eisenberg, N.; Fabes, R.A. Prosocial Development. In Handbook of Child Psychology: Social, Emotional, and Personality Development; Damon, W., Eisenberg, N., Eds.; John Wiley & Sons Inc.: Hoboken, NJ, USA, 1998; pp. 701–778. [Google Scholar]
  35. Hastings, P.; McShane, K.; Parker, R.; Ladha, F. Ready to Make Nice: Parental Socialization of Young Sons’ and Daughters’ Prosocial Behaviors with Peers. J. Genet. Psychol. 2007, 168, 177–200. [Google Scholar] [CrossRef]
  36. Eagly, A.H. The His and Hers of Prosocial Behavior: An Examination of the Social Psychology of Gender. Am. Psychol. 2009, 64, 644–658. [Google Scholar] [CrossRef]
  37. Nielson, M.G.; Padilla-Walker, L.; Holmes, E.K. How Do Men and Women Help? Validation of a Multidimensional Measure of Prosocial Behavior. J. Adolesc. 2017, 56, 91–106. [Google Scholar] [CrossRef]
  38. Xiao, S.X.; Hashi, E.C.; Korous, K.M.; Eisenberg, N. Gender Differences across Multiple Types of Prosocial Behavior in Adolescence: A Meta-analysis of the Prosocial Tendency Measure-revised (PTM-R). J. Adolesc. 2019, 77, 41–58. [Google Scholar] [CrossRef]
  39. Carlo, G.; Mestre, M.V.; Mcginley, M.; Tur-Porcar, A.; Samper, P.; Streit, C. The Structure and Correlates of a Measure of Prosocial Moral Reasoning in Adolescents from Spain. Eur. J. Dev. Psychol. 2013, 10, 174–189. [Google Scholar] [CrossRef]
  40. Lai, F.H.Y.; Siu, A.M.H.; Chan, C.C.H.; Shek, D.T.L. Measurement of Prosocial Reasoning among Chinese Adolescents. Sci. World J. 2012, 2012, 174845. [Google Scholar] [CrossRef] [PubMed]
  41. Šukys, S.; Šukienė, E. Validity and reliability of the lithuanian version of prosocial tendencies measure—Revised (PTMR). Balt. J. Sport Health Sci. 2015, 3, 43–49. [Google Scholar] [CrossRef]
  42. Carlo, G.; Samper, P.; Malonda, E.; Mestre, A.L.; Tur-Porcar, A.M.; Mestre, M.V. Longitudinal Paths between Parents’ Use of Rewards and Young Adolescents’ Moral Traits and Prosocial Behaviors. J. Adolesc. 2022, 94, 1096–1107. [Google Scholar] [CrossRef] [PubMed]
  43. Mestre, M.V.; Carlo, G.; Samper, P.; Malonda, E.; Mestre, A.L. Bidirectional Relations among Empathy-related Traits, Prosocial Moral Reasoning, and Prosocial Behaviors. Soc. Dev. 2019, 28, 514–528. [Google Scholar] [CrossRef]
  44. Rodrigues, J.; Ulrich, N.; Mussel, P.; Carlo, G.; Hewig, J. Measuring Prosocial Tendencies in Germany: Sources of Validity and Reliablity of the Revised Prosocial Tendency Measure. Front. Psychol. 2017, 8, 2119. [Google Scholar] [CrossRef] [PubMed] [Green Version]
  45. Ngai, S.S.; Xie, L. Toward a Validation of the Prosocial Tendencies Measure Among Chinese Adolescents in Hong Kong. Child Indic. Res. 2018, 11, 1281–1299. [Google Scholar] [CrossRef]
  46. Simões, F.; Calheiros, M.M. The Relations between Prosocial Behaviors and Self-Regulation: Evidences from the Validation of the PTM-R for Portuguese Early Adolescents. Span. J. Psychol. 2016, 19, E73. [Google Scholar] [CrossRef]
  47. Fatima, S.; Dawood, S.; Munir, M. Parenting Styles, Moral Identity and Prosocial Behaviors in Adolescents. Curr. Psychol. 2022, 41, 902–910. [Google Scholar] [CrossRef]
  48. Yao, S.; Zhang, C.; Zhu, X.; Jing, X.; McWhinnie, C.M.; Abela, J.R.Z. Measuring Adolescent Psychopathology: Psychometric Properties of the Self-Report Strengths and Difficulties Questionnaire in a Sample of Chinese Adolescents. J. Adolesc. Health 2009, 45, 55–62. [Google Scholar] [CrossRef] [PubMed]
  49. Van Widenfelt, B.M.; Goedhart, A.W.; Treffers, P.D.A.; Goodman, R. Dutch Version of the Strengths and Difficulties Questionnaire (SDQ). Eur. Child Adolesc. Psychiatry 2003, 12, 281–289. [Google Scholar] [CrossRef] [PubMed]
  50. Vugteveen, J.; De Bildt, A.; Hartman, C.A.; Timmerman, M.E. Using the Dutch Multi-Informant Strengths and Difficulties Questionnaire (SDQ) to Predict Adolescent Psychiatric Diagnoses. Eur. Child Adolesc. Psychiatry 2018, 27, 1347–1359. [Google Scholar] [CrossRef] [Green Version]
  51. Essau, C.A.; Olaya, B.; Anastassiou-Hadjicharalambous, X.; Pauli, G.; Gilvarry, C.; Bray, D.; O’callaghan, J.; Ollendick, T.H. Psychometric Properties of the Strength and Difficulties Questionnaire from Five European Countries. Int. J. Methods Psychiatr. Res. 2012, 21, 232–245. [Google Scholar] [CrossRef]
  52. Van Roy, B.; Veenstra, M.; Clench-Aas, J. Construct Validity of the Five-Factor Strengths and Difficulties Questionnaire (SDQ) in Pre-, Early, and Late Adolescence. J. Child Psychol. Psychiatry 2008, 49, 1304–1312. [Google Scholar] [CrossRef] [PubMed]
  53. Ortuño-Sierra, J.; Chocarro, E.; Fonseca-Pedrero, E.; Riba, S.S.I.; Muñiz, J. The Assessment of Emotional and Behavioural Problems: Internal Structure of The Strengths and Difficulties Questionnaire. Int. J. Clin. Health Psychol. 2015, 15, 265–273. [Google Scholar] [CrossRef] [PubMed] [Green Version]
  54. Ortuño-Sierra, J.; Aritio-Solana, R.; Fonseca-Pedrero, E. Mental Health Difficulties in Children and Adolescents: The Study of the SDQ in the Spanish National Health Survey 2011–2012. Psychiatry Res. 2018, 259, 236–242. [Google Scholar] [CrossRef]
  55. Capron, C.; Thérond, C.; Duyme, M. Psychometric Properties of the French Version of the Self-Report and Teacher Strengths and Difficulties Questionnaire (SDQ). Eur. J. Psychol. Assess. 2007, 23, 79–88. [Google Scholar] [CrossRef]
  56. Hagquist, C. The Psychometric Properties of the Self-Reported SDQ—An Analysis of Swedish Data Based on the Rasch Model. Personal. Individ. Differ. 2007, 43, 1289–1301. [Google Scholar] [CrossRef]
  57. Aarø, L.E.; Davids, E.L.; Mathews, C.; Wubs, A.G.; Smith, O.R.F.; de Vries, P.J. Internalizing Problems, Externalizing Problems, and Prosocial Behavior—Three Dimensions of the Strengths and Difficulties Questionnaire (SDQ): A Study among South African Adolescents. Scand. J. Psychol. 2022, 63, 415–425. [Google Scholar] [CrossRef]
  58. Nagaoka, D.; Tomoshige, N.; Ando, S.; Morita, M.; Kiyono, T.; Kanata, S.; Fujikawa, S.; Endo, K.; Yamasaki, S.; Fukuda, M.; et al. Being Praised for Prosocial Behaviors Longitudinally Reduces Depressive Symptoms in Early Adolescents: A Population-Based Cohort Study. Front. Psychiatry 2022, 13, 865907. [Google Scholar] [CrossRef] [PubMed]
  59. Inglés, C.J.; Hidalgo, M.D.; Xavier Méndez, F.; Inderbitzen, H.M. The Teenage Inventory of Social Skills: Reliability and Validity of the Spanish Translation. J. Adolesc. 2003, 26, 505–510. [Google Scholar] [CrossRef] [PubMed] [Green Version]
  60. Manzano-Sánchez, D.; Gómez-Mármol, A.; Valero-Valenzuela, A.; Jiménez-Parra, J.F. School Climate and Responsibility as Predictors of Antisocial and Prosocial Behaviors and Violence: A Study towards Self-Determination Theory. Behav. Sci. 2021, 11, 36. [Google Scholar] [CrossRef] [PubMed]
  61. Mesurado, B.; Vidal, E.M.; Mestre, A.L. Negative Emotions and Behaviour: The Role of Regulatory Emotional Self-efficacy. J. Adolesc. 2018, 64, 62–71. [Google Scholar] [CrossRef] [PubMed]
  62. Lyu, T.; Tang, L.; Yang, Z. Psychological Capital on College Teachers’ and Students’ Entrepreneurial Performance and Sports Morality Under Social and Political Education. Front. Psychol. 2022, 13, 810626. [Google Scholar] [CrossRef]
  63. Zhang, S.; Fu, Y.N.; Liu, Q.; Turel, O.; He, Q. Psychological Capital Mediates the Influence of Meaning in Life on Prosocial Behavior of University Students: A Longitudinal Study. Child. Youth Serv. Rev. 2022, 140, 106600. [Google Scholar] [CrossRef]
  64. Avey, J.B.; Avolio, B.J.; Luthans, F. Experimentally Analyzing the Impact of Leader Positivity on Follower Positivity and Performance. Leadersh. Q. 2011, 22, 282–294. [Google Scholar] [CrossRef] [Green Version]
  65. Tomás, J.M.; Martínez-Gregorio, S.; Oliver, A. Bayesian Confirmatory Factor Analysis of the Psychological Capital PCQ-12 Scale. Eur. J. Psychol. Assess. 2022. Available online: https://econtent.hogrefe.com/doi/10.1027/1015-5759/a000738 (accessed on 15 January 2023). [CrossRef]
  66. Muthén, L.K.; Muthén, B.O. Mplus User‘s Guide, 8th ed.; Muthén & Muthén: Los Angeles, CA, USA, 1998. [Google Scholar]
  67. Hu, L.; Bentler, P.M. Cutoff Criteria for Fit Indexes in Covariance Structure Analysis: Conventional Criteria versus New Alternatives. Struct. Equ. Model. Multidiscip. J. 1999, 6, 1–55. [Google Scholar] [CrossRef]
  68. Enders, C. Analyzing Structural Equation Models with Missing Data. In Structural Equation Modeling: A Second Course; Hancock, G.R., Mueller, R.O., Eds.; Information Age Publishing: Charlotte, NC, USA, 2006. [Google Scholar]
  69. Hair, J.; Black, W.; Babin, B.; Anderson, R. Multivariate Data Analysis; Pearson Education: Upper Saddle River, NJ, USA, 2014. [Google Scholar]
  70. R Core Team. R: A Language and Environment for Statistical Computing; R Foundation for Statistical Computing: Vienna, Austria, 2020. [Google Scholar]
  71. Choi, S.W.; Gibbons, L.E.; Crane, P.K. Lordif: An R Package for Detecting Differential Item Functioning Using Iterative Hybrid Ordinal Logistic Regression/Item Response Theory and Monte Carlo Simulations. J. Stat. Softw. 2011, 39, 1–30. [Google Scholar] [CrossRef] [Green Version]
  72. Swaminathan, H.; Rogers, H.J. Detecting Differential Item Functioning Using Logistic Regression Procedures. J. Educ. Meas. 1990, 27, 361–370. [Google Scholar] [CrossRef]
  73. Zumbo, B.D. A Handbook on the Theory and Methods of Differential Item Functioning (DIF); National Defense Headquarters: Ottawa, ON, Canada, 1999. [Google Scholar]
  74. Bergin, C.; Talley, S.; Hamer, L. Prosocial Behaviours of Young Adolescents: A Focus Group Study. J. Adolesc. 2003, 26, 13–32. [Google Scholar] [CrossRef] [PubMed]
  75. Christov-Moore, L.; Simpson, E.A.; Coudé, G.; Grigaityte, K.; Iacoboni, M.; Ferrari, P.F. Empathy: Gender Effects in Brain and Behavior. Neurosci. Biobehav. Rev. 2014, 46, 604–627. [Google Scholar] [CrossRef] [PubMed] [Green Version]
  76. Rochat, M.J. Sex and Gender Differences in the Development of Empathy. J. Neurosci. Res. 2022. [Google Scholar] [CrossRef] [PubMed]
  77. Hyde, J.S. Gender Similarities and Differences. Annu. Rev. Psychol. 2014, 65, 373–398. [Google Scholar] [CrossRef] [Green Version]
  78. Hine, B.; Leman, P.J. The Developing Relationship between Gender and Pro-Social Behaviour. In Gender and Development; Hine, B., Leman, P.J., Eds.; Psychology Press: London, UK, 2013; pp. 78–108. Available online: https://pure.royalholloway.ac.uk/ws/portalfiles/portal/17712536/Dr._Benjamin_Hine_Full_Thesis.pdf (accessed on 15 February 2023).
  79. Löffler, C.S.; Greitemeyer, T. Are Women the More Empathetic Gender? The Effects of Gender Role Expectations. Curr. Psychol. 2021, 42, 220–231. [Google Scholar] [CrossRef]
  80. Aydin, Z.; Meltem, S.; Gördesli, A. Psychological Capital and Job Satisfaction in Public-School Teachers: The Mediating Role of Prosocial Behaviours. J. Educ. Teach. 2021, 47, 147–162. [Google Scholar] [CrossRef]
  81. Younas, S.; Tahir, F.; Sabih, F.; Hussain, R.; Hassan, A.; Sohail, M.; Hafa, S.Z.N.; Munawar, A.; Kanwal, R.; Tanvir, M.; et al. Psychological Capital and Mental Health: Empirical Exploration in Perspective of Gender. PONTE Int. Sci. Res. J. 2020, 76, 150–176. [Google Scholar] [CrossRef]
Figure 1. Factorial structure. Note: all the factor loadings are statistically significant p < 0.001.
Behavsci 13 00259 g001
Figure 2. Theta distributions by gender.
Behavsci 13 00259 g002
Figure 3. DIF plots for item PB1.
Behavsci 13 00259 g003
Figure 4. DIF plots for item PB4.
Behavsci 13 00259 g004
Figure 5. DIF plots for items PB12.
Behavsci 13 00259 g005
Figure 6. DIF plots for item PB13.
Behavsci 13 00259 g006
Figure 7. DIF plots for item PB15.
Behavsci 13 00259 g007
Figure 8. Tests characteristics curves (TCCs) by group.
Behavsci 13 00259 g008
Figure 9. Individual-level DIF impact.
Behavsci 13 00259 g009
Table 2. Item content.
Content
PBS1I try to make sad people happier
PBS2I spend time with my friends
PBS3 *When I have to do things that I don’t like I get mad
PBS4I try to help others
PBS5I am gentle
PBS6 *I cry about things thet don’t matter
PBS7I share thins I like with my friends
PBS8 *I feel annoyed
PBS9I help others with their homework
PBS10I let others use my toys
PBS11 *I have bad dreams
PBS12I like to play with others
PBS13I trust others
PBS14 *I bite my fingernails
PBS15I hug my friends
Notes: * Control items.
Table 3. Means (M), standard deviations (SD), skewness (g1), kurtosis (g2), inter-item correlations, and corrected item-total correlations (rit).
MSDg1g2PB1PB2PB4PB5PB7PB9PB10PB12PB13rit
PB12.750.48−1.681.93 0.44
PB22.700.50−1.290.580.15 * 0.30
PB42.730.471.360.620.52 *0.07ns 0.48
PB52.700.50−1.330.730.29 *0.09ns0.39 * 0.41
PB72.500.60−0.75−0.410.18 *0.19 *0.19 *0.15 * 0.42
PB92.240.63−0.25−0.650.28 *0.05ns0.34 *0.21 *0.21 * 0.37
PB102.400.65−0.61−0.610.24 *0.14 *0.27 *0.19 *0.28 *0.24 * 0.42
PB122.660.57−1.501.240.18 *0.30 *0.15 *0.28 *0.31 *0.19 *0.34 * 0.46
PB132.370.62−0.45−0.660.15 *0.25 *0.16 *0.26 *0.26 *0.11 *0.22 *0.30 * 0.39
PB152.250.76−0.46−1.140.28 *0.16 *0.35 *0.24 *0.25 *16 *0.23 *0.21 *0.20 *0.41
Notes: * p < 0.001; ns = non-statistically significant.
Table 4. Chi-square tests and changes in McFadden’s pseudoR2 for DIF detection.
Model 1
vs.
Model 2
Model 1
vs.
Model 3
Model 2
vs.
Model 3
p-Value
χ2 Test
PseudoR2
McFadden
p-Value
χ2 Test
PseudoR2
McFadden
p-Value
χ2 Test
PseudoR2
McFadden
PB10.0000.0530.0000.0880.0000.035
PB20.0820.0060.1990.0060.6450.000
PB40.0000.0450.0000.0530.0540.007
PB50.8470.0000.9680.0000.8670.000
PB70.9210.0000.4030.0020.1790.002
PB90.0380.0050.0530.0070.2120.002
PB100.1900.0020.2900.0030.3830.000
PB120.0000.0250.0000.0380.0040.013
PB130.0000.0160.0020.0160.6300.000
PB150.0000.0840.0000.0870.1060.003
Table 5. Nomological validity.
Self-EfficacyHopeResilienceOptimismPBPB *
Self-efficacy10.3820.3220.3610.2950.256
Hope 10.2920.5040.3090.309
Resilience 10.2920.1490.152
Optimism 10.2610.245
PB 10.887
PB * 1
Notes: All the correlations are statistically significant p < 0.001; PB = Prosocial Behavior; PB * = Prosocial Behavior scale without items with Differential Item Functioning.
Disclaimer/Publisher’s Note: The statements, opinions and data contained in all publications are solely those of the individual author(s) and contributor(s) and not of MDPI and/or the editor(s). MDPI and/or the editor(s) disclaim responsibility for any injury to people or property resulting from any ideas, methods, instructions or products referred to in the content.

