
Electrocardiographic Predictors of Atrial Fibrillation
 , and
, and
Abstract
:1. Introduction
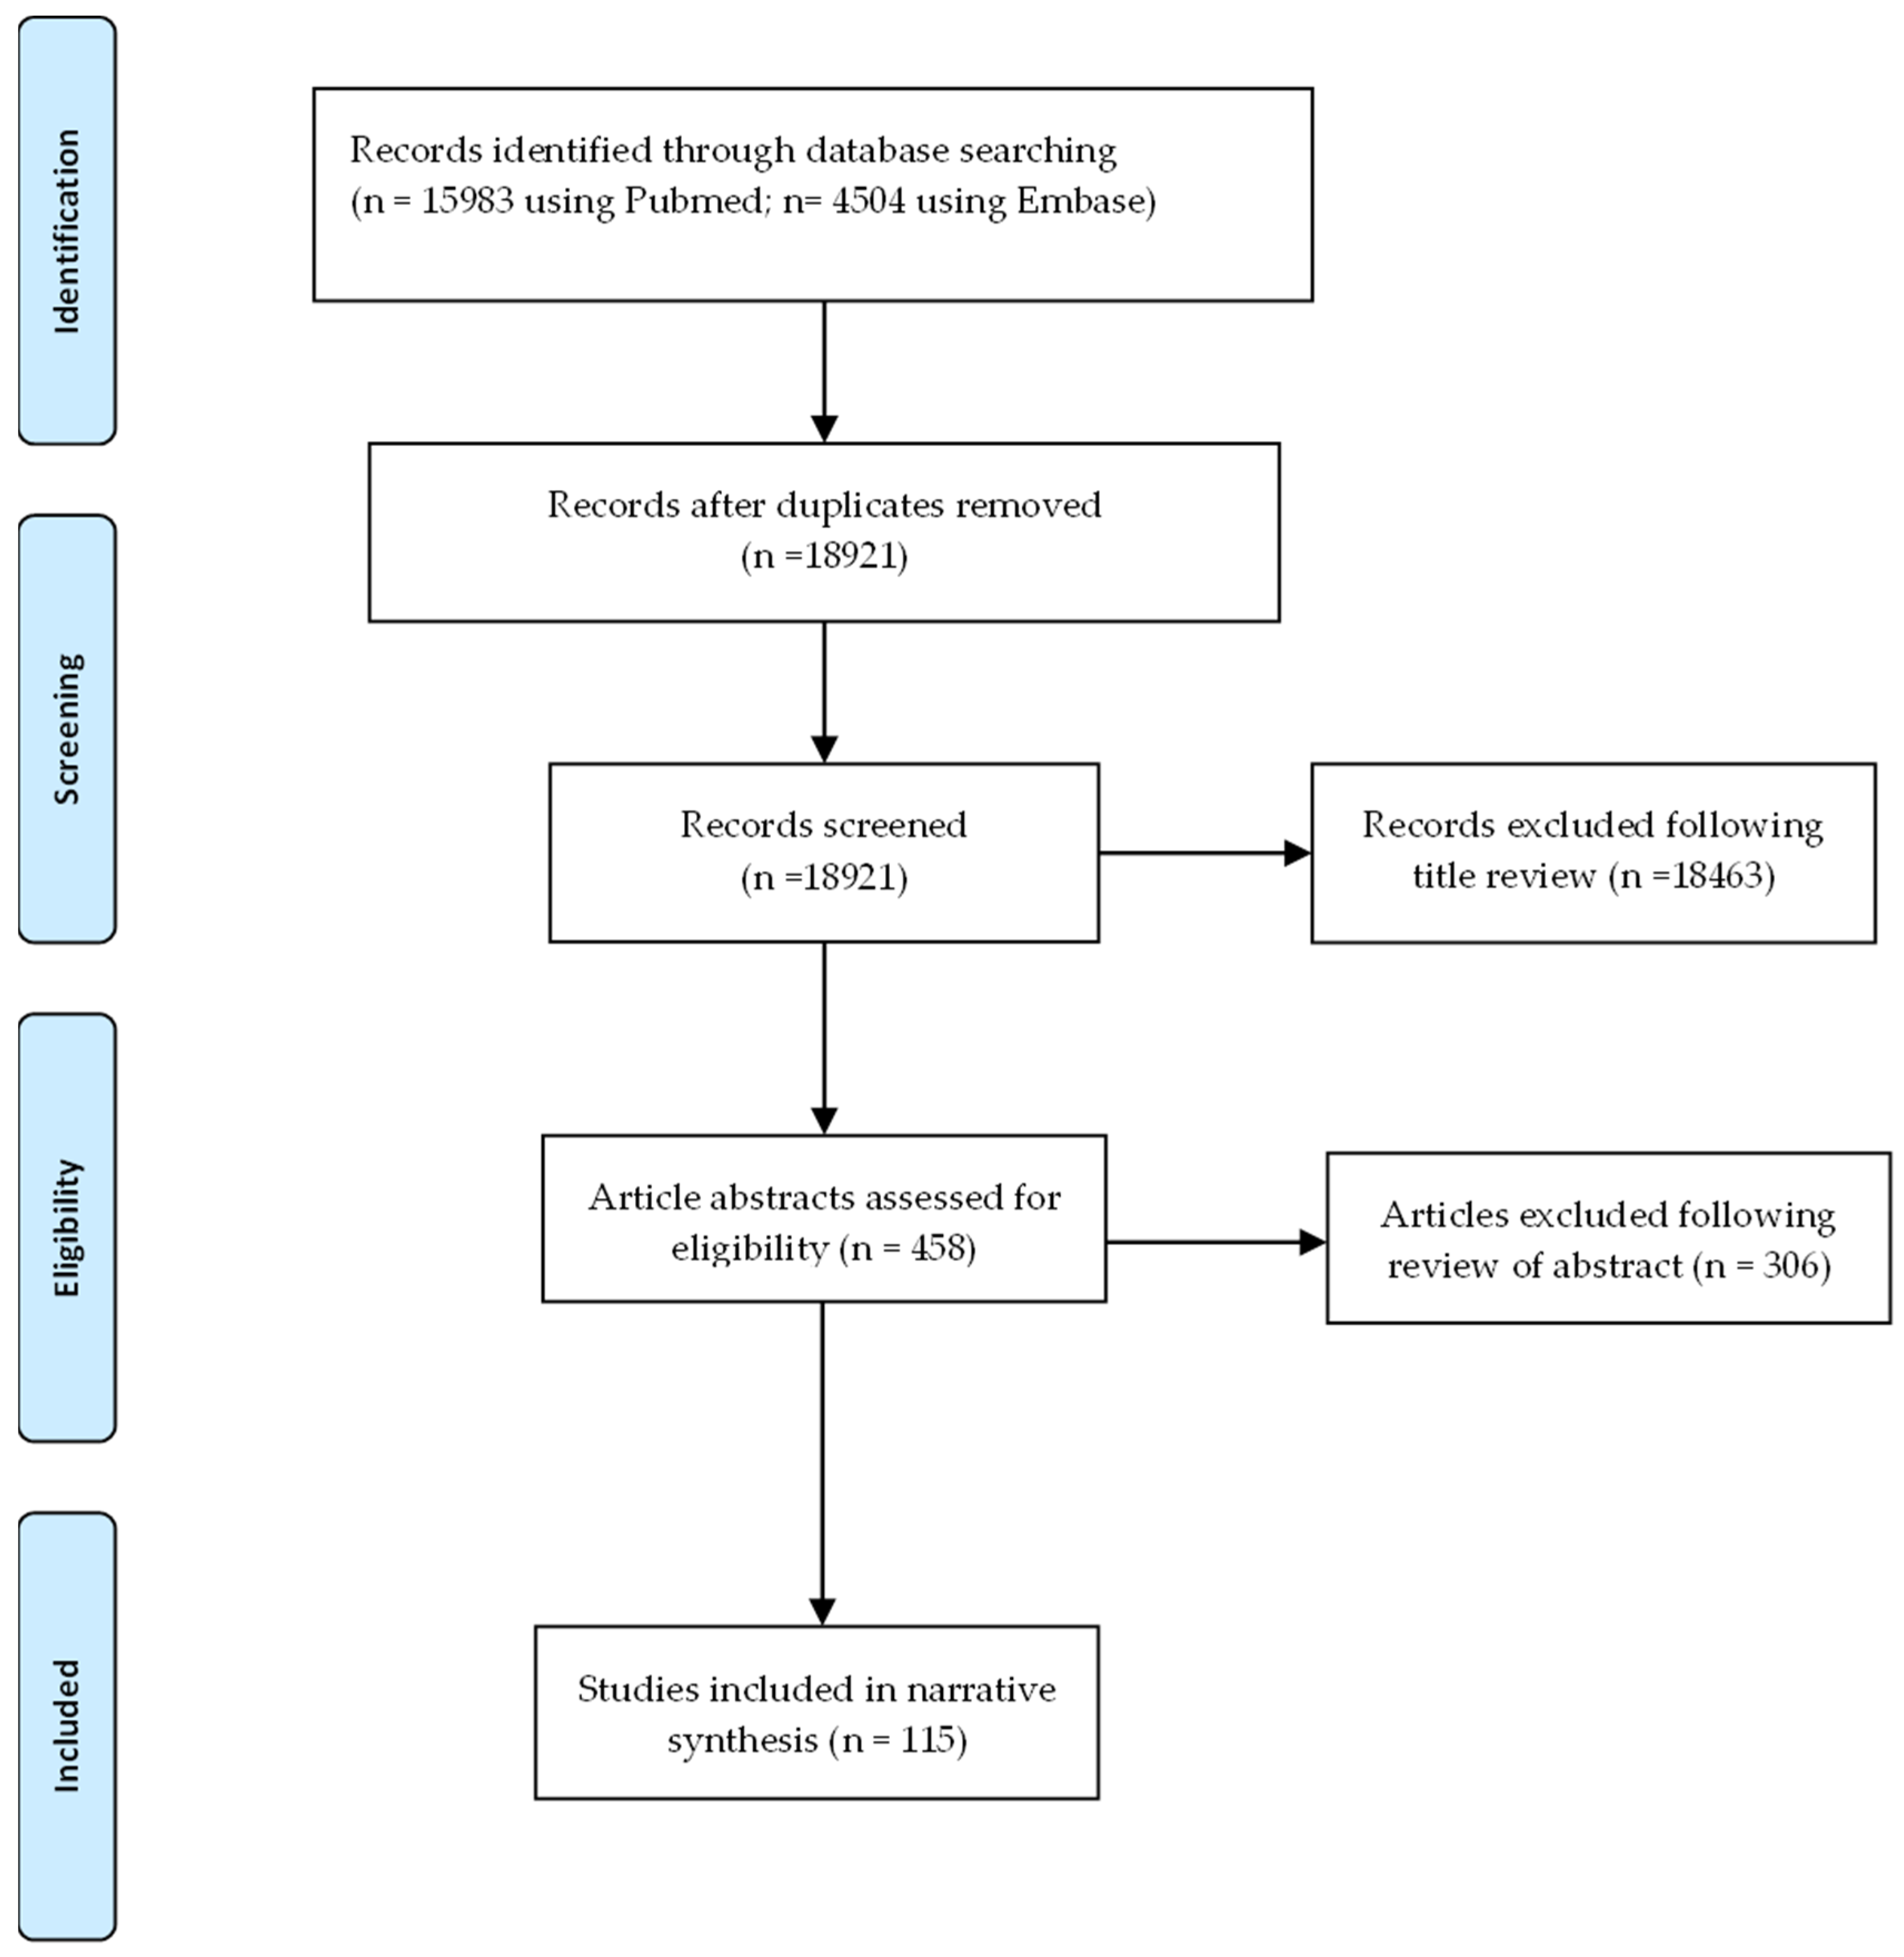
2. Methods
3. Results
3.1. Atrial Indices
3.1.1. Atrial Conduction Parameters
P-Wave Duration and Partial Interatrial Block
Advanced Inter Atrial Block
Other P-Wave Duration Parameters
P-Wave Dispersion
PR Interval
3.1.2. P-Wave Morphological Parameters
P-Wave Axis

| Authors, Year | Population (Size) | Study Type | Parameter Definition | Result | AF Detection |
|---|---|---|---|---|---|
| P-wave axis | |||||
| Dhaliwal et al., 2020 [90] | ACCORD (8965) | Retrospective | 0–75°—normal | HR 2.65 (95% CI 1.76–3.99) | ECG |
| Acampa et al., 2019 [19] | Cryptogenic stroke (222) | Prospective | 0–74°—normal | OR 3.31 (95% CI 1.49–7.35) | 7-day Holter |
| Maheshwari et al., 2017 [91] | ARIC population (15,102) | Retrospective | 0–75°—normal | RR 2.34 (95% CI 2.12–2.58) | ECG, Medical records |
| Rangel, O’Neal, and Soliman, 2016 [88] | CHS (4272) | Retrospective | 0–75°—normal | HR 1.17 (95% CI 1.03–1.33) | ECG, medical records |
| Hayashi et al., 2014 [65] | P-pulmonale (591) | Retrospective | <74°—normal | HR 2.55 (95% CI 1.20–5.41) | ECG |
| Perez et al., 2009 [41] | Patients that had an ECG for usual indications (42,751) | Retrospective | Not defined | HR 1.90 (95% CI 1.60–2.40) | ECG |
| P-wave terminal force | |||||
| Kreimer et al., 2021 [14] | ILR (366) | Retrospective | ≤−4000 µV·ms | HR 5.30 (95% CI 3.25–8.64) | ILR AF ≥ 30 s |
| Lehtonen et al., 2018 [21] | Hypertensives (665) | Retrospective | ≤−4 mV·ms | HR 0.85 (95% CI 0.66–1.09) | Medical records |
| Cortez et al., 2017 [26] | Ischemic stroke patients from LSR (n = 227) | Prospective | ≥0.04 mm·s | HR 1.00 (95% CI 1.00–1.00) | ECG |
| Goda et al., 2017 [92] | Ischemic stroke (226) | Retrospective | Per 0.01 mm·s | OR 1.61 (95% CI 1.24–2.09) | Inpatient monitoring |
| Sugiyama et al., 2017 [93] | Acute ischemic stroke (105) | Prospective | Continuous | OR 1.46 (95% CI 1.02–2.08) | 24 h Holter |
| Rasmussen et al., 2017 [94] | Copenhagen Holter study (678) | Prospective cohort | >4000 | HR 0.86 (95% CI 0.52–1.41) | ECG, inpatient monitoring, medical records |
| Baturova et al., 2016 [95] | Ischemic stroke with (55) and without AF (110) (165) | Case control | >40 mm·ms | OR 4.04 (95% CI 1.34–12.14) | Case control |
| Magnani et al., 2015 [29] | FHS (3110) ARIC (8254) | Prospective cohort | >4000 μV·ms | HR 1.00; 95% CI 0.71–1.40 HR 1.56; 95% CI 1.24–2.00 | Medical records |
| Francia et al., 2015 [31] | Hypertensive (88) | Case-control | Continuous | HR 1.03 (95% CI 0.91–1.15) | ECG, Holter |
| Kamel et al., 2014 [96] | 45–84 (6751) | Prospective cohort | Per 1 SD | HR 1.11 (95% CI 1.03–1.21) | ECG |
| Eranti et al., 2014 [97] | Middle-aged subjects (35–41 years) (10,647) | Prospective | ≥0.06 mm·s | HR 1.91 (95% CI 1.34–2.73) | Medical records |
| Nishi et al., 2013 [98] | Hemodialysis (299) | Retrospective | ≥0.04 mm·s | HR 4.89 (95% CI 2.54–9.90) | ECG |
| Hayashi et al., 2014 [65] | P-pulmonale (591) | Retrospective | Med free + >77 µV·ms | HR 2.22 (95% CI 0.70–8.31) | ECG |
| Soliman et al., 2009 [40] | General population (15,429) | Prospective cohort | >95th percentile | HR 1.22 (95% CI 1.14–1.31) | ECG |
| P-wave amplitude | |||||
| Yoshizawa et al., 2014 [34] | General population (136) | Retrospective | II | p = 0.032 p = 0.001 | ECG |
| Kreimer et al., 2021 [14] | Patients undergoing ILR for syncope, palpitations, ESUS ILR (366) | Retrospective | II < 0.1 mV | HR 2.11 (95% CI 1.30–3.44) | ILR |
| Altunkeser et al., 2003 [46] | Patients with structural heart disease and LAD ≤ 5.0 cm with AF (n = 37) and without AF (n = 38) (75) | Case control | P-wave amplitude max P-wave amplitude min P-wave dispersion (amplitude) | p < 0.001 NS in multivariable analysis p < 0.01 | Case-control study |
| Other morphological parameters | |||||
| Lentz et al., 2019 [99] | Patients on ibrutinib (168) | Retrospective | (1) Lead II-bifid p-wave, with 40 ms between peaks for ≥ 2.5 mm wide ≥ 100 msec in duration, (2) Lead V1-biphasic p-wave with terminal portion ≥ 40 msec in duration or terminal portion ≥ 1 mm deep or (3) PR interval ≥ 200 msec (intra-atrial conduction delay) | HR 5.40 (95% CI 1–9–15.4) | ECG, medical records |
| Hayashi and Horie, 2015 [32] | Patients with biphasic p-wave in lead II (141) | Retrospective | Amplitude of initial p-wave portion in lead II ≥ 73 (μV) Amplitude of terminal p-wave portion in lead III ≥ 48 (μV) Duration of initial p-wave portion in lead III ≥ 71 (ms) | HR 1.22 (95% CI 0.50–2.88) HR 1.60 (95% CI 0.68–3.72) HR 2.90 (95% CI 1.16–7.11) | ECG |
| van Diepen et al., 2010 [100] | Patients on pexelizumab with (315) and without AF (315) (630) | Case-control | M-shaped, W-shaped, irregular or notched p-waves | OR 1.68 (95% CI 1.03–2.73) | Case control (ECG, medical records) |
| Compound conduction and morphological parameters | |||||
| Rasmussen et al., 2020 [15] | Copenhagen Holter study (632) | Retrospective | P-wave area/duration index | HR 2.80 (95% CI 1.64–4.79) | ECG, inpatient monitoring |
| Tse et al., 2020 [101] | Mitral stenosis (59) | Retrospective | Mean p-wave area in V3 | OR 1.08 (95% CI 1.01–1.16) | 2 ECGs (persistent or permanent AF) |
| Hellman et al., 2020 [17] | CKD 4/5–non-dialysis (165) | Prospective | PWD ≥ 120 ms in lead II ± > 1 biphasic p-waves in leads II, III or aVF; or duration of terminal negative portion of p-wave > 40 ms or depth of terminal negative portion of p-wave > 1 mm in lead V1 | Not significant | ECG, 24 Holter |
| Soliman et al., 2009 [40] | ARIC participants (15,429) | Prospective cohort | Maximum p-wave area Mean p-wave area | HR 1.13 (95% CI 1.05–1.23) HR 1.11 (95% CI 1.02–1.20) | ECG |
| De Bacquer, Willekens, and De Backer, 2007 [102] | 55–74 years old with AF (40) and age-matched and gender-matched controls (120) | Nested case control | Maximum p-wave duration and notched or deflected p-wave morphology | OR 13.4 (95% CI 3.30–46.60) | Case control |
P-Wave Terminal Force
P-Wave Amplitude
Other P-Wave Morphological Parameters
Compound Conduction and Morphological Parameters
3.2. Ventricular Parameters
| Author (Year) | Population and Size | Study Type | Parameter Definition | Result | AF Detection |
|---|---|---|---|---|---|
| Left Ventricular Hypertrophy | |||||
| Lehtonen et al., 2018 [21] | Hypertensive (2665) Non-hypertensive (3148) (5813) | Retrospective | Sokolov criteria Cornell | HR 1.51 (95% CI 1.14–2.01) HR 1.26 (95% CI 0.94–1.69) | Medical records |
| Patel et al., 2017 [106] | CHS (4904) | Retrospective | Minnesota | HR 1.50 (95% CI 1.18–1.90) | ECG |
| Chrispin et al., 2014 [107] | MESA (4942) | Retrospective | Sokolov product Cornell Framingham adjusted Cornell Minnesota Lewis Gubner and Ungerleider Sokolow voltage Cornell product Romhilt-Estes Perugia | HR 1.83 (95% CI 1.06–3.14) HR 1.36 (95% CI 0.72–2.58) HR 1.36 (95% CI 0.76–2.58) HR 1.26 (95% CI 0.76–2.08) HR 0.72 (95% CI 0.47–1.11) HR 1.02 (95% CI 0.62–1.68) HR 1.37 (95% CI 0.92–2.07) HR 1.69 (95% CI 0.94–2.31) HR 1.48 (95% CI 0.64–3.39) HR 1.35 (95% CI 0.79–2.28) | Medical records |
| Knuiman et al., 2014 [73] | Busselton Health Study participants (4267) | Prospective | LVH Minnesota code | HR 0.33; 95% CI 0.08–1.33) | ICD codes |
| Macfarlane et al., 2011 [39] | Older patients on pravastatin (5804) | Retrospective | LVH Minnesota code Definite Probable Possible | HR 2.13 (95% CI 1.38–3.28) HR 2.21 (95% CI 1.49–3.28) HR 1.30 (95% CI 1.03–1.64) | ECG |
| Perez et al., 2009 [41] | Patients that had an ECG for usual indications (42,751) | Retrospective | LVH Romhilt Estes criteria | HR 1.30 (95% CI 1.00–1.70, p = 0.046) | ECG |
| Watanabe et al., 2006 [108] | Niigata study (63,386) | Retrospective | LVH Sokolov- Lyon criteria | OR 1.39 (95% CI 1.1–1.75) | ECG |
| QT interval | |||||
| Patel et al., 2018 [109] | CHS (4181) | Retrospective | Prolonged > 95th percentile Per 1-SD increase | HR 1.50 (95% CI 1.20–1.88 HR 1.07 (95% CI 1.01–1.13 | ECG, medical records |
| Lehtonen et al., 2018 [21] | Hypertensive (2665) Non-hypertensive (3148) (5813) | Retrospective | 1 SD increment in QTc (Bazzet’s) Prolonged QTc > 450 ms (men), >460 ms (women) | HR 1.11 (95% CI 1.01–1.22) HR 1.26 (95% CI 0.78–2.03) | ECG |
| Nguyen et al., 2016 [110] | CHS (4696) | Retrospective | Prolonged QTc (Framingham) | HR 2.50 (95% CI 1.40–4.30) | ECG, medical records |
| Baturova et al., 2016 [95] | Ischemic stroke patients with AF (55) and without AF (110) (165) | Retrospective | QTc (Bazzet’s) | NS in multivariable analysis | Case control |
| Hoshino et al., 2015 [111] | Stroke (972) | Retrospective | QTc (per 10 ms increase) | OR 1.41 (95% CI 1.24–1.61) | Inpatient monitoring, 24 h Holter |
| Baturova et al., 2015 [112] | Ischemic stroke with (454) | Retrospective | QTc (Bazzet’s) | NS in multivariable analysis | ECG, medical records |
| Hayashi et al., 2014 [65] | Patients with p-pulmonale (591) | Retrospective | QT interval > 353 ms | HR 0.89 (95% CI 0.34–2.31) | ECG |
| Shulman et al., 2015 [70] | African American, Hispanic and non- Hispanic white (n = 50870) | Retrospective | QTc (per 10 ms increase) | HR 1.00 (95% CI 1.00–1.01, p < 0.001) | ECG |
| Mandyam et al., 2013 [113] | ARIC (14,538) + CHS (4745) + 2396 (Health ABC) | Retrospective | 10 ms increase in QTc (Framingham) | HR 2.05 (95% CI 1.42–2.96) | ECG, medical records |
| Nielsen et al., 2013 [114] | Copenhagen (281,277) | Retrospective | QTc ≤ 372 ms QTc ≥ 464 ms QTc ≥ 458 ms | HR 1.45 (95% CI 1.14–1.84) HR 1.44 (95% CI 1.24–1.66) HR 2.32 (95% CI 1.52–3.54) | Medical records |
| Macfarlane et al., 2011 [39] | Older patients on pravastatin (5804) | Retrospective | Prolonged QTc (Hodges) (per 30 ms increase) | HR 1.21 (95% CI 1.11–1.32) | ECG |
| QRS duration | |||||
| Patel et al., 2018 [109] | CHS (4181) | Retrospective | Prolonged Per 1-SD | HR 1.00 (95% CI 0.77–1.30) HR 0.99 (95% CI 0.94–1.06) | ECG, medical records |
| Aeschbacher et al., 2018 [115] | ARIC (15314) | Retrospective | QRS 100–119 ms QRS ≥ 120 ms Per 1-SD increase | HR 1.13 (95% CI 1.02–1.26) HR 1.35 (95% CI 1.08–1.68) HR 1.11 (95% CI 1.07–1.15) | ECG, medical records |
| Cortez et al., 2017 [26] | Ischemic stroke patients from LSR (227) | Prospective | QRS duration (continuous) | HR 1.01 (95% CI 1.00 to 1.02, p = 0.354) | ECG |
| Baturova et al., 2015 [112] | Ischemic stroke (454) | Retrospective | QRS duration (continuous) | HR 1.02 (95% CI 1.00–1.03) | ECG, medical records |
| Shulman et al., 2015 [70] | African American, Hispanic and non-Hispanic white (50,870) | Retrospective | QRS duration (per 10 ms increase) | HR 1.00 (95% CI 1.00–1.00; p = 0.092) | ECG |
| Macfarlane et al., 2011 [39] | Older patients on pravastatin (5804) | Retrospective | QRS (per 20 ms) | HR 1.07 (95% CI 0.98–1.16; p = 0.14) | ECG |
| El-Chami et al., 2010 [116] | ADVANCENT (25,268) | Retrospective | QRS duration (continuous) | OR 1.20 (95% CI 1.14–1.25) | Medical records |
| LBBB, RBBB, LAFB | |||||
| Uhm et al., 2020 [117] | Patients that had ECG (n = 107,838) | Retrospective | NIVCD ≥ 110 ms | HR 2.57 (95% CI 1.07–6.16) | ECG, medical records |
| Nguyen et al., 2016 [110] | CHS (4696) | Retrospective | LAFB | HR 2.10 (95% CI 1.10–3.90) | ECG, medical records |
| Frontera et al., 2015 [71] | ILR implanted for syncope or palpitations (n = 200) | Retrospective | LBBB | OR 1.05 (95% CI 0.18–4.70) | ILR AF > 30 s |
| Frontera et al., 2015 [71] | ILR for syncope or palpitations (n = 200) | Retrospective | RBBB iRBBB | OR 3.60 (95% CI 0.84–14.99) OR 9.04 (95% CI 1.40–10.24) | ILR AF > 30 s |
| Knuiman et al., 2014 [73] | Busselton Health Study participants (n = 4267) | Prospective | LBBB | HR 1.84 (95% CI 0.90–3.74) | ICD codes |
| Perez et al., 2009 [41] | 42,751 | Retrospective | LBBB | HR 1.70 (95% CI 1.20–2.50) | ECG |
| Watanabe et al., 2006 [108] | Niigata study (63,386) | Retrospective | LBBB | OR 0.98 (95% CI 0.13–7.23; p = 0.98) | ECG |
| Watanabe et al., 2006 [108] | Niigata study (63,386) | Retrospective | RBBB | OR 0.84 (95% CI 0.46–1.53) | ECG |
| Fragmented QRS | |||||
| Hellman et al., 2020 [17] | CKD 4/5—non-dialysis (165) | Prospective | Notched R or S wave or the presence of ≥1 additional r-waves (R’) or in the presence of a wide QRS complex (>120 ms), >2 notches in R or S waves in two contiguous leads corresponding to a myocardial region, | Not significant | ECG, 24 h Holter |
| Yesin et al., 2018 [61] | STEMI (171) | Prospective | Various RSR’ patterns | OR 3.24 (95% CI 1.02–10.25) | Inpatient monitoring |
| Poor R- wave progression | |||||
| Lehtonen et al., 2018 [21] | Hypertensive (2665) Non-hypertensive (3148) (5813) | Retrospective | Poor r-wave progression | HR 1.49 (95% CI 1.01–2.20) | ECG |
| Frontal QRS-T angle | |||||
| Jogu et al., 2017 [118] | CHS (4282) | Retrospective | >Sex specific 95th percentile Per 10° increase | HR 1.55 (95% CI 1.23–1.97) HR 1.03 (95% CI 1.01–1.05) | ECG, medical records |
| ST-T segment abnormalities | |||||
| Lehtonen et al., 2018 [21] | Hypertensive (2665) Non-hypertensive (3148) (5813) | Retrospective | Negative t-wave in I and V6 Positive t-wave in aVR | HR 2.10 (95% CI 1.40–3.13) HR 3.47 (95% CI 1.16–10.34) | ECG |
| Bachmann et al., 2016 [119] | Copenhagen ECG study (138,404) | Retrospective | T peak- T end lead V5 < 5th % (58–77 ms) lead V5 < 95th % (116–140 ms) | HR 1.18 (95% CI 1.06–1.32) HR 1.09 (95% CI 0.99–1.22) | Medical records |
| Macfarlane et al., 2011 [39] | Older patients on pravastatin (5804) | Retrospective | Minnesota code 5-1 or 5-2 Minnesota code 4-1 or 4-2 See Supplementary Table S3 | HR 1.69 (95% CI 1.34–2.13) HR 1.70 (95% CI 1.32–2.20) | ECG |
| Watanabe et al., 2006 [108] | Niigata study (63,386) | Retrospective | Mild ST abnormality Severe ST abnormality | OR 1.66 (95% CI 1.13–2.43) OR 5.12 (95% CI 2.30–11.38) | ECG |
3.2.1. Left Ventricular Hypertrophy
3.2.2. QT Interval
3.2.3. QRS Duration
3.2.4. Bundle Brunch Block (BBB)
3.2.5. QRS Fragmentation
3.2.6. Poor R-Wave Progression
3.2.7. Frontal QRS-T Angle
3.2.8. ST Segment—T-Wave Abnormalities
4. Discussion
4.1. Summary of Findings
4.2. The Logistics of AF Prediction
4.3. The Role of AF Prediction
4.4. Multi Dimension Risk Prediction
4.5. The Role of Artificial Intelligence and Consumer-Facing Devices in AF Prediction
5. Conclusions
Supplementary Materials
Author Contributions
Funding
Institutional Review Board Statement
Informed Consent Statement
Data Availability Statement
Conflicts of Interest
References
- Hindricks, G.; Potpara, T.; Dagres, N.; Arbelo, E.; Bax, J.J.; Blomström-Lundqvist, C.; Boriani, G.; Castella, M.; Dan, G.-A.; Dilaveris, P.E.; et al. 2020 ESC Guidelines for the diagnosis and management of atrial fibrillation developed in collaboration with the European Association of Cardio-Thoracic Surgery (EACTS). Eur. Heart J. 2020, 42, 373–498. [Google Scholar] [CrossRef]
- Krijthe, B.P.; Kunst, A.; Benjamin, E.J.; Lip, G.Y.H.; Franco, O.H.; Hofman, A.; Witteman, J.; Stricker, B.H.; Heeringa, J. Projections on the number of individuals with atrial fibrillation in the European Union, from 2000 to 2060. Eur. Heart J. 2013, 34, 2746–2751. [Google Scholar] [CrossRef] [Green Version]
- Zoni-Berisso, M.; Lercari, F.; Carazza, T.; Domenicucci, S. Epidemiology of atrial fibrillation: European perspective. Clin. Epidemiol. 2014, 6, 213. [Google Scholar] [CrossRef] [Green Version]
- Benjamin, E.J.; Muntner, P.; Alonso, A.; Bittencourt, M.S.; Callaway, C.W.; Carson, A.P.; Chamberlain, A.M.; Chang, A.R.; Cheng, S.; Das, S.R.; et al. Heart Disease and Stroke Statistics-2019 Update: A Report from the American Heart Association. Circulation 2019, 139, e56–e528. [Google Scholar] [CrossRef]
- Sanna, T.; Diener, H.C.; Passman, R.S.; Di Lazzaro, V.; Bernstein, R.A.; Morillo, C.A.; Rymer, M.M.; Thijs, V.; Rogers, T.; Beckers, F.; et al. Cryptogenic stroke and underlying atrial fibrillation. N. Engl. J. Med. 2014, 370, 2478–2486. [Google Scholar] [CrossRef] [PubMed] [Green Version]
- Cotter, P.E.; Martin, P.J.; Ring, L.; Warburton, E.A.; Belham, M.; Pugh, P.J. Incidence of atrial fibrillation detected by implantable loop recorders in unexplained stroke. Neurology 2013, 80, 1546–1550. [Google Scholar] [CrossRef] [Green Version]
- Jabre, P.; Jouven, X.; Adnet, F.; Thabut, G.; Bielinski, S.J.; Weston, S.A.; Roger, V.L. Atrial Fibrillation and Death After Myocardial Infarction. Circulation 2011, 123, 2094–2100. [Google Scholar] [CrossRef] [PubMed] [Green Version]
- Di Carlo, A.; Lamassa, M.; Baldereschi, M.; Pracucci, G.; Consoli, D.; Wolfe, C.D.A.; Giroud, M.; Rudd, A.; Burger, I.; Ghetti, A.; et al. Risk factors and outcome of subtypes of ischemic stroke. Data from a multicenter multinational hospital-based registry. Eur. Commun. Stroke Project J. Neurol. Sci. 2006, 244, 143–150. [Google Scholar]
- Healey, J.S.; Connolly, S.J.; Gold, M.R.; Israel, C.W.; Van Gelder, I.C.; Capucci, A.; Lau, C.P.; Fain, E.; Yang, S.; Bailleul, C.; et al. Subclinical Atrial Fibrillation and the Risk of Stroke. N. Engl. J. Med. 2012, 366, 120–129. [Google Scholar] [CrossRef] [Green Version]
- Kottkamp, H. Human atrial fibrillation substrate: Towards a specific fibrotic atrial cardiomyopathy. Eur. Heart J. 2013, 34, 2731–2738. [Google Scholar] [CrossRef] [PubMed] [Green Version]
- Watanabe, Y.; Nakano, Y.; Hidaka, T.; Oda, N.; Kajihara, K.; Tokuyama, T.; Uchimura, Y.; Sairaku, A.; Motoda, C.; Fujiwara, M.; et al. Mechanical and substrate abnormalities of the left atrium assessed by 3-dimensional speckle-tracking echocardiography and electroanatomic mapping system in patients with paroxysmal atrial fibrillation. Heart Rhythm 2015, 12, 490–497. [Google Scholar] [CrossRef]
- Teh, A.W.; Kistler, P.M.; Lee, G.; Medi, C.; Heck, P.M.; Spence, S.J.; Sparks, P.B.; Morton, J.B.; Kalman, J.M. Electroanatomic remodeling of the left atrium in paroxysmal and persistent atrial fibrillation patients without structural heart disease. J. Cardiovasc. Electrophysiol. 2012, 23, 232–238. [Google Scholar] [CrossRef] [PubMed]
- Aizawa, Y.; Watanabe, H.; Okumura, K. Electrocardiogram (ECG) for the Prediction of Incident Atrial Fibrillation: An Overview. J. Atr. Fibrillation 2017, 10, 1724. [Google Scholar] [CrossRef]
- Kreimer, F.; Aweimer, A.; Pflaumbaum, A.; Mügge, A.; Gotzmann, M. Impact of P-wave indices in prediction of atrial fibrillation—Insight from loop recorder analysis. Ann. Noninvasive Electrocardiol. 2021, 26, e12854. [Google Scholar] [CrossRef] [PubMed]
- Rasmussen, M.U.; Kumarathurai, P.; Fabricius-Bjerre, A.; Larsen, B.S.; Domínguez, H.; Davidsen, U.; Gerds, T.A.; Kanters, J.K.; Sajadieh, A. P-wave indices as predictors of atrial fibrillation. Ann. Noninvasive Electrocardiol. 2020, 25, e12751. [Google Scholar] [CrossRef] [PubMed] [Green Version]
- Istolahti, T.; Eranti, A.; Huhtala, H.; Lyytikäinen, L.P.; Kähönen, M.; Lehtimäki, T.; Eskola, M.; Anttila, I.; Jula, A.; Antoni, B.; et al. The prevalence and prognostic significance of interatrial block in the general population. Ann. Med. 2020, 52, 63–73. [Google Scholar] [CrossRef]
- Hellman, T.; Hakamäki, M.; Lankinen, R.; Koivuviita, N.; Pärkkä, J.; Kallio, P.; Kiviniemi, T.; Airaksinen, K.; Järvisalo, M.; Metsärinne, K. Interatrial block, P terminal force or fragmented QRS do not predict new-onset atrial fibrillation in patients with severe chronic kidney disease. BMC Cardiovasc. Disord. 2020, 20, 437. [Google Scholar] [CrossRef]
- Müller-Edenborn, B.; Minners, J.; Kocher, S.; Chen, J.; Zeh, W.; Lehrmann, H.; Allgeier, J.; Neumann, F.; Arentz, T.; Jadidi, A. Amplified P-wave duration predicts new-onset atrial fibrillation in patients with heart failure with preserved ejection fraction. Clin. Res. Cardiol. 2019, 109, 978–987. [Google Scholar] [CrossRef]
- Acampa, M.; Lazzerini, P.E.; Guideri, F.; Tassi, R.; Andreini, I.; Domenichelli, C.; Cartocci, A.; Martini, G. Electrocardiographic Predictors of Silent Atrial Fibrillation in Cryptogenic Stroke. Heart Lung Circ. 2019, 28, 1664–1669. [Google Scholar] [CrossRef]
- Skov, M.W.; Ghouse, J.; Kühl, J.T.; Platonov, P.G.; Graff, C.; Fuchs, A.; Rasmussen, P.V.; Pietersen, A.; Nordestgaard, B.G.; Torp-Pedersen, C.; et al. Risk prediction of atrial fibrillation based on electrocardiographic interatrial block. J. Am. Heart Assoc. 2018, 7, e008247. [Google Scholar] [CrossRef] [Green Version]
- Lehtonen, A.O.; Langén, V.L.; Porthan, K.; Kähönen, M.; Nieminen, M.S.; Jula, A.M.; Niiranen, T.J. Electrocardiographic predictors of atrial fibrillation in nonhypertensive and hypertensive individuals. J. Hypertens. 2018, 1, 1874–1881. [Google Scholar] [CrossRef] [PubMed]
- Massó-van Roessel, A.; Escobar-Robledo, L.A.; Dégano, I.R.; Grau, M.; Sala, J.; Ramos, R.; Marrugat, J.; Bayés de Luna, A.; Elosua, R. Analysis of the Association Between Electrocardiographic P-wave Characteristics and Atrial Fibrillation in the REGICOR Study. Rev. Esp. Cardiol. Engl. Ed. 2017, 70, 841–847. [Google Scholar] [CrossRef] [PubMed]
- Alexander, B.; MacHaalany, J.; Lam, B.; van Rooy, H.; Haseeb, S.; Kuchtaruk, A.; Glover, B.; Bayés de Luna, A.; Baranchuk, A. Comparison of the Extent of Coronary Artery Disease in Patients with Versus Without Interatrial Block and Implications for New-Onset Atrial Fibrillation. Am. J. Cardiol. 2017, 119, 1162–1165. [Google Scholar] [CrossRef] [PubMed]
- Conte, G.; Luca, A.; Yazdani, S.; Caputo, M.L.; Regoli, F.; Moccetti, T.; Kappenberger, L.; Vesin, J.-M.; Auricchio, A. Usefulness of P-Wave Duration and Morphologic Variability to Identify Patients Prone to Paroxysmal Atrial Fibrillation. Am. J. Cardiol. 2017, 119, 275–279. [Google Scholar] [CrossRef] [PubMed]
- Smith, J.W.; O’Neal, W.T.; Shoemaker, M.B.; Chen, L.Y.; Alonso, A.; Whalen, S.P.; Soliman, E.Z. PR-Interval Components and Atrial Fibrillation Risk (from the Atherosclerosis Risk in Communities Study). Am. J. Cardiol. 2017, 119, 466–472. [Google Scholar] [CrossRef] [PubMed] [Green Version]
- Cortez, D.; Baturova, M.; Lindgren, A.; Carlson, J.; Shubik, Y.V.; Olsson, B.; Platonov, P.G. Atrial time and voltage dispersion are both needed to predict new-onset atrial fibrillation in ischemic stroke patients. BMC Cardiovasc. Disord. 2017, 17, 200. [Google Scholar] [CrossRef] [PubMed]
- Çinier, G.; Tekkeşin, A.İ.; Genç, D.; Yıldız, U.; Parsova, E.; Pay, L.; Alexander, B.; Bozbeyoğlu, E.; Türkkan, C.; Alper, A.T.; et al. Interatrial block as a predictor of atrial fibrillation in patients with ST-segment elevation myocardial infarction. Clin. Cardiol. 2018, 41, 1232–1237. [Google Scholar] [CrossRef] [PubMed]
- Wu, J.T.; Wang, S.L.; Chu, Y.J.; Long, D.Y.; Dong, J.Z.; Fan, X.W.; Yang, H.-T.; Duan, H.-Y.; Yan, L.-J.; Qian, P.; et al. Usefulness of a Combination of Interatrial Block and a High CHADS2 Score to Predict New Onset Atrial Fibrillation. Int. Heart J. 2016, 57, 580–585. [Google Scholar] [CrossRef] [Green Version]
- Magnani, J.W.; Zhu, L.; Lopez, F.; Pencina, M.J.; Agarwal, S.K.; Soliman, E.Z.; Benjamin, E.J.; Alonso, A. P-wave indices and atrial fibrillation: Cross-cohort assessments from the Framingham Heart Study (FHS) and Atherosclerosis Risk in Communities (ARIC) study. Am. Heart J. 2015, 169, 53–61.e1. [Google Scholar] [CrossRef] [Green Version]
- Nielsen, J.B.; Kühl, J.T.; Pietersen, A.; Graff, C.; Lind, B.; Struijk, J.J.; Olesen, M.S.; Sinner, M.F.; Bachmann, T.N.; Haunsø, S.; et al. P-wave duration and the risk of atrial fibrillation: Results from the Copenhagen ECG Study. Heart Rhythm 2015, 12, 1887–1895. [Google Scholar] [CrossRef]
- Francia, P.; Ricotta, A.; Balla, C.; Adduci, C.; Semprini, L.; Frattari, A.; Modestino, A.; Mercanti, F.; Sensini, I.; Caprinozzi, M.; et al. P-wave duration in lead aVR and the risk of atrial fibrillation in hypertension. Ann. Noninvasive Electrocardiol. 2015, 20, 167–174. [Google Scholar] [CrossRef] [PubMed]
- Hayashi, H.; Horie, M. Biphasic P wave in inferior leads and the development of atrial fibrillation. J. Arrhythmia 2015, 31, 376–380. [Google Scholar] [CrossRef] [Green Version]
- Chang, I.C.Y.; Austin, E.; Krishnan, B.; Benditt, D.G.; Quay, C.N.; Ling, L.H.; Chen, L.Y. Shorter minimum p-wave duration is associated with paroxysmal lone atrial fibrillation. J. Electrocardiol. 2014, 47, 106–112. [Google Scholar] [CrossRef] [PubMed]
- Yoshizawa, T.; Niwano, S.; Niwano, H.; Igarashi, T.; Fujiishi, T.; Ishizue, N.; Oikawa, J.; Satoh, A.; Kurokawa, S.; Hatakeyama, Y.; et al. Prediction of new onset atrial fibrillation through P wave analysis in 12 lead ECG. Int. Heart J. 2014, 55, 422–427. [Google Scholar] [CrossRef] [PubMed] [Green Version]
- Girasis, C.; Vassilikos, V.; Efthimiadis, G.K.; Papadopoulou, S.L.; Dakos, G.; Dalamaga, E.G.; Chouvarda, I.; Giannakoulas, G.; Kamperidis, V.; Paraskevaidis, S.; et al. Patients with hypertrophic cardiomyopathy at risk for paroxysmal atrial fibrillation: Advanced echocardiographic evaluation of the left atrium combined with non-invasive P-wave analysis. Eur. Heart J.-Cardiovasc. Imaging 2013, 14, 425–434. [Google Scholar] [CrossRef] [Green Version]
- Dogan, U.; Dogan, E.A.; Tekinalp, M.; Tokgoz, O.S.; Aribas, A.; Akilli, H.; Ozdemir, K.; Gok, H.; Yuruten, B. P-wave dispersion for predicting paroxysmal atrial fibrillation in acute ischemic stroke. Int. J. Med. Sci. 2011, 9, 108–114. [Google Scholar] [CrossRef] [Green Version]
- Magnani, J.W.; Johnson, V.M.; Sullivan, L.M.; Gorodeski, E.Z.; Schnabel, R.B.; Lubitz, S.A.; Levy, D.; Ellinor, P.T.; Benjamin, E.J. P wave duration and risk of longitudinal atrial fibrillation in persons ≥60 years old (from the Framingham Heart Study). Am. J. Cardiol. 2011, 107, 917–921.e1. [Google Scholar] [CrossRef] [Green Version]
- Radeljić, V.; Pavlović, N.; Manola, Š.; Delić-Brkljačić, D.; Pintarić, H.; Petrač, D. Incidence and predictors of asymptomatic atrial fibrillation in patients older than 70 years with complete atrioventricular block and dual chamber pacemaker implantation. Croat. Med. J. 2011, 52, 61–67. [Google Scholar] [CrossRef]
- Macfarlane, P.W.; Murray, H.; Sattar, N.; Stott, D.J.; Ford, I.; Buckley, B.; Jukema, J.W.; Westendorp, R.G.J.; Shepherd, J. The incidence and risk factors for new onset atrial fibrillation in the PROSPER study. Europace 2011, 13, 634–639. [Google Scholar] [CrossRef]
- Soliman, E.Z.; Prineas, R.J.; Case, L.D.; Zhang, Z.M.; Goff, D.C. Ethnic Distribution of ECG Predictors of Atrial Fibrillation and Its Impact on Understanding the Ethnic Distribution of Ischemic Stroke in the Atherosclerosis Risk in Communities (ARIC) Study. Stroke 2009, 40, 1204–1211. [Google Scholar] [CrossRef] [Green Version]
- Perez, M.V.; Dewey, F.E.; Marcus, R.; Ashley, E.A.; Al-Ahmad, A.A.; Wang, P.J.; Froelicher, V.F. Electrocardiographic predictors of atrial fibrillation. Am. Heart J. 2009, 158, 622–628. [Google Scholar] [CrossRef] [PubMed]
- Ariyarajah, V.; Apiyasawat, S.; Fernandes, J.; Kranis, M.; Spodick, D.H. Association of atrial fibrillation in patients with interatrial block over prospectively followed controls with comparable echocardiographic parameters. Am. J. Cardiol. 2007, 99, 390–392. [Google Scholar] [CrossRef]
- Ozdemir, O.; Soylu, M.; Demir, A.D.; Topaloglu, S.; Alyan, O.; Turhan, H.; Bicer, A.; Kutuk, E. P-wave durations as a predictor for atrial fibrillation development in patients with hypertrophic cardiomyopathy. Int. J. Cardiol. 2004, 94, 163–166. [Google Scholar] [CrossRef]
- Aras, D.; Maden, O.; Ozdemir, O.; Aras, S.; Topaloglu, S.; Yetkin, E.; Demir, A.D.; Soylu, M.O.; Erdogan, M.F.; Kisacik, H.L. Simple electrocardiographic markers for the prediction of paroxysmal atrial fibrillation in hyperthyroidism. Int. J. Cardiol. 2005, 99, 59–64. [Google Scholar] [CrossRef] [PubMed]
- Kristensen, L.; Nielsen, J.C.; Mortensen, P.T.; Christensen, P.D.; Vesterlund, T.; Pedersen, A.K.; Andersen, H.R. Sinus and paced P wave duration and dispersion as predictors of atrial fibrillation after pacemaker implantation in patients with isolated sick sinus syndrome. Pacing Clin. Electrophysiol. PACE 2004, 27, 606–614. [Google Scholar] [CrossRef] [PubMed]
- Altunkeser, B.B.; Ozdemir, K.; Gök, H.; Temizhan, A.; Tokaç, M.; Karabağ, T. Can P wave parameters obtained from 12-lead surface electrocardiogram be a predictor for atrial fibrillation in patients who have structural heart disease? Angiology 2003, 54, 475–479. [Google Scholar] [CrossRef] [PubMed]
- Köse, S.; Aytemir, K.; Sade, E.; Can, I.; Ozer, N.; Amasyali, B.; Aksöyek, S.; Ovünç, K.; Ozmen, F.; Atalar, E.; et al. Detection of patients with hypertrophic cardiomyopathy at risk for paroxysmal atrial fibrillation during sinus rhythm by P-wave dispersion. Clin. Cardiol. 2003, 26, 431–434. [Google Scholar] [CrossRef]
- Aytemir, K.; Ozer, N.; Atalar, E.; Sade, E.; Aksöyek, S.; Ovünç, K.; Oto, A.; Ozmen, F.; Kes, S. P wave dispersion on 12-lead electrocardiography in patients with paroxysmal atrial fibrillation. Pacing Clin. Electrophysiol. PACE 2000, 23, 1109–1112. [Google Scholar] [CrossRef]
- Ozer, N.; Aytemir, K.; Atalar, E.; Sade, E.; Aksöyek, S.; Ovünç, K.; Açýl, T.; Nazlý, N.; Ozmen, F.; Oto, A.; et al. P wave dispersion in hypertensive patients with paroxysmal atrial fibrillation. Pacing Clin. Electrophysiol. PACE 2000, 23, 1859–1862. [Google Scholar] [CrossRef]
- Dilaveris, P.E.; Gialafos, E.J.; Sideris, S.K.; Theopistou, A.M.; Andrikopoulos, G.K.; Kyriakidis, M.; Gialafos, J.E.; Toutouzas, P.K. Simple electrocardiographic markers for the prediction of paroxysmal idiopathic atrial fibrillation. Am. Heart J. 1998, 135, 733–738. [Google Scholar] [CrossRef]
- Mendieta, G.; Guasch, E.; Weir, D.; Aristizabal, D.; Escobar-Robledo, L.A.; Llull, L.; Mont, L.; Bayés de Luna, A.; Sitges, M. Advanced interatrial block: A predictor of covert atrial fibrillation in embolic stroke of undetermined source. J. Electrocardiol. 2020, 58, 113–118. [Google Scholar] [CrossRef]
- Boccanelli, A.; Mureddu, G.F.; Cesaroni, G.; Prati, F.; Rangoni, F.; Agabiti, N.; Davoli, M.; Scardovi, A.B.; Latini, R. Predictive value of interatrial block for atrial fibrillation in elderly subjects enrolled in the PREDICTOR study. J. Electrocardiol. 2019, 54, 22–27. [Google Scholar] [CrossRef]
- Alexander, B.; Baranchuk, A.; Haseeb, S.; van Rooy, H.; Kuchtaruk, A.; Hopman, W.; Çinier, G.; Hetu, M.-F.; Li, T.Y.; Johri, A.M. Interatrial block predicts atrial fibrillation in patients with carotid and coronary artery disease. J. Thorac. Dis. 2018, 10, 4328–4334. [Google Scholar] [CrossRef]
- Escobar-Robledo, L.A.; Bayés-de-Luna, A.; Lupón, J.; Baranchuk, A.; Moliner, P.; Martínez-Sellés, M.; Zamora, E.; de Antonio, M.; Domingo, M.; Cediel, G.; et al. Advanced interatrial block predicts new-onset atrial fibrillation and ischemic stroke in patients with heart failure: The “Bayes’ Syndrome-HF” study. Int. J. Cardiol. 2018, 271, 174–180. [Google Scholar] [CrossRef] [PubMed]
- Russo, V.; Papa, A.A.; Rago, A.; Ciardiello, C.; Marano, M.; Proietti, R.; Politano, L.; Nigro, G. Interatrial block to predict atrial fibrillation in myotonic dystrophy type 1. Neuromuscul. Disord. 2018, 28, 327–333. [Google Scholar] [CrossRef] [PubMed]
- Tekkesin, A.I.; Çinier, G.; Cakilli, Y.; Hayıroğlu, M.İ.; Alper, A.T. Interatrial block predicts atrial high rate episodes detected by cardiac implantable electronic devices. J. Electrocardiol. 2017, 50, 234–237. [Google Scholar] [CrossRef] [PubMed]
- O’Neal, W.T.; Zhang, Z.M.; Loehr, L.R.; Chen, L.Y.; Alonso, A.; Soliman, E.Z. Electrocardiographic Advanced Interatrial Block and Atrial Fibrillation Risk in the General Population. Am. J. Cardiol. 2016, 117, 1755–1759. [Google Scholar] [CrossRef] [Green Version]
- Sadiq Ali, F.; Enriquez, A.; Conde, D.; Redfearn, D.; Michael, K.; Simpson, C.; Abdollah, H.; Bayés de Luna, A.; Hopman, W.; Baranchuk, A. Advanced Interatrial Block Predicts New Onset Atrial Fibrillation in Patients with Severe Heart Failure and Cardiac Resynchronization Therapy. Ann. Noninvasive Electrocardiol. 2015, 20, 586–591. [Google Scholar] [CrossRef]
- Bayés de Luna, A.; Cladellas, M.; Oter, R.; Torner, P.; Guindo, J.; Martí, V.; Rivera, I.; Iturralde, P. Interatrial conduction block and retrograde activation of the left atrium and paroxysmal supraventricular tachyarrhythmia. Eur. Heart J. 1988, 9, 1112–1118. [Google Scholar] [CrossRef] [PubMed]
- Öz, A.; Cinar, T.; Klzllto Güler, C.; Efe, S.Ç.; Emre, U.; Karaba, T.; Ayça, B. Novel electrocardiography parameter for paroxysmal atrial fibrillation in acute ischaemic stroke patients: P wave peak time. Postgrad. Med. J. 2020, 96, 584–588. [Google Scholar] [CrossRef]
- Yesin, M.; Kalçık, M.; Çağdaş, M.; Karabağ, Y.; Rencüzoğulları, İ.; Gürsoy, M.O.; Efe, S.Ç.; Karakoyun, S. Fragmented QRS may predict new onset atrial fibrillation in patients with ST-segment elevation myocardial infarction. J. Electrocardiol. 2018, 51, 27–32. [Google Scholar] [CrossRef] [PubMed]
- Rago, A.; Russo, V.; Papa, A.A.; Ciardiello, C.; Pannone, B.; Mayer, M.C.; Cimmino, G.; Nigro, G. The role of the atrial electromechanical delay in predicting atrial fibrillation in beta-thalassemia major patients. J. Interv. Card. Electrophysiol. Int. J. Arrhythmia Pacing 2017, 48, 147–157. [Google Scholar] [CrossRef]
- Tuluce, K.; Yakar Tuluce, S.; Kahya Eren, N.; Kocabas, U.; Akyildiz Akcay, F.; Gunduz, R.; Akyildiz, Z.I.; Ergene, O. Predictors of Future Atrial Fibrillation Development in Patients with Hypertrophic Cardiomyopathy: A Prospective Follow-Up Study. Echocardiography 2016, 33, 379–385. [Google Scholar] [CrossRef]
- Tükek, T.; Yildiz, P.; Akkaya, V.; Karan, M.A.; Atilgan, D.; Yilmaz, V.; Korkut, F. Factors associated with the development of atrial fibrillation in COPD patients: The role of P-wave dispersion. Ann. Noninvasive Electrocardiol. 2002, 7, 222–227. [Google Scholar] [CrossRef]
- Hayashi, H.; Miyamoto, A.; Kawaguchi, T.; Naiki, N.; Xue, J.Q.; Matsumoto, T.; Murakami, Y.; Horie, M. P-pulmonale and the development of atrial fibrillation. Circ. J. Off. J. Jpn. Circ. Soc. 2014, 78, 329–337. [Google Scholar] [CrossRef] [Green Version]
- Chun, K.J.; Hwang, J.K.; Choi, S.R.; Park, S.J.; On, Y.K.; Kim, J.S.; Park, K.-M. Electrocardiogram PR Interval Is a Surrogate Marker to Predict New Occurrence of Atrial Fibrillation in Patients with Frequent Premature Atrial Contractions. J. Korean Med. Sci. 2016, 31, 519–524. [Google Scholar] [CrossRef] [PubMed] [Green Version]
- Chun, K.J.; Hwang, J.K.; Park, S.J.; On, Y.K.; Kim, J.S.; Park, K.M. Electrical PR Interval Variation Predicts New Occurrence of Atrial Fibrillation in Patients with Frequent Premature Atrial Contractions. Medicine 2016, 95, e3249. [Google Scholar] [CrossRef]
- Cabrera, S.; Vallès, E.; Benito, B.; Alcalde, Ó.; Jiménez, J.; Fan, R.; Martí-Almor, J. Simple predictors for new onset atrial fibrillation. Int. J. Cardiol. 2016, 221, 515–520. [Google Scholar] [CrossRef] [PubMed]
- Thijs, V.N.; Brachmann, J.; Morillo, C.A.; Passman, R.S.; Sanna, T.; Bernstein, R.A.; Diener, H.-C.; Di Lazzaro, V.; Rymer, M.M.; Hogge, L.; et al. Predictors for atrial fibrillation detection after cryptogenic stroke. Neurology 2016, 86, 261–269. [Google Scholar] [CrossRef] [Green Version]
- Shulman, E.; Aagaard, P.; Kargoli, F.; Hoch, E.; Zheng, L.; Di Biase, L.; Fisher, J.; Gross, J.; Kim, S.; Ferrick, K.; et al. Validation of PR interval length as a criterion for development of atrial fibrillation in non-Hispanic whites, African Americans and Hispanics. J. Electrocardiol. 2015, 48, 703–709. [Google Scholar] [CrossRef]
- Frontera, A.; Carpenter, A.; Ahmed, N.; Fasiolo, M.; Nelson, M.; Diab, I.; Cripps, T.; Thomas, G.; Duncan, E. Demographic and Clinical Characteristics to Predict Paroxysmal Atrial Fibrillation: Insights from an Implantable Loop Recorder Population. Pacing Clin. Electrophysiol. 2015, 38, 1217–1222. [Google Scholar] [CrossRef]
- Aro, A.L.; Anttonen, O.; Kerola, T.; Junttila, M.J.; Tikkanen, J.T.; Rissanen, H.A.; Reunanen, A.; Huikuri, H.V. Prognostic significance of prolonged PR interval in the general population. Eur. Heart J. 2014, 35, 123–129. [Google Scholar] [CrossRef]
- Knuiman, M.; Briffa, T.; Divitini, M.; Chew, D.; Eikelboom, J.; McQuillan, B.; Hung, J. A cohort study examination of established and emerging risk factors for atrial fibrillation: The Busselton Health Study. Eur. J. Epidemiol. 2014, 29, 181–190. [Google Scholar] [CrossRef] [PubMed] [Green Version]
- Magnani, J.W.; Wang, N.; Nelson, K.P.; Connelly, S.; Deo, R.; Rodondi, N.; Schelbert, E.B.; Garcia, M.E.; Phillips, C.L.; Shlipak, M.G.; et al. Electrocardiographic PR Interval and Adverse Outcomes in Older Adults. Circ. Arrhythmia Electrophysiol. 2013, 6, 84–90. [Google Scholar] [CrossRef] [PubMed] [Green Version]
- Nielsen, J.B.; Pietersen, A.; Graff, C.; Lind, B.; Struijk, J.J.; Olesen, M.S.; Haunsø, S.; Gerds, T.A.; Ellinor, P.T.; Køber, L.; et al. Risk of atrial fibrillation as a function of the electrocardiographic PR interval: Results from the Copenhagen ECG Study. Heart Rhythm 2013, 10, 1249–1256. [Google Scholar] [CrossRef] [PubMed]
- Cheng, S.; Keyes, M.J.; Larson, M.G.; McCabe, E.L.; Newton-Cheh, C.; Levy, D.; Benjamin, E.J.; Vasan, R.S.; Wang, T.J. Long-term outcomes in individuals with prolonged PR interval or first-degree atrioventricular block. JAMA-J. Am. Med. Assoc. 2009, 301, 2571–2577. [Google Scholar] [CrossRef]
- Josephson, M.E.; Kastor, J.A.; Morganroth, J. Electrocardiographic left atrial enlargement electrophysiologic, echocardiographic and hemodynamic correlates. Am. J. Cardiol. 1977, 39, 967–971. [Google Scholar] [CrossRef]
- Bayés de Luna, A.; Martínez-Sellés, M.; Bayés-Genís, A.; Elosua, R.; Baranchuk, A. Surface ECG interatrial block-guided treatment for stroke prevention: Rationale for an attractive hypothesis. BMC Cardiovasc. Disord. 2017, 17, 211. [Google Scholar] [CrossRef] [Green Version]
- Legato, M.J.; Bull, M.B.; Ferrer, M.I. Atrial ultrastructure in patients with fixed intra-atrial block. Chest 1974, 65, 252–261. [Google Scholar] [CrossRef]
- Tse, G.; Wong, C.W.; Gong, M.; Wong, W.T.; Bazoukis, G.; Wong, S.H.; Li, G.; Wu, W.K.K.; Tse, L.A.; Lampropoulos, K.; et al. Predictive value of inter-atrial block for new onset or recurrent atrial fibrillation: A systematic review and meta-analysis. Int. J. Cardiol. 2018, 250, 152–156. [Google Scholar] [CrossRef]
- Okutucu, S.; Aytemir, K.; Oto, A. P-wave dispersion: What we know till now? JRSM Cardiovasc. Dis. 2016, 5, 2048004016639443. [Google Scholar] [CrossRef] [PubMed] [Green Version]
- Pérez-Riera, A.R.; de Abreu, L.C.; Barbosa-Barros, R.; Grindler, J.; Fernandes-Cardoso, A.; Baranchuk, A. P-wave dispersion: An update. Indian Pacing Electrophysiol. J. 2016, 16, 126–133. [Google Scholar] [CrossRef] [PubMed]
- Jaros, R.; Martinek, R.; Danys, L. Comparison of Different Electrocardiography with Vectorcardiography Transformations. Sensors 2019, 19, 3072. [Google Scholar] [CrossRef] [PubMed] [Green Version]
- Holm, H.; Gudbjartsson, D.F.; Arnar, D.O.; Thorleifsson, G.; Thorgeirsson, G.; Stefansdottir, H.; Gudjonsson, S.A.; Jonasdottir, A.; Mathiesen, E.B.; Njølstad, I.; et al. Several common variants modulate heart rate, PR interval and QRS duration. Nat. Genet. 2010, 42, 117–122. [Google Scholar] [CrossRef] [PubMed]
- Cheng, M.; Lu, X.; Huang, J.; Zhang, S.; Gu, D. Electrocardiographic PR prolongation and atrial fibrillation risk: A meta-analysis of prospective cohort studies. J. Cardiovasc. Electrophysiol. 2015, 26, 36–41. [Google Scholar] [CrossRef]
- Li, Y.; Shah, A.J.; Soliman, E.Z. Effect of electrocardiographic p-wave axis on mortality. Am. J. Cardiol. 2014, 113, 372–376. [Google Scholar] [CrossRef]
- Spach, M.S. Mounting evidence that fibrosis generates a major mechanism for atrial fibrillation. Circ. Res. 2007, 101, 743–745. [Google Scholar] [CrossRef] [Green Version]
- Rangel, M.O.; O’Neal, W.T.; Soliman, E.Z. Usefulness of the Electrocardiographic P-Wave Axis as a Predictor of Atrial Fibrillation. Am. J. Cardiol. 2016, 117, 100–104. [Google Scholar] [CrossRef]
- Chattopadhyay, R.K.; Chousou, P.A.; Mukherjee, T.; Pugh, P.J.; Vassiliou, V.S. The predictive value of abnormal P-wave axis for the detection of incident atrial fibrillation: A systematic review with meta-analysis. PLoS ONE 2022, 17, e0278527. [Google Scholar] [CrossRef]
- Dhaliwal, K.K.; Upadhya, B.; Soliman, E.Z.; Beaty, E.H.; Yeboah, J.; Bhave, P.D.; Whalen, S.P.; Singleton, M.J. Association of P-Wave Axis with Incident Atrial Fibrillation in Diabetes Mellitus (from the ACCORD Trial). Am. J. Cardiol. 2020, 128, 191–195. [Google Scholar] [CrossRef]
- Maheshwari, A.; Norby, F.L.; Soliman, E.Z.; Koene, R.; Rooney, M.; O’Neal, W.T.; Alonso, A.; Chen, L.Y. Refining Prediction of Atrial Fibrillation Risk in the General Population with Analysis of P-Wave Axis (from the Atherosclerosis Risk in Communities Study). Am. J. Cardiol. 2017, 120, 1980–1984. [Google Scholar] [CrossRef]
- Goda, T.; Sugiyama, Y.; Ohara, N.; Ikegami, T.; Watanabe, K.; Kobayashi, J.; Takahashi, D. P-Wave Terminal Force in Lead V1 Predicts Paroxysmal Atrial Fibrillation in Acute Ischemic Stroke. J. Stroke Cerebrovasc. Dis. Off. J. Natl. Stroke Assoc. 2017, 26, 1912–1915. [Google Scholar] [CrossRef]
- Sugiyama, Y.; Ohara, N.; Watanabe, K.; Kobayashi, J.; Takahashi, D. Abstract WMP64: Utility of Left Atrial Abnormality on Admission Electrocardiography in Acute Ischemic Stroke. Stroke 2017, 48 (Suppl. S1), AWMP64. [Google Scholar] [CrossRef]
- Rasmussen, M.U.; Kumarathurai, P.; Fabricius-Bjerre, A.; Davidsen, U.; Sajadieh, A. P1723P-wave indices as markers of development of atrial fibrillation in Copenhagen Holter Study. Eur. Heart J. 2017, 38 (Suppl. S1), ehx502.P1723. [Google Scholar] [CrossRef]
- Baturova, M.A.; Sheldon, S.H.; Carlson, J.; Brady, P.A.; Lin, G.; Rabinstein, A.A.; Friedman, P.A.; Platonov, P.G. Electrocardiographic and Echocardiographic predictors of paroxysmal atrial fibrillation detected after ischemic stroke. BMC Cardiovasc. Disord. 2016, 16, 209. [Google Scholar] [CrossRef] [Green Version]
- Kamel, H.; Soliman, E.Z.; Heckbert, S.R.; Kronmal, R.A.; Longstreth, W.T.; Nazarian, S.; Okin, P.M. P-Wave Morphology and the Risk of Incident Ischemic Stroke in the Multi-Ethnic Study of Atherosclerosis. Stroke 2014, 45, 2786–2788. [Google Scholar] [CrossRef] [Green Version]
- Eranti, A.; Aro, A.L.; Kerola, T.; Anttonen, O.; Rissanen, H.A.; Tikkanen, J.T.; Junttila, M.J.; Kenttä, T.V.; Knekt, P.; Huikuri, H.V. Prevalence and prognostic significance of abnormal P terminal force in lead V1 of the ECG in the general population. Circ. Arrhythmia Electrophysiol. 2014, 7, 1116–1121. [Google Scholar] [CrossRef] [Green Version]
- Nishi, K.; Fujimoto, S.; Hisanaga, S.; Ogawa, O.; Kitamura, K. Electrocardiographic assessment of incident atrial fibrillation in hemodialysis patients. Ther. Apher. Dial. 2013, 17, 16–23. [Google Scholar] [CrossRef] [PubMed]
- Lentz, R.; Feinglass, J.; Ma, S.; Akhter, N. Risk factors for the development of atrial fibrillation on ibrutinib treatment. Leuk. Lymphoma 2019, 60, 1447–1453. [Google Scholar] [CrossRef]
- Van Diepen, S.; Siha, H.; Fu, Y.; Westerhout, C.M.; Lopes, R.D.; Granger, C.B.; Armstrong, P.W.; APEX AMI Investigators. Do baseline atrial electrocardiographic and infarction patterns predict new-onset atrial fibrillation after ST-elevation myocardial infarction? Insights from the Assessment of Pexelizumab in Acute Myocardial Infarction Trial. J. Electrocardiol. 2010, 43, 351–358. [Google Scholar] [CrossRef]
- Tse, G.; Lakhani, I.; Zhou, J.; Li, K.H.C.; Lee, S.; Liu, Y.; Leung, K.S.K.; Liu, T.; Baranchuk, A.; Zhang, Q. P-Wave Area Predicts New Onset Atrial Fibrillation in Mitral Stenosis: A Machine Learning Approach. Front. Bioeng. Biotechnol. 2020, 8, 479. [Google Scholar] [CrossRef] [PubMed]
- De Bacquer, D.; Willekens, J.; De Backer, G. Long-term prognostic value of p-wave characteristics for the development of atrial fibrillation in subjects aged 55 to 74 years at baseline. Am. J. Cardiol. 2007, 100, 850–854. [Google Scholar] [CrossRef] [PubMed]
- Poli, S.; Barbaro, V.; Bartolini, P.; Calcagnini, G.; Censi, F. Prediction of atrial fibrillation from surface ECG: Review of methods and algorithms. Ann. Ist. Super Sanita 2003, 39, 195–203. [Google Scholar] [PubMed]
- Huang, Z.; Zheng, Z.; Wu, B.; Tang, L.; Xie, X.; Dong, R.; Luo, Y.; Li, S.; Zhu, J.; Liu, J. Predictive value of P wave terminal force in lead V1 for atrial fibrillation: A meta-analysis. Ann. Noninvasive Electrocardiol. 2020, 25, e12739. [Google Scholar] [CrossRef]
- Jaroszyński, A.; Jaroszyńska, A.; Dąbrowski, W.; Zaborowski, T.; Stepulak, A.; Iłżecki, M.; Zubilewicz, T. Factors influencing P terminal force in lead V1 of the ECG in hemodialysis patients. Arch. Med. Sci. 2018, 14, 257–264. [Google Scholar] [CrossRef] [Green Version]
- Patel, N.; O’Neal, W.T.; Whalen, S.P.; Soliman, E.Z. Electrocardiographic left ventricular hypertrophy predicts atrial fibrillation independent of left ventricular mass. Ann. Noninvasive Electrocardiol. 2017, 22, 1–5. [Google Scholar] [CrossRef]
- Chrispin, J.; Jain, A.; Soliman, E.Z.; Guallar, E.; Alonso, A.; Heckbert, S.R.; Bluemke, D.A.; Lima, J.A.C.; Nazarian, S. Association of electrocardiographic and imaging surrogates of left ventricular hypertrophy with incident atrial fibrillation: MESA (Multi-Ethnic Study of Atherosclerosis). J. Am. Coll Cardiol. 2014, 63, 2007–2013. [Google Scholar] [CrossRef] [Green Version]
- Watanabe, H.; Tanabe, N.; Makiyama, Y.; Chopra, S.S.; Okura, Y.; Suzuki, H.; Matsui, K.; Watanabe, T.; Kurashina, Y.; Aizawa, Y. ST-segment abnormalities and premature complexes are predictors of new-onset atrial fibrillation: The Niigata Preventive Medicine Study. Am. Heart J. 2006, 152, 731–735. [Google Scholar] [CrossRef]
- Patel, N.; O’Neal, W.T.; Whalen, S.P.; Soliman, E.Z. The association of QT interval components with atrial fibrillation. Ann. Noninvasive Electrocardiol. 2018, 23, e12467. [Google Scholar] [CrossRef] [Green Version]
- Nguyen, K.T.; Vittinghoff, E.; Dewland, T.A.; Mandyam, M.C.; Stein, P.K.; Soliman, E.Z.; Heckbert, S.R.; Marcus, G.M. Electrocardiographic Predictors of Incident Atrial Fibrillation. Am. J. Cardiol. 2016, 118, 714–719. [Google Scholar] [CrossRef] [Green Version]
- Hoshino, T.; Nagao, T.; Shiga, T.; Maruyama, K.; Toi, S.; Mizuno, S.; Ishizuka, K.; Shimizu, S.; Uchiyama, S.; Kitagawa, K. Prolonged QTc interval predicts poststroke paroxysmal atrial fibrillation. Stroke 2015, 46, 71–76. [Google Scholar] [CrossRef] [Green Version]
- Baturova, M.A.; Lindgren, A.; Carlson, J.; Shubik, Y.V.; Olsson, S.B.; Platonov, P.G. Predictors of new onset atrial fibrillation during 10-year follow-up after first-ever ischemic stroke. Int. J. Cardiol. 2015, 199, 248–252. [Google Scholar] [CrossRef] [PubMed]
- Mandyam, M.C.; Soliman, E.Z.; Alonso, A.; Dewland, T.A.; Heckbert, S.R.; Vittinghoff, E.; Cummings, S.R.; Ellinor, P.T.; Chaitman, B.R.; Stocke, K.; et al. The QT interval and risk of incident atrial fibrillation. Heart Rhythm 2013, 10, 1562–1568. [Google Scholar] [CrossRef] [Green Version]
- Nielsen, J.B.; Graff, C.; Pietersen, A.; Lind, B.; Struijk, J.J.; Olesen, M.S.; Haunsø, S.; Gerds, T.A.; Svendsen, J.H.; Køber, L.; et al. J-Shaped Association Between QTc Interval Duration and the Risk of Atrial Fibrillation. J. Am. Coll. Cardiol. 2013, 61, 2557–2564. [Google Scholar] [CrossRef] [PubMed] [Green Version]
- Aeschbacher, S.; O’Neal, W.T.; Krisai, P.; Loehr, L.; Chen, L.Y.; Alonso, A.; Soliman, E.Z.; Conen, D. Relationship between QRS duration and incident atrial fibrillation. Int. J. Cardiol. 2018, 266, 84–88. [Google Scholar] [CrossRef]
- El-Chami, M.F.; Brancato, C.; Langberg, J.; Delurgio, D.B.; Bush, H.; Brosius, L.; Leon, A.R. QRS duration is associated with atrial fibrillation in patients with left ventricular dysfunction. Clin. Cardiol. 2010, 33, 132–138. [Google Scholar] [CrossRef]
- Uhm, J.S.; Lee, Y.; Roh, Y.H.; Lee, J.; Kang, D.; Jin, M.N.; Kim, I.S.; Yu, H.T.; Kim, T.H.; Kim, J.Y.; et al. Nonspecific intraventricular conduction delay is associated with future occurrence of atrial fibrillation in patients with structurally normal heart. Eur. J. Intern. Med. 2020, 72, 67–72. [Google Scholar] [CrossRef]
- Jogu, H.R.; O’Neal, W.T.; Broughton, S.T.; Shah, A.J.; Zhang, Z.M.; Soliman, E.Z. Frontal QRS-T Angle and the Risk of Atrial Fibrillation in the Elderly. Ann. Noninvasive Electrocardiol. 2017, 22, e12388. [Google Scholar] [CrossRef] [PubMed]
- Bachmann, T.N.; Skov, M.W.; Rasmussen, P.V.; Graff, C.; Pietersen, A.; Lind, B.; Struijk, J.J.; Olesen, M.S.; Haunsø, S.; Køber, L.; et al. Electrocardiographic Tpeak-Tend interval and risk of cardiovascular morbidity and mortality: Results from the Copenhagen ECG study. Heart Rhythm 2016, 13, 915–924. [Google Scholar] [CrossRef] [PubMed]
- Giustetto, C.; Schimpf, R.; Mazzanti, A.; Scrocco, C.; Maury, P.; Anttonen, O.; Probst, V.; Blanc, J.-J.; Sbragia, P.; Dalmasso, P.; et al. Long-Term Follow-Up of Patients with Short QT Syndrome. J. Am. Coll. Cardiol. 2011, 58, 587–595. [Google Scholar] [CrossRef] [PubMed] [Green Version]
- Johnson, J.N.; Tester, D.J.; Perry, J.; Salisbury, B.A.; Reed, C.R.; Ackerman, M.J. Prevalence of early-onset atrial fibrillation in congenital long QT syndrome. Heart Rhythm 2008, 5, 704–709. [Google Scholar] [CrossRef] [PubMed] [Green Version]
- Kirchhof, P.; Eckardt, L.; Franz, M.R.; Mönnig, G.; Peter, L.; Wedekind, H.; Schulze-Bahr, E.; Breithardt, G.; Haverkamp, W. Prolonged Atrial Action Potential Durations and Polymorphic Atrial Tachyarrhythmias in Patients with Long QT Syndrome. J. Cardiovasc. Electrophysiol. 2003, 14, 1027–1033. [Google Scholar] [CrossRef] [PubMed]
- Demoulin, J.C.; Simar, L.J.; Kulbertus, H.E. Quantitative study of left bundle branch fibrosis in left anterior hemiblock: A stereologic approach. Am. J. Cardiol. 1975, 36, 751–756. [Google Scholar] [CrossRef] [PubMed]
- Pietrasik, G.; Zareba, W. QRS fragmentation: Diagnostic and prognostic significance. Cardiol. J. 2012, 19, 114–121. [Google Scholar] [CrossRef] [PubMed]
- German, D.M.; Kabir, M.M.; Dewland, T.A.; Henrikson, C.A.; Tereshchenko, L.G. Atrial Fibrillation Predictors: Importance of the Electrocardiogram. Ann. Noninvasive Electrocardiol. 2015, 21, 20–29. [Google Scholar] [CrossRef] [Green Version]
- Shah, R.U.; Mukherjee, R.; Zhang, Y.; Jones, A.E.; Springer, J.; Hackett, I.; Steinberg, B.A.; Lloyd-Jones, D.M.; Chapman, W.W. Impact of Different Electronic Cohort Definitions to Identify Patients with Atrial Fibrillation from the Electronic Medical Record. J. Am. Heart Assoc. 2020, 9, e014527. [Google Scholar] [CrossRef]
- Alexander, B.; Milden, J.; Hazim, B.; Haseeb, S.; Bayes-Genis, A.; Elosua, R.; Martínez-Sellés, M.; Yeung, C.; Hopman, W.; Bayes de Luna, A.; et al. New electrocardiographic score for the prediction of atrial fibrillation: The MVP ECG risk score (morphology-voltage-P-wave duration). Ann. Noninvasive Electrocardiol. 2019, 24, e12669. [Google Scholar] [CrossRef] [Green Version]
- Svennberg, E.; Henriksson, P.; Engdahl, J.; Hijazi, Z.; Al-Khalili, F.; Friberg, L.; Frykman, V. N-terminal pro B-type natriuretic peptide in systematic screening for atrial fibrillation. Heart 2017, 103, 1271–1277. [Google Scholar] [CrossRef]
- Alonso, A.; Krijthe, B.P.; Aspelund, T.; Stepas, K.A.; Pencina, M.J.; Moser, C.B.; Sinner, M.F.; Sotoodehnia, N.; Fontes, J.D.; Janssens, A.C.J.W.; et al. Simple Risk Model Predicts Incidence of Atrial Fibrillation in a Racially and Geographically Diverse Population: The CHARGE-AF Consortium. J. Am. Heart Assoc. 2013, 2, e000102. [Google Scholar] [CrossRef] [Green Version]
- Olsen, F.J.; Møgelvang, R.; Jensen, G.B.; Jensen, J.S.; Biering-Sørensen, T. Relationship Between Left Atrial Functional Measures and Incident Atrial Fibrillation in the General Population. JACC Cardiovasc. Imaging 2018, 12, 981–989. [Google Scholar] [CrossRef]
- Attia, Z.I.; Noseworthy, P.A.; Lopez-Jimenez, F.; Asirvatham, S.J.; Deshmukh, A.J.; Gersh, B.J.; Carter, R.E.; Yao, X.; Rabinstein, A.A.; Erickson, B.J.; et al. An artificial intelligence-enabled ECG algorithm for the identification of patients with atrial fibrillation during sinus rhythm: A retrospective analysis of outcome prediction. Lancet 2019, 394, 861–867. [Google Scholar] [CrossRef]
- Hygrell, T.; Viberg, F.; Dahlberg, E.; Charlton, P.H.; Kemp Gudmundsdottir, K.; Mant, J.; Lindman Hörnlund, J.; Svennberg, E. An artificial intelligence–based model for prediction of atrial fibrillation from single-lead sinus rhythm electrocardiograms facilitating screening. Europace 2023, euad036. [Google Scholar] [CrossRef]
- Christopoulos, G.; Graff-Radford, J.; Lopez, C.L.; Yao, X.; Attia, Z.I.; Rabinstein, A.A.; Petersen, R.C.; Knopman, D.S.; Mielke, M.M.; Kremers, W.; et al. Artificial Intelligence–Electrocardiography to Predict Incident Atrial Fibrillation. Circ. Arrhythmia Electrophysiol. 2020, 13, e009355. [Google Scholar] [CrossRef]
- Melzi, P.; Tolosana, R.; Cecconi, A.; Sanz-Garcia, A.; Ortega, G.J.; Jimenez-Borreguero, L.J.; Vera-Rodriguez, R. Analyzing artificial intelligence systems for the prediction of atrial fibrillation from sinus-rhythm ECGs including demographics and feature visualization. Sci. Rep. 2021, 11, 22786. [Google Scholar] [CrossRef]
- Attia, Z.I.; Harmon, D.M.; Dugan, J.; Manka, L.; Lopez-Jimenez, F.; Lerman, A.; Siontis, K.C.; Noseworthy, P.A.; Yao, X.; Klavetter, E.W.; et al. Prospective evaluation of smartwatch-enabled detection of left ventricular dysfunction. Nat. Med. 2022, 28, 2497–2503. [Google Scholar] [CrossRef]
- Sokolow, M.; Lyon, T.P. the ventricular complex in left ventricular hypertrophy as obtained by unipolar precordial and limb leads. Am. Heart J. 1949, 37, 161–186. [Google Scholar] [CrossRef]
- Romhilt, D.W.; Estes, E.H. A point-score system for the ecg diagnosis of left ventricular hypertrophy. Am. Heart J. 1968, 75, 752–758. [Google Scholar] [CrossRef]
- Molloy, T.J.; Okin, P.M.; Devereux, R.B.; Kligfield, P. Electrocardiographic detection of left ventricular hypertrophy by the simple qrs voltage-duration product. J. Am. Coll. Cardiol. 1992, 20, 1180–1186. [Google Scholar] [CrossRef] [Green Version]
- Macfarlane, P.W.; Latif, S. Automated serial ecg comparison based on the minnesota code. J. Electrocardiol. 1996, 29, 29–34. [Google Scholar] [CrossRef]
- Bazzett, H.C. An analysis of the time-relations of the electrocardiograms. Heart 1920, 7, 353–370. [Google Scholar] [CrossRef]
- Hodges, M.S.; Salerno, D.E.D. Bazett’s qt correction reviewed: Evidence that a linear qt correction for heart rate is better. J. Am. Coll. Cardiol 1983, 1, 694. [Google Scholar]
- Sagie, A.; Larson, M.G.; Goldberg, R.J.; Bengtson, J.R.; Levy, D. An improved method for adjusting the qt interval for heart rate (the framingham heart study). Am. J. Cardiol. 1992, 70, 797–801. [Google Scholar] [CrossRef] [PubMed]
- Fredericia, L.S. Die systolendauer im elektrokardiogramm bei normalen menschen und bei herzkranken. Acta Med. Scand. 1920, 53, 469–486. [Google Scholar] [CrossRef]


| Authors, Year | Population (Size) | Study Type | Parameter Definition | Result | AF Detection |
|---|---|---|---|---|---|
| P-wave duration and Partial Interatrial Block (P-IAB) | |||||
| Kreimer et al., 2021 [14] | Patients undergoing ILR for syncope, palpitations, ESUS (366) | Retrospective | Presence of P-IAB (p-wave ≥ 120 ms) | NS in multivariable analysis | ILR AF ≥ 30 s |
| Rasmussen et al., 2020 [15] | General population, 55–75 years (632) | Retrospective | P-wave duration II > 120 ms | HR 1.81 (95% CI 0.95–3.45) | ECG, inpatient monitoring |
| Istolahti et al., 2020 [16] | Finnish adults > 30 years (6354) | Retrospective | Presence of P-IAB (p-wave ≥ 120 ms) | HR 1.39 (95% CI 1.09–1.77) | Medical records (ICD codes) or medications for AF |
| Hellman et al., 2020 [17] | CKD stage 4–5 (165) | Prospective | P-wave duration (lead II) | p = 0.79 | ECG, 24 h Holter |
| Edenborn et al., 2019 [18] | HFpEF (99) | Prospective | Amplified p-wave > 175 ms | HR 9.68 (95% CI 2.61–35.89) | ECG, Holter |
| Acampa et al., 2018 [19] | ESUS (222) | Prospective | P-wave duration (max) | OR 1.01 (95% CI 0.99–1.03) | 7-day ECG monitor |
| Skov et al., 2018 [20] | Primary care patients, 50–90 years (152,759) | Retrospective | Presence of P-IAB (median p-wave ≥ 120 ms) | HR 1.25 (95% CI 1.19–1.30) | Medical records |
| Lehtonen et al., 2018 [21] | Hypertensive (2665) Non-hypertensive (3148) (5813) | Prospective | Presence of P-IAB (p-wave max in any lead ≥ 120 ms) | HR 1.36 (95% CI 1.05–1.76) | ICD codes |
| Roessel et al., 2017 [22] | Italian registry, 25–79 years (240) | Retrospective | P-wave 110–119 ms P-wave 120–129 ms P-wave ≥ 130 ms | OR 5.33 (95% CI 1.74–16.33) OR 5.08 (95% CI 1.73–14.90) OR 5.44 (95% CI 1.95–15.15) Vs p-wave duration < 110 ms | ECG |
| Alexander et al., 2017 [23] | NSTEMI (322) | Retrospective | Presence of P-IAB | p = 0.144 | Medical records |
| Conte et al., 2017 [24] | Patients with AF (36) and healthy control subjects (40) (76) | Retrospective case control | Prolonged p-wave ≥ 125 ms (lead II) | Patients with history of AF had longer p-wave duration (125 ± 18 vs. 110 ± 8 ms, p < 0.001) | ECG, Holter |
| Smith et al., 2017 [25] | ARIC (14,924) | Prospective | Prolonged p-wave (max) > 95th percentile of their distribution | HR 1.48 (95% CI 1.26–1.75) | ECG, medical records, death certificates |
| Cortez et al., 2017 [26] | Ischemic stroke patients from LSR (227) | Prospective | P-wave duration | HR 1.02 (95% CI 0.96–1.05) | ECG |
| Cinier et al., 2016 [27] | STEMI patients (198) | Prospective observational | Presence of P-IAB (p-wave ≥ 120 ms) | OR 5.10 (95% CI 1.46–17.80) | ECG, Holter |
| Wu et al., 2016 [28] | Hospitalized patients (1571) | Prospective | Presence of P-IAB (p-wave ≥ 120 ms) | HR 8.66 (95% CI 5.27–14.23) | Medical records |
| Magnani et al., 2015 [29] | FHS and ARIC participants (113,64) | Prospective | Prolonged p-wave > 120 ms | HR 1.55 (95% CI 1.29–1.85) | ECG, Holter (FHS) ICD codes (ARIC) |
| Nielsen et al., 2015 [30] | Copenhagen ECG study (285,933) | Prospective | P-wave ≤ 89 ms P-wave 112–119 ms P-wave 120–129 ms P-wave ≥ 130 ms | HR 1.60 (95% CI 1.41–1.81) HR 1.22 (95% CI 1.13–1.31) HR 1.50 (95% CI 1.39–1.62) HR 2.06 (95% CI 1.89–2.23) | Medical records |
| Francia et al., 2015 [31] | Hypertensive patients (88) | Retrospective case control | P-wave ≥ 100 ms (lead aVR) | RR 3.70 (95% CI 1.30–10.30) | Case-control study (44 patients with AF and 44 without AF) |
| Hayashi et al., 2015 [32] | Patients with biphasic p-wave in lead II (141) | Retrospective | Duration of the initial portion of p-wave (lead III) ≥ 71 ms | HR 2.90 (95% CI 1.16–7.11) | ECG |
| Chang et al., 2014 [33] | Patients with lone AF (<60 years and no risk factors for AF) (61) and controls without AF (150) (211) | Retrospective case control | Shorter p-wave duration (min) For one tetrile increment (p-wave duration min) For one tetrile increment (p-wave duration max) P-wave duration (min) < 69 ms | OR 0.63 (95% CI 0.42–0.93) OR 0.95 (95% CI 0.63- 1.43) Separated patients with paroxysmal lone AF from healthy controls with a sensitivity of 70%, specificity of 48% | Case-control study (61 patients with AF and 150 without AF) |
| Yoshizawa et al., 2014 [34] | Patient with (68) and without AF (68) (132) | Case control | P-wave duration II P-wave duration V1 | Similar between patients with AF versus those without (87.6 ± 20.4 vs. 86.3 ± 17.5 ms, p = 0.702) Similar between patients with AF versus those without (78.5 ± 24.8 vs. 76.8 ± 16.7 ms, p = 0.628) | ECG |
| Girasis et al., 2013 [35] | HCM with AF (30) and sex- and age-matched controls without AF (32) Sex- and age-matched healthy individuals (25) (62) | Retrospective case control | P-wave duration in Z-lead (orthogonal ECG) | OR 1.08 (95% CI 1.02–1.14) | Case control |
| Dogan et al., 2011 [36] | Acute ischemic stroke (400) | Retrospective | P-wave duration (max) (per 10 ms increase) | OR 1.11 (95% CI 0.68–1.83) | Holter AF ≥ 30 s |
| Magnani et al., 2011 [37] | FHS participants ≥ 60 years (1550) | Prospective | Upper 5% of max p-wave | HR 2.51 (95% CI 1.13–5.57) | ECG |
| Radeljic et al., 2011 [38] | PPM for CHB > 70 years (81) | Prospective | P-wave > 100 ms | OR 16.5 (95% CI 2.97–91.69) | Device EGM AHRE > 5 min |
| Macfarlane et al., 2011 [39] | PROSPER study participants aged 70–82 years (5804) | Prospective | P-wave duration (per 20 ms increase) | HR 1.08 (95% CI 0.96–1.20) | ECG |
| Soliman et al. 2009 [40] | ARIC participants (15,429) | Prospective | Mean p-wave (per 1 SD change) Max p-wave (per 1 SD change) P-wave lead II (per 1 SD change) Mean p-wave (upper 5th percentile) Max p-wave (upper 5th percentile) P-wave lead II (upper 5th percentile) | HR 1.64 (95% CI 1.34–2.00) HR 1.79 (95% CI 1.51–2.14) HR 1.80 (95% CI 1.49–2.20) HR 3.21 (95% CI 1.93–5.31) HR 4.07 (95% CI 2.255–6.51) HR 3.90 (95% CI 2.42–6.27) | ECG |
| Perez et al., 2009 [41] | Patients that had an ECG for usual indications (42,751) | Retrospective | P-wave max > 120 ms | HR 1.60 (95% CI 1.30–1.80) | ECG |
| Ariyarajah et al., 2007 [42] | Patients with comparable echocardiographic parameters (32) | Prospective | Presence of P-IAB (p-wave max ≥ 120 ms) | HR 6.70 (95% CI 1.04–42.8) | Medical records |
| Ozdemir et al., 2005 [43] | HCM Patients with AF (27) and age-matched healthy control subjects (53) (80) | Prospective case control | P-wave max > 134.5 ms | RR 9.9 (95% CI 18.3–521) | ECG, Holter |
| Aras et al., 2005 [44] | Hyperthyroidism (133) | Retrospective case control | P-wave duration (max) | p = 0.03 | Case control |
| Kristensen et al., 2004 [45] | PPM for SND (109) | Retrospective | P-wave duration | NS difference in patients with (107 ± 16) and without AF (105 ± 13) | ECG Device ECG (AHRE with a rate of ≥220 bpm lasting for ≥5 min, mode switching ≥5% of total time recorded or a mode switching episode lasting ≥5 min) |
| Altunkeser et al., 2003 [46] | Patients with structural heart disease and LAD ≤ 5.0 cm with AF (37) and without AF (38) (75) | Case control | P-wave duration (max) P-wave duration (max) ≥ 110 ms | p < 0.05 Separated patients with AF and controls with a sensitivity of 80%, specificity of 52% and positive predictive accuracy of 62% | Case-control study |
| Köse et al., 2003 [47] | HCM patients with AF (22) and without AF (26) (48) | Retrospective case control | P-wave (max) P-wave (min) | 134 ± 11 vs. 128 ± 13 ms, p = 0.06 78 ± 9 vs. 81 ± 7 ms, p = 0.07 | Case-control study |
| Aytemir et al., 2000 [48] | Patients with AF (90) and healthy control subjects (70) (160) | Case control | P-wave (max) > 106 ms | Separated patients with AF and controls with a sensitivity of 83%, specificity of 72% and positive predictive accuracy of 79% | Case-control study |
| Ozer et al., 2000 [49] | Hypertensive patients with AF (44) and without AF (50) (94) | Retrospective case control | P-wave (max) P-wave (min) | NS in multivariable analysis p = 0.60 in univariable analysis | ECG |
| Dilaveris et al., 1998 [50] | Patients with AF (60) and age-matched healthy control subjects (40) (100) | Retrospective case control | P-wave ≥ 110 ms | p < 0.0001 Sensitivity of 88%, specificity of 75%, positive predictive accuracy of 84% | Case-control study |
| Advanced interatrial block (A-IAB): p-wave duration > 120 ms + biphasic inferior p-wave morphology in the inferior leads | |||||
| Kreimer et al., 2021 [14] | Patients undergoing ILR for syncope, palpitations, ESUS (366) | Retrospective | Presence of A-IAB (p-wave duration max in any lead) | HR 5.01 (95% CI 2.64–9.53) | ILR AF ≥30 s |
| Istolahti et al., 2020 [16] | Finnish adults >30 years (6354) | Retrospective | Presence of A-IAB | HR 1.63 (95% CI 1.00–2.65) | Medical records (ICD codes) or medications for AF |
| Hellman et al., 2020 [17] | CKD stage 4–5 (165) | Prospective | Presence of A-IAB (p-wave II ≥ 120 ms and one or more biphasic p-waves in the inferior leads) | p = 0.84 | ECG, 24 h Holter |
| Mendieta et al., 2020 [51] | ESUS (75) | Prospective | Presence of A-IAB | p = 0.042 | Medical records, ECG, Holter |
| Boccanelli et al., 2019 [52] | PREDICTOR study, 65–84 years (1626) | Prospective | Presence of A-IAB or P-IAB | HR 3.05 (95% CI 1.51–6.18) | Medical records (ICD codes) |
| Skov et al., 2018 [20] | Primary care patients, 50–90 years (152,759) | Retrospective | Presence of A-IAB | HR 3.38 (95% CI 2.99–3.81) | Medical records |
| Alexander et al., 2018 [53] | Patients with carotid and coronary disease (355) | Retrospective | Presence of A-IAB or P-IAB | OR 2.40 (95% CI 1.33–4.29) | Medical records, ECG, Holter |
| Escobar-Robledo et al., 2018 [54] | Chronic HF (464) | Prospective observational | Presence of A-IAB | HR 2.71 (95% CI 1.61–4.56) | Medical records |
| Roessel et al., 2017 [22] | Italian Registry 25–79 years (240) | Retrospective | Presence of A-IAB | OR 2.09 (95% CI 0.78–5.64) | ECG |
| Russo et al., 2018 [55] | Myotonic dystrophy type I undergoing PPM (70) | Prospective | Presence of A-IAB or P-IAB | HR 10.76 (95% CI 3.46–33.49) | Device EGM AHRE >200 bpm and lasting >5 min |
| Tekkesin et al., 2017 [56] | PPM for SND (367) | Prospective | Presence of A-IAB or P-IAB | p < 0.01 | Device EGM AHRE >5 min and >220 bpm |
| Alexander et al., 2017 [23] | NSTEMI (322) | Retrospective | Presence of A-IAB or P-IAB | p = 0.021 | Medical records |
| O’Neal et al., 2016 [57] | ARIC (14,625) | Prospective | Presence of A-IAB | HR 3.09 (95% CI 2.51–3.79) | ECG, medical records |
| Ali et al., 2015 [58] | CCF undergoing CRT (97) | Retrospective | Presence of A-IAB | OR 4.13 (95% CI 1.60–10.70) | Device EGM (AHRE ≥ 30 s) |
| Bayes de Luna et al., 1988 [59] | Patients with A-IAB and controls (32) | Prospective | Presence of A-IAB | 93.7% developed paroxysmal supraventricular tachyarrhythmia, p < 0.001 | Holter |
| P-wave index: standard deviation of p-wave durations (across the 12 leads) | |||||
| Perez et al., 2009 [41] | Patients that had an ECG for usual indications (42,751) | Retrospective | P-wave index > 35 ms | HR 1.70 (95% CI 1.30–2.10) | ECG |
| P-wave onset to P-wave peak: time between onset of p-wave to peak of p-wave | |||||
| Oz et al., 2020 [60] | ESUS (90) | Retrospective | P-wave onset to p-wave peak (lead II) P-wave onset to p-wave peak (lead V1) | OR 1.34 (95% CI 1.15–1.56) OR 1.12 (95% CI 1.02–1.22) | ECG, Holter |
| Smith et al., 2017 [25] | ARIC (14,924) | Prospective | Prolonged p-wave onset to p-wave peak (max) > 95th percentile of their distribution | HR 1.57 (95% CI 1.31–1.88) | ECG, medical records |
| P-wave peak to p-wave end—time between peak of p-wave to end of p-wave | |||||
| Smith et al., 2017 [25] | ARIC (14,924) | Prospective | Prolonged p-wave peak to p-wave end (max) > 95th percentile of their distribution | HR 1.20 (95% CI 0.99–1.46) | ECG, medical records |
| P-wave dispersion (PWD): difference between maximal and minimal p-wave durations | |||||
| Acampa et al., 2018 [19] | ESUS (222) | Prospective | PWD (per 10 ms increase) | OR 1.92 (95% CI 1.45–2.55) | 7-day ECG monitor |
| Yesin et al., 2018 [61] | STEMI patients (171) | Prospective | PWD | OR 1.02 (95% CI 1.01–1.03) | Inpatient monitoring |
| Rago et al., 2017 [62] | Beta thalassemia major (80) | Prospective | PWD | HR 1.32 (95% CI 0.76–4.82) | 30-day ELR performed every 6 months for 5 years (AF > 15 s) |
| Tuluce et al., 2016 [63] | HCM (70) | Prospective | PWD PWD ≥ 47.5 ms | OR 1.08 (95% CI 1.01–1.15) Predicted AF with sensitivity of 78% and specificity 72% | ECG, 48-h Holter |
| Chang et al., 2014 [33] | Patients with lone AF (<60 years and no risk factors for AF) (61) and controls without AF (150) (211) | Retrospective case control | PWD For one tertile increment (p-wave duration min) | OR 1.47 (95% CI 0.63–1.43) | Case-control study |
| Yoshizawa et al., 2014 [34] | Patient with (68) and without AF (68) (132) | Retrospective case control | PWD | OR 1.11 (95% CI 10.07–1.17) | ECG |
| Dogan et al., 2011 [36] | Acute ischemic stroke (400) | Retrospective | PWD (per 10 ms increase) PWD > 57.5 ms | OR 2.74 (95% CI 1.48–5.07) Predicted AF with a sensitivity of 80%, specificity of 73%, positive predictive value 74% and negative predictive value 78% | Holter AF ≥ 30 s |
| Perez et al., 2009 [41] | Patients that had an ECG for usual indications (42,751) | Retrospective | PWD > 80 ms | HR 1.95 (95% CI 1.70–2.30) Only when adjusted for age and sex, but not multivariable | ECG |
| Aras et al., 2005 [44] | Hyperthyroidism (133) | Retrospective case control | PWD | p = 0.001 | Case-control study |
| Ozdemir et al., 2005 [43] | HCM Patients with AF (27) and age-matched healthy control subjects (53) (80) | Prospective case control | PWD > 52.5 ms | RR 24 (95% CI 27.6–2251.3) | ECG, Holter |
| Kristensen et al., 2004 [45] | PPM for SND (109) | Retrospective | PWD | NS difference in patients with (67 ± 22) and without AF (64 ± 18) | ECG Device ECG (AHRE with a rate of ≥220 bpm lasting for ≥5 min, mode switching ≥5% of total time recorded or a mode switching episode lasting ≥5 min) |
| Altunkeser et al., 2003 [46] | Patients with structural heart disease and LAD ≤5.0 cm with AF (37) and without AF (38) (75) | Case control | PWD | NS in multivariable analysis | Case-control study |
| Köse et al., 2003 [47] | HCM patients with AF (22) and without AF (26) (48) | Retrospective case control | PWD | 55 ± 6 ms vs. 37 ± 8 ms, p < 0.001 | Case-control study |
| Tükek et al., 2002 [64] | COPD (40) | Retrospective | PWD | OR 1.36 (95% CI 1.01–1.83) | Medical records, Holter |
| Aytemir et al., 2000 [48] | Patients with AF (90) and healthy control subjects (70) (160) | Case control | PWD > 36 ms | Separated patients with AF and controls with a sensitivity of 77%, specificity of 82% and positive predictive accuracy of 85% | Case-control study |
| Ozer et al., 2000 [49] | Hypertensive patients with AF (44) and without AF (50) (94) | Retrospective case control | PWD | <0.001 | ECG |
| Dilaveris et al., 1998 [50] | Patients with AF (60) and age-matched healthy control subjects (40) (100) | Retrospective case control | PWD ≥ 40 ms | p < 0.0001 Sensitivity of 83%, specificity of 85%, positive predictive accuracy 89% | Case-control study |
| P-wave dispersion (PWD)—p-wave duration/Pvm | |||||
| Cortez et al., 2017 [26] | Ischemic stroke patients from LSR (227) | Prospective | PWD | HR 2.02 (95% CI 1.00–1.02) | ECG |
| PQ interval | |||||
| Cortez et al., 2017 [26] | Ischemic stroke patients from LSR (227) | Prospective | PQ interval | HR 1.00 (95% CI 0.99–1.01) | ECG |
| Hayashi et al., 2014 [65] | Patients with p-pulmonale (591) | Retrospective | PQ interval > 150 ms | HR 6.89 (95% CI 2.39–29.15) | ECG |
| PR segment: time between end of p-wave and start of QRS complex (maximum PR interval: maximum p-wave duration) | |||||
| Smith et al., 2017 [25] | ARIC (14,924) | Prospective | Prolonged PR segment 9 max) >95th percentile of their distribution | HR 1.05 (95% CI 0.85–1.29) | ECG, medical records, death certificates |
| Prolonged PR interval | |||||
| Kreimer et al., 2021 [14] | Patients undergoing ILR for syncope, palpitations, ESUS (366) | Retrospective | PR interval | NS in multivariable analysis | ILR AF ≥ 30 s |
| Hellman et al., 2020 [17] | CKD stage 4–5 (165) | Prospective | PR interval (lead II) | p = 0.48 | ECG, 24 h Holter |
| Lehtonen et al., 2018 [21] | Hypertensive (2665) Non-hypertensive (3148) (5813) | Prospective | Prolonged PR interval ≥ 220 ms | HR 1.67 (95% CI 1.16–2.41) | ICD codes |
| Acampa et al., 2018 [19] | ESUS (222) | Prospective | PR interval | OR 1.00 (95% CI 0.99–1.01) | 7-day ECG monitor |
| Conte et al., 2017 [24] | Patients with AF (36) and healthy control subjects (40) (76) | Retrospective case control | PR interval | Similar between patients with and without AF (p = 0.57) | ECG, Holter |
| Smith et al., 2017 [25] | ARIC (14,924) | Prospective | Prolonged PR interval (max) > 200 ms and PR interval >95th percentile of their distribution | HR 1.19 (95% CI 1.02–1.40) | ECG, medical records, death certificates |
| Chun et al., 2016 [66] | Patients with frequent SVEs (>100 SVEs/day) (684) | Retrospective | Prolonged PR interval > 200 ms | HR 1.95 (95% CI 1.03–3.70) | ECG, Holter |
| Chun et al., 2016 [67] | Patients with frequent SVEs (>100 SVEs/day) (207) | Retrospective | Prolonged PR interval > 200 ms PR variation (PR interval max-PR interval min) | HR 3.32 (95% CI 1.06–10.36) HR 1.01 (95% CI 1.00–1.02) | ECG, Holter |
| Cabrera et al., 2016 [68] | Patients undergoing Holter for any cause (299) | Retrospective | Increasing PR interval | HR 1.01 (95% CI 1.00–1.02) | Medical records, ECG, Holter, Device EGM, ILR showing AF lasting ≥30 s |
| Thijs et al., 2016 [69] | ESUS (CRYSTAL AF-ILR arm) (221) | Prospective | Increasing PR interval (per 10 ms increase) | HR 1.30 (95% CI 1.20–1.40) | ILR AF lasting ≥30 s |
| Hayashi et al., 2015 [32] | Patients with biphasic p-wave in lead II (141) | Retrospective | PR interval | PR interval similar between patients with AF versus those without (184.1 ± 40.3 vs. 170.8 ± 44.5 ms, p = 0.15) | ECG |
| Shulman et al., 2015 [70] | African American, Hispanic and non-Hispanic white (50,870) | Retrospective | PR interval (per 10 ms increase) PR interval 196–201 ms (Hispanic and African Americans) PR interval 203–212 ms (non- Hispanic Whites) | HR 1.04 (95% CI 1.03–1.05) HR 1.42 (95% CI 1.09–1.86) HR 1.32 (95% CI 1.07–1.64) | ECG |
| Frontera et al., 2015 [71] | Patients undergoing ILR implant for syncope or palpitations (200) | Retrospective | PR interval | OR 1.14 (95% CI 0.69–1.89) | ILR AF lasting > 30 s |
| Aro et al., 2014 [72] | Individuals 30–59 years old (10,785) | Prospective | Prolonged PR interval (longest in the bipolar limb) > 200 ms | HR 1.03 (95% CI 0.74–1.45) | Medical records, ECG |
| Knuiman et al., 2014 [73] | Busselton Health Study participants (4267) | Prospective | Short PR interval < 120 ms Long PR interval ≥ 220 ms | HR 6.21 (95% CI 1.52–25.31) HR 1.29 (95% CI 0.68–2.44) | ICD codes |
| Magnani et al., 2013 [74] | Health ABC study (2722) | Prospective | Prolonged PR interval (lead II) PR > 200 ms Per 1 SD increase (29 ms) in PR interval | HR 1.26 (95% CI 0.99–1.61) HR 1.13 (95% CI 1.04–1.23) | ICD codes |
| Nielsen et al., 2013 [75] | Copenhagen ECG study (288,181) | Retrospective | Prolonged PR interval (distance between the earliest detection of atrial and ventricular depolarization in any lead) (median from 12 leads) PR interval ≥ 196 ms women PR interval ≥ 204 ms men Shorter PR interval (median from 12 leads) PR interval ≤ 121 ms women PR interval ≤ 129 ms men | HR 1.18 (95% CI 1.06–1.30) HR 1.30 (95% CI 1.17–1.44) HR 1.32 (95% CI 1.12–1.56) HR 1.09 (95% CI 0.92–1.29) | Medical records |
| Macfarlane et al., 2011 [39] | PROSPER study, 70–82 year old participants (5804) | Prospective | PR prolongation (per 30 ms increase) | HR 1.29 (95% CI 1.29–1.41) | ECG |
| Soliman et al., 2009 [40] | ARIC participants (15,429) | Prospective | PR duration (per 1 SD change) PR duration (upper 5th percentile) (mean p-wave duration + mean PR segment duration) | HR 1.41 (1.20–1.65) HR 1.59 (0.77–3.30) | ECG |
| Perez et al., 2009 [41] | Patients that had an ECG for usual indications (42,751) | Retrospective | Prolonged PR interval > 200 ms | HR 1.30 (95% CI 1.10–1.60) | ECG |
| Cheng et al., 2009 [76] | FHS participants (7575) | Prospective | Prolonged PR interval > 200 ms (lead II) | HR 2.06 (95% CI 1.36–3.12) | Medical records, ECG |
Disclaimer/Publisher’s Note: The statements, opinions and data contained in all publications are solely those of the individual author(s) and contributor(s) and not of MDPI and/or the editor(s). MDPI and/or the editor(s) disclaim responsibility for any injury to people or property resulting from any ideas, methods, instructions or products referred to in the content. |
© 2023 by the authors. Licensee MDPI, Basel, Switzerland. This article is an open access article distributed under the terms and conditions of the Creative Commons Attribution (CC BY) license (https://creativecommons.org/licenses/by/4.0/).
Share and Cite
Chousou, P.A.; Chattopadhyay, R.; Tsampasian, V.; Vassiliou, V.S.; Pugh, P.J. Electrocardiographic Predictors of Atrial Fibrillation. Med. Sci. 2023, 11, 30. https://doi.org/10.3390/medsci11020030
Chousou PA, Chattopadhyay R, Tsampasian V, Vassiliou VS, Pugh PJ. Electrocardiographic Predictors of Atrial Fibrillation. Medical Sciences. 2023; 11(2):30. https://doi.org/10.3390/medsci11020030
Chicago/Turabian StyleChousou, Panagiota Anna, Rahul Chattopadhyay, Vasiliki Tsampasian, Vassilios S. Vassiliou, and Peter John Pugh. 2023. "Electrocardiographic Predictors of Atrial Fibrillation" Medical Sciences 11, no. 2: 30. https://doi.org/10.3390/medsci11020030