


Distribution and Morphometry of Thermocirques in the North of West Siberia, Russia

Abstract
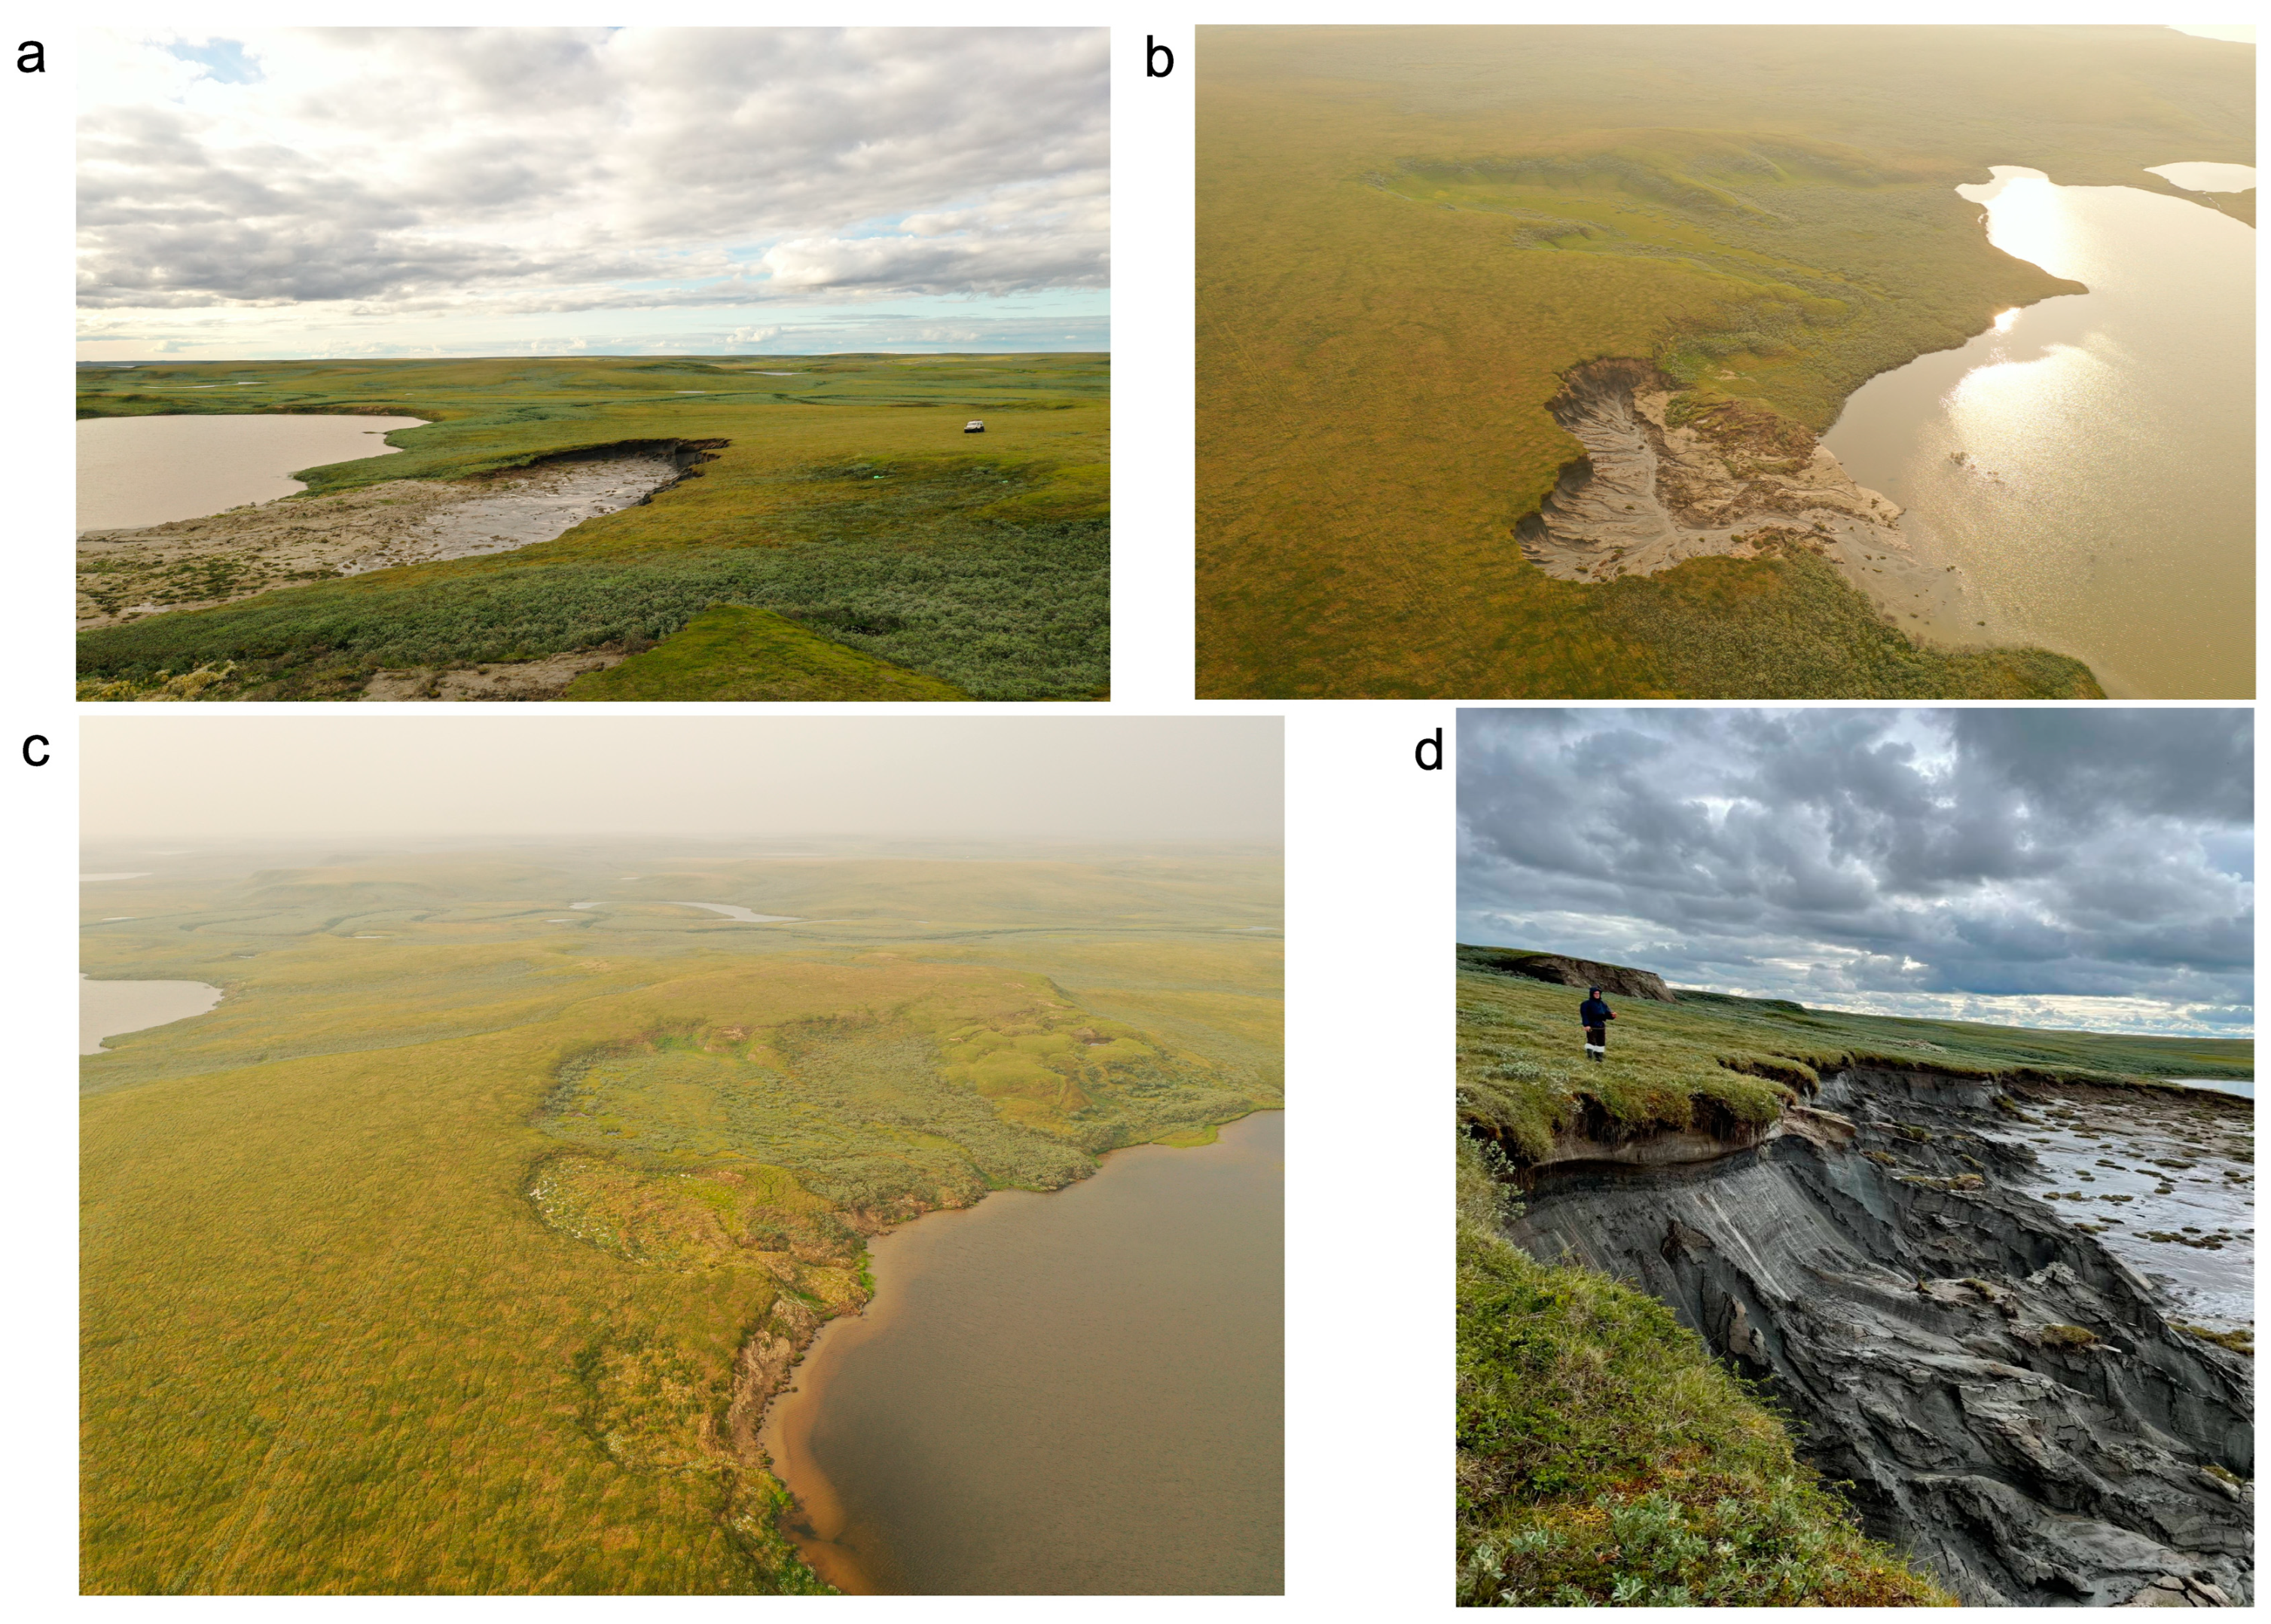
:1. Introduction
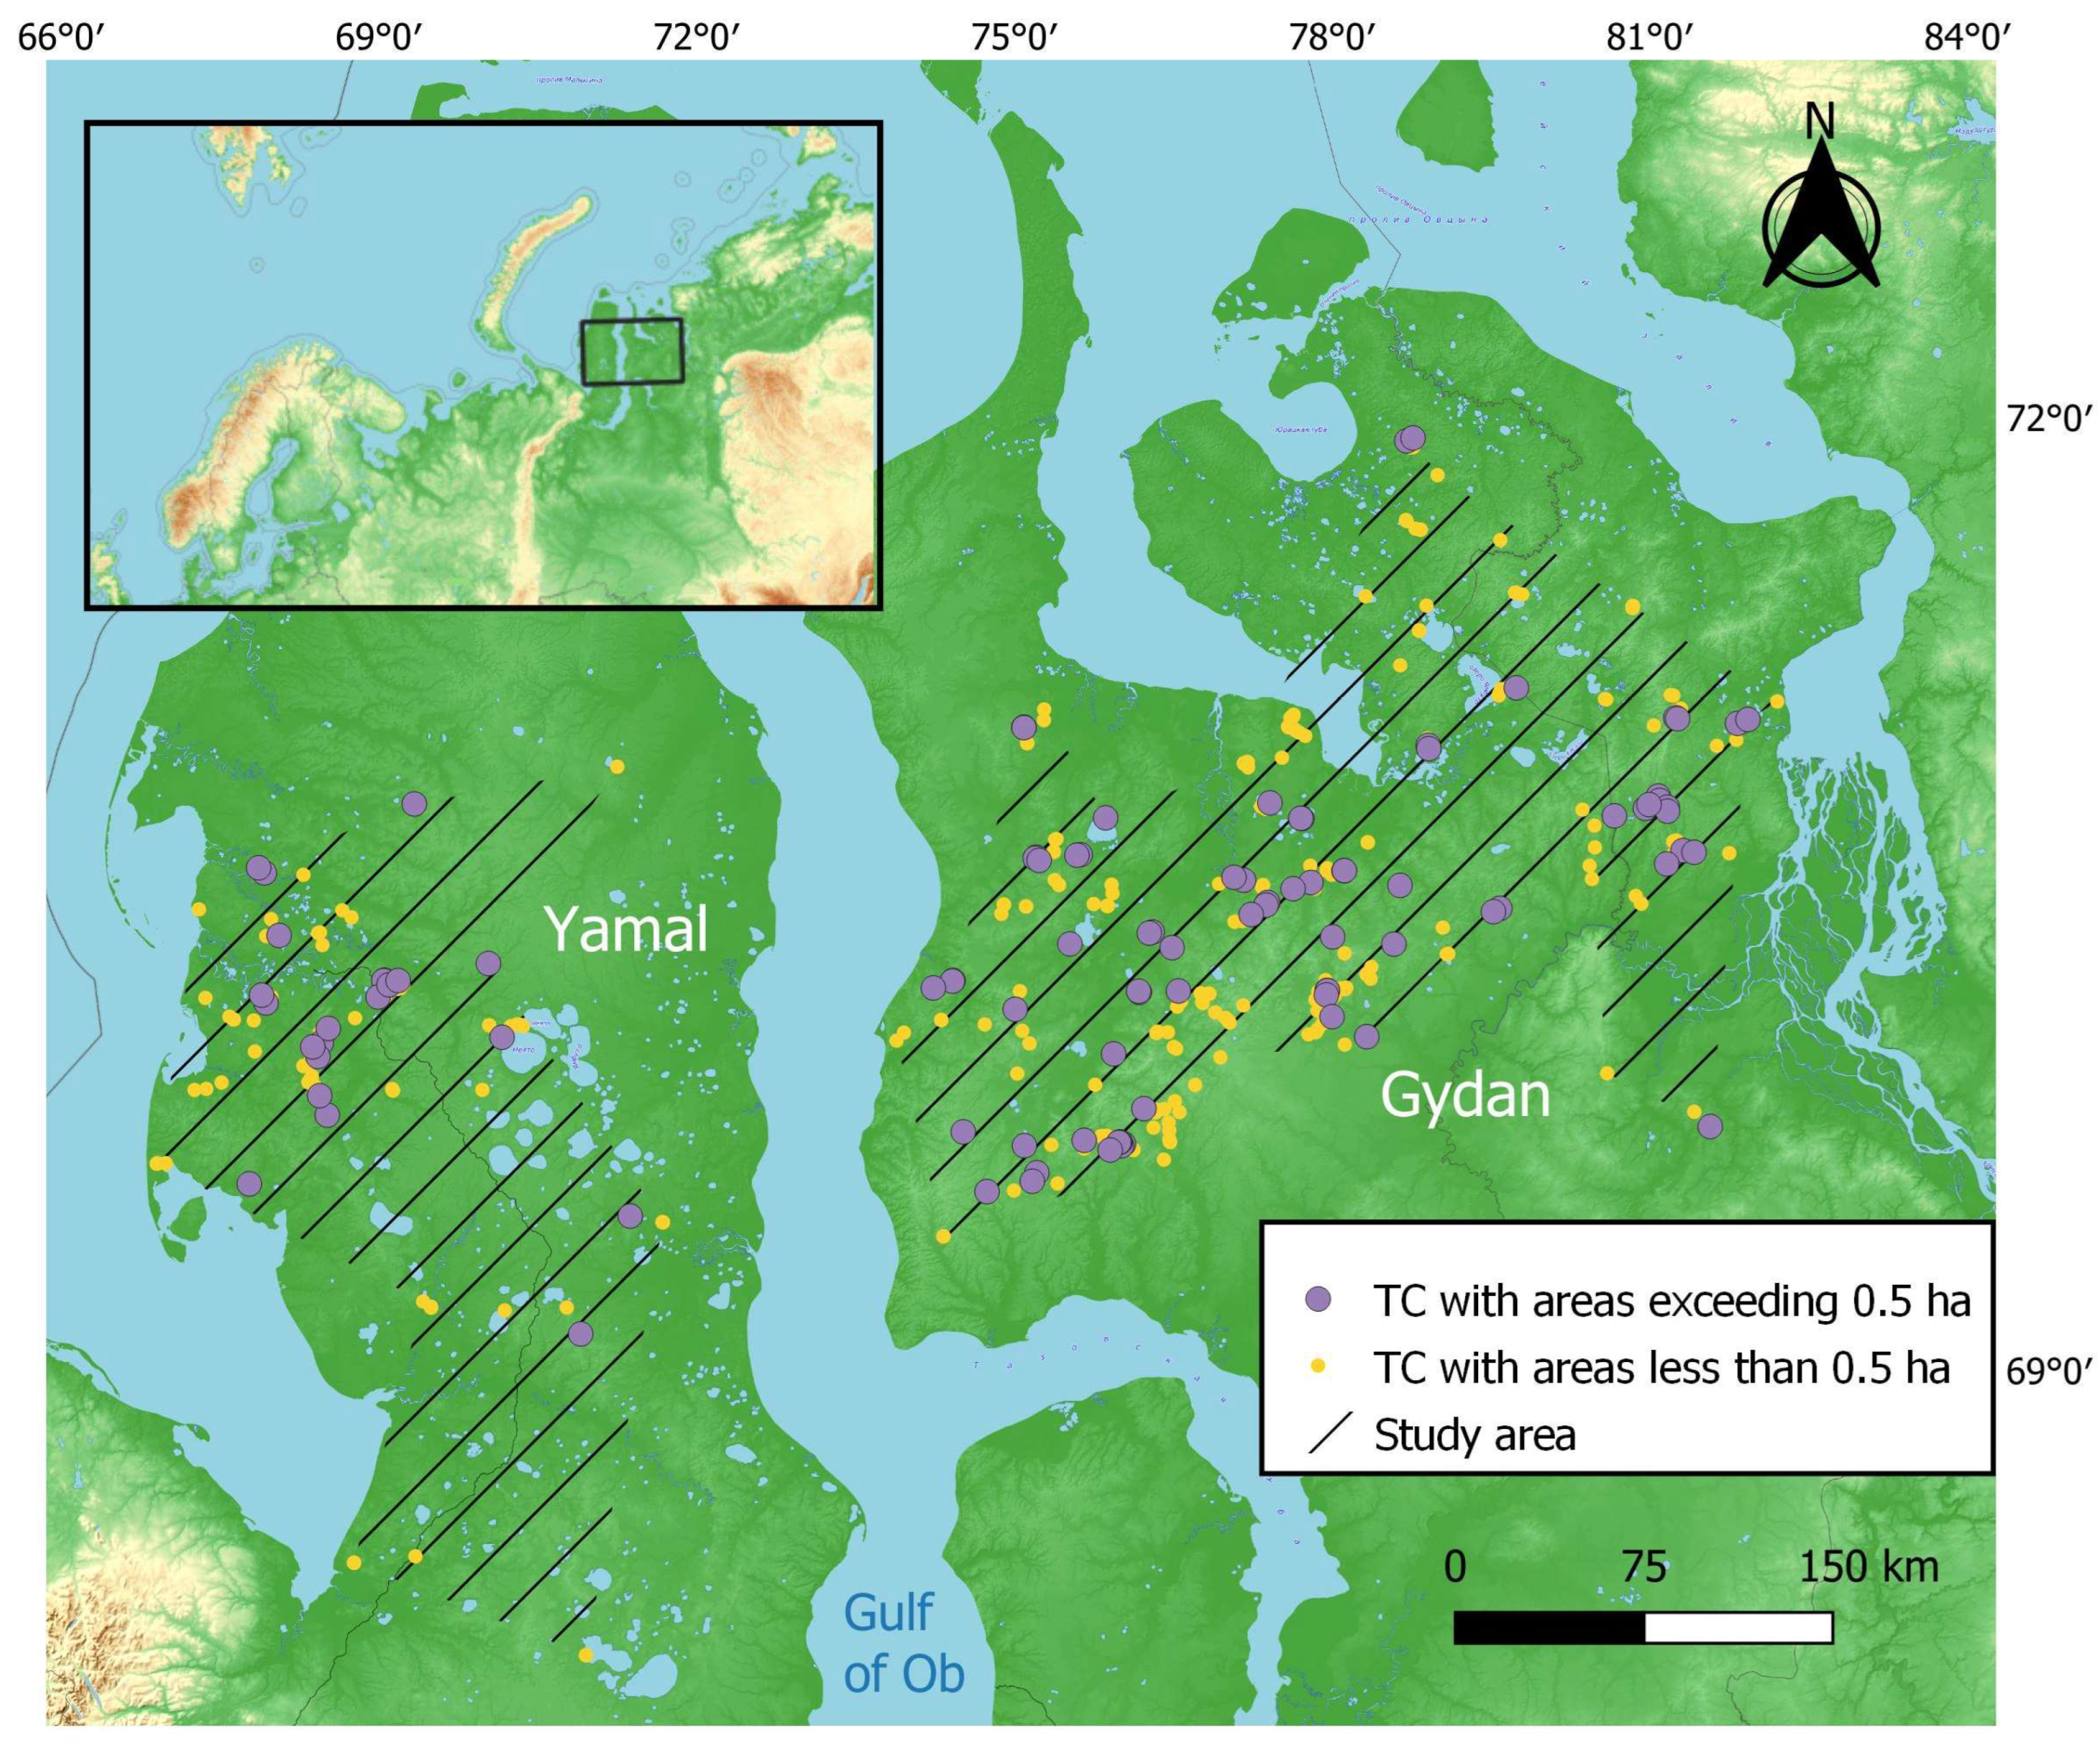
2. Study Area and Methods
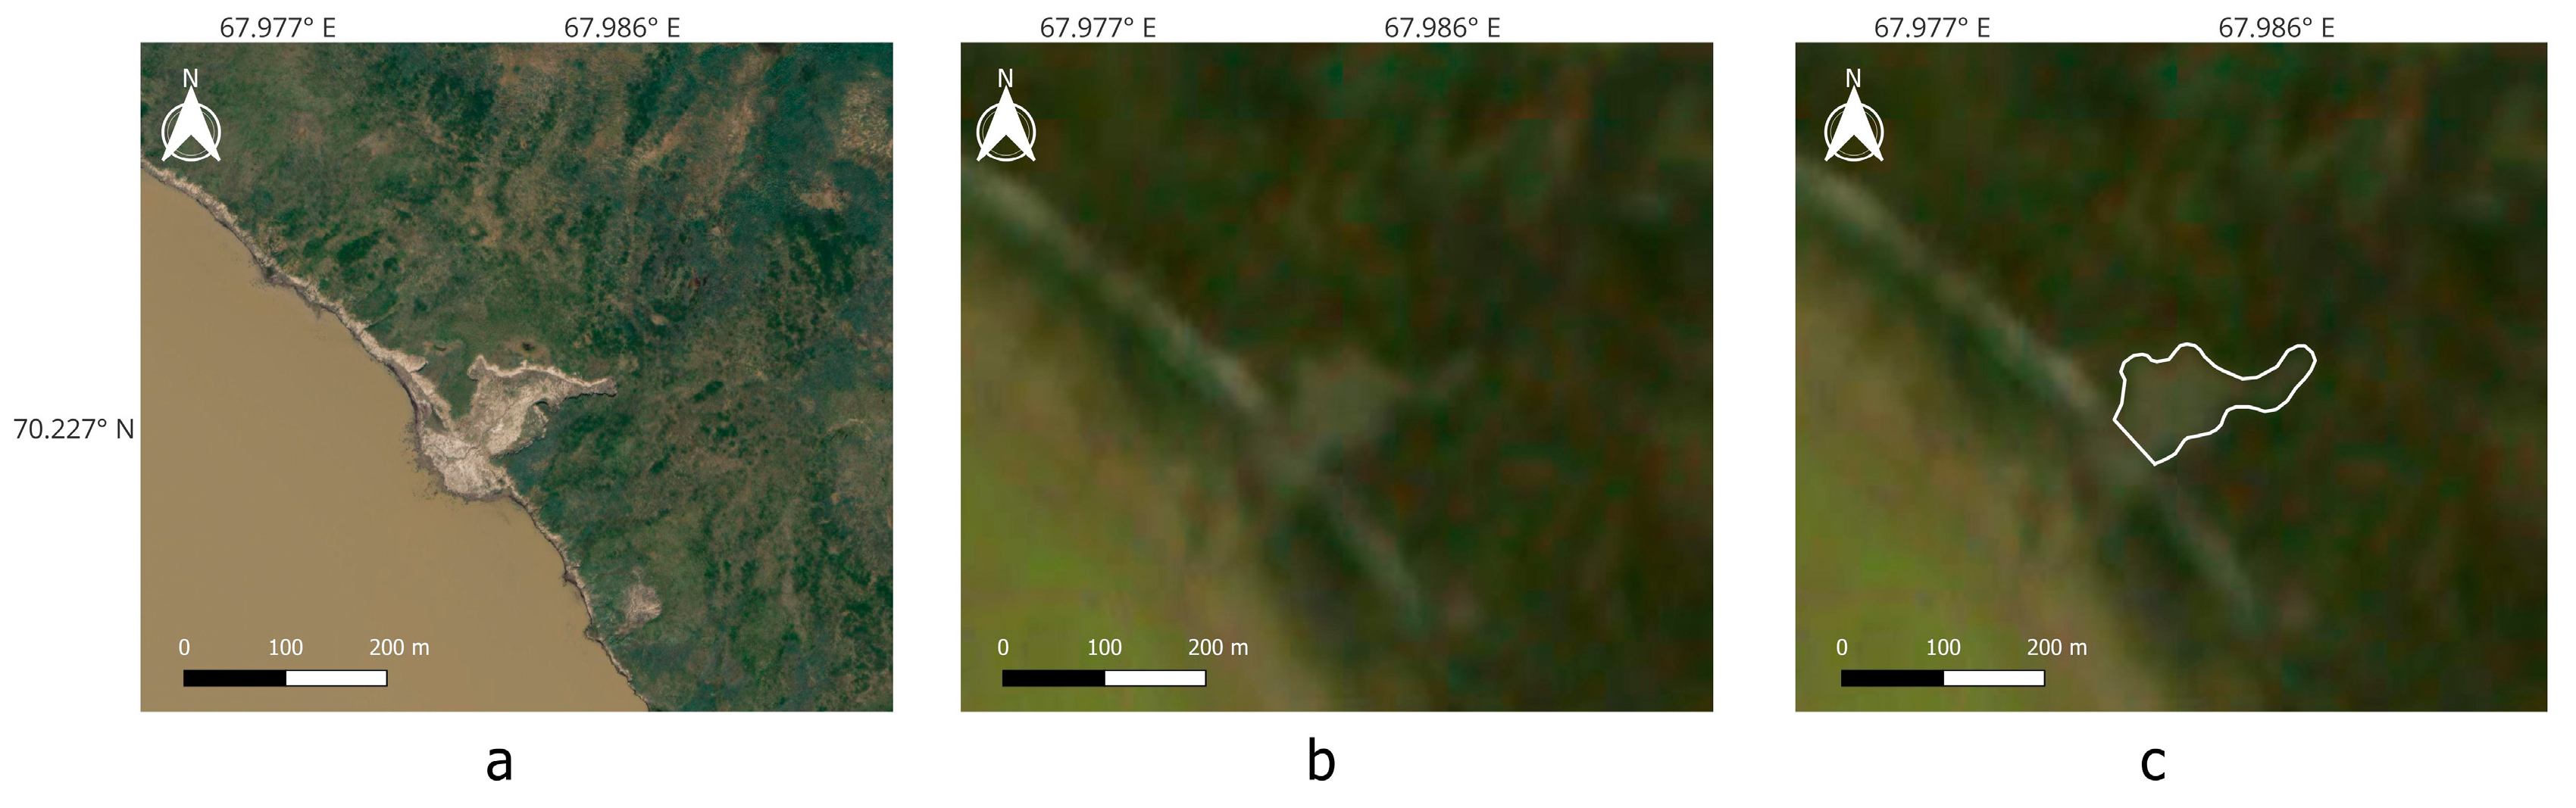
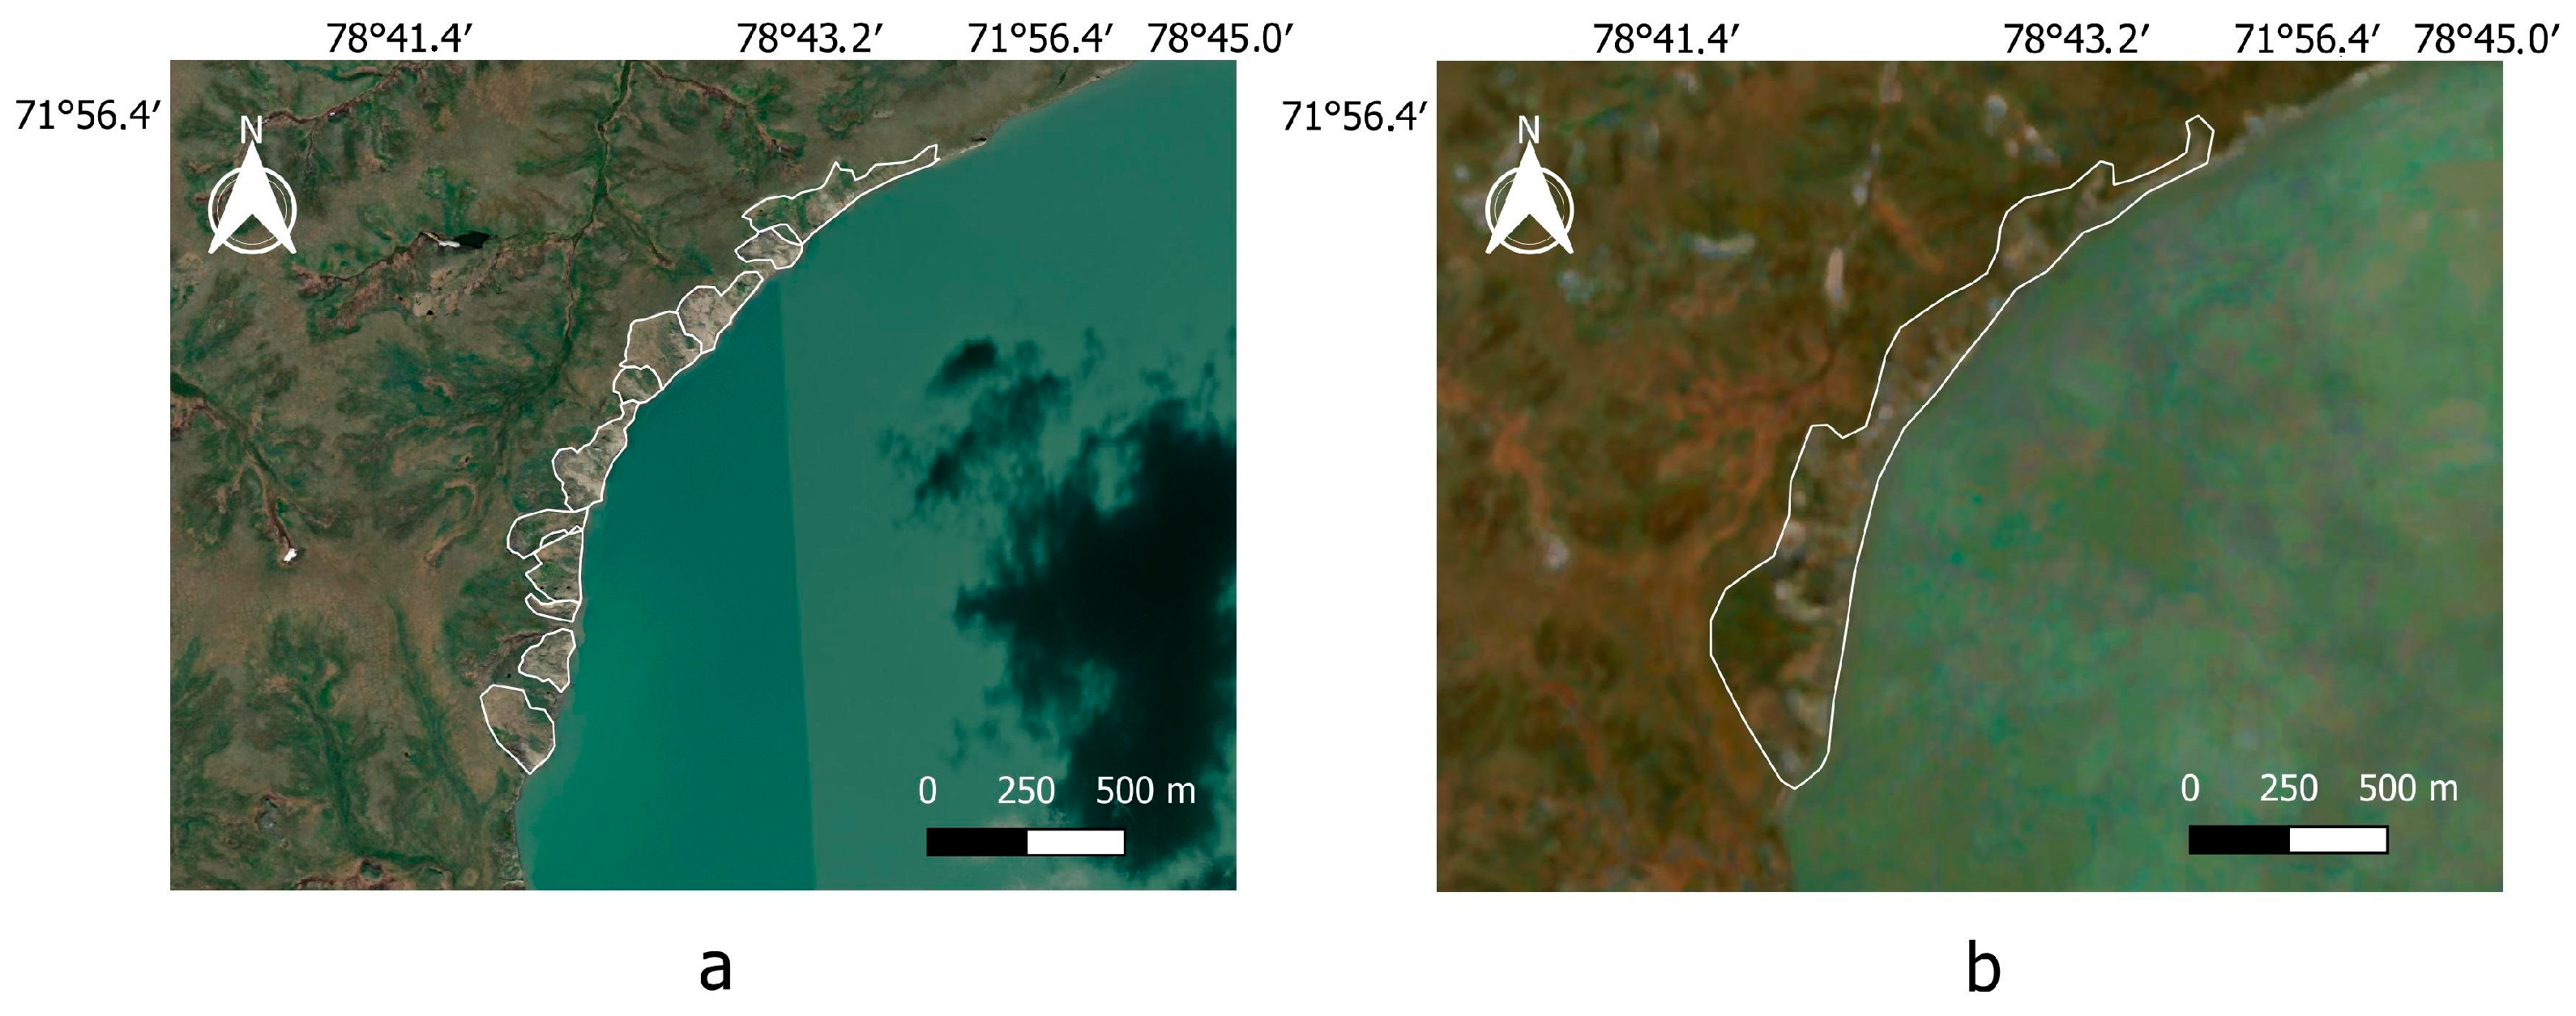
2.1. Manual Digitization of TC Polygons
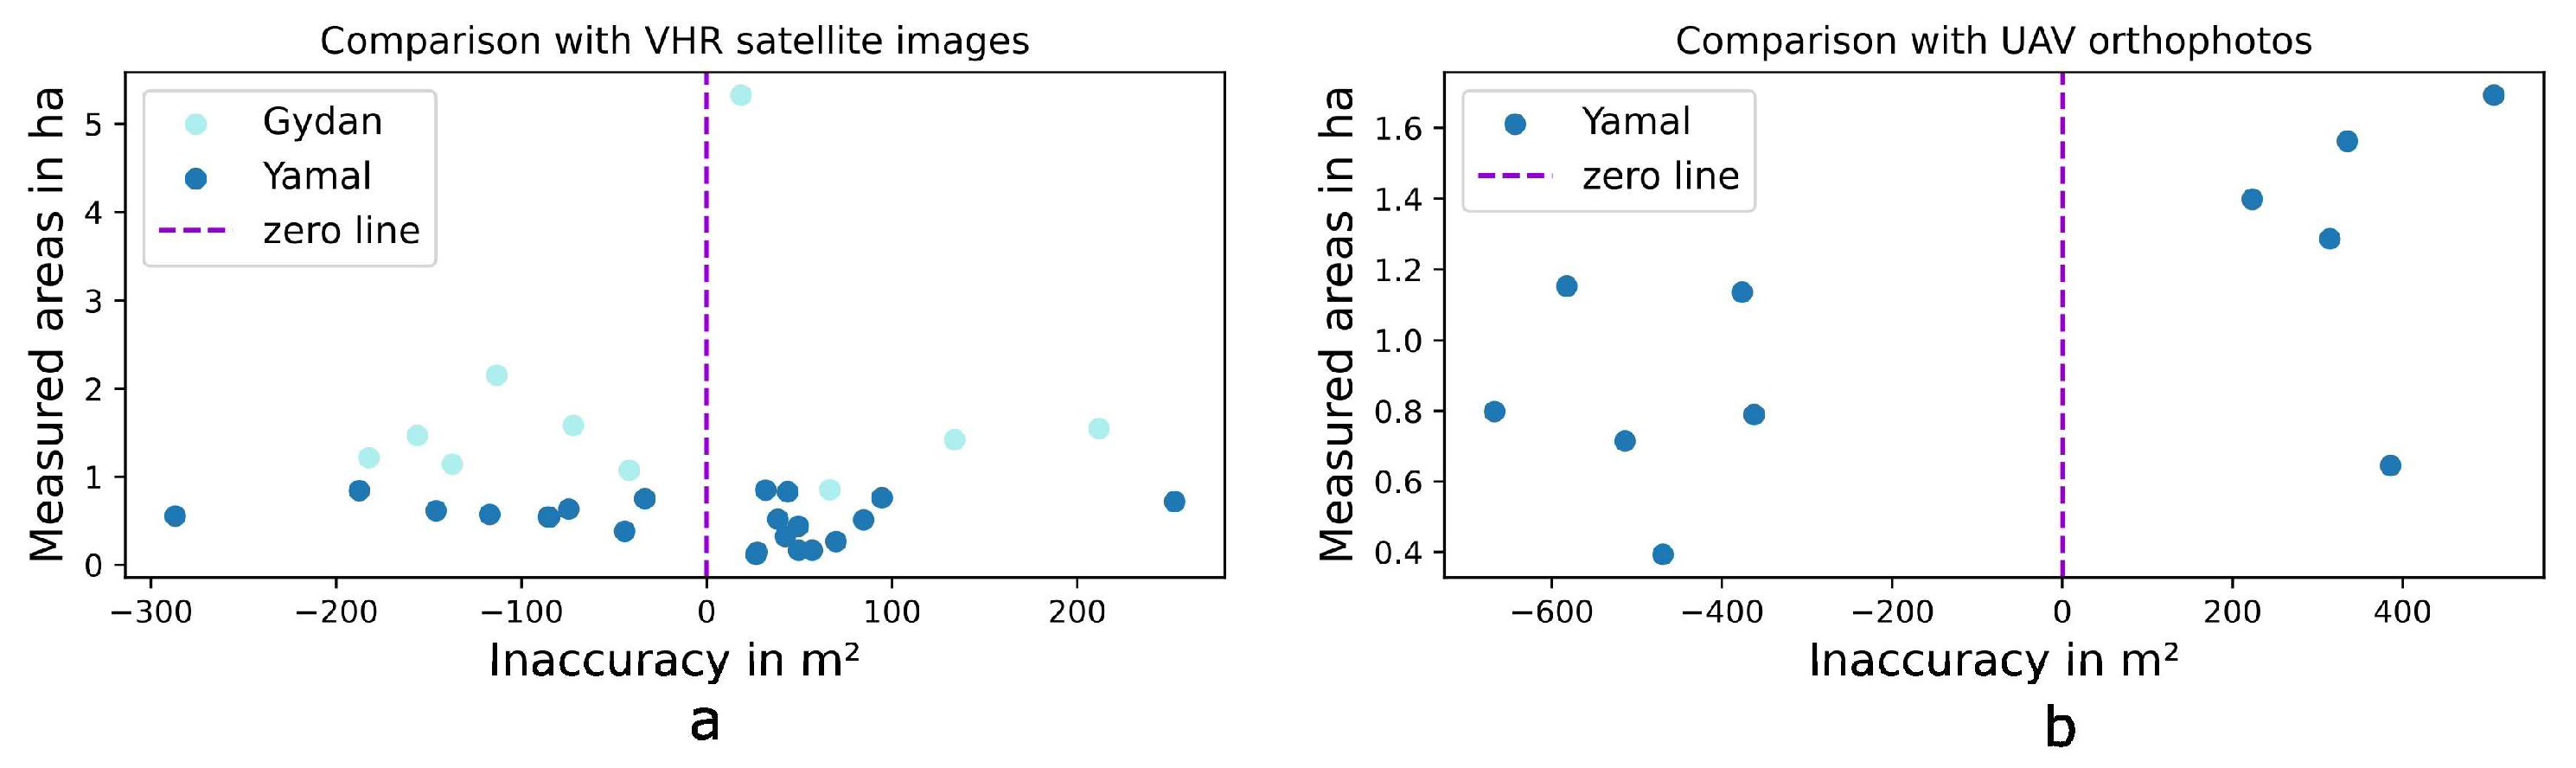
2.2. Accuracy Analysis
2.3. Software
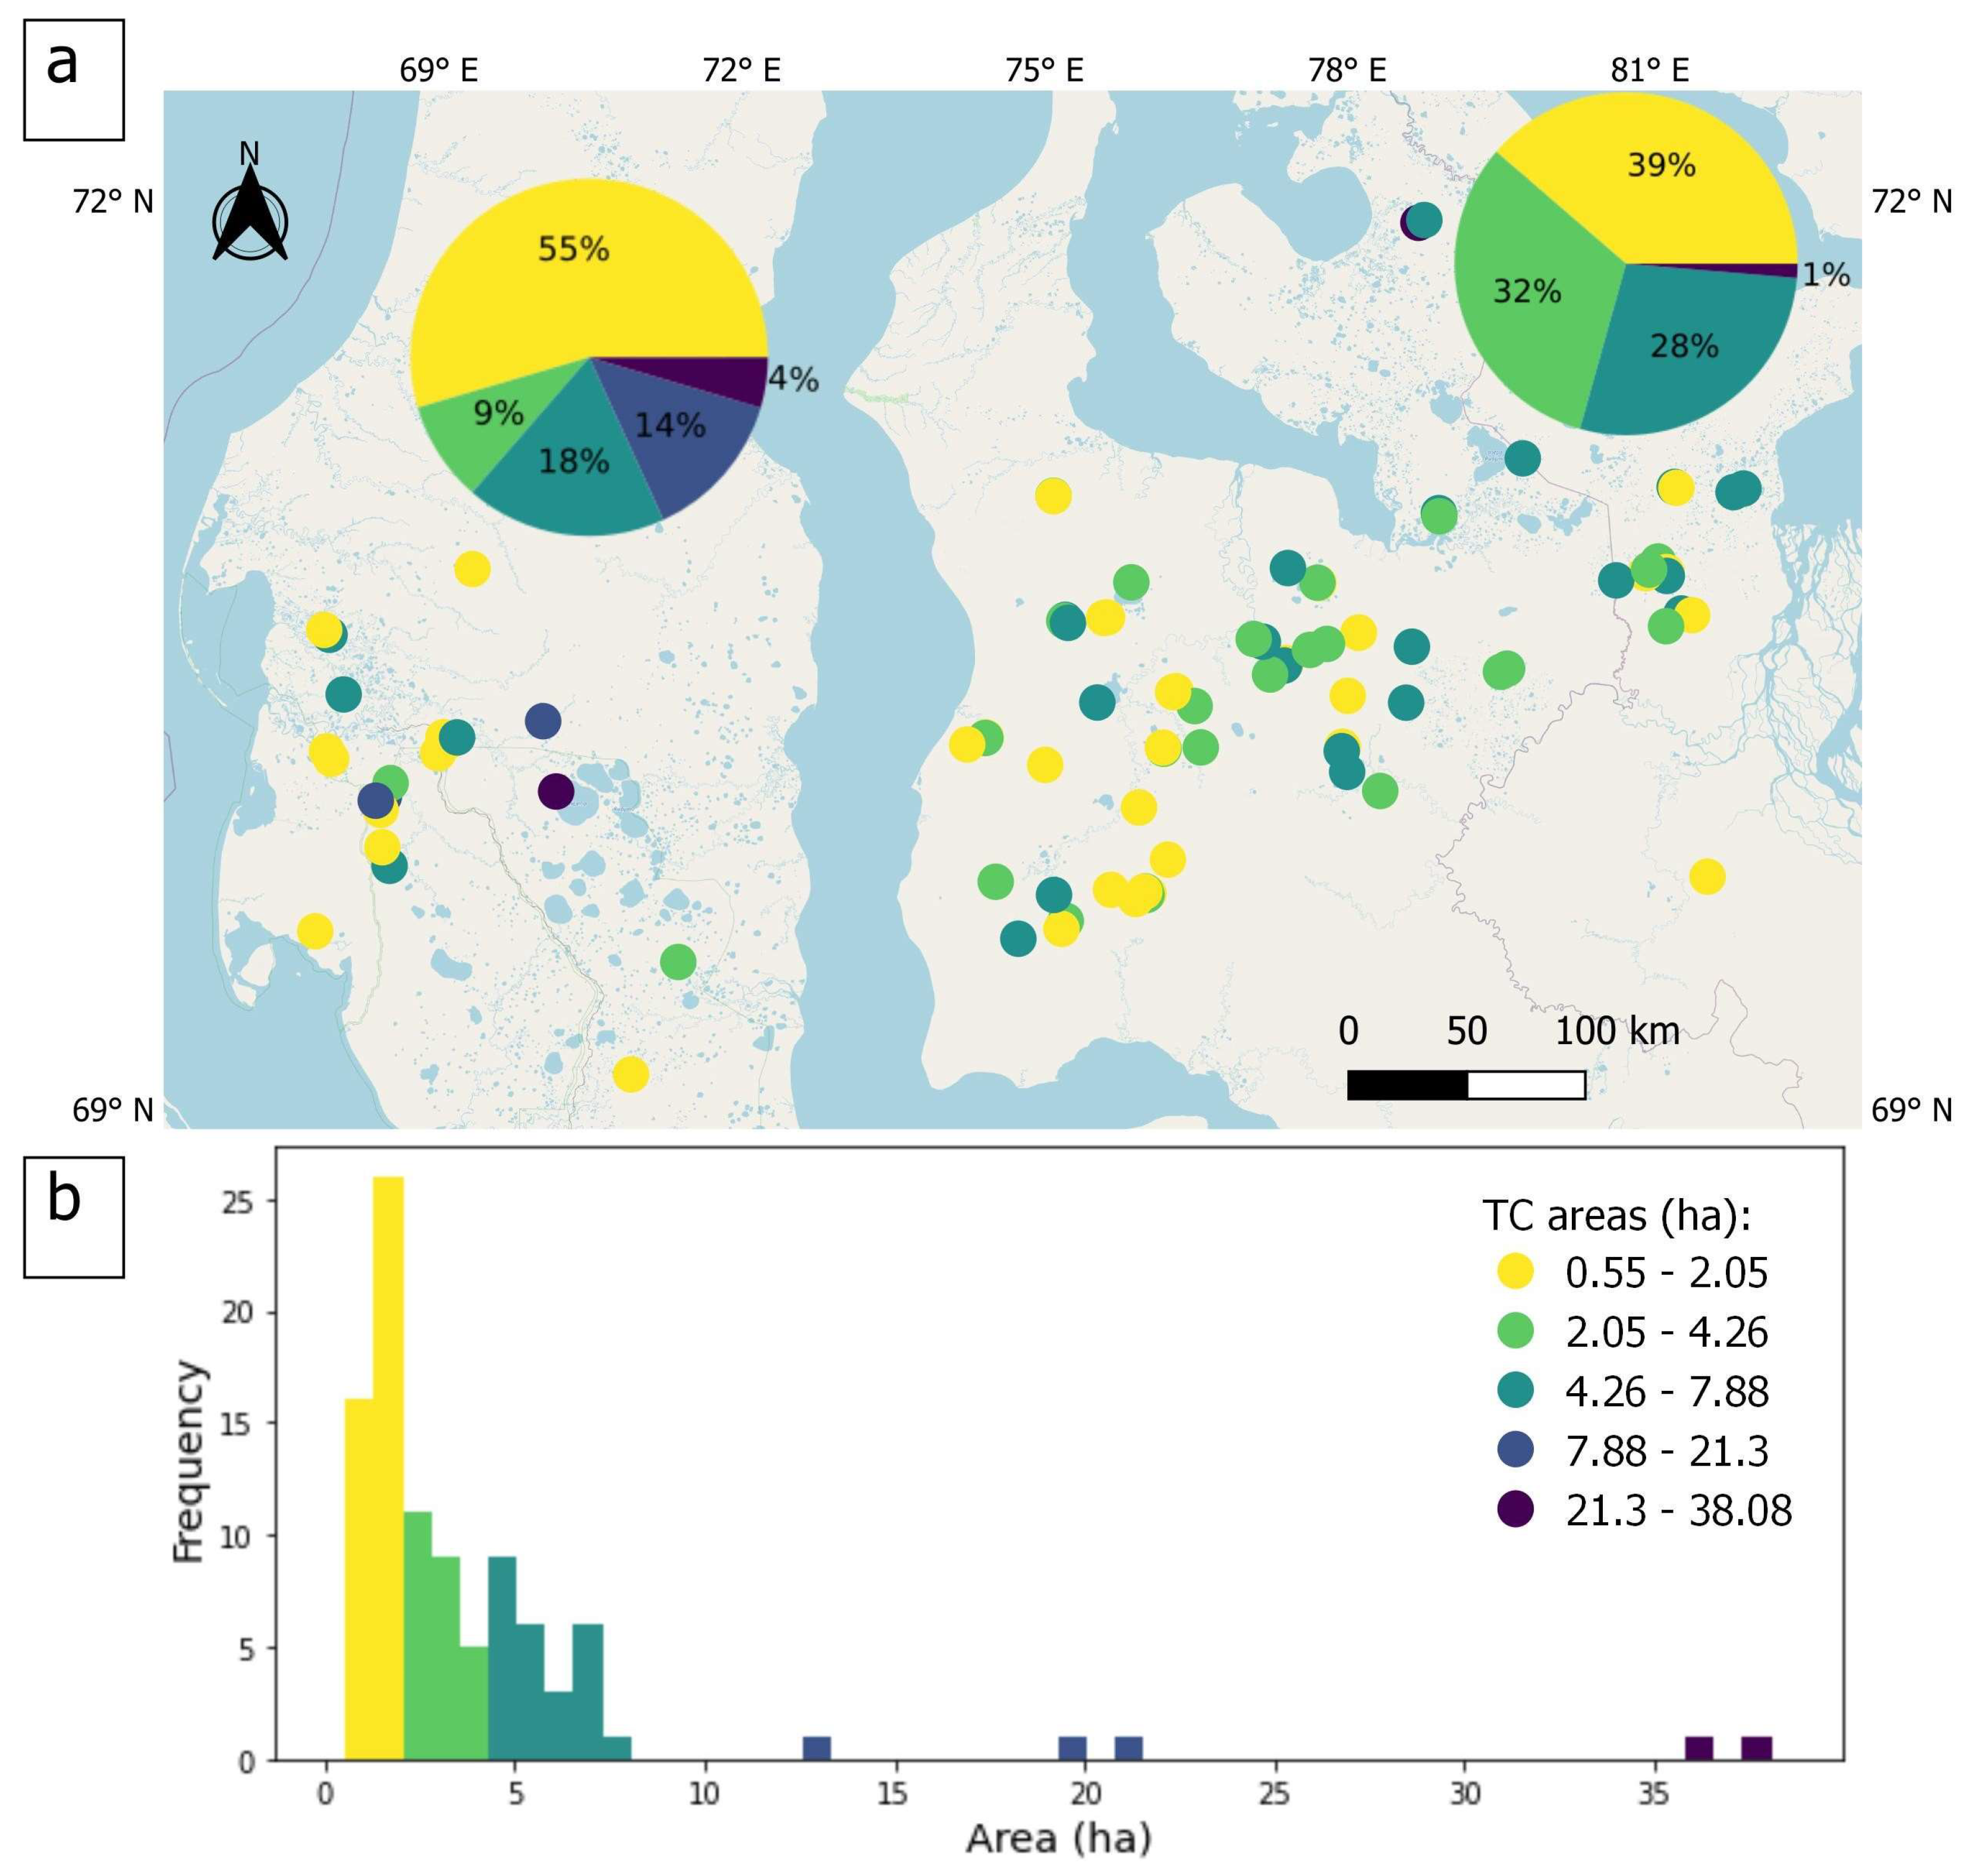
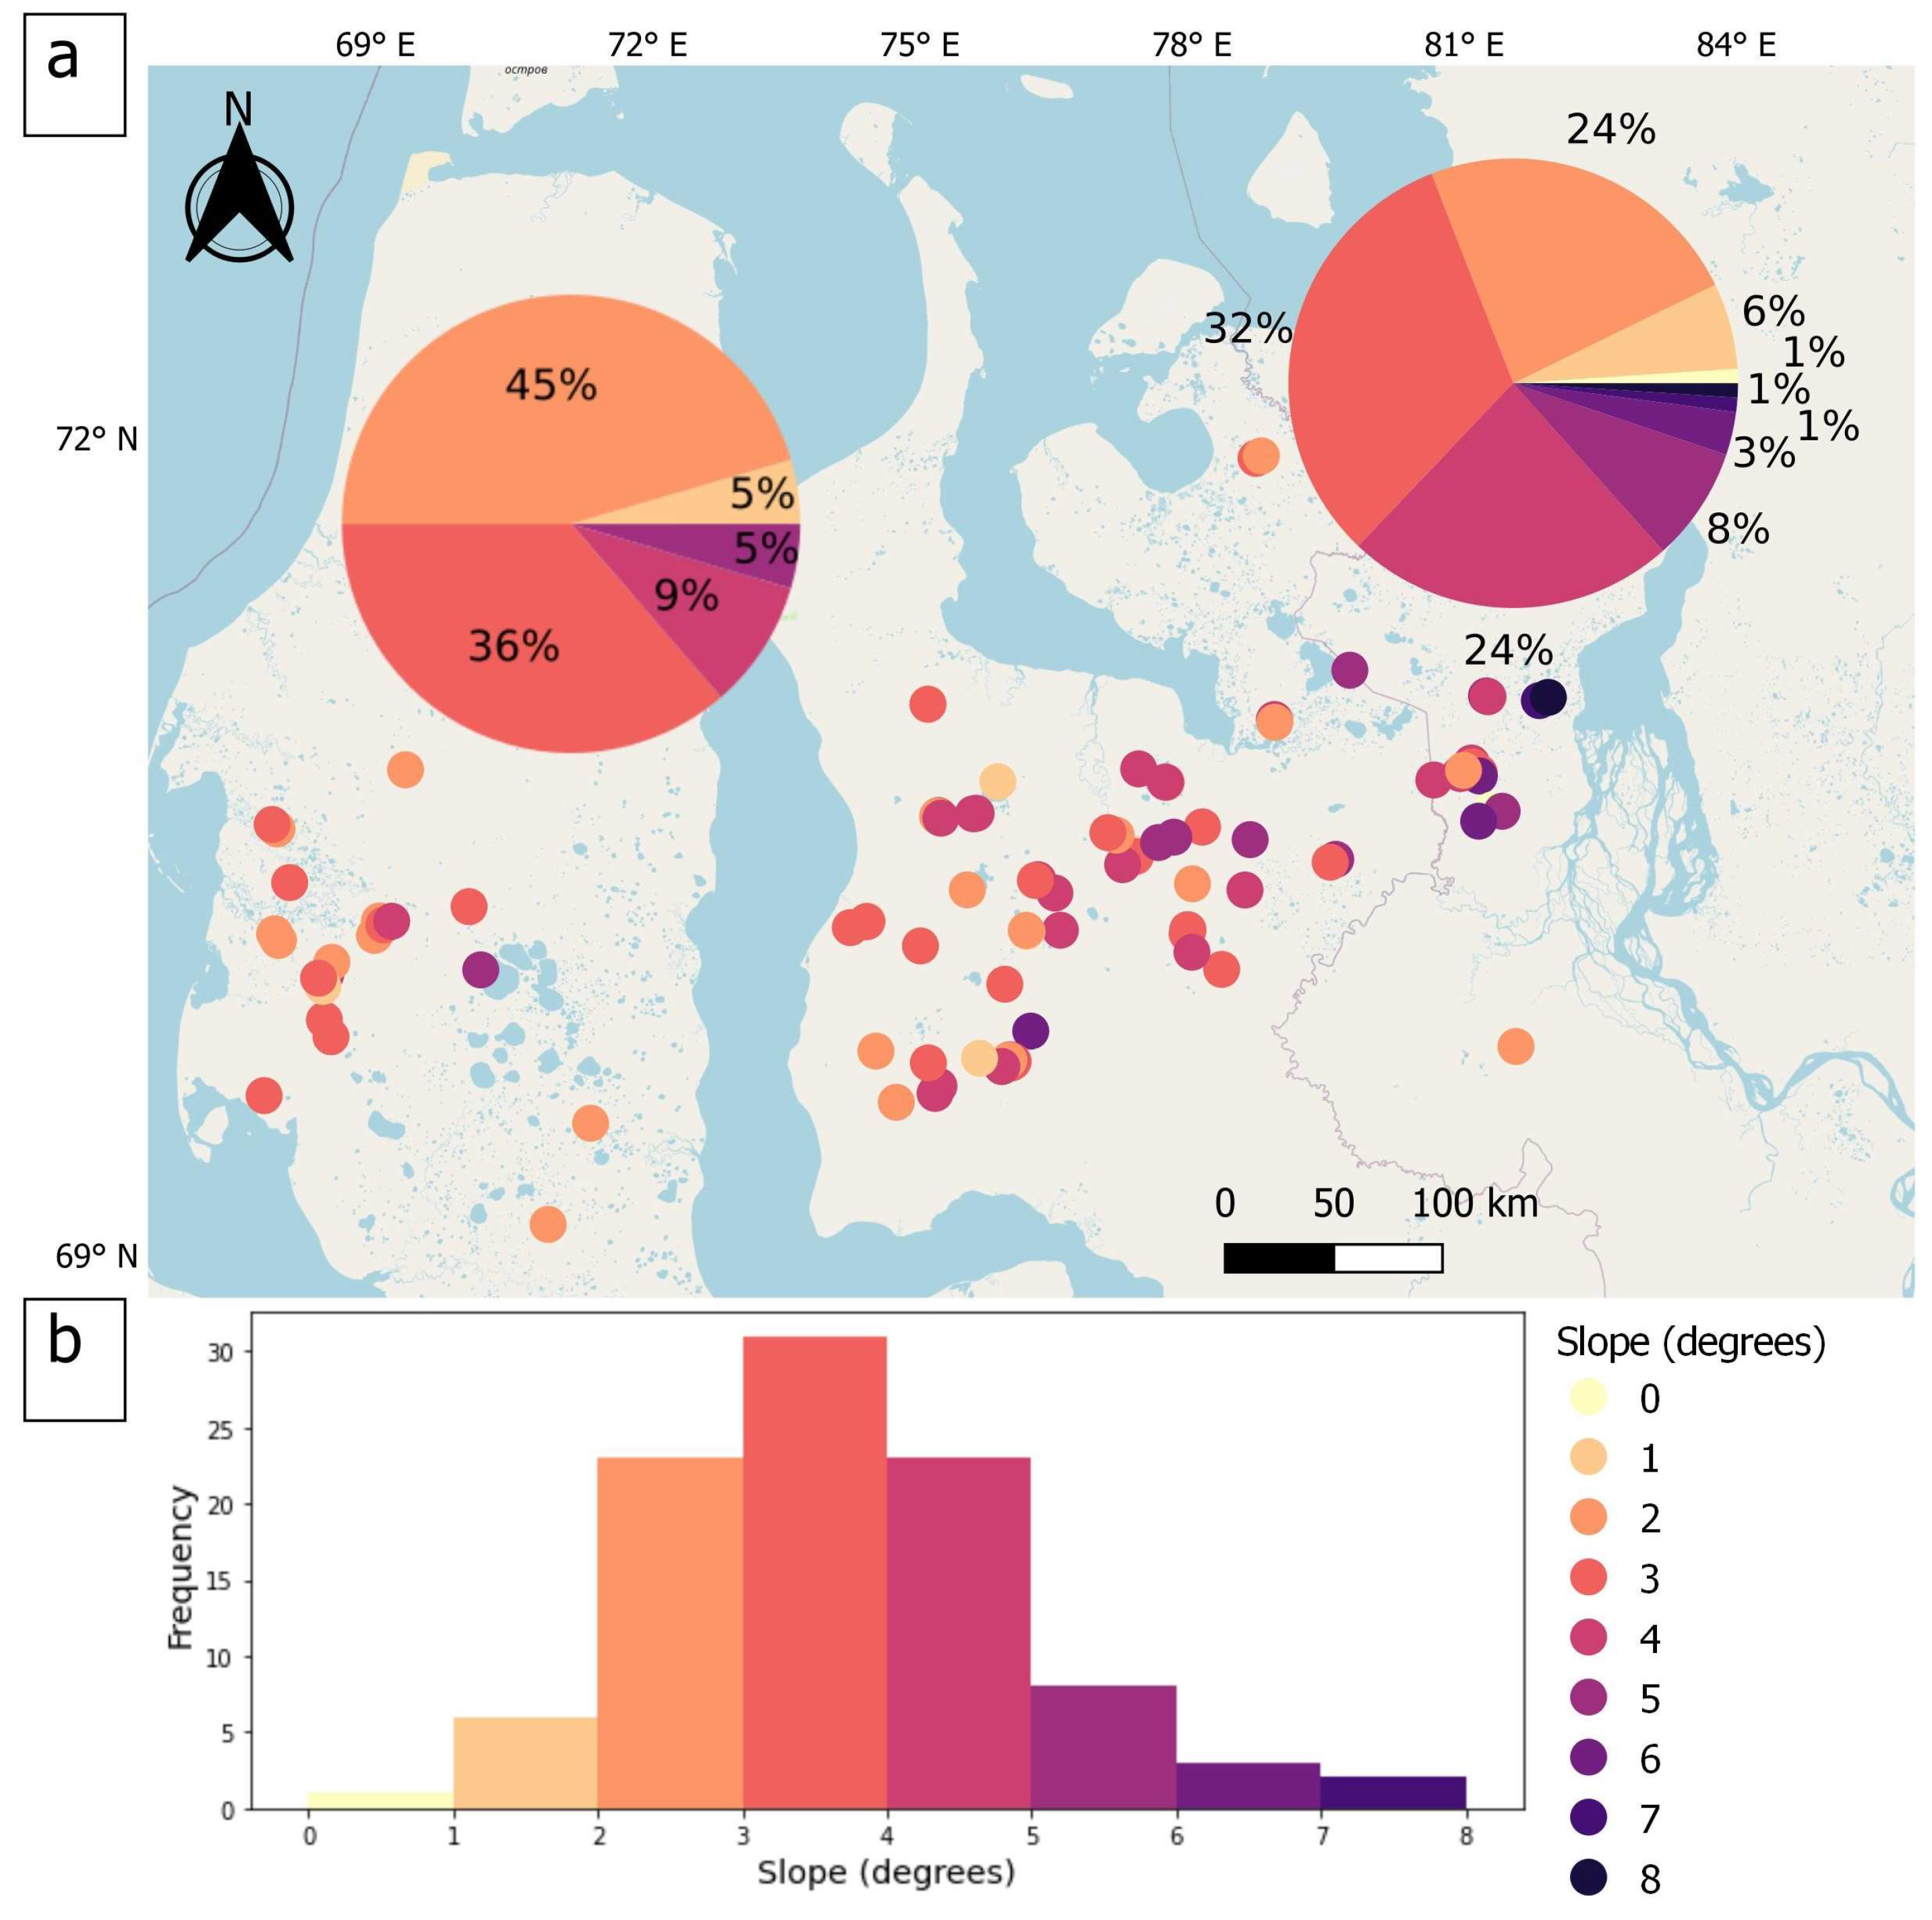
3. Results
3.1. TC Area Measurement and Frequency Distribution
3.2. TC Edge Elevation and Slope Angle
4. Discussion
4.1. Accuracy and Verification
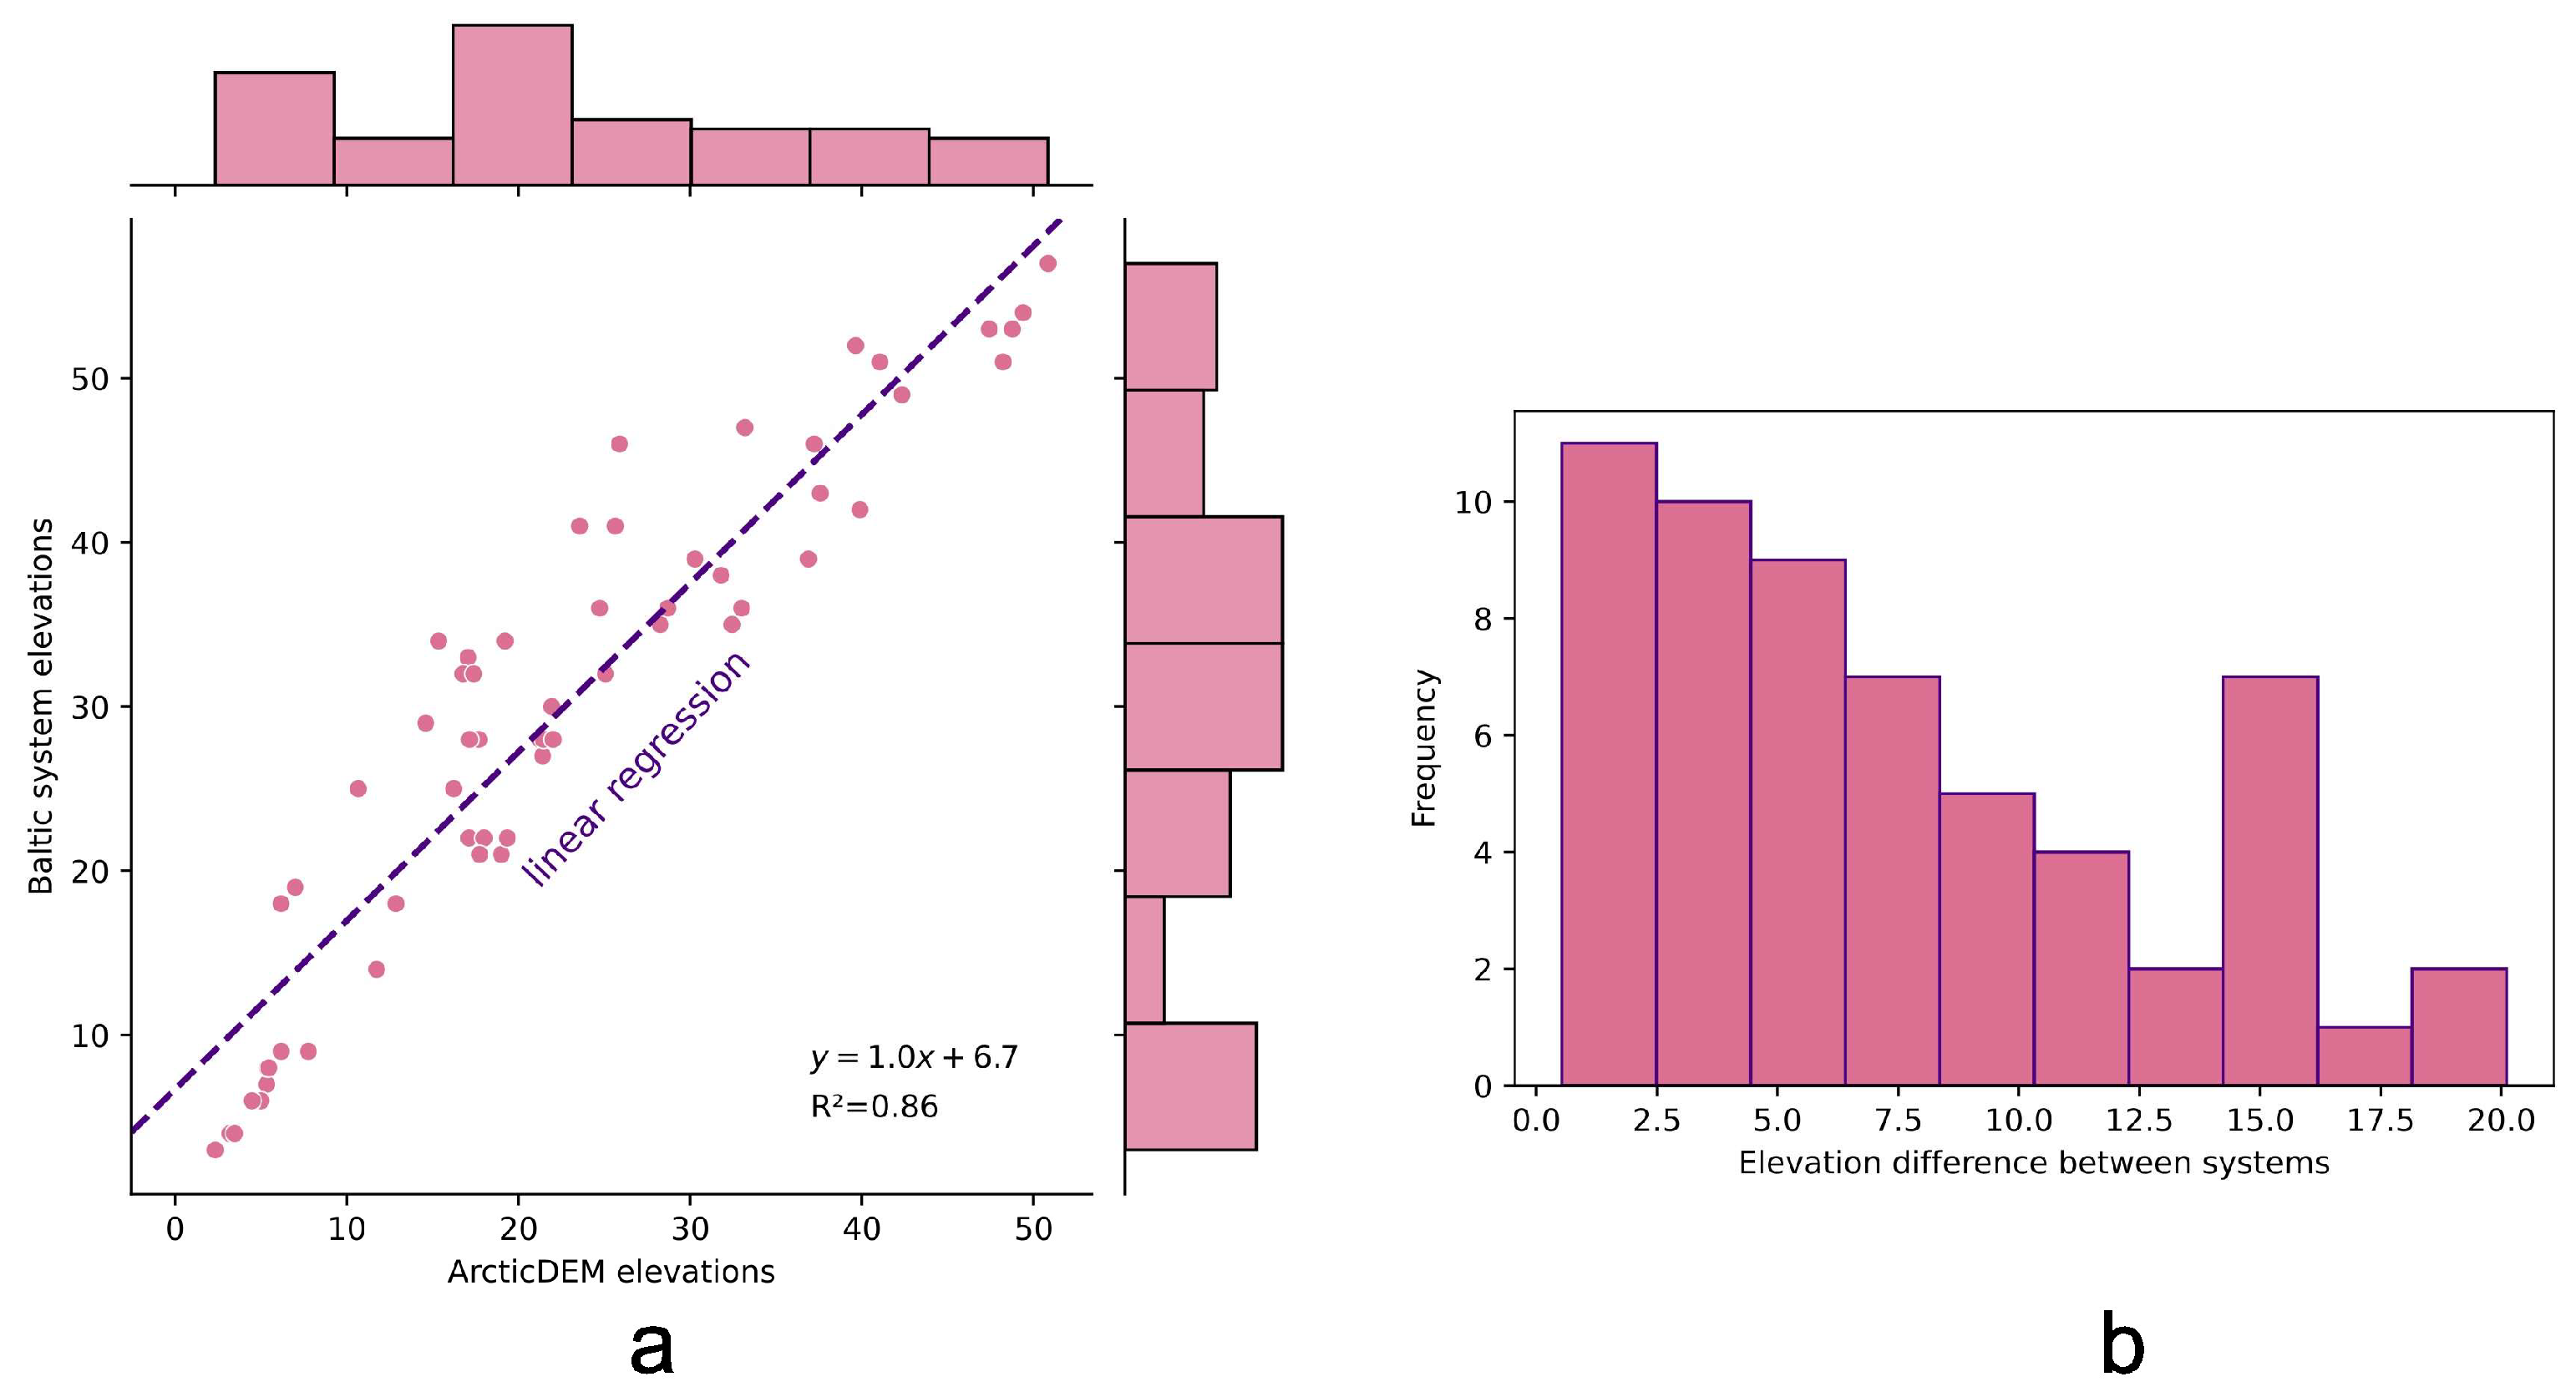
4.2. Terrain Elevation Bias between ArcticDEM and Baltic Height System
4.3. Merging TCs and Resolution Limitations
4.4. Comparison with Other Regions
5. Conclusions
- A total of 95% of the TC areas are smaller than 10 ha, with the smallest TC identifiable if its area is at least 0.5 ha and the largest found to be 38 ha;
- Many TCs in the region appear to have expanded in width due to merging with neighboring ones when identified on 10 m resolution imagery;
- While the majority of TC areas are small in both peninsulas, there still is a clear difference in area distribution between the two. All frequency ranges of TC area values in the Yamal peninsula are distributed more or less evenly except the smallest, while 99% of TCs in Gydan had an area of less than 7.88 ha;
- The edge elevations of TCs are expectedly different for both peninsulas, with Gydan having higher relief elevations in general and, thus, higher position of TC edges;
- The slope angles of TC-bearing slopes on Gydan are found to be slightly steeper than those on Yamal. However, in general, TC-bearing slopes on both peninsulas are gentle, with angles of no more than 8 degrees;
- Accuracy analysis revealed a relative error of 1.55% when comparing TC areas with those delineated on very-high-resolution satellite images and up to 5.05% when compared to UAV-based orthophotos;
- Comparison of ArcticDEM elevations with those from a topographic map based on the Baltic height system that can be considered as “ground truth” demonstrates a clear bias and the need for adjustment throughout the region to compare contemporary results with prior knowledge on the relief and permafrost of West Siberia;
- The results obtained are comparable with those for North America and China when the same method and input data quality are used.
Author Contributions
Funding
Data Availability Statement
Conflicts of Interest
References
- Are, F.E. Thermoabrasion of the Arctic Coasts; Nauka Publisher: Moscow, Russia, 1980. [Google Scholar]
- Kaplina, T.N. Cryogenic Slope Processes; Nauka Publisher: Moscow, Russia, 1965. [Google Scholar]
- Zhigarev, L.A. Termodenudation Processes and Deformation Behavior of the Thawing Ground; Nauka Publisher: Moscow, Russia, 1975. [Google Scholar]
- Leibman, M.O.; Kizyakov, A.I. Cryogenic Landslides of the Yamal and Yugorsky Peninsulas; The Earth Cryosphere Institute: Moscow-Tyumen, Russia, 2007. [Google Scholar]
- Mackay, J.R. Segregated Epigenetic Ice and Slumps in Permafrost, Mackenzie Delta Area, NWT. Geogr. Bull. 1966, 8, 59–80. [Google Scholar]
- Burn, C.R.; Friele, P.A. Geomorphology, vegetation succession, soil characteristics and permafrost in retrogressive thaw slumps near Mayo, Yukon Territory. Arctic 1989, 42, 31–40. [Google Scholar] [CrossRef]
- Lewkowicz, A.G. Headwall retreat of ground-ice slumps, Banks Island, Northwest Territories. Can. J. Earth Sci. 1987, 24, 1077–1085. [Google Scholar] [CrossRef]
- Burn, C.R.; Lewkowicz, A.G. Canadian landform examples—17 retrogressive thaw slumps. Can. Geogr./Le Géogr. Can. 1990, 34, 273–276. [Google Scholar] [CrossRef]
- Kokelj, S.V.; Lewkowicz, A.G. Salinization of permafrost terrain due to natural geomorphic disturbance, Fosheim Peninsula, Ellesmere Island. Arctic 1999, 52, 372–385. [Google Scholar] [CrossRef] [Green Version]
- Mesquita, P.S.; Wrona, F.J.; Prowse, T.D. Effects of retrogressive permafrost thaw slumping on sediment chemistry and submerged macrophytes in Arctic tundra lakes. Freshw. Biol. 2010, 55, 2347–2358. [Google Scholar] [CrossRef]
- Malone, L.; Lacelle, D.; Kokelj, S.; Clark, I.D. Impacts of hillslope thaw slumps on the geochemistry of permafrost catchments (Stony Creek Watershed, NWT, Canada). Chem. Geol. 2013, 356, 38–49. [Google Scholar] [CrossRef]
- Leibman, M.; Khomutov, A.; Kizyakov, A. Cryogenic landslides in the West-Siberian plain of Russia: Classification, mechanisms, and landforms. In Landslides in Cold Regions in the Context of Climate Change, Environmental Science and Engineering; Shan, W., Guo, Y., Wang, F., Marui, H., Strom, A., Eds.; Springer International Publishing: Cham, Switzerland, 2014; pp. 143–162. [Google Scholar] [CrossRef]
- Khomutov, A.; Leibman, M.; Dvornikov, Y.; Gubarkov, A.; Mullanurov, D.; Khairullin, R. Activation of Cryogenic Earth Flows and Formation of Thermocirques on Central Yamal as a Result of Climate Fluctuations. In Advancing Culture of Living with Landslides. Proceedings of the World Landslide Forum 4, Ljubljana, Slovenia, 29 May–2 June 2017; Landslides in Different Environments; Mikoš, K., Vilímek, V., Yin, Y., Sassa, K., Eds.; Springer International Publishing AG: Ljubljana, Slovenia, 2017; Volume 5, pp. 209–216. [Google Scholar]
- Nesterova, N.B.; Khomutov, A.V.; Leibman, M.O.; Safonov, T.A.; Belova, N.G. The Inventory of Retrogressive Thaw Slumps (Thermocirques) in the North of West Siberia Based on 2016–2018 Satellite Imagery Mosaic. Earth’s Cryosphere 2021, 25, 41–50. [Google Scholar] [CrossRef]
- The Sentinel-2 Data. Available online: https://developers.google.com/earth-engine/datasets/catalog/COPERNICUS_S2 (accessed on 11 November 2022).
- Claire, P.; Paul, M.; Ian, H.; Myoung-Jon, N.; Brian, B.; Kenneth, P.; Scott, K.; Matthew, S.; Judith, G.; Karen, T.; et al. ArcticDEM, Version 3; Harvard Dataverse: Cambridge, MA, USA, 2018. [Google Scholar] [CrossRef]
- Baulin, V.V.; Belopukhova, E.B.; Dubikov, G.I.; Shmelev, L.M. Geocryological Conditions of West Siberian Lowland; Nauka Publisher: Moscow, Russia, 1967. [Google Scholar]
- Belova, N.G.; Solomatin, V.I.; Noskov, A.I.; Ogorodov, S.A. Ural coast of Baydaratskaya bay, Kara Sea: Massive ice beds as a factor of coastal dynamics. In Reports on Polar and Marine Research; Alfred Wegener Institute: Bremerhaven, Germany, 2018; Volume 576, pp. 44–46. [Google Scholar]
- ArcticDEM Mosaic. Available online: https://developers.google.com/earth-engine/datasets/catalog/UMN_PGC_ArcticDEM_V3_2m_mosaic (accessed on 11 November 2022).
- Tarasevich, I.I.; Kizyakov, A.I.; Leibman, M.O.; Pismenyuk, A.A.; Nesterova, N.B.; Khairullin, R.R.; Khomutov, A.V. Dynamics of thermodenudation in the Central Yamal in 2017–2021 based on the annual monitoring. In Relief and Quaternary Formation of the Arctic, Sub-Arctic and North-West of Russia. Materials of Annual Conference on the Results of Field Studies; AARI Publisher: St-Petersburg, Russia, 2022; Volume 9, pp. 253–257. [Google Scholar]
- Runge, A.; Nitze, I.; Grosse, G. Remote sensing annual dynamics of rapid permafrost thaw disturbances with LandTrendr. Remote Sens. Environ. 2022, 268, 112752. [Google Scholar] [CrossRef]
- Marc, O.; Hovius, N. Amalgamation in landslide maps: Effects and automatic detection. Nat. Hazards Earth Syst. Sci. 2015, 15, 723–733. [Google Scholar] [CrossRef] [Green Version]
- Segal, R.A.; Lantz, T.C.; Kokelj, S.V. NWT Open Report 2015-023 Inventory of Active Retrogressive Thaw Slumps in the Bluenose Moraine, Western Nunavut; Government of Northwest Territories: Yellowknife, NT, Canada, 2016.
- Segal, R.A.; Lantz, T.C.; Kokelj, S.V. NWT Open Report 2015-021 Inventory of Active Retrogressive Thaw Slumps on Eastern Banks Island, Northwest Territories NWT Open Report 2015-021; Government of Northwest Territories: Yellowknife, NT, Canada, 2016.
- Lewkowicz, A.G.; Way, R.G. Extremes of summer climate trigger thousands of thermokarst landslides in a High Arctic environment. Nat. Commun. 2019, 10, 1329. [Google Scholar] [CrossRef] [PubMed] [Green Version]
- Zwieback, S.; Kokelj, S.; Günther, F.; Boike, J.; Grosse, G.; Hajnsek, I. Sub-seasonal thaw slump mass wasting is not consistently energy limited at the landscape scale. Cryosphere 2018, 12, 549–564. [Google Scholar] [CrossRef] [Green Version]
- Kokelj, S.V.; Lacelle, D.; Lantz, T.C.; Tunnicliffe, J.; Malone, L.; Clark, I.D.; Chin, K.S. Thawing of massive ground ice in mega slumps drives increases in stream sediment and solute flux across a range of watershed scales. J. Geophys. Res. Earth Surf. 2013, 118, 681–692. [Google Scholar] [CrossRef]
- Ramage, J.L.; Irrgang, A.M.; Herzschuh, U.; Morgenstern, A.; Couture, N.; Lantuit, H. Terrain controls on the occurrence of coastal retrogressive thaw slumps along the Yukon coast, Canada. J. Geophys. Res. Earth Surf. 2017, 122, 1619–1634. [Google Scholar] [CrossRef]
- Swanson, D.K.; Nolan, M. Growth of retrogressive thaw slumps in the Noatak Valley, Alaska, 2010–2016, measured by airborne photogrammetry. Remote Sens. 2018, 10, 983. [Google Scholar] [CrossRef] [Green Version]
- Xia, Z.; Huang, L.; Fan, C.; Jia, S.; Lin, Z.; Liu, L.; Luo, J.; Niu, F.; Zhang, T. Retrogressive thaw slumps along the Qinghai–Tibet Engineering Corridor: A comprehensive inventory and their distribution characteristics. Earth Syst. Sci. Data. 2022, 14, 3875–3887. [Google Scholar] [CrossRef]
- Luo, J.; Niu, F.; Lin, Z.; Liu, M.; Yin, G. Recent acceleration of thaw slumping in permafrost terrain of Qinghai-Tibet Plateau: An Example from the Beiluhe Region. Geomorphology 2019, 341, 79–85. [Google Scholar] [CrossRef]
- Huang, L.; Luo, J.; Lin, Z.; Niu, F.; Liu, L. Using deep learning to map retrogressive thaw slumps in the Beiluhe region (Tibetan Plateau) from CubeSat Images. Remote Sens. Environ. 2020, 237, 111534. [Google Scholar] [CrossRef]


| Parameter | Yamal | Gydan | Total |
|---|---|---|---|
| Area of TC distribution 1, km2 | 33,384 | 40,376 | 73,760 |
| Number of TCs 2 | 124 | 360 | 484 |
| Impact N: TCs number per km2 | 4 × 10⁻³ | 9 × 10⁻³ | 6.5 × 10⁻³ |
| Aggregated areas of TCs 3, km2 | 1.32 | 2.70 | 4.02 |
| Impact A: TCs area per km2 | 3.89 × 10⁻⁵ | 6.69 × 10⁻⁵ | 5.45 × 10⁻⁵ |
| Aggregated areas of small TCs 4, km2 | 0.22 | 0.58 | 0.8 |
| Total impact: TCs area per km2 | 4.61 × 10⁻⁵ | 8.12 × 10⁻⁵ | 6.53 × 10⁻⁵ |
| Parameter | Area, ha | Edge Elevation, m asl | Slope Angle, Degree | |||
|---|---|---|---|---|---|---|
| Yamal | Gydan | Yamal | Gydan | Yamal | Gydan | |
| Min | 0.6 | 0.55 | 10.3 | 2.9 | 1 | 1 |
| Max | 35.9 | 38.1 | 33.8 | 65.6 | 5 | 8 |
| Average | 6 | 3.6 | 19.5 | 30.3 | 2.6 | 3.4 |
| Median | 1.8 | 2.6 | 17.7 | 29.4 | 2.5 | 3 |
| Count 1 | 35 (22) | 126 (75) | 35 (22) | 126 (75) | 35 (22) | 126 (75) |
Disclaimer/Publisher’s Note: The statements, opinions and data contained in all publications are solely those of the individual author(s) and contributor(s) and not of MDPI and/or the editor(s). MDPI and/or the editor(s) disclaim responsibility for any injury to people or property resulting from any ideas, methods, instructions or products referred to in the content. |
© 2023 by the authors. Licensee MDPI, Basel, Switzerland. This article is an open access article distributed under the terms and conditions of the Creative Commons Attribution (CC BY) license (https://creativecommons.org/licenses/by/4.0/).
Share and Cite
Leibman, M.; Nesterova, N.; Altukhov, M. Distribution and Morphometry of Thermocirques in the North of West Siberia, Russia. Geosciences 2023, 13, 167. https://doi.org/10.3390/geosciences13060167
Leibman M, Nesterova N, Altukhov M. Distribution and Morphometry of Thermocirques in the North of West Siberia, Russia. Geosciences. 2023; 13(6):167. https://doi.org/10.3390/geosciences13060167
Chicago/Turabian StyleLeibman, Marina, Nina Nesterova, and Maxim Altukhov. 2023. "Distribution and Morphometry of Thermocirques in the North of West Siberia, Russia" Geosciences 13, no. 6: 167. https://doi.org/10.3390/geosciences13060167