1. Introduction
Dispersive soils are composed of a specific type of clay called dispersive clays, which tend to form cracks or channels when exposed to water, causing internal soil erosion and problems in civil engineering projects [
1]. The cation exchange between sodium and calcium on clay mineral surfaces may lead to the flocculation and dispersion reactions responsible for soil dispersivity. When two clay particles with a high concentration of sodium counterions come close, their double layers overlap or interact, creating a difference in osmotic pressure that draws water between the particles and causes them to move further apart [
2]. This event is the swelling associated with sodic soils. In addition, free water can cause sodic soil to move to a more advanced stage of disruption so that the particles become dispersed in this water [
3].
Introducing water into the system displaces sodium ions, increasing interparticle distance and forming micropores within the clay matrix. The attractive forces between clay particles weaken, making the material vulnerable to erosion [
4]. Within the clay structure, micro-spaces become minute channels, which eventually enlarge into siphons due to continuous water erosion. Soil dispersibility is a phenomenon that can cause a decline in soil stability and engineering properties, leading to volumetric changes that may result in the deformation or failure of structures built on such soils. This process is triggered by the displacement of soil particles when exposed to stagnant or slow-moving water. The presence of organic matter can also explain the dispersivity activity of soils. Organic matter can act as a dispersing agent by reducing water’s surface tension and increasing soil particles’ mobility, leading to soil erosion and instability, particularly in areas with high organic matter content. It is worth noting that certain microorganisms present in soil can also contribute to soil dispersivity by producing extracellular polymeric substances that can act as dispersing agents. Understanding the impact of organic matter and microorganisms on soil dispersivity can aid in developing effective soil management strategies.
The primary hallmark of dispersity is its erosive impact on clay soils, rendering them unsuitable for construction purposes, as highlighted by the NSR-10 [
5] (Colombian Seismic Resistant Standard) in Chapter H.9.2.5. James L. Sherard first reported the pinhole test in 1976 [
6] to identify and improve understanding of fine-grained dispersive soils rich in sodium and highly erodible, primarily for studies of earth dam constructions and other structures in Australia. Sherard provides the test details, and the procedure is based on extensive testing and observational experience. The test procedure is also described in ASTM standard D4647 [
7]. On the other hand, the crumb test, as introduced by Rallings [
8] makes it possible to characterize a dispersive soil-associated sample’s susceptibility to dispersion. However, it is essential to note that the test’s results may not necessarily indicate the opposite.
The type of clay mineral also influences the dispersion phenomenon. In the case of montmorillonites, the clay particles exist in packages of four to nine laminar plates called tactoids [
9]. The spaces between the clay layers prefer calcium over sodium, generating a cationic exchange that places sodium on the outer surface and calcium between the layers. The importance of this model provides a reasonable explanation for the spontaneous dispersion at shallow levels of sodium-containing only montmorillonite. For instance, dispersive clays cannot be distinguished from non-dispersive clays by conventional tests such as granulometry, consistency limits, or compaction [
10].
Although the behavior and characteristics of dispersive soils are reasonably well understood and adequately explained by the double layer theory, a satisfactory and analytical method for identifying dispersive soils remains a challenge. Identification is likely complex because dispersion is a physical manifestation of substances [
11]. Significant studies were carried out identifying the dispersive behavior of several soils. Abbasi et al. [
10] used clay nanoparticles to stabilize dispersive clay soil characteristics with a pinhole test. Nadal-Romero et al. [
12] conducted a study to assess the pipping erosion susceptibility of soils. Wu et al. employed the pinhole test to calculate the internal erosion of compacted loess against different hydraulic conditions [
13]. Other studies focused on improving dispersive soils [
4,
14,
15,
16,
17,
18].
According to a study conducted by Parameswaran and Sivapullaiah [
19] the primary reason for the separation of clay particles resulting in swelling and dispersion is the repulsion caused by ion hydration. The study further found that treating the soil with sodium or lithium ions significantly alters the geotechnical properties of the soil, increasing its dispersivity. The unconfined compressive strength test results showed that the untreated soil had a strength of 256 kPa, while the NaOH-treated soil had a strength of 171 kPa, and the LiOH-treated soil had a strength of 68 kPa. The shrinkage limit test results showed that the untreated soil had a shrinkage limit of 22%. Meanwhile, the NaOH-treated soil had a shrinkage limit of 16%, and the LiOH-treated soil had the lowest shrinkage limit at 8%. Based on the double hydrometer test results, the untreated soil displayed a dispersivity value of 21%. On the other hand, the NaOH-treated and LiOH-treated soil had 52% and 69% dispersivity values, respectively.
Masrour et al. [
20] concluded that adding up to 1% nano-silica reduced the soil dispersibility potential, resulting in a more flocculated, non-dispersive structure. The main reasons for this reduction were the cation exchange, flocculation, and agglomeration at an early age and the further pozzolanic reaction. The Atterberg limits increased with the addition of nano-silica. Still, the plasticity index increasing rate was lower than the liquid limit, resulting in a more brittle soil structure. The study also confirmed that the soil specimens treated with 1% nano-silica would be classified as non-dispersive.
Abbaslou et al. [
21] evaluated the properties of different clay soils and their dispersivity potential. Results showed that sepiolite soil had the highest potential for dispersivity, followed by kaolin and bentonite soils. Chemical stabilization with CaCl
2, CaSO
4, AlCl
3, and Al
2(SO
4)
3 effectively reduced dispersivity. The pinhole test was considered the most reliable method for assessing soil dispersion. The study highlights the importance of investigating dispersivity using multiple methods and provides insights into soil dispersivity mechanisms.
Rengasamy et al. [
3] calculated a strong correlation (r = 0.93) between net dispersive charge and dispersed clay content in soil samples from three regions in Southern Australia. The study also suggests that estimating soluble cations in dispersed solutions at a given soil pH can be a practical and less expensive way to derive soil’s dispersive and net dispersive charge. However, the study acknowledges that further experiments are needed to establish a CROSS-dispersive charge relation that could be used for all soil.
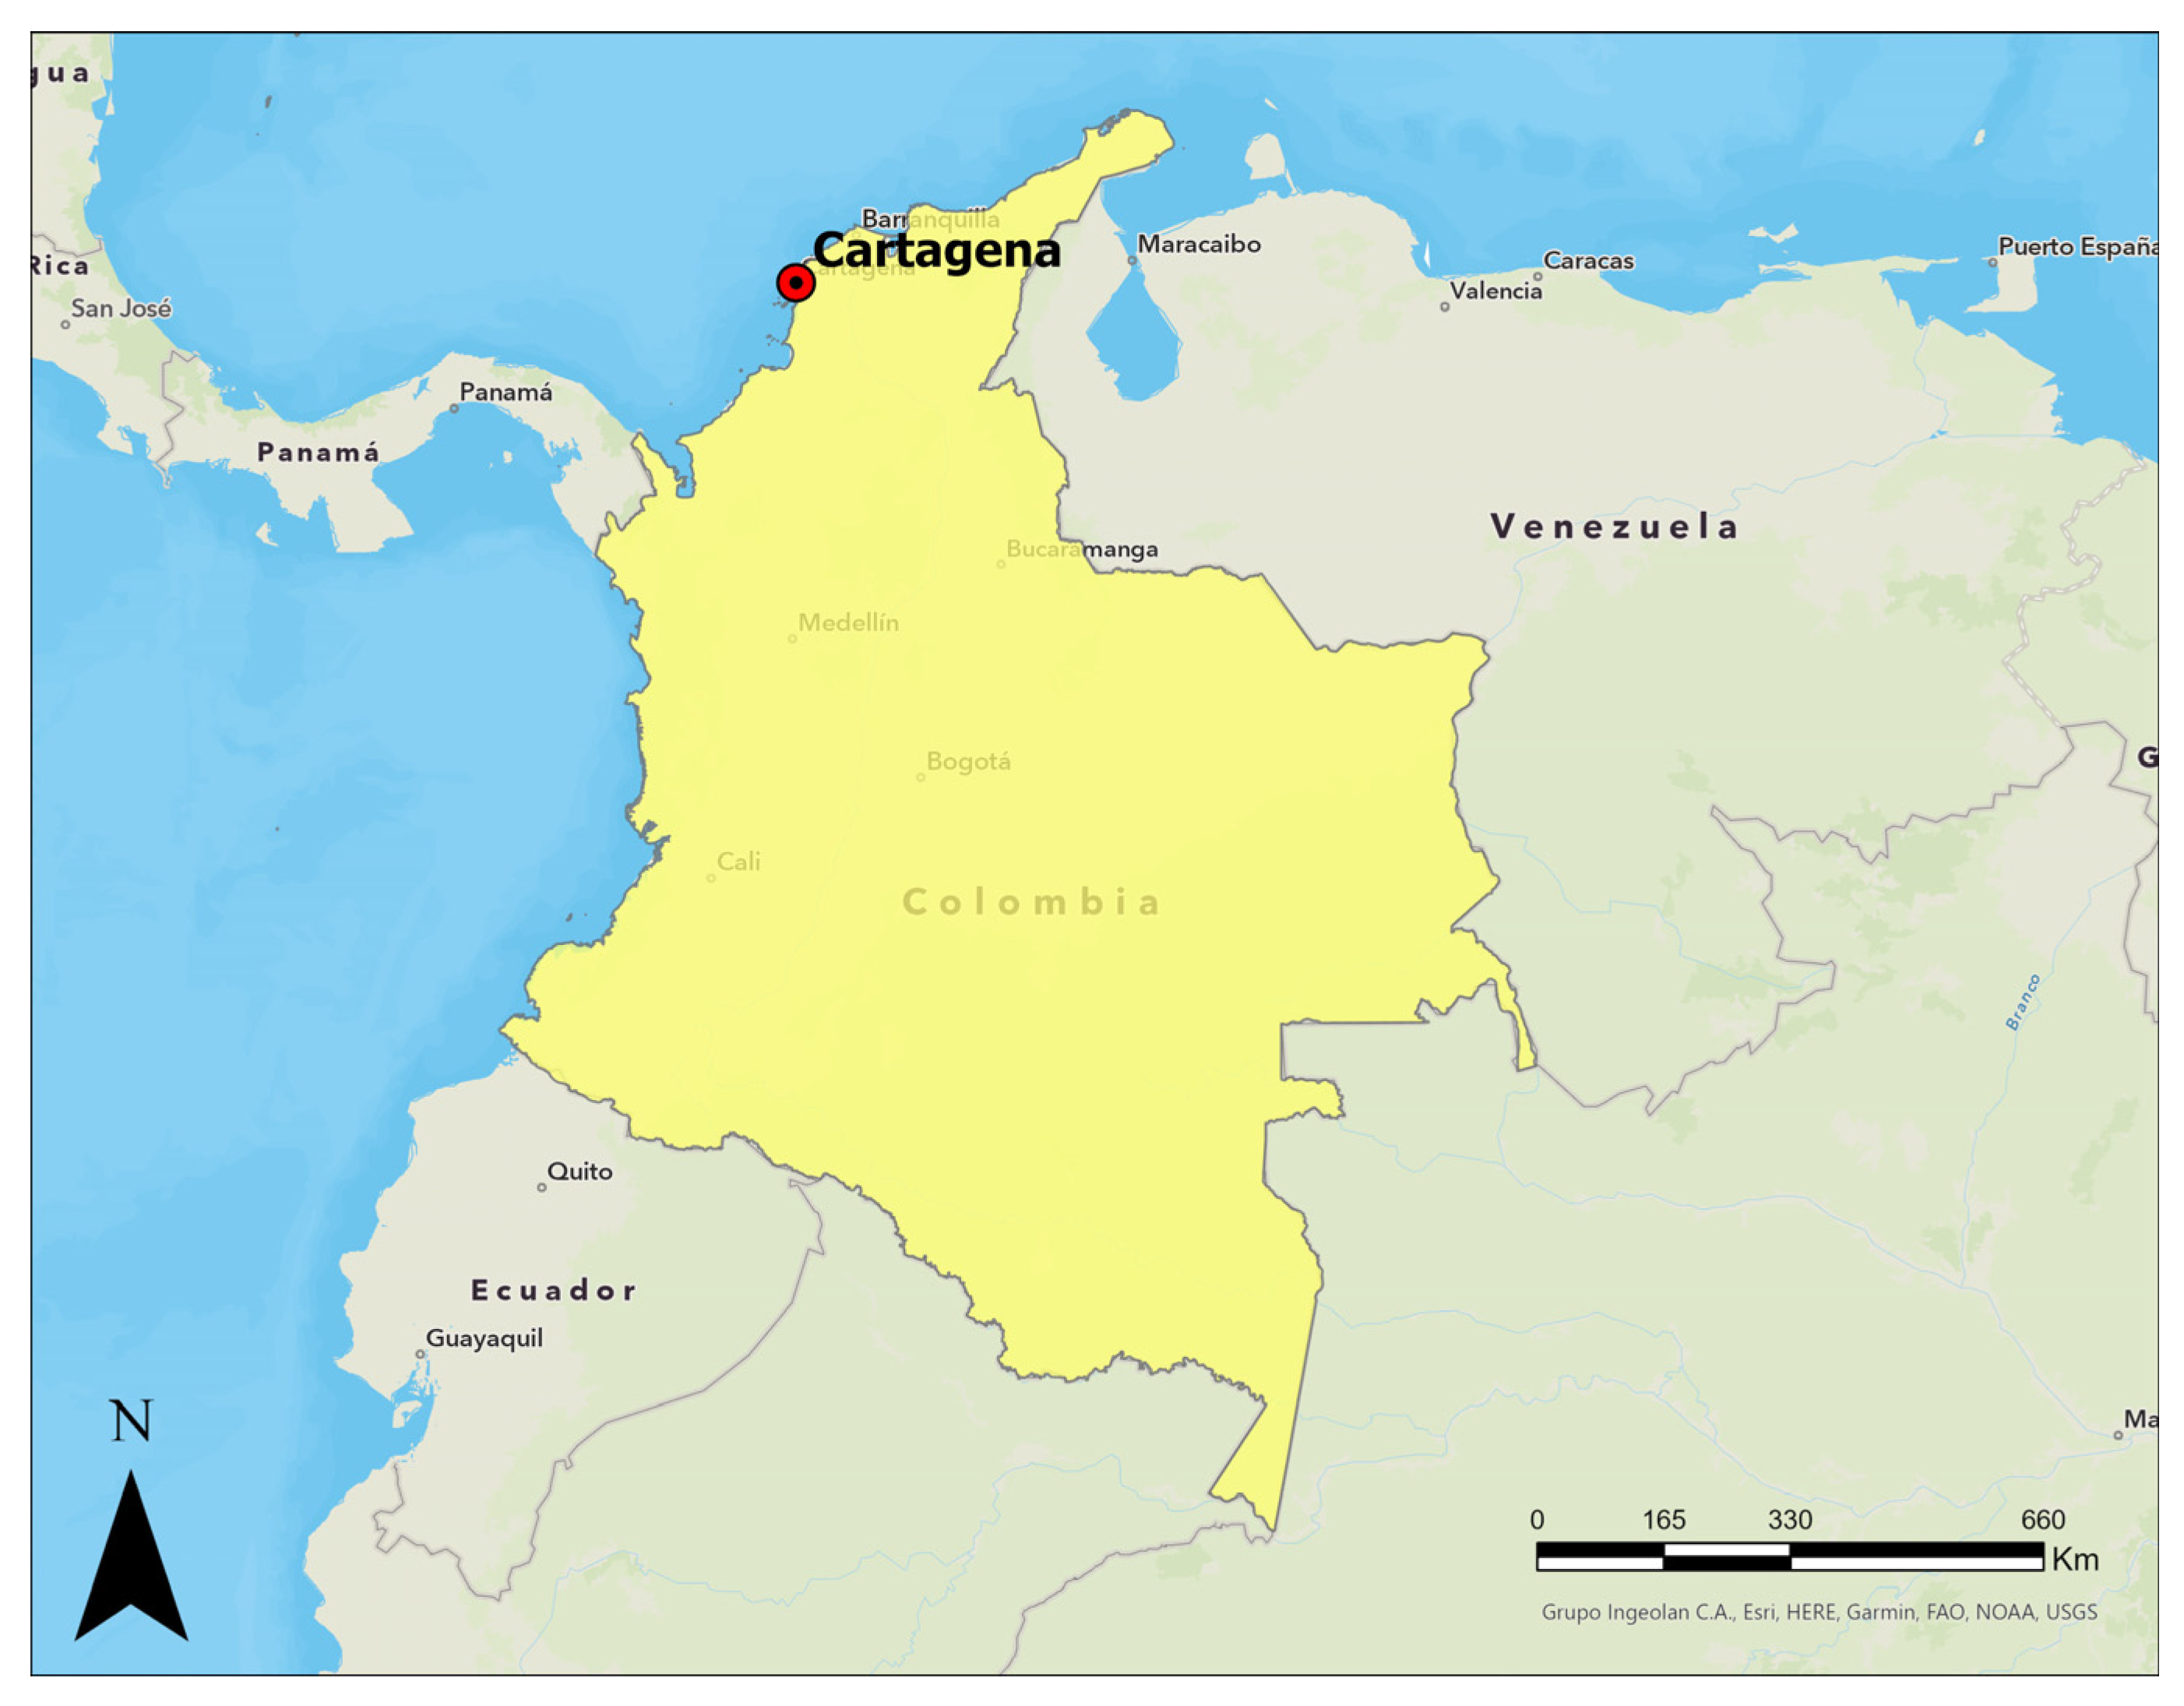
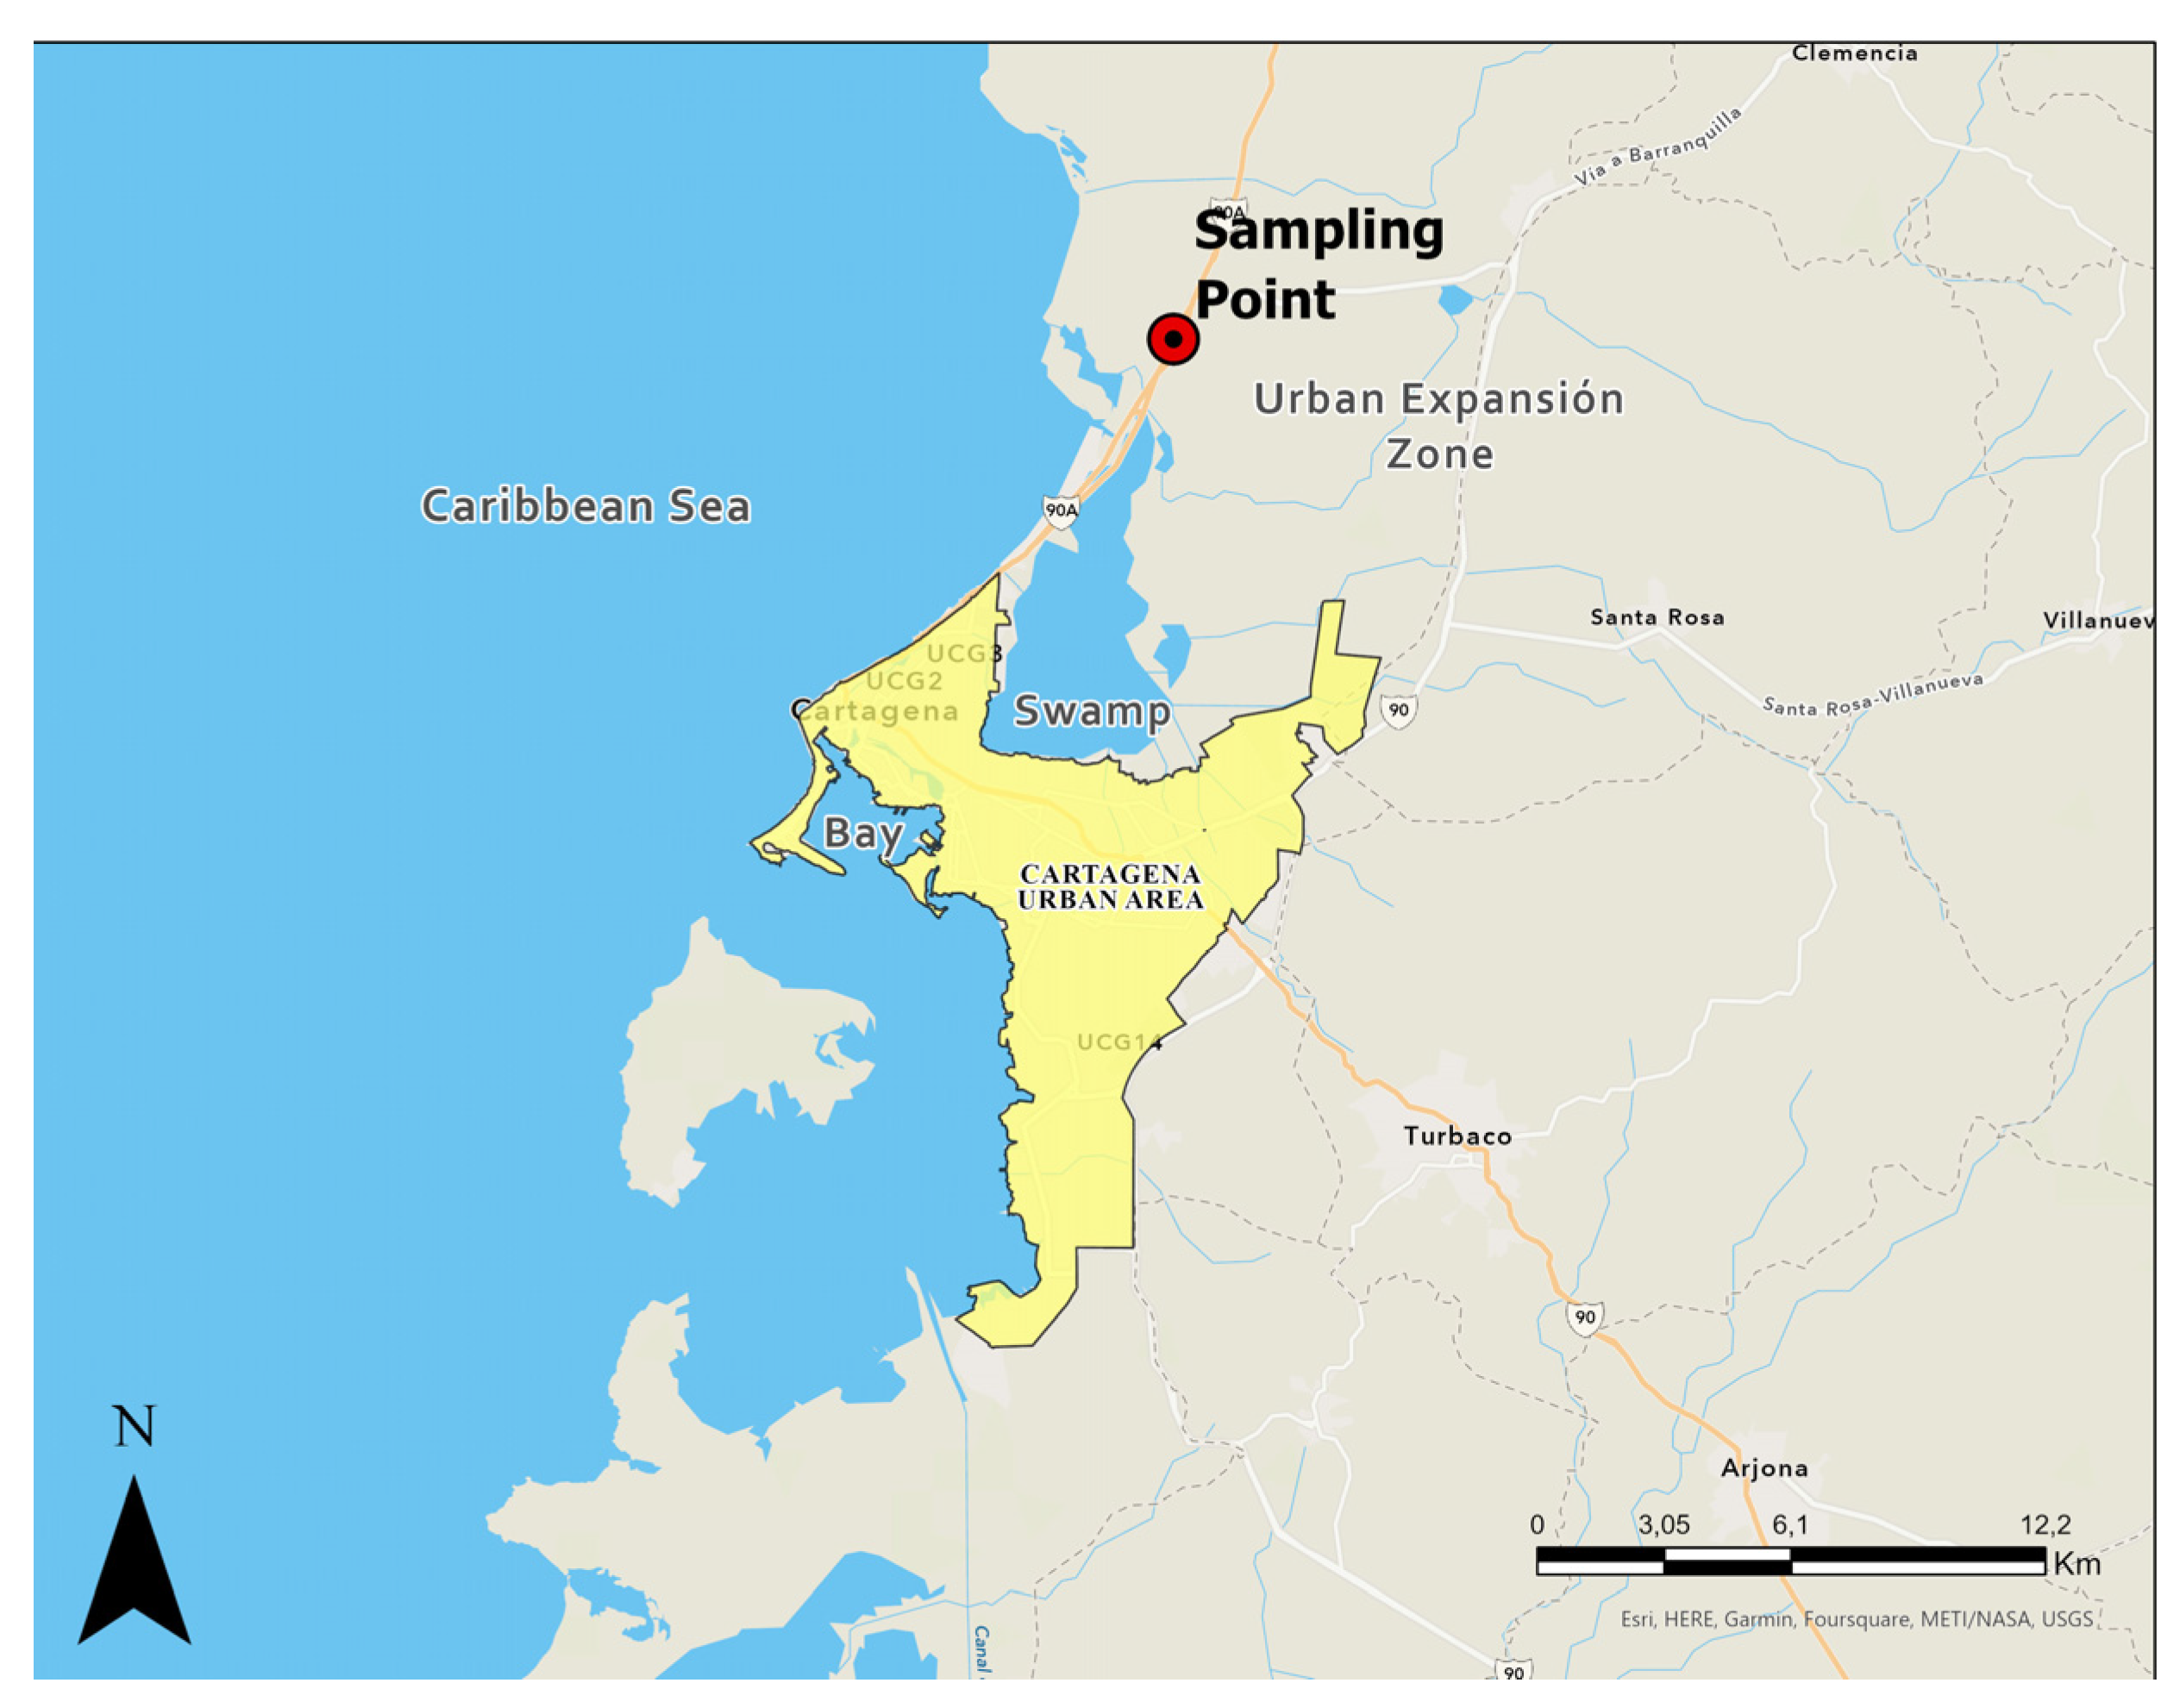
Figure 1 and
Figure 2 show Cartagena de Indias in Northern Colombia. Due to the population increase in recent years, the city has been forced to expand its urban area towards the north, where there are clay deposits of marine origin. The soils in this region have not been adequately described in the available literature, particularly regarding their potential for dispersivity. Hospitals, universities, and transport terminals have already been built in the northern zone, and a new international airport in the city is expected in the coming years. However, due to the above, a good characterization of the subsoil of this region is essential for developing regional infrastructure.
Dispersive soils are susceptible to erosive phenomena in contact with water. This type of soil has rarely been characterized in Cartagena de Indias. For this reason, this applied research aims to evaluate the degree of dispersivity of different deformed and undisturbed soil samples extracted from the north of Cartagena de Indias through the pinhole and crumb tests. This test can be ideal for evaluating the characteristics of an area that presents critical conditions of expansiveness or instability. This is especially relevant in municipalities such as Cartagena de Indias, constantly exposed to saline environments in coastal areas. Dispersive phenomena regularly caused by sodium in these environments can affect the area’s stability.
2. Materials and Methods
2.1. Geotechnical Marine Clay Characteristics
As shown in
Figure 2, the collection of soil samples was carried out in the urban expansion zone of Cartagena de Indias, Colombia. The samples of clayey material were identified in one of the soil slopes. Marine clay characterization includes granulometric analysis employing a laser method with a dispersive solution hexametaphosphate [
22], the Atterberg limits under American Standard ASTM 4318 [
23], the specific gravity of soil particles following the ASTM D854 [
24], standard Proctor compaction curve characteristic under ASTM D698 [
25]. The analysis of soil classification was carried out following the Unified Soil Classification System (USCS), ASTM D2487 [
26].
All the soil characterization tests, as well as the dispersivity tests, were carried out with distilled water.
2.2. Chemical Composition, Microanalysis, and Microstructure of Marine Clay
Soil’s chemical characterization was performed on an Oxford machine (Penta FET125 Precision) X-ACT along with a micro mass analyzer (LAMMA-1000 model X-ACT) and an X-ray energy dispersion spectrometer. The experiments were carried out with a heightened emphasis on the material’s sodium (Na) content owing to the well-established association between the occurrence of salt constituents in soil and the incidence of dispersive behavior.
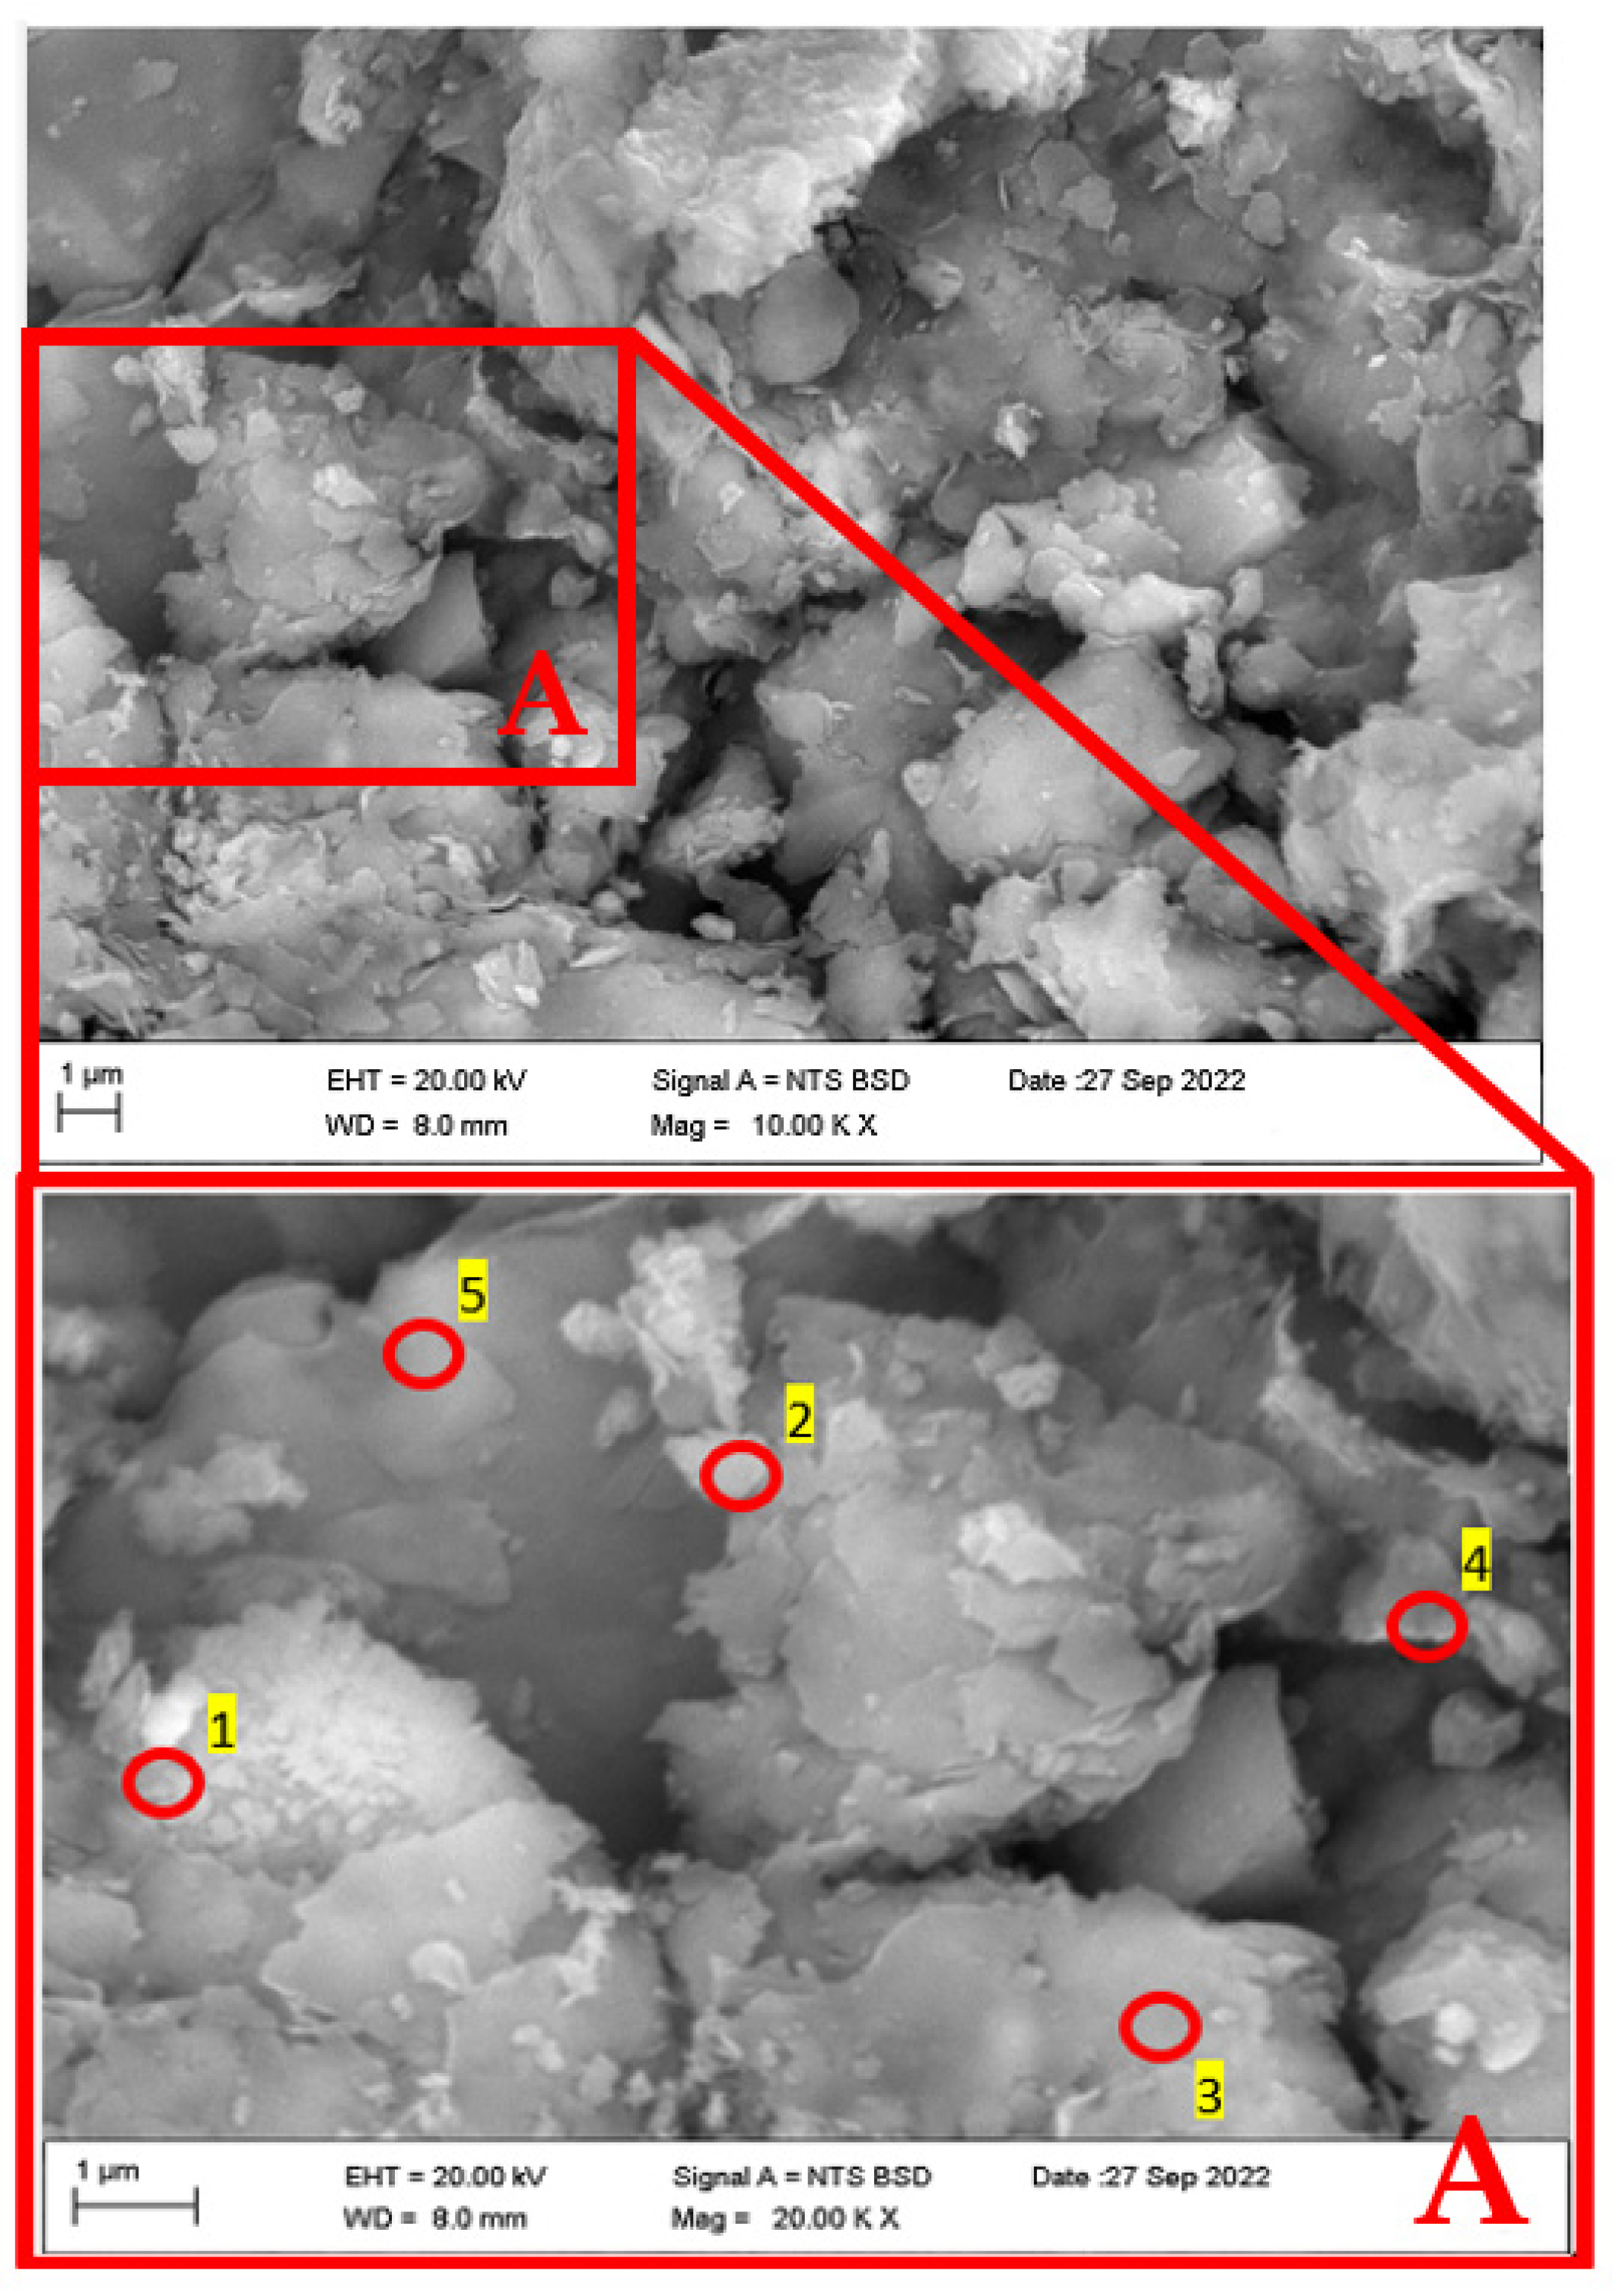
The microstructure of marine clay was determined using a scanning electron microscope (SEM), which allows the direct observation of edges or grain contours and the characterization of inter and intragranular porosity, using electrons to generate a microscopic image of the surface of the clayey soil sample. The SEM was equipped with energy-dispersive X-ray detectors (energy dispersive X-ray spectrometer—EDX), which produce X-ray photons that make it possible to determine the punctual chemical composition as well as the spatial distribution of chemical elements present in the material observed on SEM image. This methodology is distinguished by its enhanced precision compared to X-ray fluorescence and its excellent reliability in yielding results.
2.3. Molding and Dispersivity Tests
The dispersivity was evaluated in disturbed and undisturbed soil samples. For the disturbed samples, the dispersivity was calculated in the optimal compaction conditions (i.e., maximum dry unit weight and optimal moisture content) and the standard compaction curve’s dry and wet branches.
2.4. Pinhole Tests
Considering the use of the disturbed samples, the guidelines established by the American standard ASTM D 4647 [
7] were followed, firstly drying the soil and passing it through the No. 10 sieve. To better understand the behavior of the studied soil, it was decided to test the samples under different humidities (22, 26, and 30%), considering the degrees of compaction or unit weights corresponding to said humidities in the standard Proctor test.
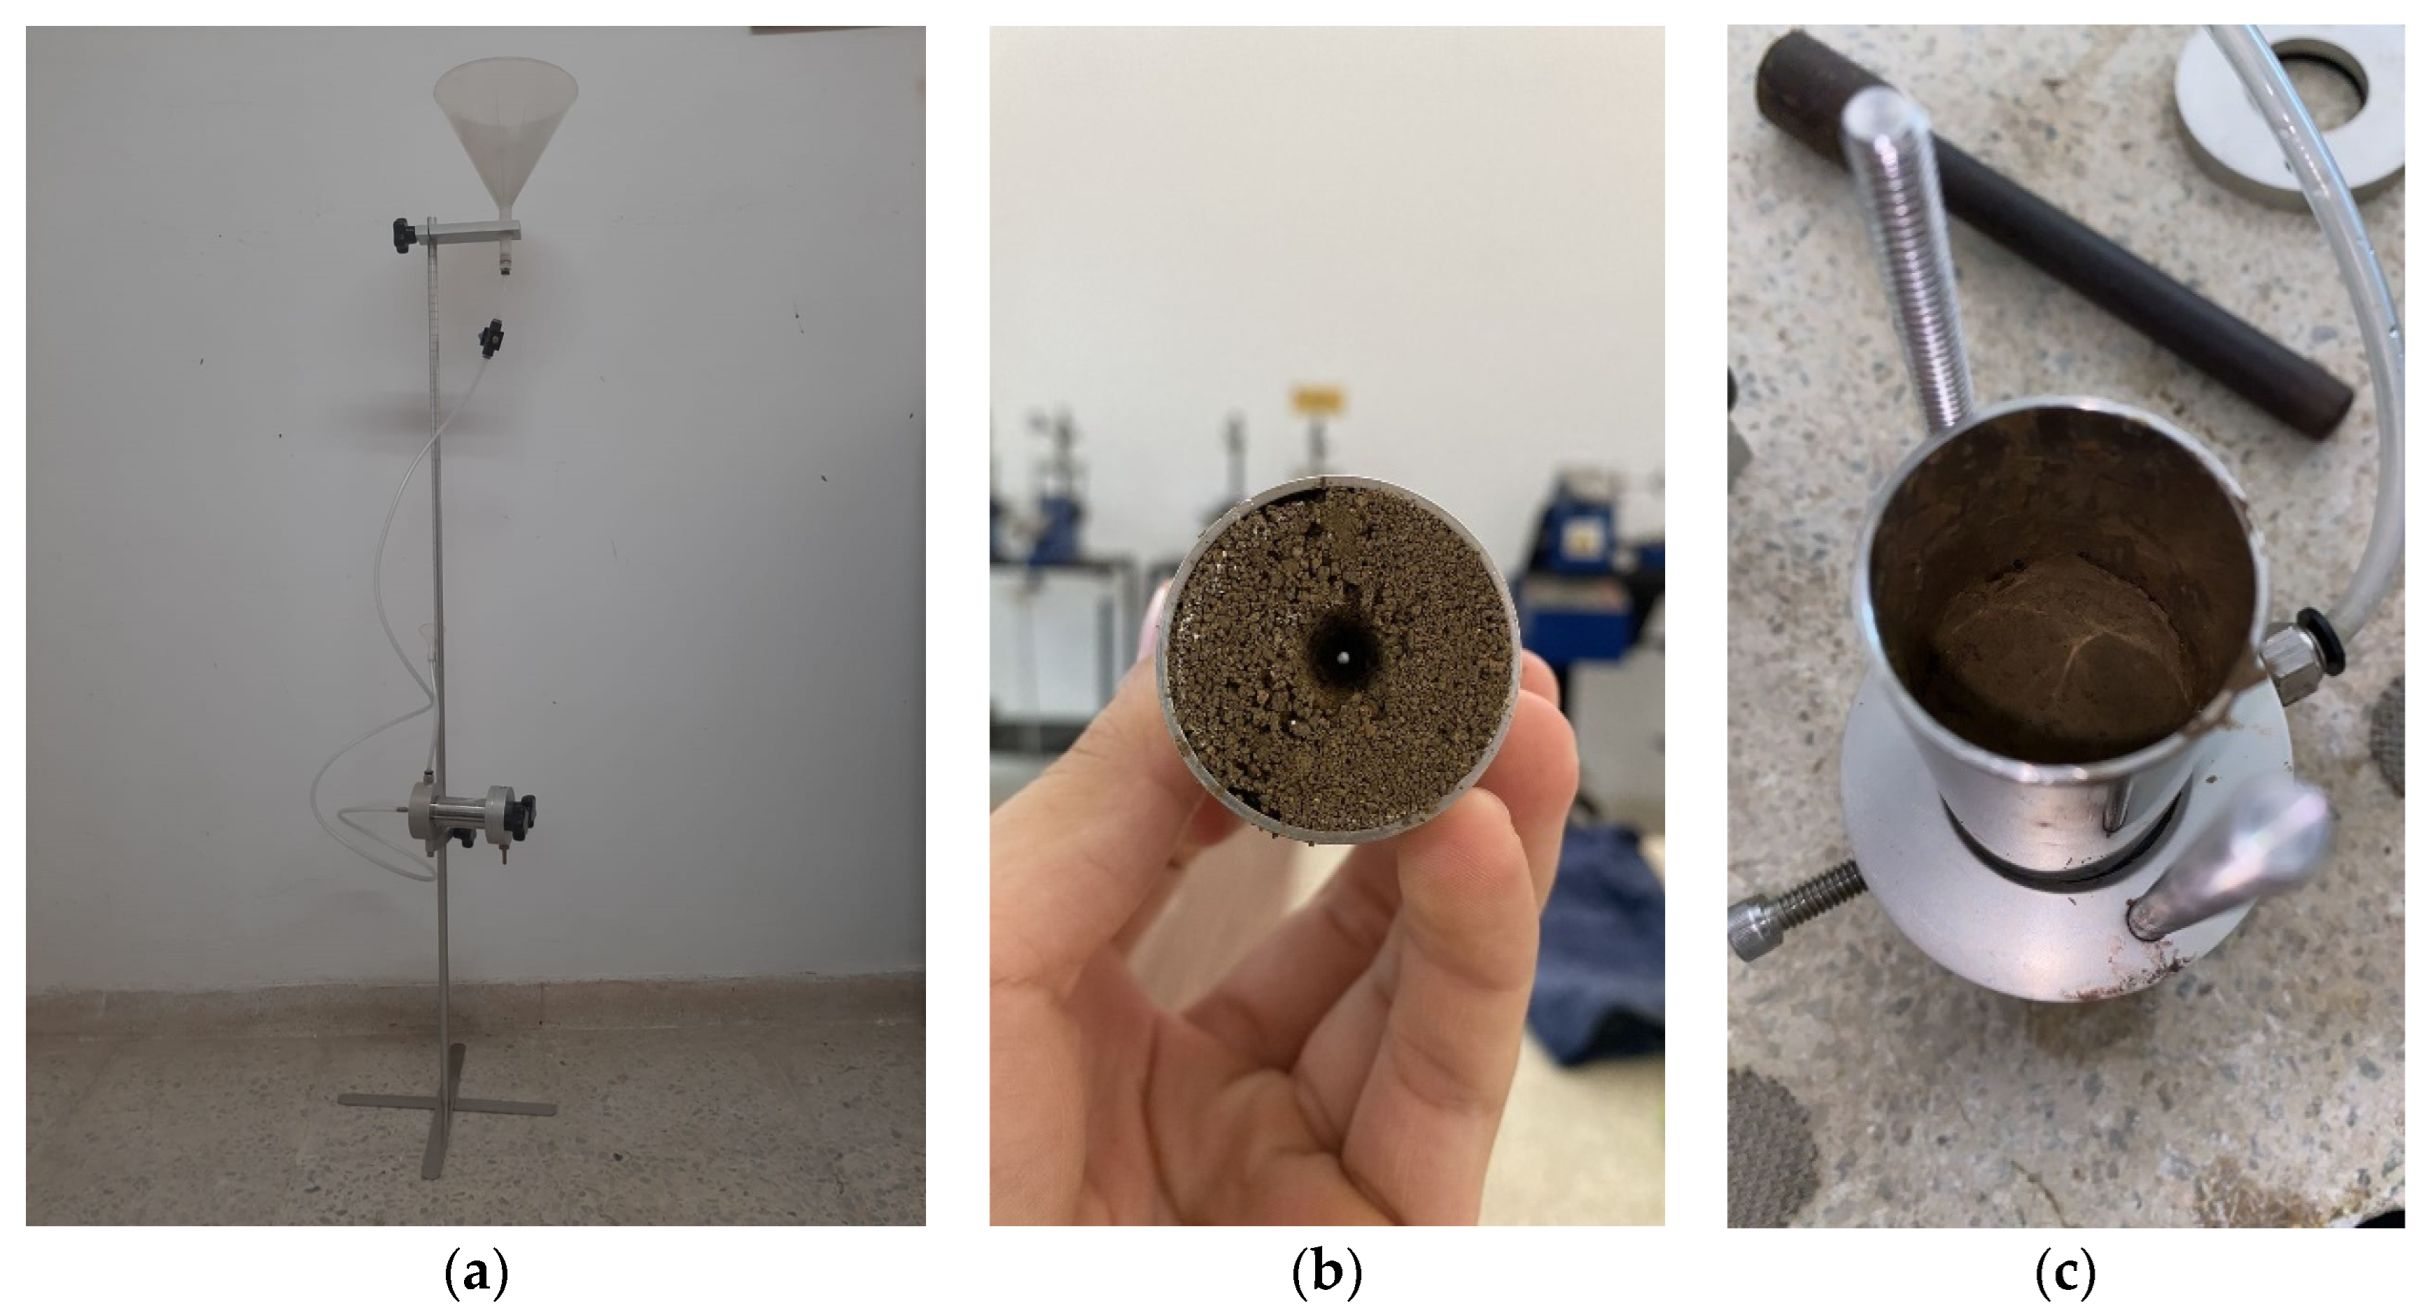
The molding of samples for the pinhole test tests was carried out in a cylindrical steel mold with sufficient dimensions to make samples with a diameter of 33 mm and a height of 38 mm. The two specimens were molded by weighing, mixing, compacting, demolding, conditioning, and storage. After mixing only with distilled water, the amount necessary for making a specimen was divided into five equal parts, stored in capsules, and in turn in containers with a lid to avoid moisture loss for subsequent manual compaction.
After molding, the specimen was promptly weighed inside the mold, using its tare weight to obtain its precise mass. Then it was conditioned in a plastic bag suitably identified and sealed to avoid significant variations in the moisture content.
Figure 3 shows the aspect of a specimen molded according to the procedures described above. In addition, the characteristics of the filter material also followed the recommendations of the American standard ASTM D 4647.
In pinhole test assays, the susceptibility to dispersion is evaluated regarding the appearance variations and the volumes of distilled water through a small tube made axially through a standard specimen. The test result gives the main difference between only dispersive and non-dispersive on a hydraulic head of 50 mm. If the water that flowed through the hole under this charge is visibly turbid and will not become clear with time, it is shown to be classified as dispersive. The extent of dispersibility is impacted by the magnitude of water turbidity and the duration of its occurrence. The susceptibility to dispersion is assessed by classifying the soils into six patterns, ranging from non-dispersive (class ND1) to strongly dispersive (class D1).
The pinhole test is conducted by circulating water flow through a small hole (1 mm in diameter) drilled in a soil sample under heads ranging from 50 to 1020 mm. Distilled water is forced to flow through the soil sample for 5 to 10 min under each value of H. The test is conducted by gradually increasing H from 50, 180, and 380 to 1020 mm. The applied hydraulic heads were chosen as convenient for laboratory use because they generate flow velocities (0.305–3.05 m/s) that approach the initial velocity that might be expected in leaks within earth dams and other structures [
13].
The second part of the experimental program, which featured the undisturbed samples, continued with the ASTM D4647 [
6]. The specimen intended for testing was manually shaped with a cylinder and a scalpel, carving it by hand to achieve a geometry that minimized the potential for fluid flow water to leak into undesired places. The goal was to preserve the initial characteristics of the sample and prevent any alteration that could impact the test results. Subsequently, several portions of the same soil were taken to determine its natural moisture content, remembering that these samples were wrapped in film paper and stored in a polyester refrigerator in the humid room of the laboratory to work with the actual natural moisture content close to that of the extraction site at the proper time.
After extracting the specimen (either undisturbed or disturbed), the final hole’s diameter was measured using a scaler. To perform this measurement, the extracted specimen was halved with great care.
2.5. Crumb Tests
The test may indicate that dispersion does not occur, and the soil may have a dispersive behavior. In the test, three beakers with a capacity of 200 mL are used, filled with 150 mL of distilled water, with the option of also using a sodium hydroxide solution with a concentration of 1 meq/L. Clods of approximately spherical shape are placed in these containers, with diameters between 6 mm and 10 mm, prepared from undisturbed samples or compacted specimens according to field conditions. After resting for 1 h, the reactions are observed, and the degree of dispersion corresponding to the sample is assigned.
The crumb test is a work methodology to determine the fine-grained soil dispersivity degree, regulated by the American standard ASTM D 6572 [
9]. It is a considerably simple test compared to the pinhole test as it only consists of taking lumps of the study material with the approximate shape of a cube of 15 ± 5 mm on each side to introduce each lump into a respective beaker with 250 mL of distilled water, evaluating its degree of dispersibility at 2 min and 1 h after submersion.
The test comprised an investigation of two disturbed and two undisturbed soil samples. The altered samples were dried and passed through a No. 10 sieve before being moistened to form cube-shaped clods measuring 1 cm on each side. On the other hand, the undisturbed samples were collected by extracting them from a representative area of the original sample. The effects of disturbance and alteration in the soil’s properties were evaluated by analyzing these samples.
Furthermore, the moisture percentages of each sample were recorded prior to submergence. For each sample type (unaltered and altered), a cube-shaped clod was precisely molded or cut, as well as another clod with a considerably irregular shape. Therefore, it is essential to highlight that this methodology will only be used to compare its results with those obtained in the pinhole test as a test to verify the dispersive behavior of the sample due to the degree of imprecision observed in its classification methodology.
The crumb test classifies the degree of dispersivity as follows: Grade 1 (non-dispersive): there is no reaction. Observations reveal that, despite the clod being separated into its constituent materials, there are no visible indications of turbidity in the surrounding water (ASTM, 2021). Grade 2 (intermediate): slight reaction of the material with the distilled water, a trace of minimally visible turbidity is observed, a product of the material detached from the lump. Grade 3 (dispersive): moderate reaction; easily visible turbidity, forming a cloud of suspended material around the sample. Similarly, it is observed that the lump extends across the surface of the container, considerably losing its original shape. Grade 4 (highly dispersive): strong reaction; the suspended material that generates turbidity produces a dense cloud that covers the entire container, making it impossible to differentiate between the loose material and the introduced clod [
9].
3. Results
3.1. Geotechnical Characterization of Marine Clays
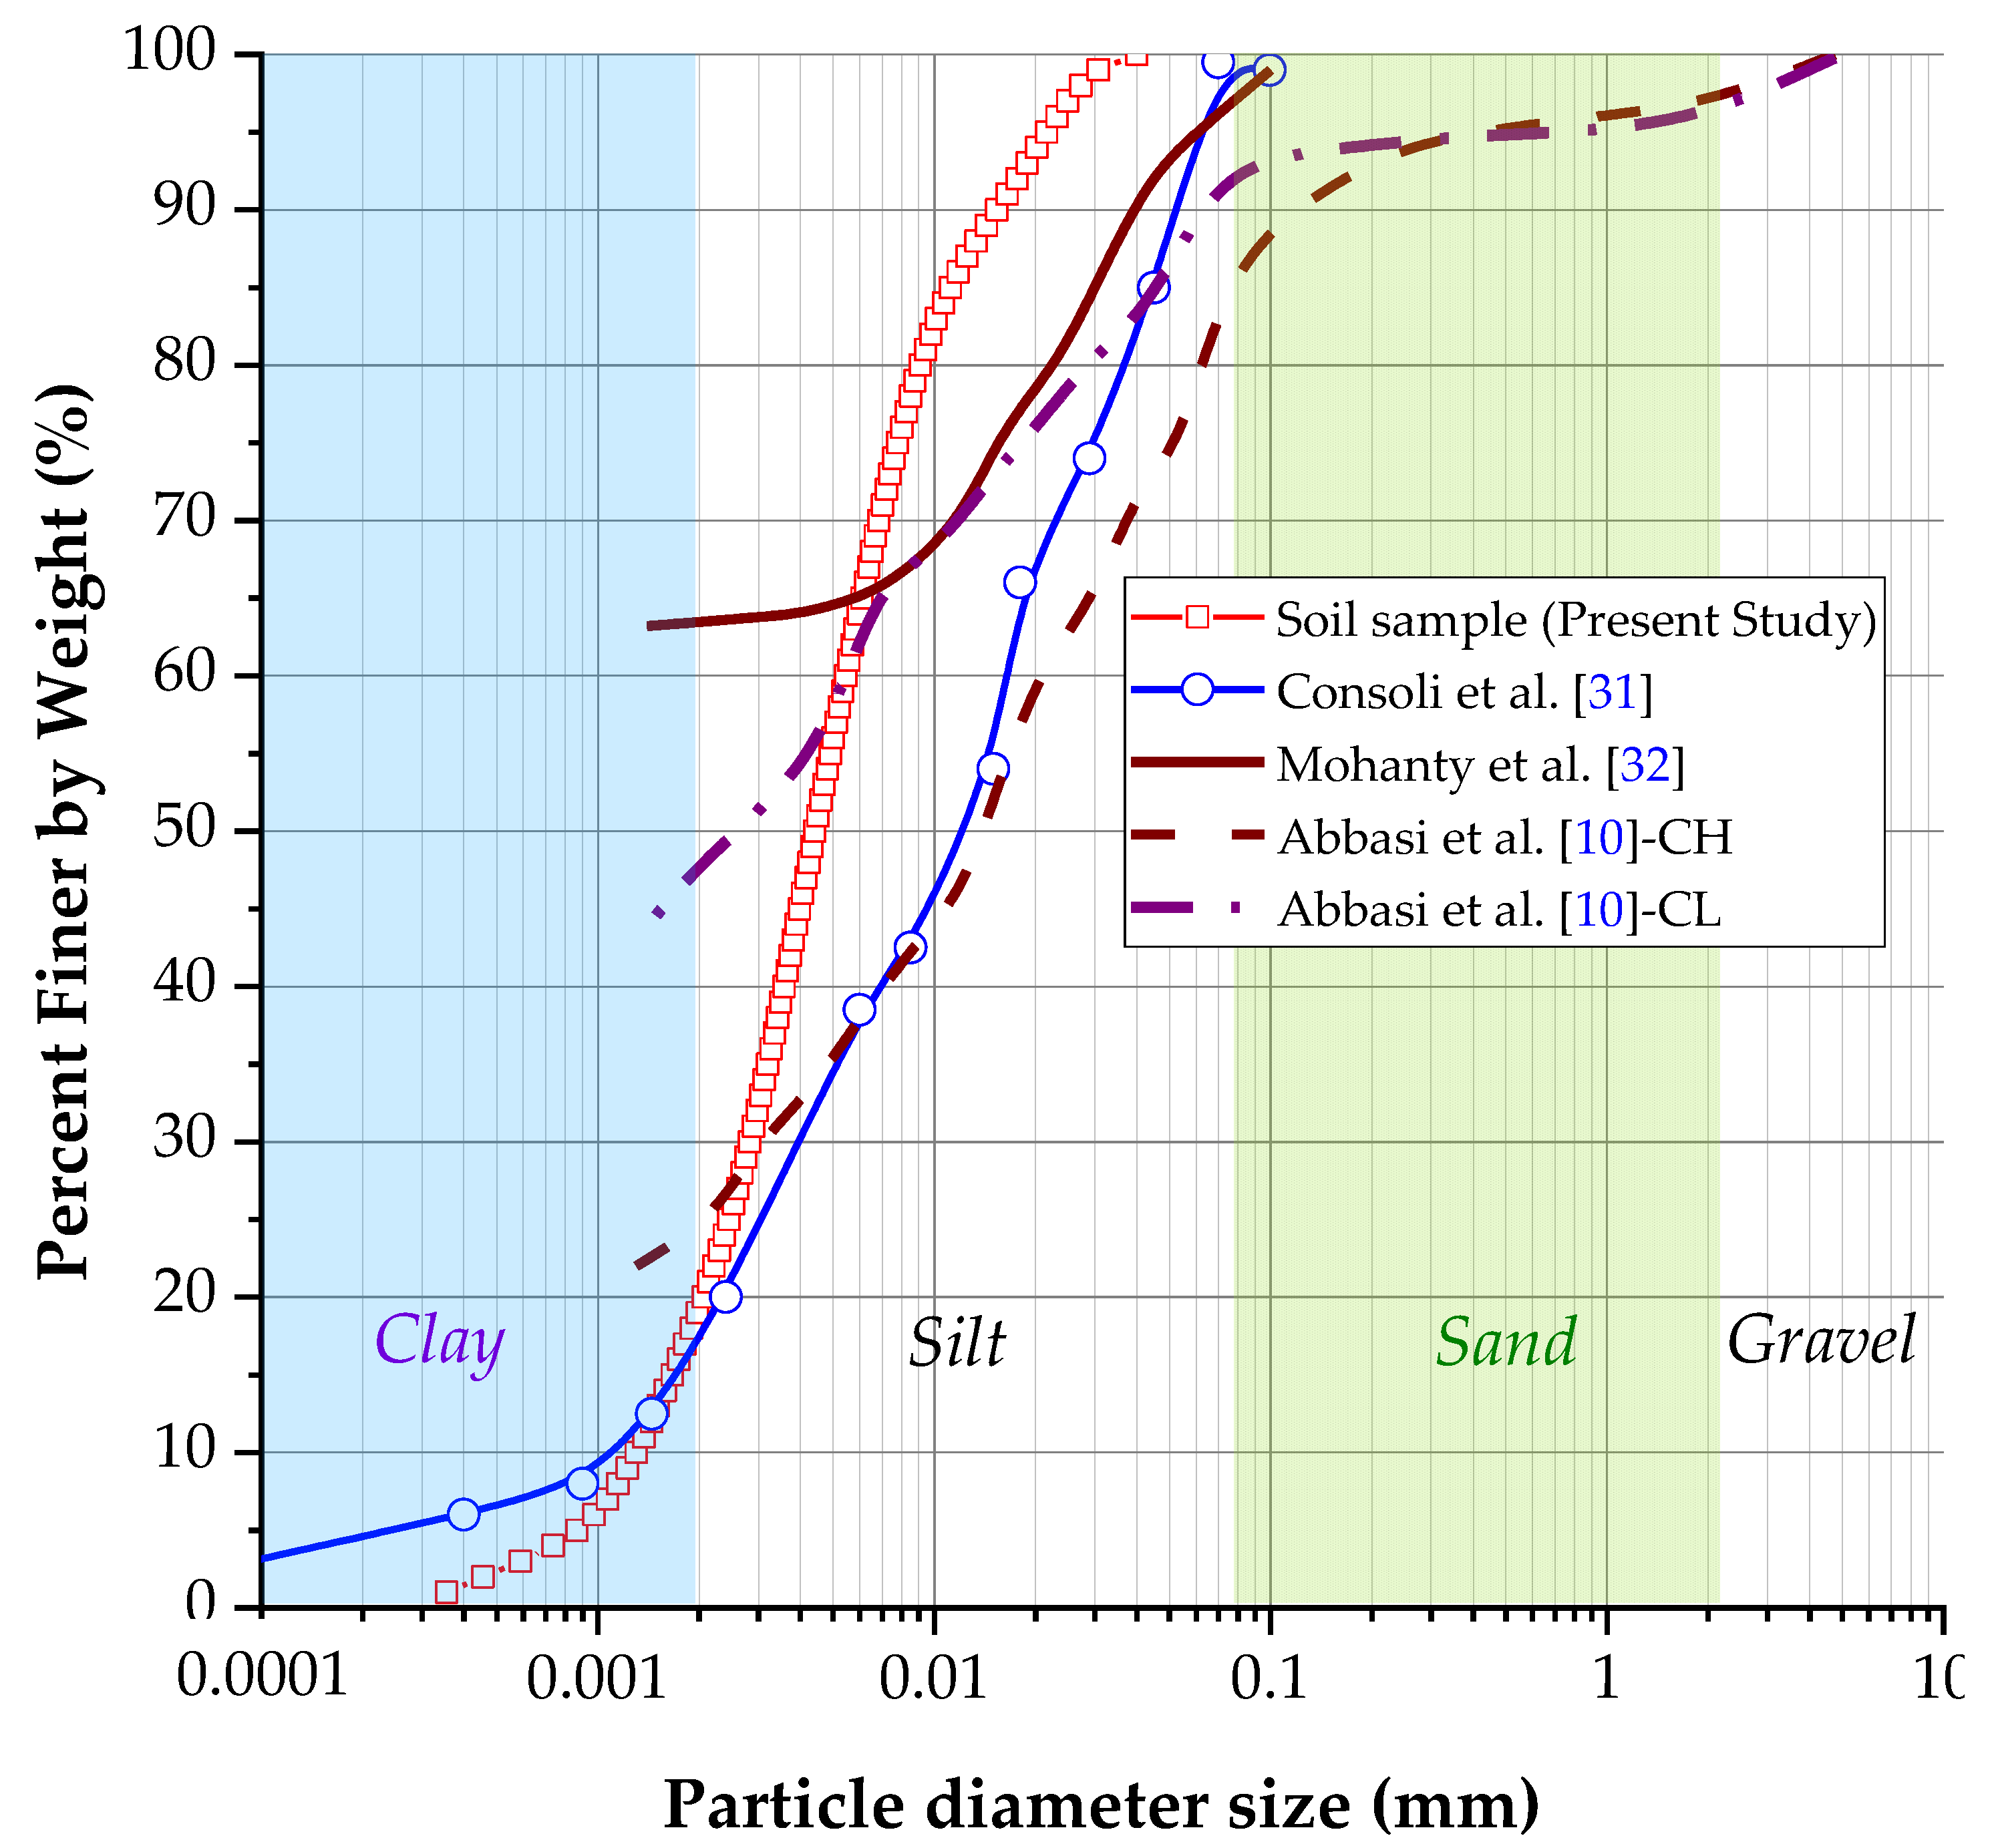
Figure 4 displays the granulometric curve of soil samples. The particle diameter size was measured with a laser method. The graph shows that the soil comprises 80% silt and 20% clay in concordance with the MIT (Massachusetts Institute of Technology) classification. However, under ASTM D2487, the soil contains 100% clay particles (diameter smaller than 0.002 mm). Following the USCS, the soil sample consists of high-plasticity clay (CH). The liquid limit was 64.76%, and the plastic limit was 36.87%. Thus, the plasticity index was calculated as 27.89%. Based on the sample’s plasticity index result, the studies conducted on clayey soils by Nagy et al. [
27] established that the dispersive soils (D1–D2) are primarily clay soils with medium to high plasticity. In addition, they exhibit plasticity indices ranging from 23.3% to 34.4%. Similarly, clays with medium to high plasticity and plasticity indices between 28.6% to 35.1% were observed in soils with intermediate dispersivity (ND3–ND4). Given these findings, it can be inferred that the soil under investigation for this project will likely exhibit some degree of dispersivity based on its plasticity index. About the granulometric curve, the uniformity coefficient (C
u = 4.31) and curvature coefficient (C
c = 1.08) were obtained for the studied soil. Based on the above results, it is possible to establish that the studied soil is well graded or classified since C
u > 4 and 1 ≥ C
c ≤ 3, which is manifested in the granulometric curve, where the sizes of particles are distributed in a wide range (C
u), resulting in the smoothed curve that shows the uniformity of size distribution (C
c). After determining the specific gravity of the study material, an average value of 2.61 was obtained. This result falls within the expected range of 2.6 to 2.8 for this type of test [
10,
11,
15], (
Table 1).
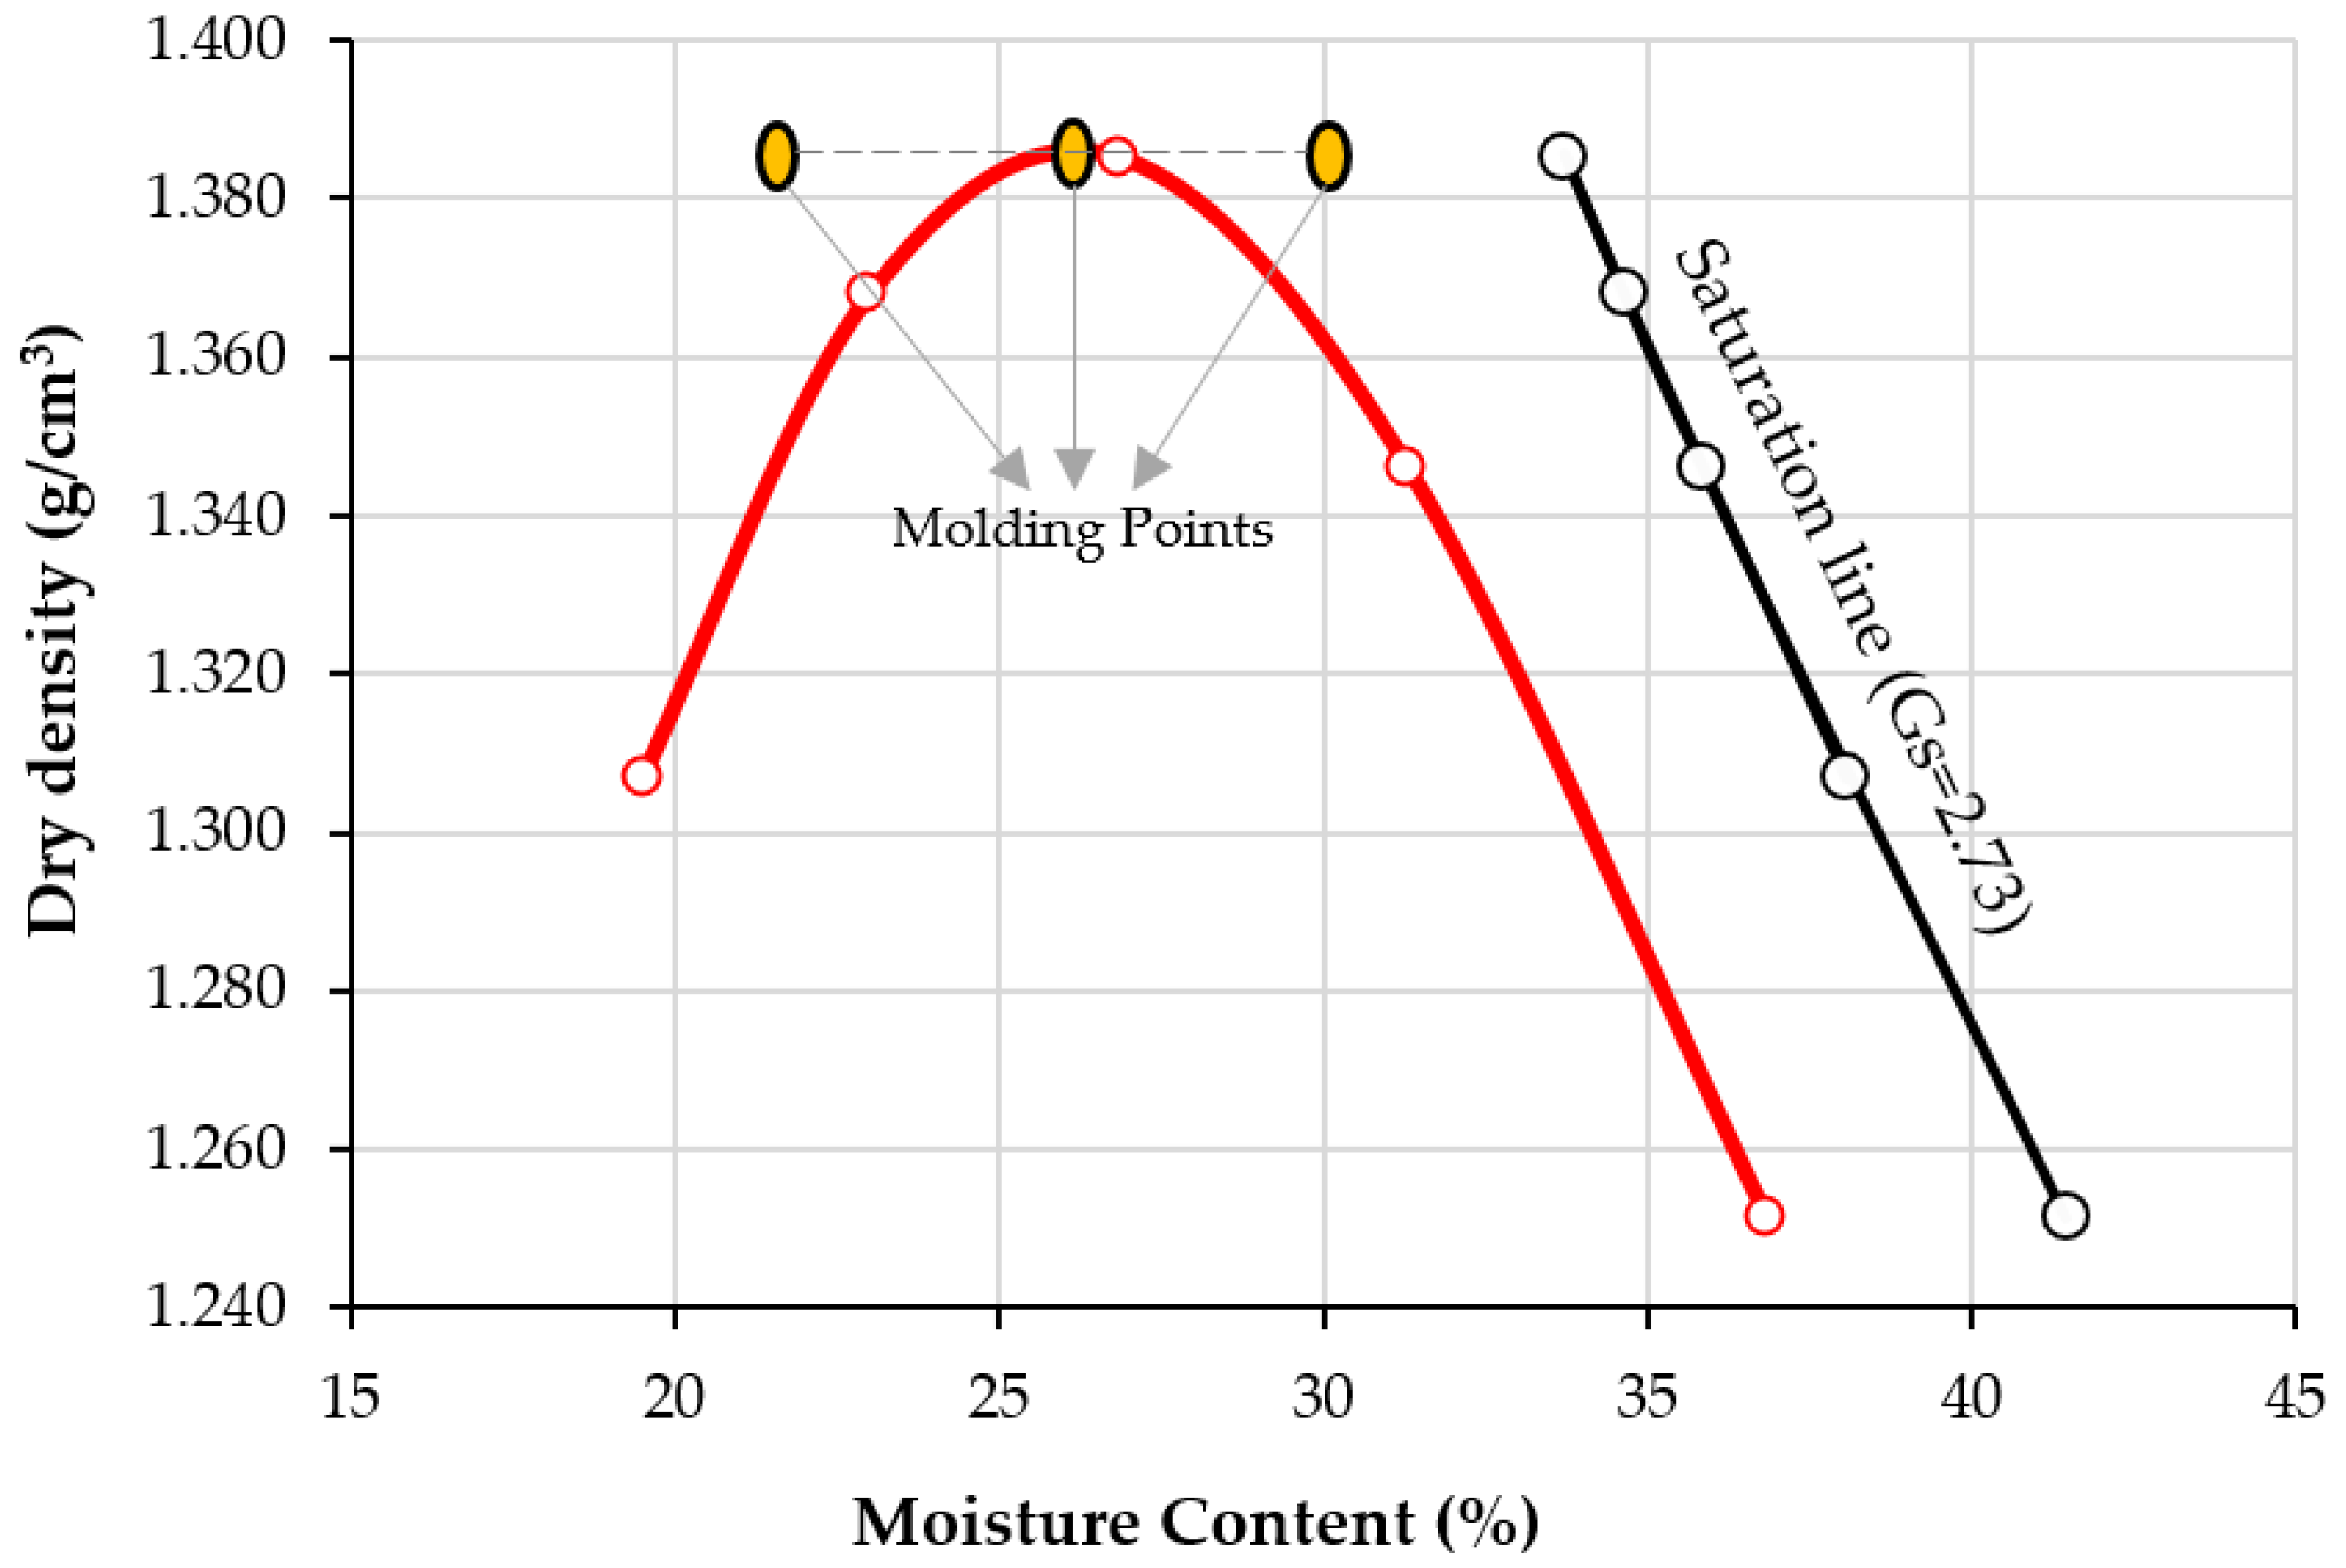
Figure 5 presents the compaction curve of soil under standard effort. The optimum water content of the soil is calculated as 26%, and the maximum dry unit weight is 13.87 kN/m
3. In addition,
Figure 5 defines the molding points for compacting the specimens to the dispersivity test (pinhole and crumb). The dry molding density is 1.387 g/cm
3, and the water content varies from 22%, 26%, and 30%. Moisture content influences the dispersivity behavior of soils. When the particles are brought together by drying, they are well-bonded together. By increasing the moisture content of the soil, the distance between particles that favors dispersion increases [
2,
3,
19,
31].
Figure 4.
The granulometric curve of soil sample compared with previous studies about dispersive soils related in the literature.
Figure 4.
The granulometric curve of soil sample compared with previous studies about dispersive soils related in the literature.
Figure 4 also plotted the granulometric curve of soil with other soil particle size distribution in terms of diameter, for example, soil studied by Consoli et al. [
32], Mahanty et al. [
33], and Abbasi et al. [
10]. All dispersive soils have a high percentage of fine material. The soils analyzed in previous studies exhibit a much higher percentage of clay than the soil under the present investigation. Although all the plotted curves in
Figure 4 contain a dispersive soil, because different methods were used to determine the granulometric size distribution, it cannot be concluded that the soil studied in the present study has dispersity.
3.2. Chemical Microanalysis and Microstructure of Clays
The soil’s chemical composition results obtained by the X-ray fluorescence (XRF) method are shown below in
Table 2. It is observed that the XRF analysis method did not detect the presence of the sodium element (Na), possibly due to the specific sodium deficiency in the samples tested (less than 0.4%) or due to the level of sensitivity and precision it possesses.
Analyzing
Figure 6 and
Figure 7, it is possible to appreciate the detail level achieved in the present methodology, specifically for
Figure 7, where the sample is observed at a scale 20,000 times folder than that typically visualized in the microscope. Likewise, it should be noted that in sampling carried out by the SEM-EDX, based on the laboratory’s recommendations, five points were selected to measure the energy spectra emanating from the elements of the studied soil, resulting in the values represented in
Table 3.
As it is possible to observe, the present chemical analysis method yielded a more significant number of results in comparison to those obtained by XRF, where, as in the referred method, the presence of characteristic elements of the clay was detected, such as silica (Si), potassium (K), and calcium (Ca).
Considering the other elements detected, two stand out: magnesium (Mg), which is characteristic of clayey elements, and sodium (Na), which demonstrates the level of precision and detail of the present method. The sodium content in the average dispersivity corresponding to grades ND4 and ND3 ranges between 1.82 and 3.53%. The value achieved is in the soil characterization range as moderately dispersive, so it can be concluded, even without performing the pinhole test, that according to the sodium levels, some degree of medium dispersivity (ND4–ND3) should manifest in the studied soil. However, it is essential to establish that these results, so far, only serve as possible indicators since, with the current information, it is impossible to ascertain the absolute degree of dispersivity without performing the pinhole test.
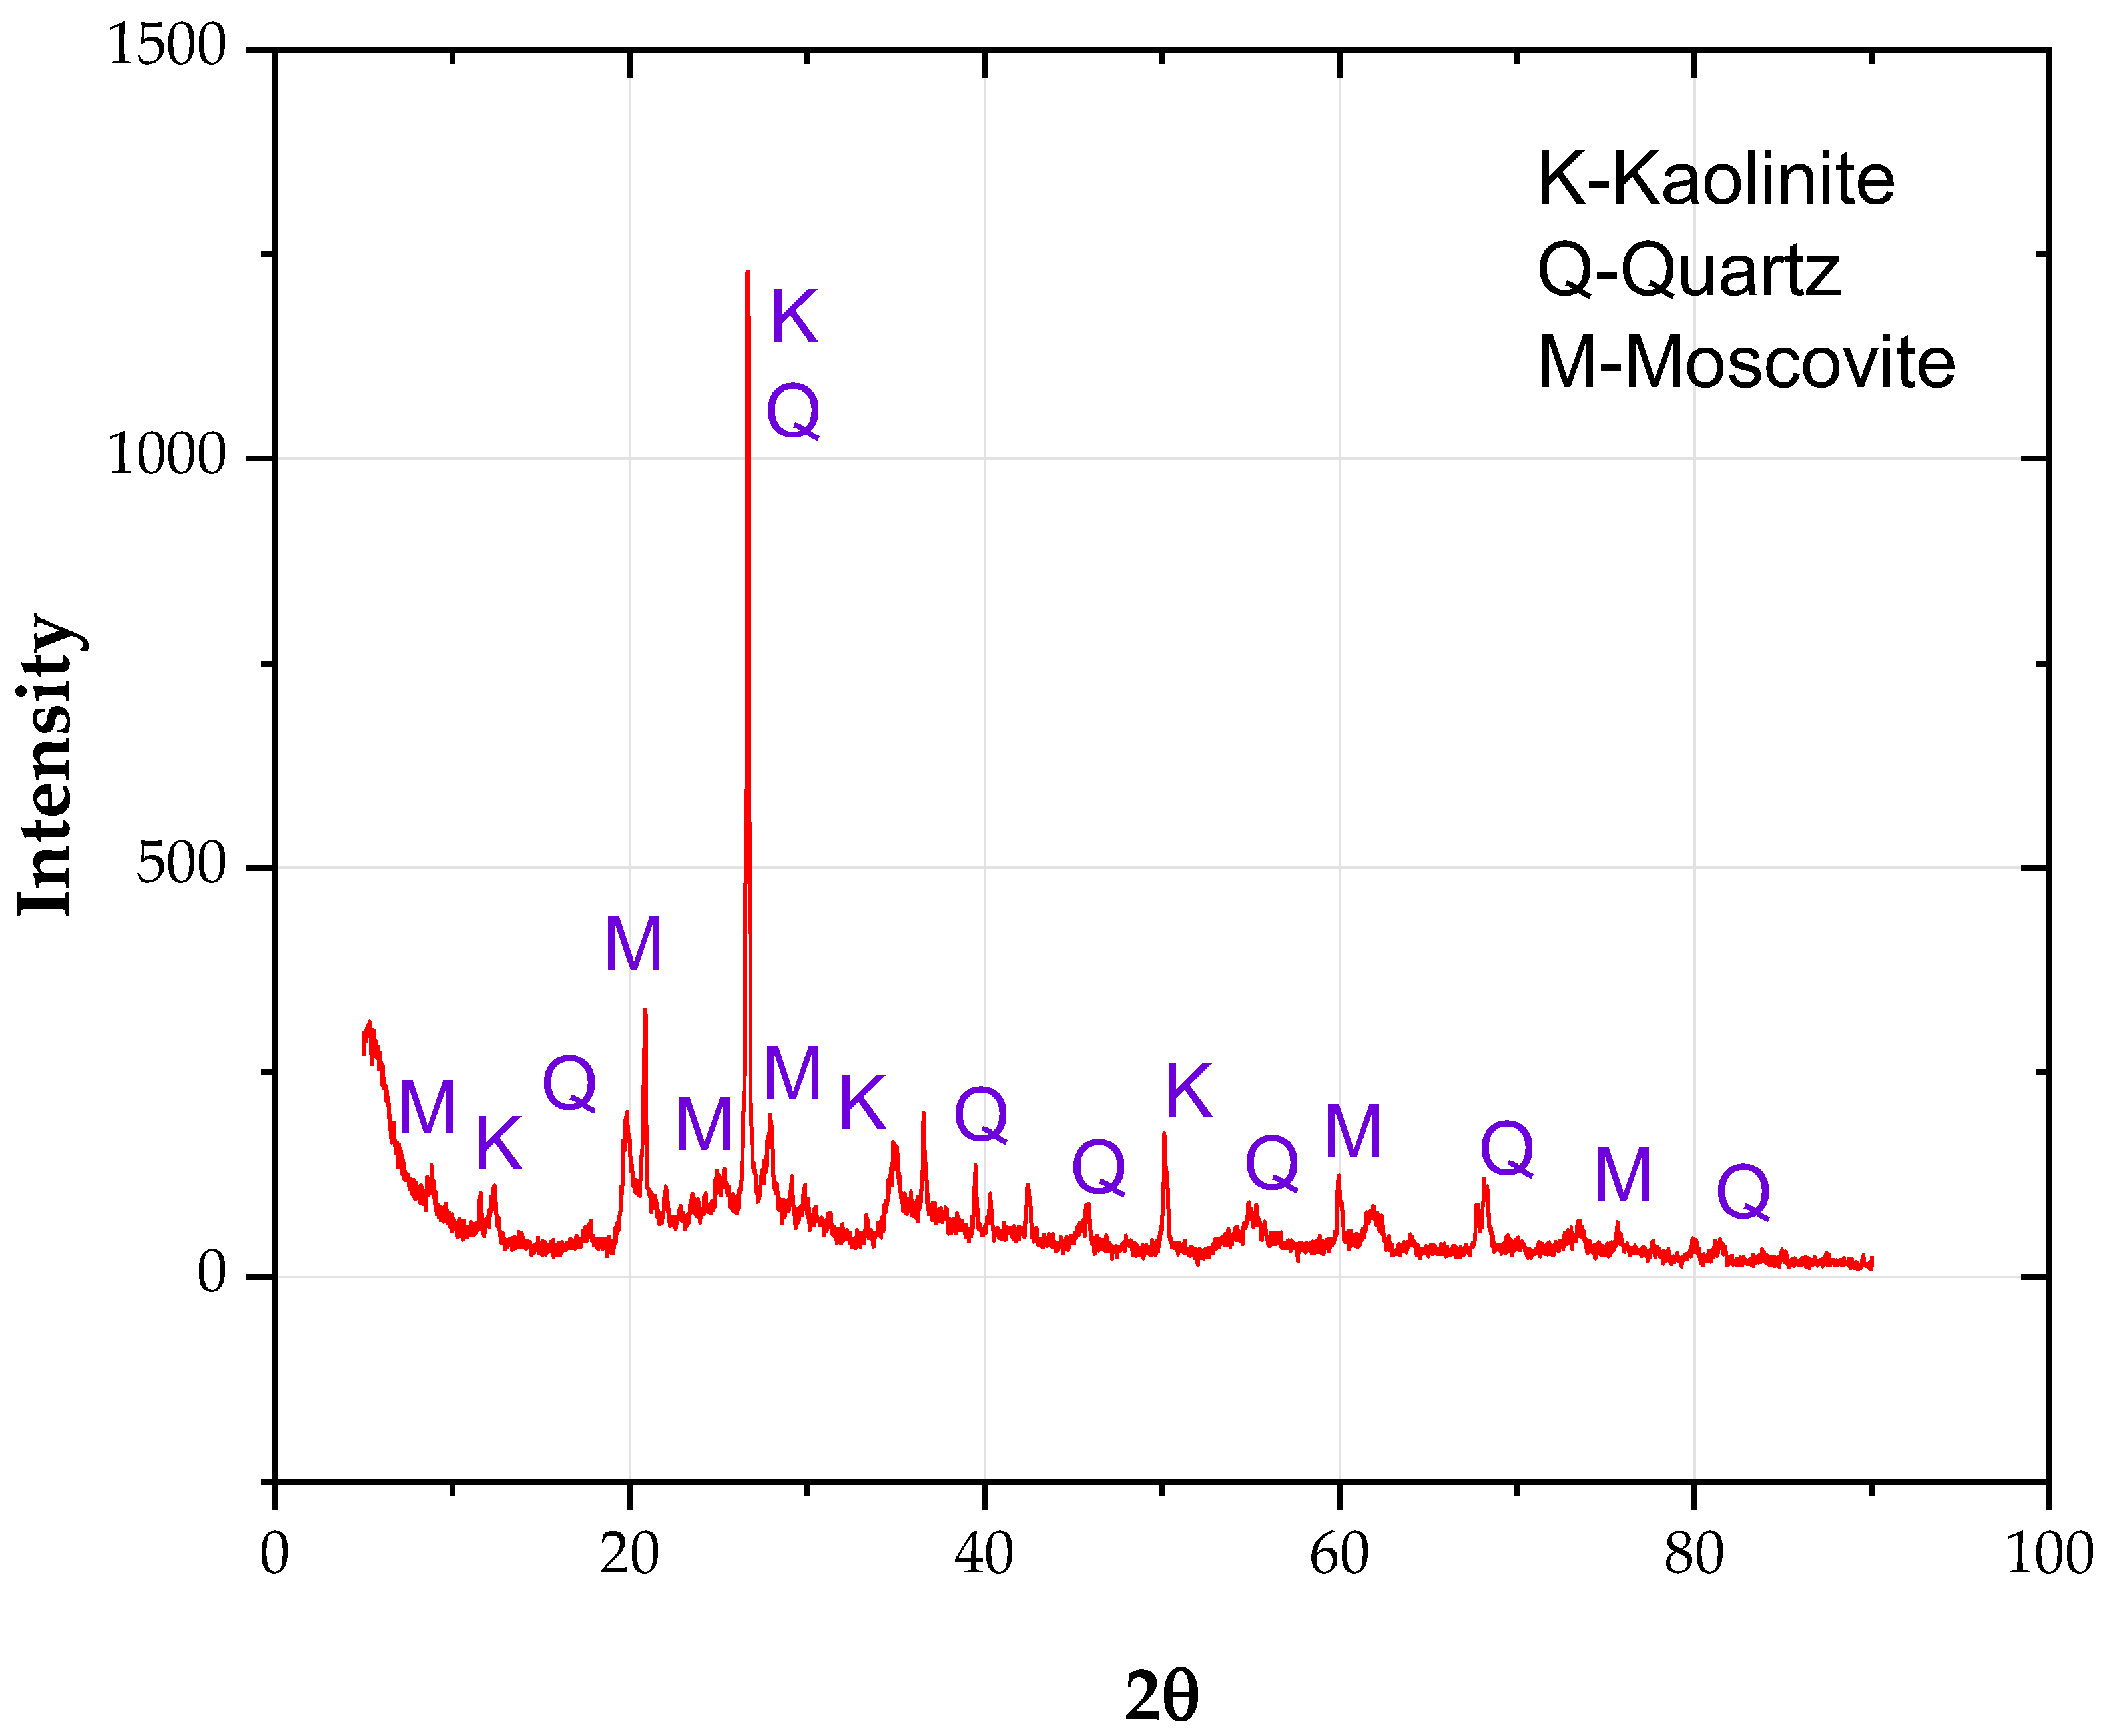
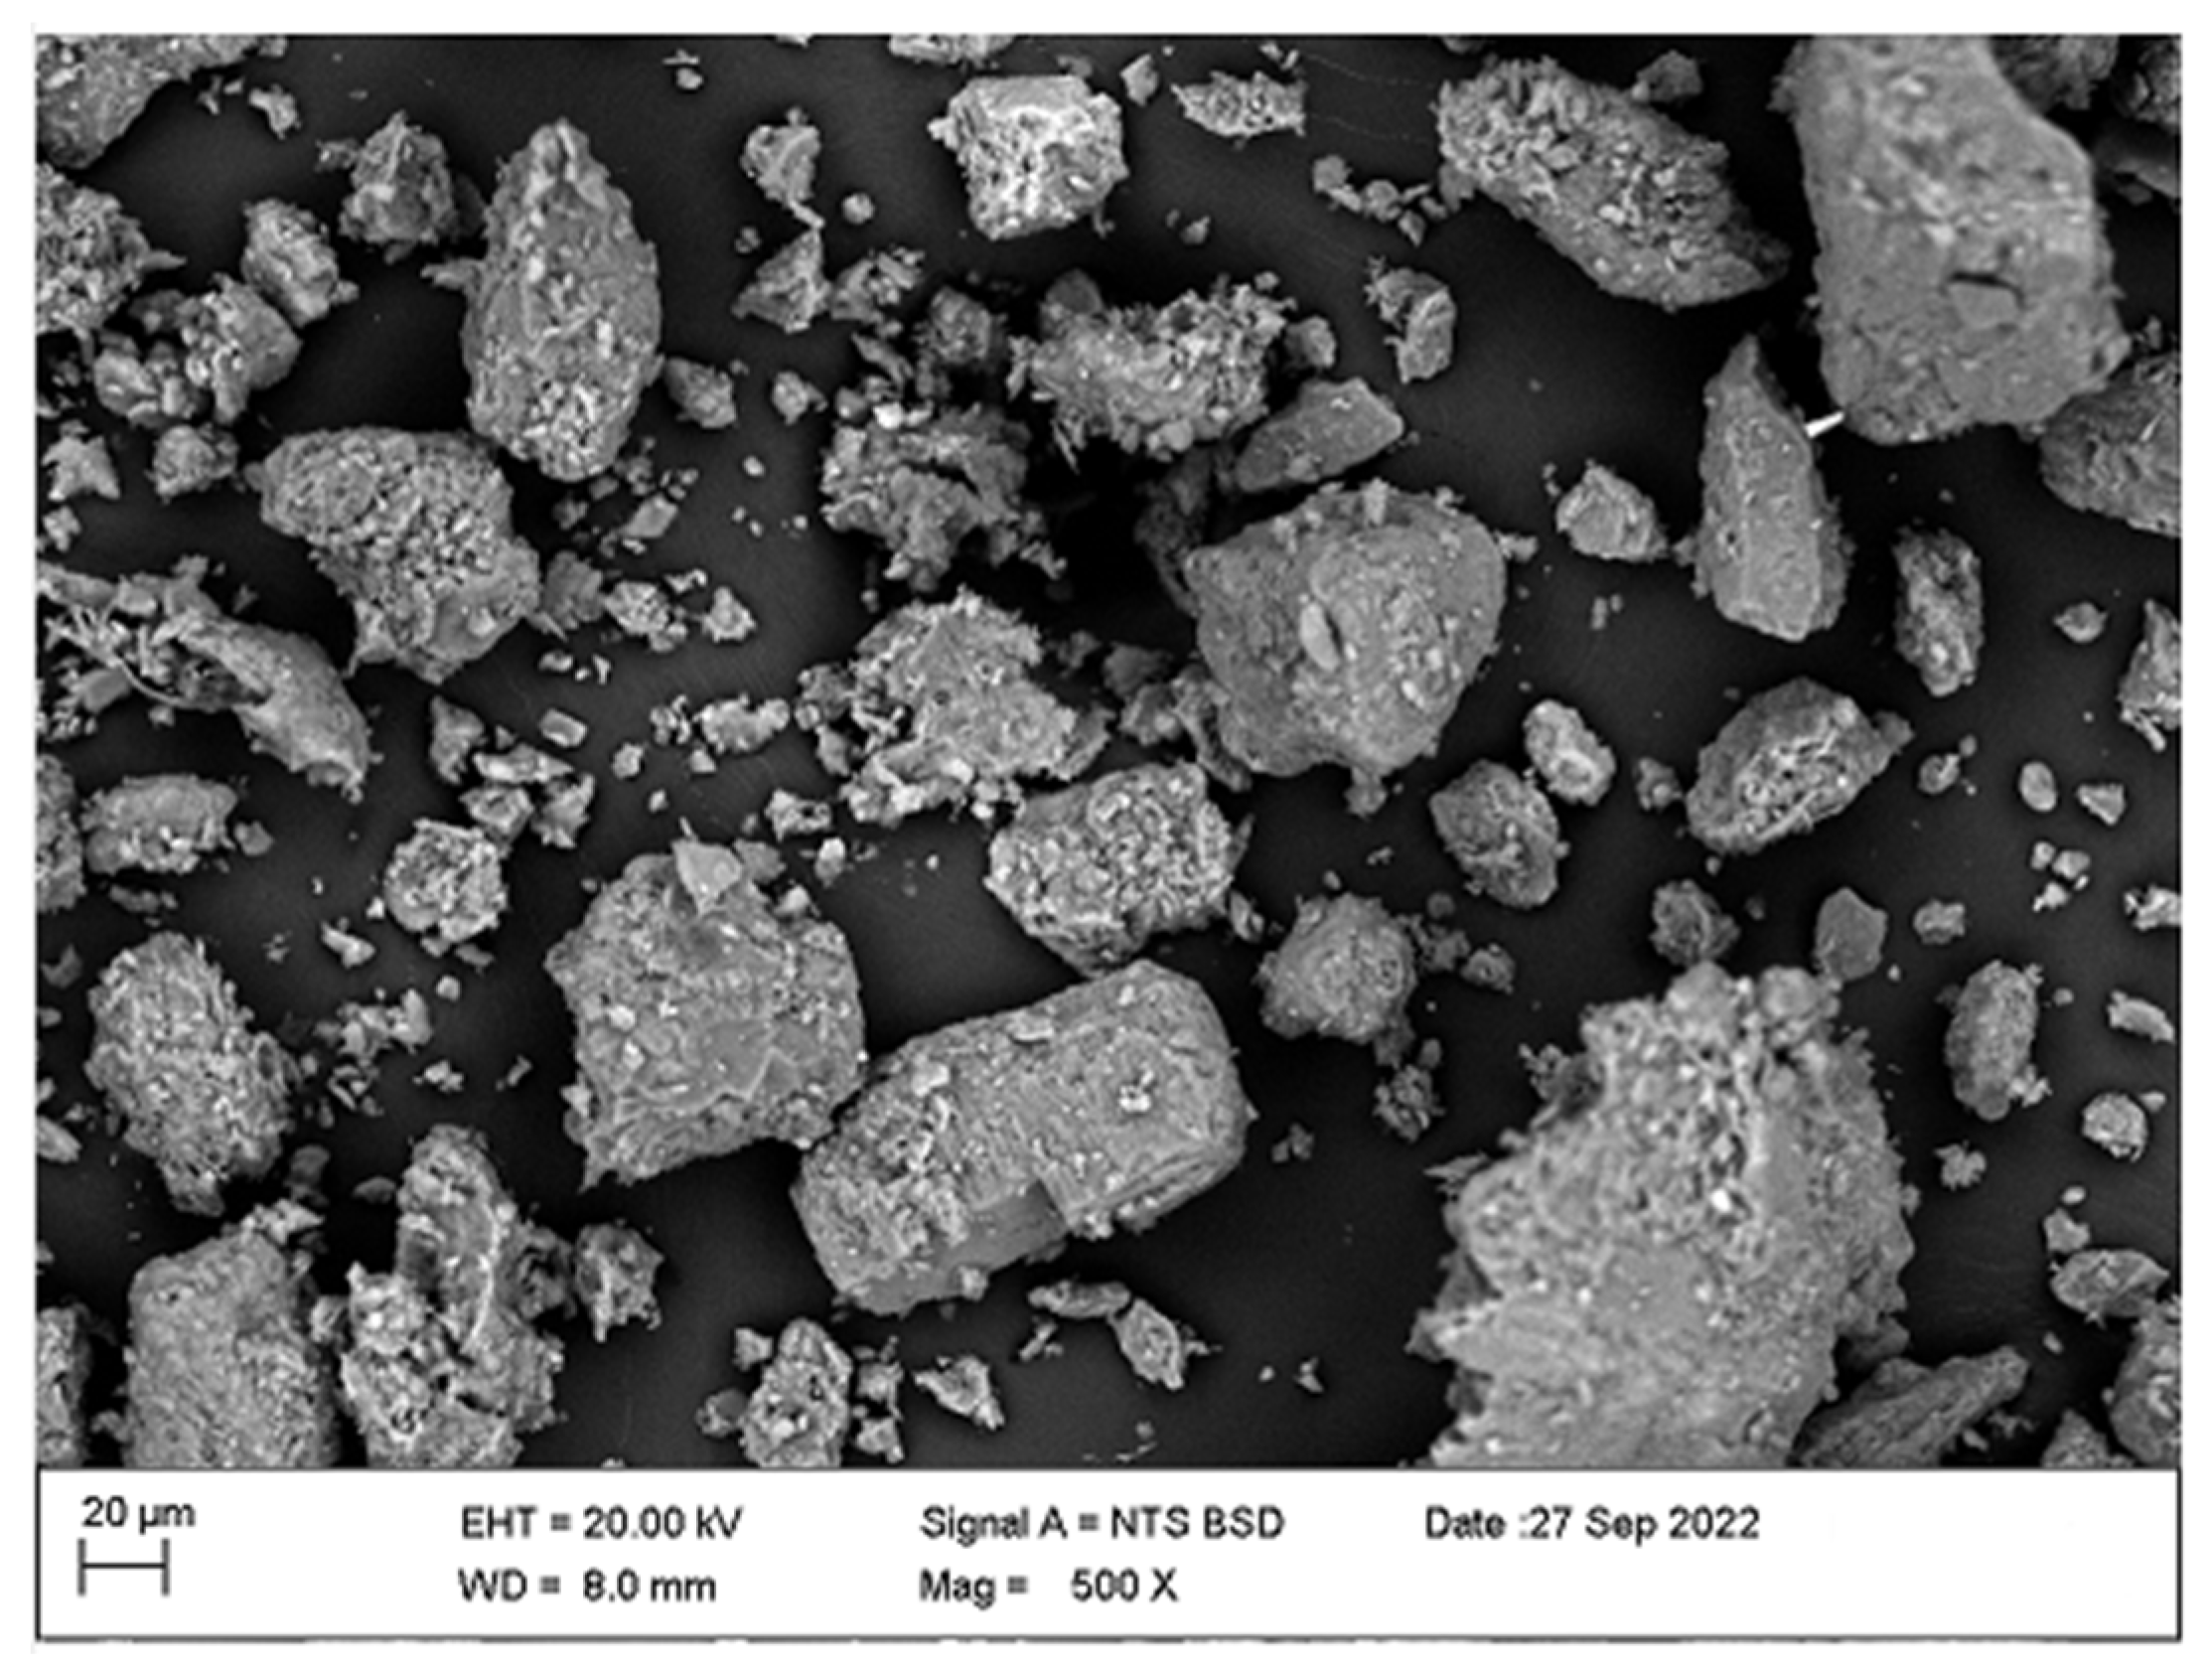
SEM microphotographs (
Figure 8 and
Figure 9) show muscovite aggregates with compact surfaces and a wide range of sizes. In the minor aggregates, the typical laminar aspect of these phyllosilicates is clearly observed in
Figure 6 and
Figure 7, in addition to silica-rich aggregates corresponding to quartz.
Figure 6 presents the X-ray diffraction (XRD) of the soil sample. Kaolinite, quartz, and muscovite phases were detected. Kaolinite is structurally different from montmorillonite, as the former consists of thicker individual sheets, making them more susceptible to pH changes by decomposing loads at the edges.
3.3. Pinhole Test Results
Table 4 presents results consistent with the soil’s characterization as slightly to moderately dispersive (ND3). The collected effluent was only slightly visible during the initial 5 min test period under a 5 cm pressure head, with volumetric flows mostly below 0.4 mL/s. The pressure head was increased to 18 cm, where the effluent became moderately dark. These findings suggest that the soil exhibits characteristics of low-to-moderate dispersivity. Its volumetric flow increases rapidly between 1.92 to 2.27 mL/s, meeting the turbidity (distinctively dark) and flow (1.4 to 2.7 mL/s) requirements to be categorized as slightly to moderately dispersive (ND3). This outcome confirms the previously mentioned characterization, which added to the final hole diameter (3 cm) that meets the requirement of being 1.5 to 2 times larger than the original.
For the sample with a moisture content of 26% and a corresponding degree of compaction (as shown in
Table 5), an increase in volumetric flow was observed for both tested pressure heads compared to the previous test. However, as with 22% of moisture, the 5 cm pressure head was not enough to generate effluents with significantly darker degrees of turbidity, despite the significant increase in flow. Consecutively, when using the 18 cm head, the turbidity of the effluents became moderately dark, with flows between 2.23 and 2.77 mL/s, which correspond to those of soil categorized as slightly to moderately dispersive (ND3), as well as the final hole diameter that presented the same increase as in the previous test. However, it is essential to highlight that, despite the two samples tested so far having the same dispersivity degree, the 22% moisture content results showed darker turbidity degrees.
Samples with 30% moisture showed lower volumetric flows than those obtained for samples with other moisture levels, except for samples with 22% moisture content, whose flow values were the lowest observed (
Table 6). In contrast to the previous test results, the 5 cm and 18 cm pressure heads did not produce effluents with sufficiently high turbidity. Although the effluent obtained under the 18 cm pressure head met the volumetric flow requirements for the previous soil samples, it was necessary to use the 38 cm pressure head to obtain the desired turbidity degree. This resulted in a noticeable increase in the degree of turbidity of the effluent. In addition, volumetric flows between 3.33 to 3.84 mL/s were presented, which meet the requirements to be categorized as slightly dispersive (ND3) (1.8 to 3.2 mL/s). Similarly, when utilizing the 38 cm pressure head, it is anticipated that the turbidity levels observed in various effluents will be the most transparent among the three samples examined.
Table 7 shows that the first 5 cm hydraulic head remained slightly visible, and its flow rate was below the maximum to finish the test there. Therefore, it continued with the next 18 cm height, yielding values within the range established by the standard (ASTM D 4647) test guide. Consequently, the procedure was terminated there, qualifying it as slightly to moderately dispersive (ND3). The specimen was further opened to calculate its new diameter, after which it was weighed and placed in an oven for 48 h to determine its absolute water content. The absolute water content found in the sample was 34.96%.
According to the results obtained for the undisturbed sample with 38.87% natural moisture content (
Table 8), the pattern of proportionality between dispersivity and water content is again identified because, when its moisture content increases, the dispersivity classification was established as slightly dispersive (ND3). This fact is best evidenced by the following figures showing much clearer visibility than all previous tests. Furthermore, after the initial test, the moisture content of the undisturbed sample was measured and determined to be 41.95%.
Figure 9 depicts the water turbidity level following the pinhole test conducted with a head of 18 cm. The turbidity degree in the water is higher when the soil moisture is lower and increased for the compacted samples. The undisturbed samples’ turbidity degree is lower than the compacted ones. According to [
10], the primary reason for this is the inherent microstructure of the clay and the lower matric suction. In addition,
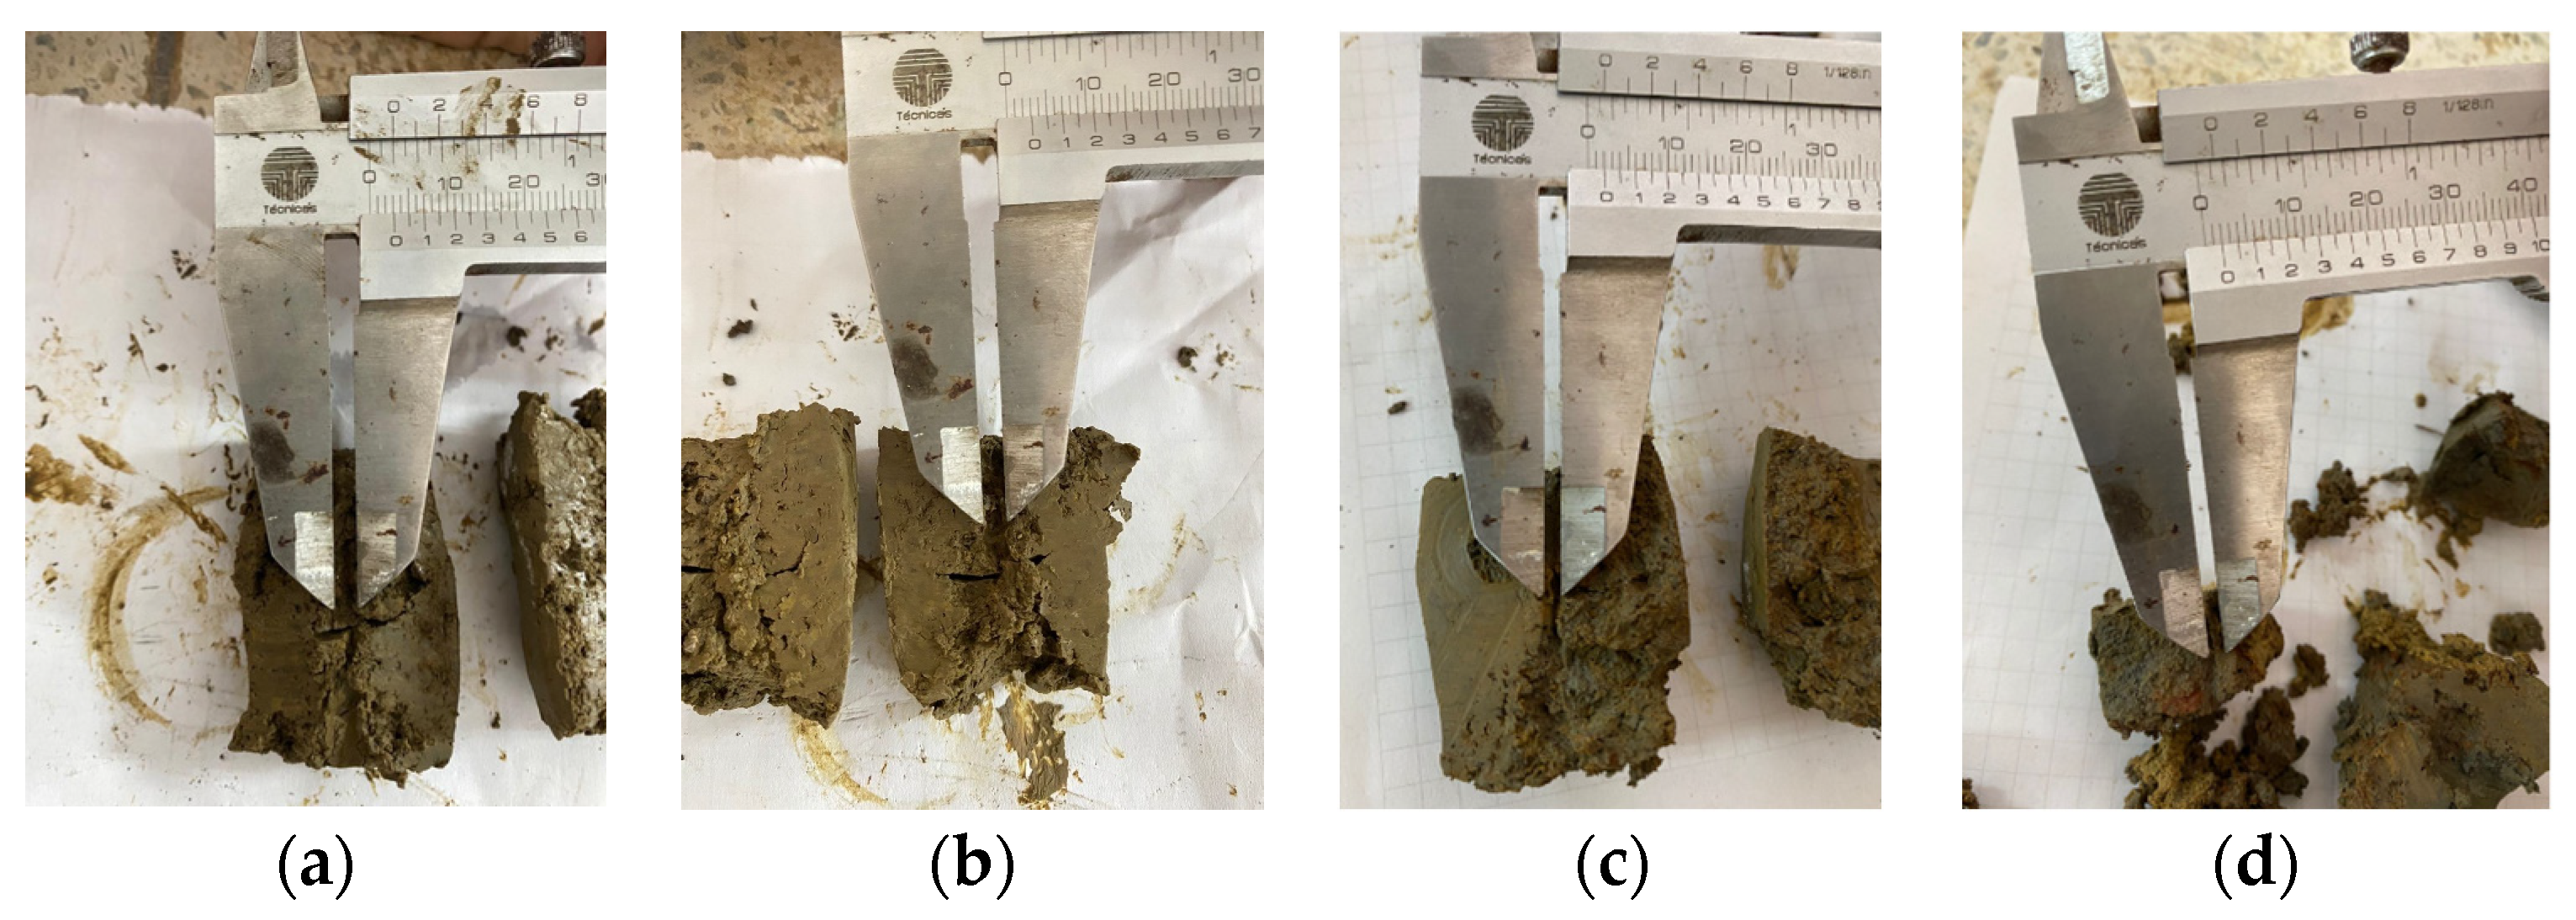
Figure 10 shows the final hole dimension of samples after the pinhole test. Because soil presents a moderate dispersivity, the hole increases due to erosion particles that remove the mass and dye the water (
Figure 9).
Considering other authors who used the pinhole test to determine the dispersivity of different soil samples using the three categorization factors (turbidity, flow, and final hole diameter), E. Nadal-Romero [
1] determined that two of four samples with apparently similar characteristics presented the dispersive category D2. In contrast, the remaining samples were categorized as ND4, which translates into lower flow values, lower digress of turbidity under the head of 5 mm, and smaller final hole diameters.
A different case to the one mentioned above is the one evidenced by Scheuermann Filho [
33,
34], where nine soils samples, initially categorized as ND4, were stabilized using ground glass and calcium carbide until obtaining dispersivities of an ND1 grade, which despite being tested under the 1020 mm head, did not yield any degree of turbidity, nor flow values consistent with those of a dispersive soil.
3.4. Crumb Tests Results
Based on the crumb test results, the disturbed samples had a moisture content percentage of 25.49%, while the undisturbed samples presented a significantly higher moisture content of 34.21%. Once the respective moisture content of each sample had been disclosed, the dispersivity degrees were found for the four samples after 2 min and 1 h submerged in distilled water.
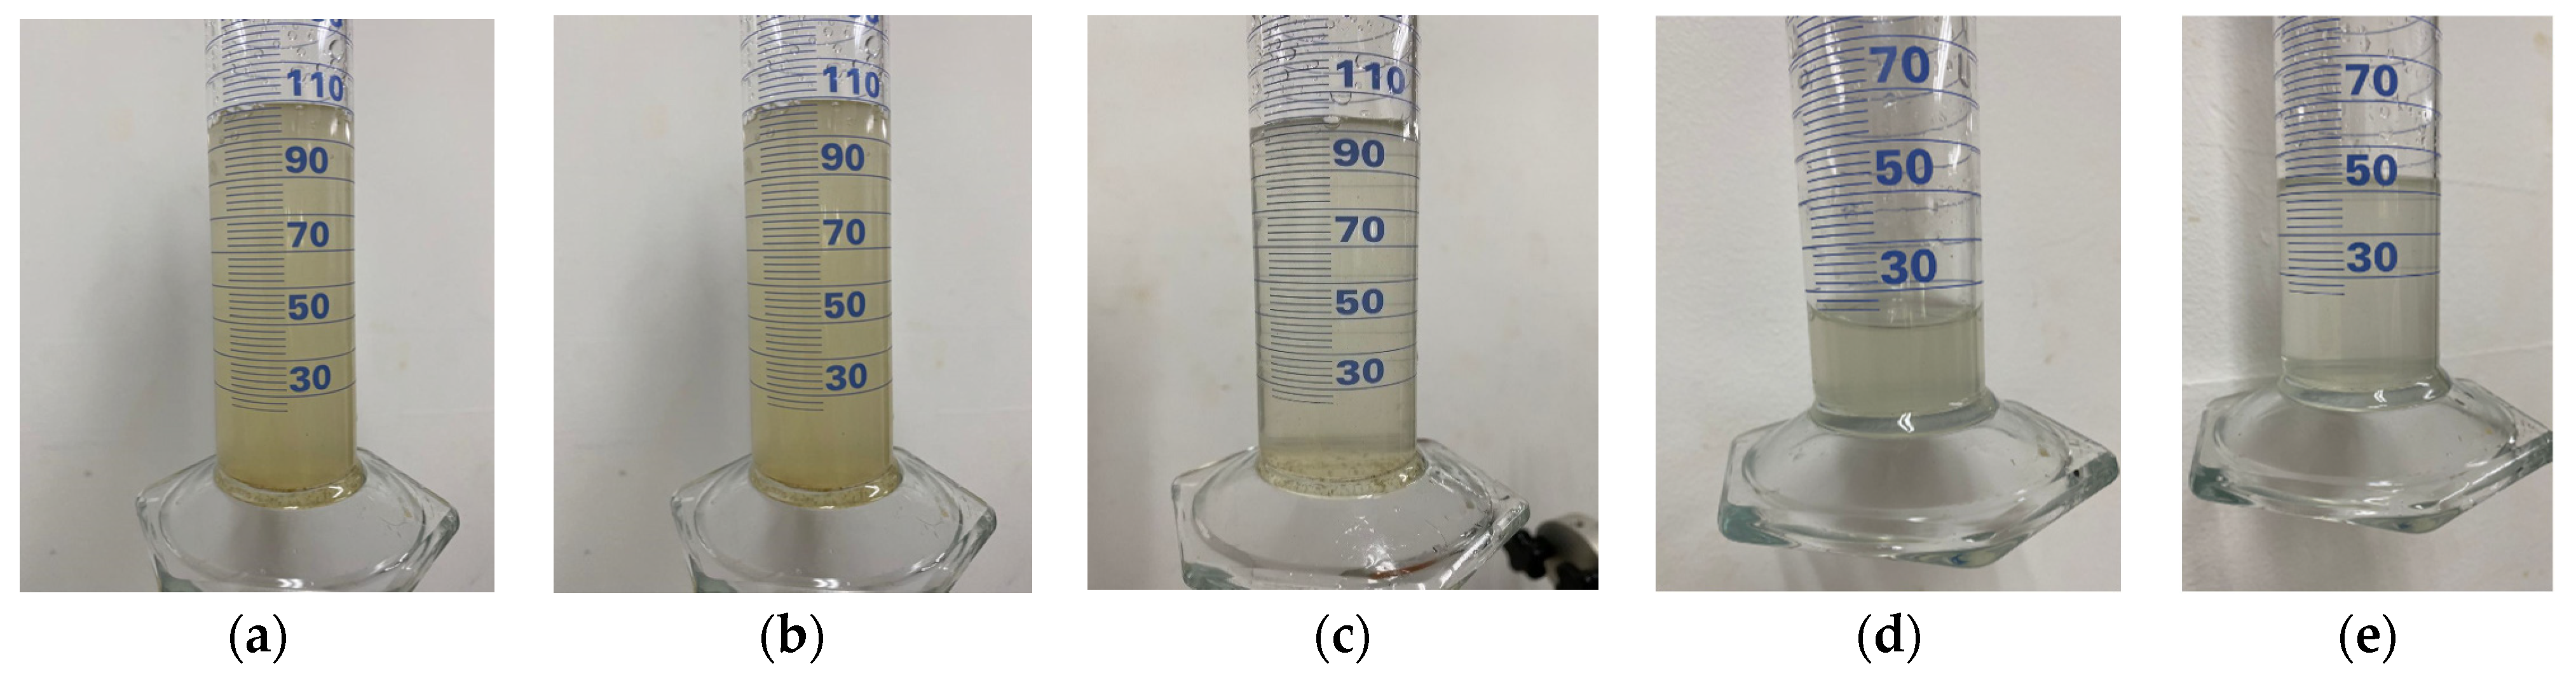
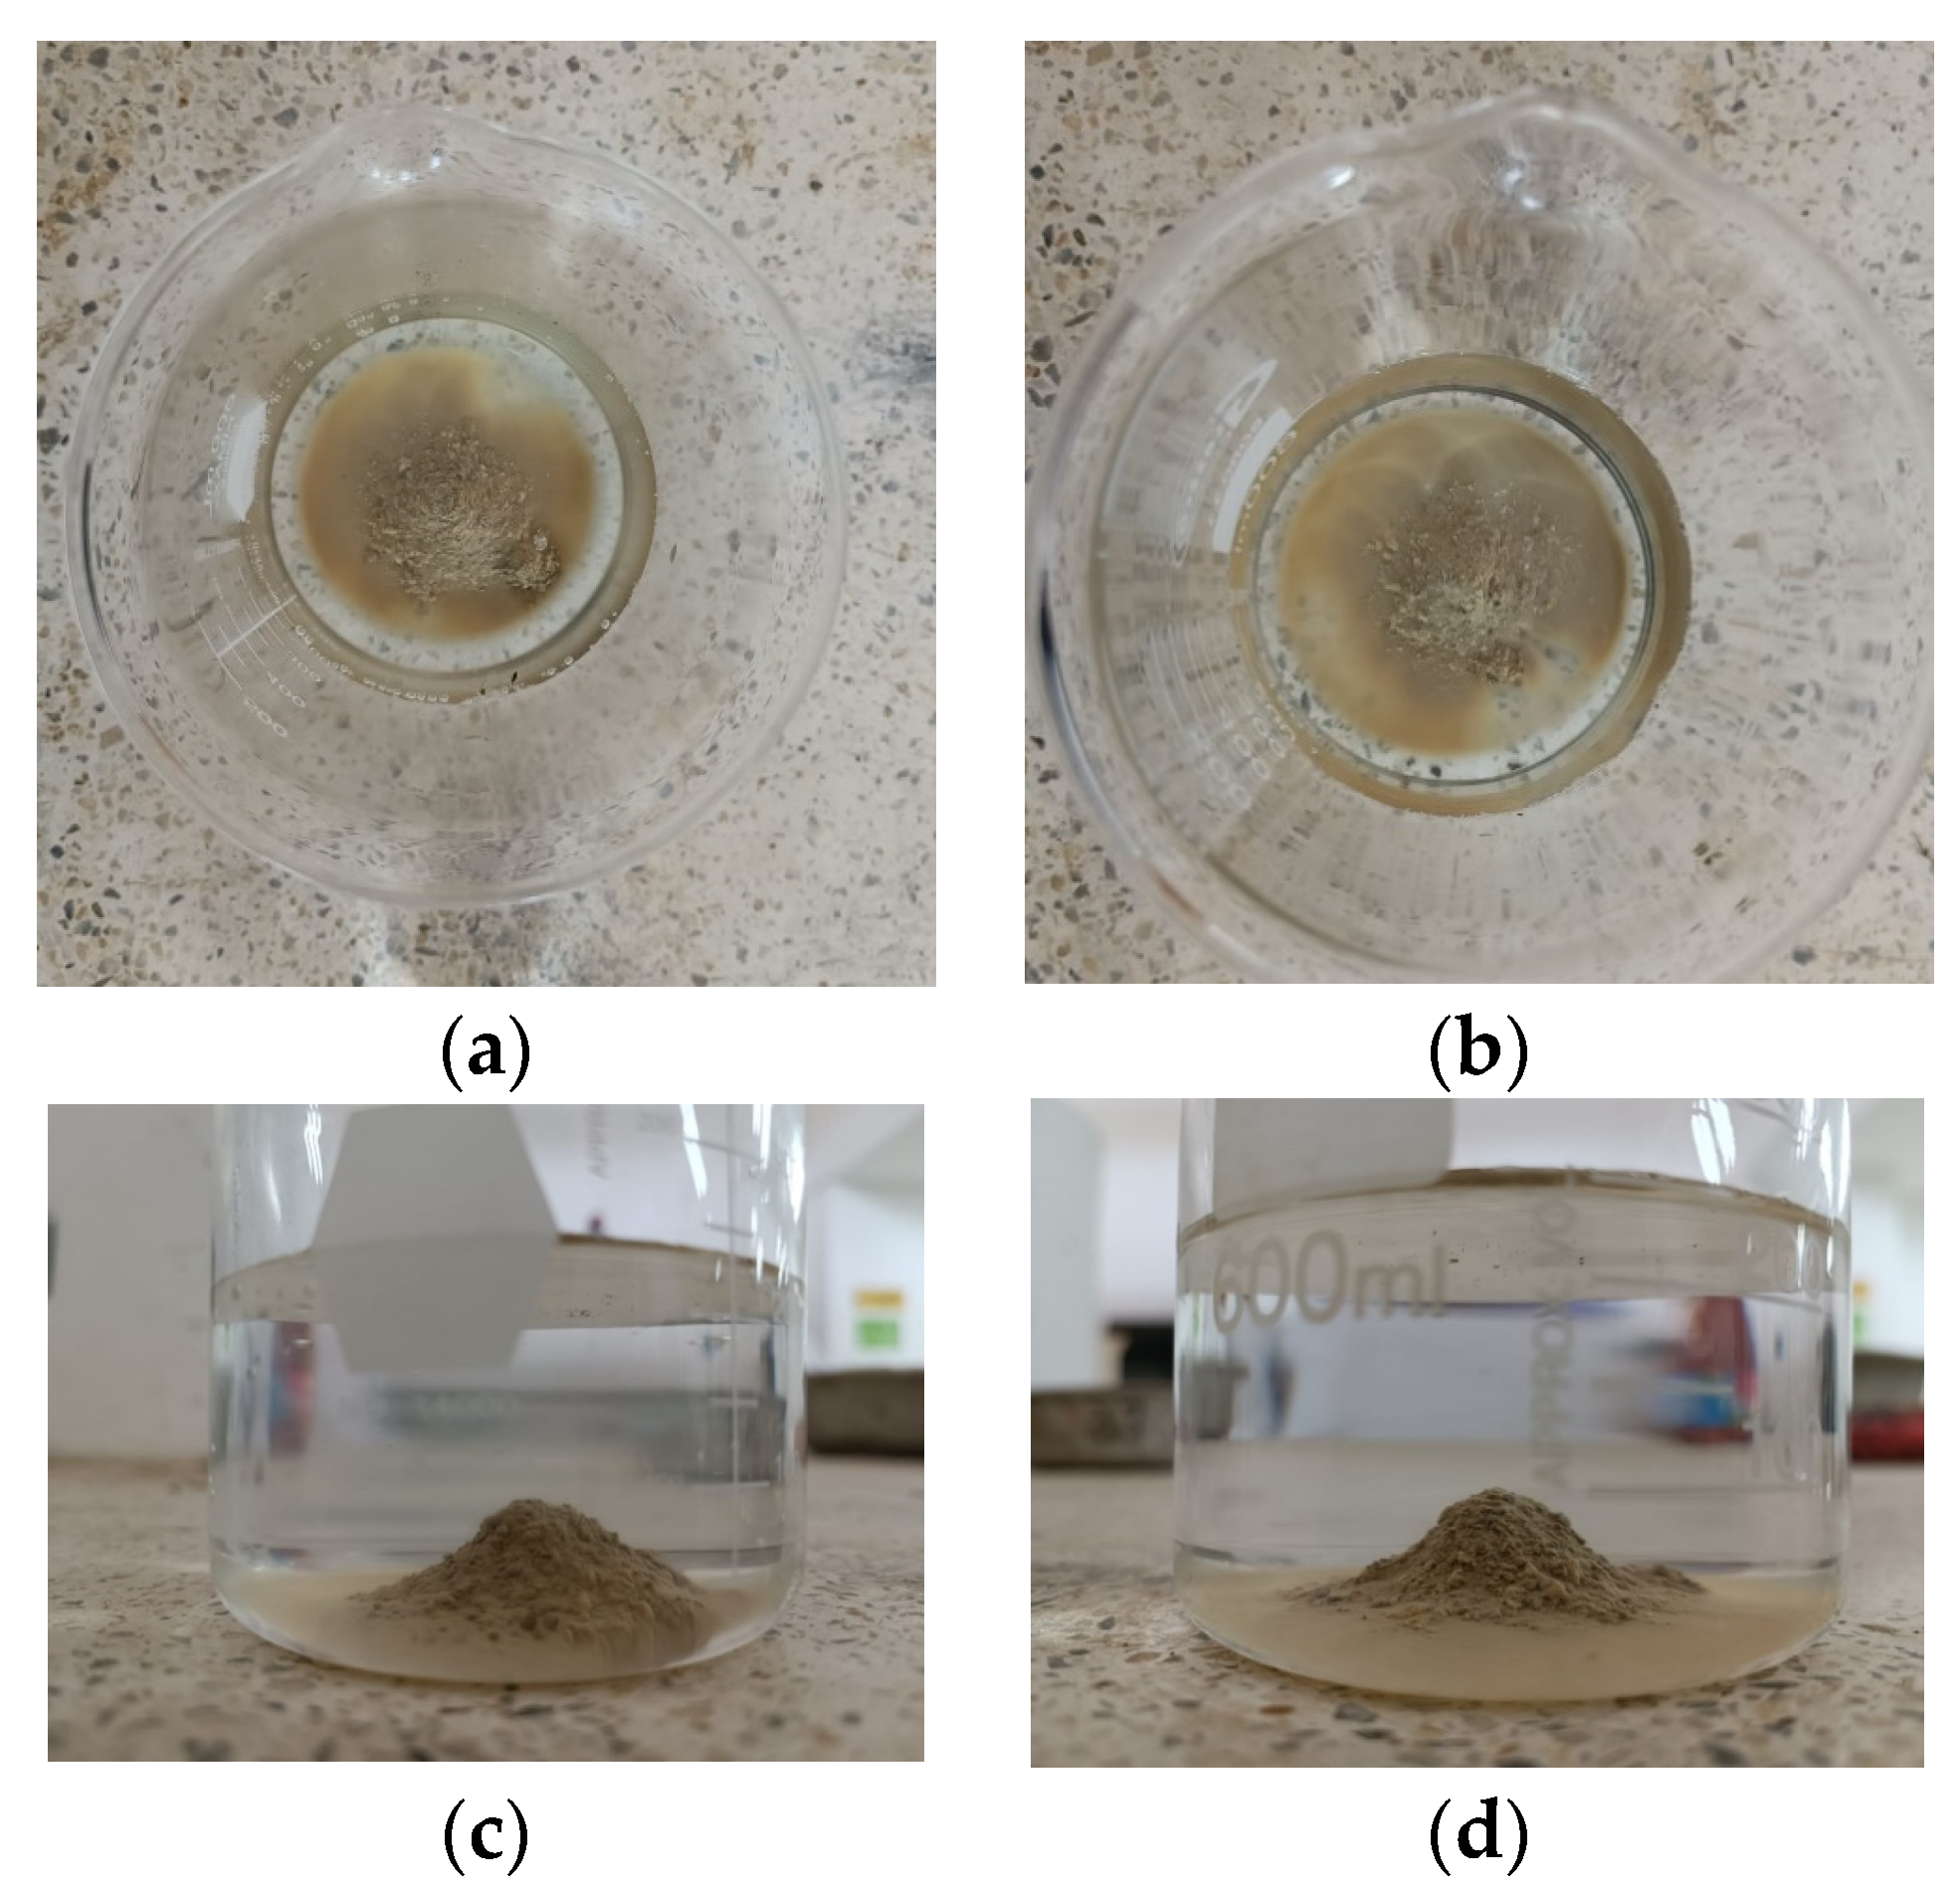
Based on the data presented in
Figure 11 and
Figure 12, there is no noticeable increase in water turbidity two minutes after submerging both compacted and undisturbed samples. However, it can be mentioned that there has been a more significant release of particles from the disturbed clods.
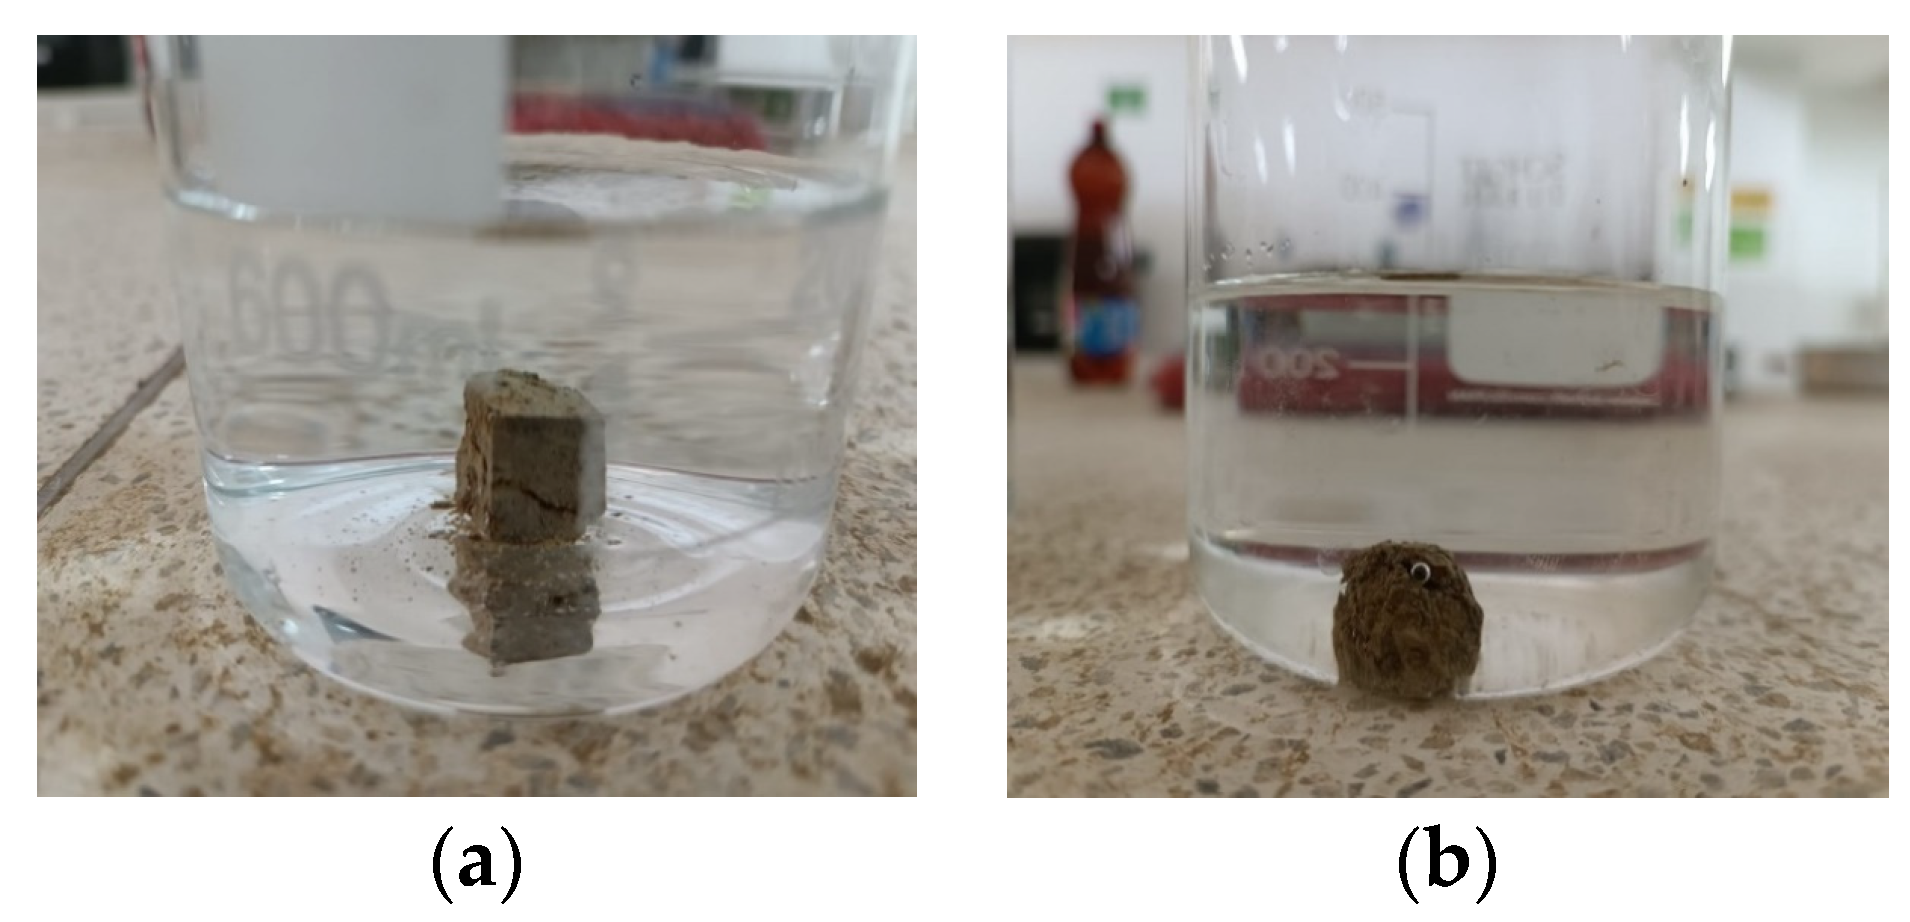
After conducting a 1 h test, it was observed that the altered samples shown in
Figure 11a–d suffered moderate levels of deterioration. The dispersivity can also be described as moderate since the samples have not entirely dissolved in the water. However, the suspended turbidity particles covered the entire surface of the beaker (Grade 3). In contrast, the undisturbed ones are slightly affected by contact with water, without indicating turbidity, yielding a non-dispersive result (Grade 1), despite belonging to the same material. This suggests that the initial moisture content of the soil upon contact with water heavily influences the dispersivity degree. The altered samples exhibited a significantly lower moisture content of 25.49% and showed a dispersive result, whereas the undisturbed samples had a considerably higher moisture content of 34.21% and did not exhibit any signs of dispersivity. This highlights the crucial role played by the arrangement of soil particles, particularly in the case of disturbed samples. Moreover, it is worth noting that the irregular clod had a more significant impact at the 2 min mark of the test.
The crumb test does not have the level of investigative validity that of pinhole due to its methodological simplicity, the need for large clods to obtain a meaningful sample, and added to the fact that it does not simulate the conditions of the land in its natural environment, converts it into a verification test or simple detection of dispersivity generally. Therefore, the results obtained through the pinhole test are expected to present some dispersivity degree but not necessarily below these levels (moderately dispersive disturbed samples, non-dispersive undisturbed samples).
Considering other studies, the samples to be stabilized using ground glass and calcium carbide in the 33 Scheuermann Filho [
33,
34] study presented a Grade 4 dispersivity according to the crumb test, which despite predicting a high susceptibility to dispersive phenomena, was observed that the pinhole test resulted in a soil of moderate dispersivity (ND4), for which the present methodology can only be used as a complementary study to the dispersivity results thrown by the pinhole test. Dispersive soils are characterized by deflocculation in the presence of relatively pure and static water, quickly going into suspension and prone to erosion phenomena.
One way of stabilizing dispersive soils consists of replacing monovalent sodium ions with higher valence cations, such as calcium (Ca2+) or aluminum (Al3+), which implies a more condensed soil structure due to phenomena of immediate occurrence such as agglomeration and flocculation [
19]. For example, this condition can be achieved by incorporating calcium-based materials, such as calcium hydroxide, calcium chloride, and calcium silicate. Another efficient way to overcome the adversities related to dispersion is by developing a cementitious matrix in the geomaterial by adding Portland cement, carbide lime, fly ashes, and glass ground [
13,
18,
32,
34].


