Article

Influence of Climatic Trends and Cycles on Varve Deposition in Crawford Lake, Ontario, Canada

by
Krysten M. Lafond
1,2,*,
Carling R. Walsh
3,
R. Timothy Patterson
3,
Francine M. G. McCarthy
4,
Brendan M. Llew-Williams
4,
Paul B. Hamilton
5,
Nawaf A. Nasser
3 and
Brian Cumming
2
1
Institute of Environmental and Interdisciplinary Science, Carleton University, Ottawa, ON K1S 5B6, Canada
2
Department of Biology, Queen’s University, Kingston, ON K7L 3N6, Canada
3
Ottawa-Carleton Geoscience Center and Department of Earth Sciences, Carleton University, Ottawa, ON K1S 5B6, Canada
4
Department of Earth Sciences, Brock University, St. Catharines, ON L2S 3A1, Canada
5
Research and Collection, Canadian Museum of Nature, Ottawa, ON K1P 6P4, Canada
*
Author to whom correspondence should be addressed.
Geosciences 2023, 13(3), 87; https://doi.org/10.3390/geosciences13030087
Submission received: 2 February 2023 / Revised: 10 March 2023 / Accepted: 13 March 2023 / Published: 17 March 2023

Abstract

:
Varves accumulating below the chemocline of meromictic Crawford Lake, Milton, Ontario, Canada, consist of dark-colored organic matter laminations that are primarily deposited during the fall plankton die-off, alternating with light-colored laminations comprising calcite crystals that are precipitated during a relatively narrow water temperature and pH-controlled depositional window in the summer. A novel high-resolution imaging protocol was used to photograph the varve record in the 87 cm-long freeze core CRA19-2FT-B2, collected from the deepest part (~23 m) of the lake in February 2019. High-resolution images were used to: (1) characterize varve couplets deposited between AD 1870 and 2000 (chronology verified through 137Cs/210Pb analysis of freeze core CRA22-1FRA-3, and consistent with the historic record of nuclear fallout and other proxies of the Great Acceleration); (2) document distinctive varves that permit a correlation between cores throughout the deep basin of Crawford Lake; (3) measure the thickness of individual dark and light- colored laminations, which were found to vary between 0.04 mm and 3.76 mm; and (4) carry out wavelet and spectral time series analyses based on varve thickness data that can be correlated to climatic trends and cycles. Time series analyses identified cycles with statistically significant periodicities that were attributed to the Quasi-biennial Oscillation (2.3 years), El Niño Southern Oscillation (2–7 years), the 11-year Schwabe Sunspot cycle and a possible Pacific Decadal Oscillation (50–70 years). This research not only provides baseline chronostratigraphic data that allow the correlation between freeze cores subsampled for various proxies, but also documents the dynamics of the climate drivers that influence the deposition of both organic matter and inorganically precipitated calcite. Crawford Lake is currently a candidate site under consideration for the Global boundary Stratotype Section and Point (GSSP) to define the Anthropocene series/epoch.

1. Introduction

1.1. Varved Sedimentation in Crawford Lake

Thousands of publications have demonstrated the utility of examining the paleo-histories of lakes to better inform future climate and anthropogenic changes, e.g., [1,2]. A rare collection of lake sediments is characterized by varved sedimentation that archives detailed paleoenvironmental data [3,4,5,6]. Documenting the biotic/abiotic changes in these annually deposited sequences is a powerful tool to define short-term pulses or incremental changes in lake environments [7]. For example, varved sediments have been used to study eutrophication events, climate change, contaminants, and other direct anthropogenic impacts, e.g., [5,8,9,10,11]. More recently, new tools such as sedaDNA analysis have been used to uncover biotic differences in community structure that may have been lost or destroyed in the fossil record [12,13,14]. Additional paleoenvironmental information can be derived by assessing the thickness of laminations and conducting a detailed analysis of their composition; time series analysis of depositional periodicities is integral to deciphering processes and patterns in the natural lake ontology, and pressure from external stressors [15,16,17].
The exceptionally preserved microfossil record in the varved sediments of Crawford Lake have received extensive study, with early research identifying notable biotic changes derived from aquatic and terrestrial fossil signals [18,19,20,21,22]. An early and significant discovery was the evidence of Indigenous peoples of North America having settled around the lake over 600 years ago, showing that the lake was part of a traditional subsistence economy [20,21,22,23,24,25]. In recent research, biotic and abiotic metrics have documented the Great Acceleration (1940–1980 CE) [26,27], relating limnological changes to local, regional and global stressors [19,24,28,29,30,31]. The high-quality scientific information on the annually laminated lake sediments makes this lake a good candidate for consideration by the Subcommission on Quaternary Stratigraphy (SQS) as a Global boundary Stratotype Section and Point (GSSP) site documenting a possible new epoch, the Anthropocene [32,33]. High-resolution chronology documenting the annual conditions of Crawford Lake is thus important in assessing the evidence of the Great Acceleration on this small rural lake.
Despite previous research on the varved sediments of Crawford Lake, we present the first high-resolution core imaging analysis linked to environmental factors. This work applies spectral and wavelet time series analysis to the individual seasonal lamina thicknesses. The resulting data document the potential influence of climatic cycles and trends, showing the influence of climate on the production and accumulation of authigenic organic matter and inorganic calcite crystals [34,35,36,37].

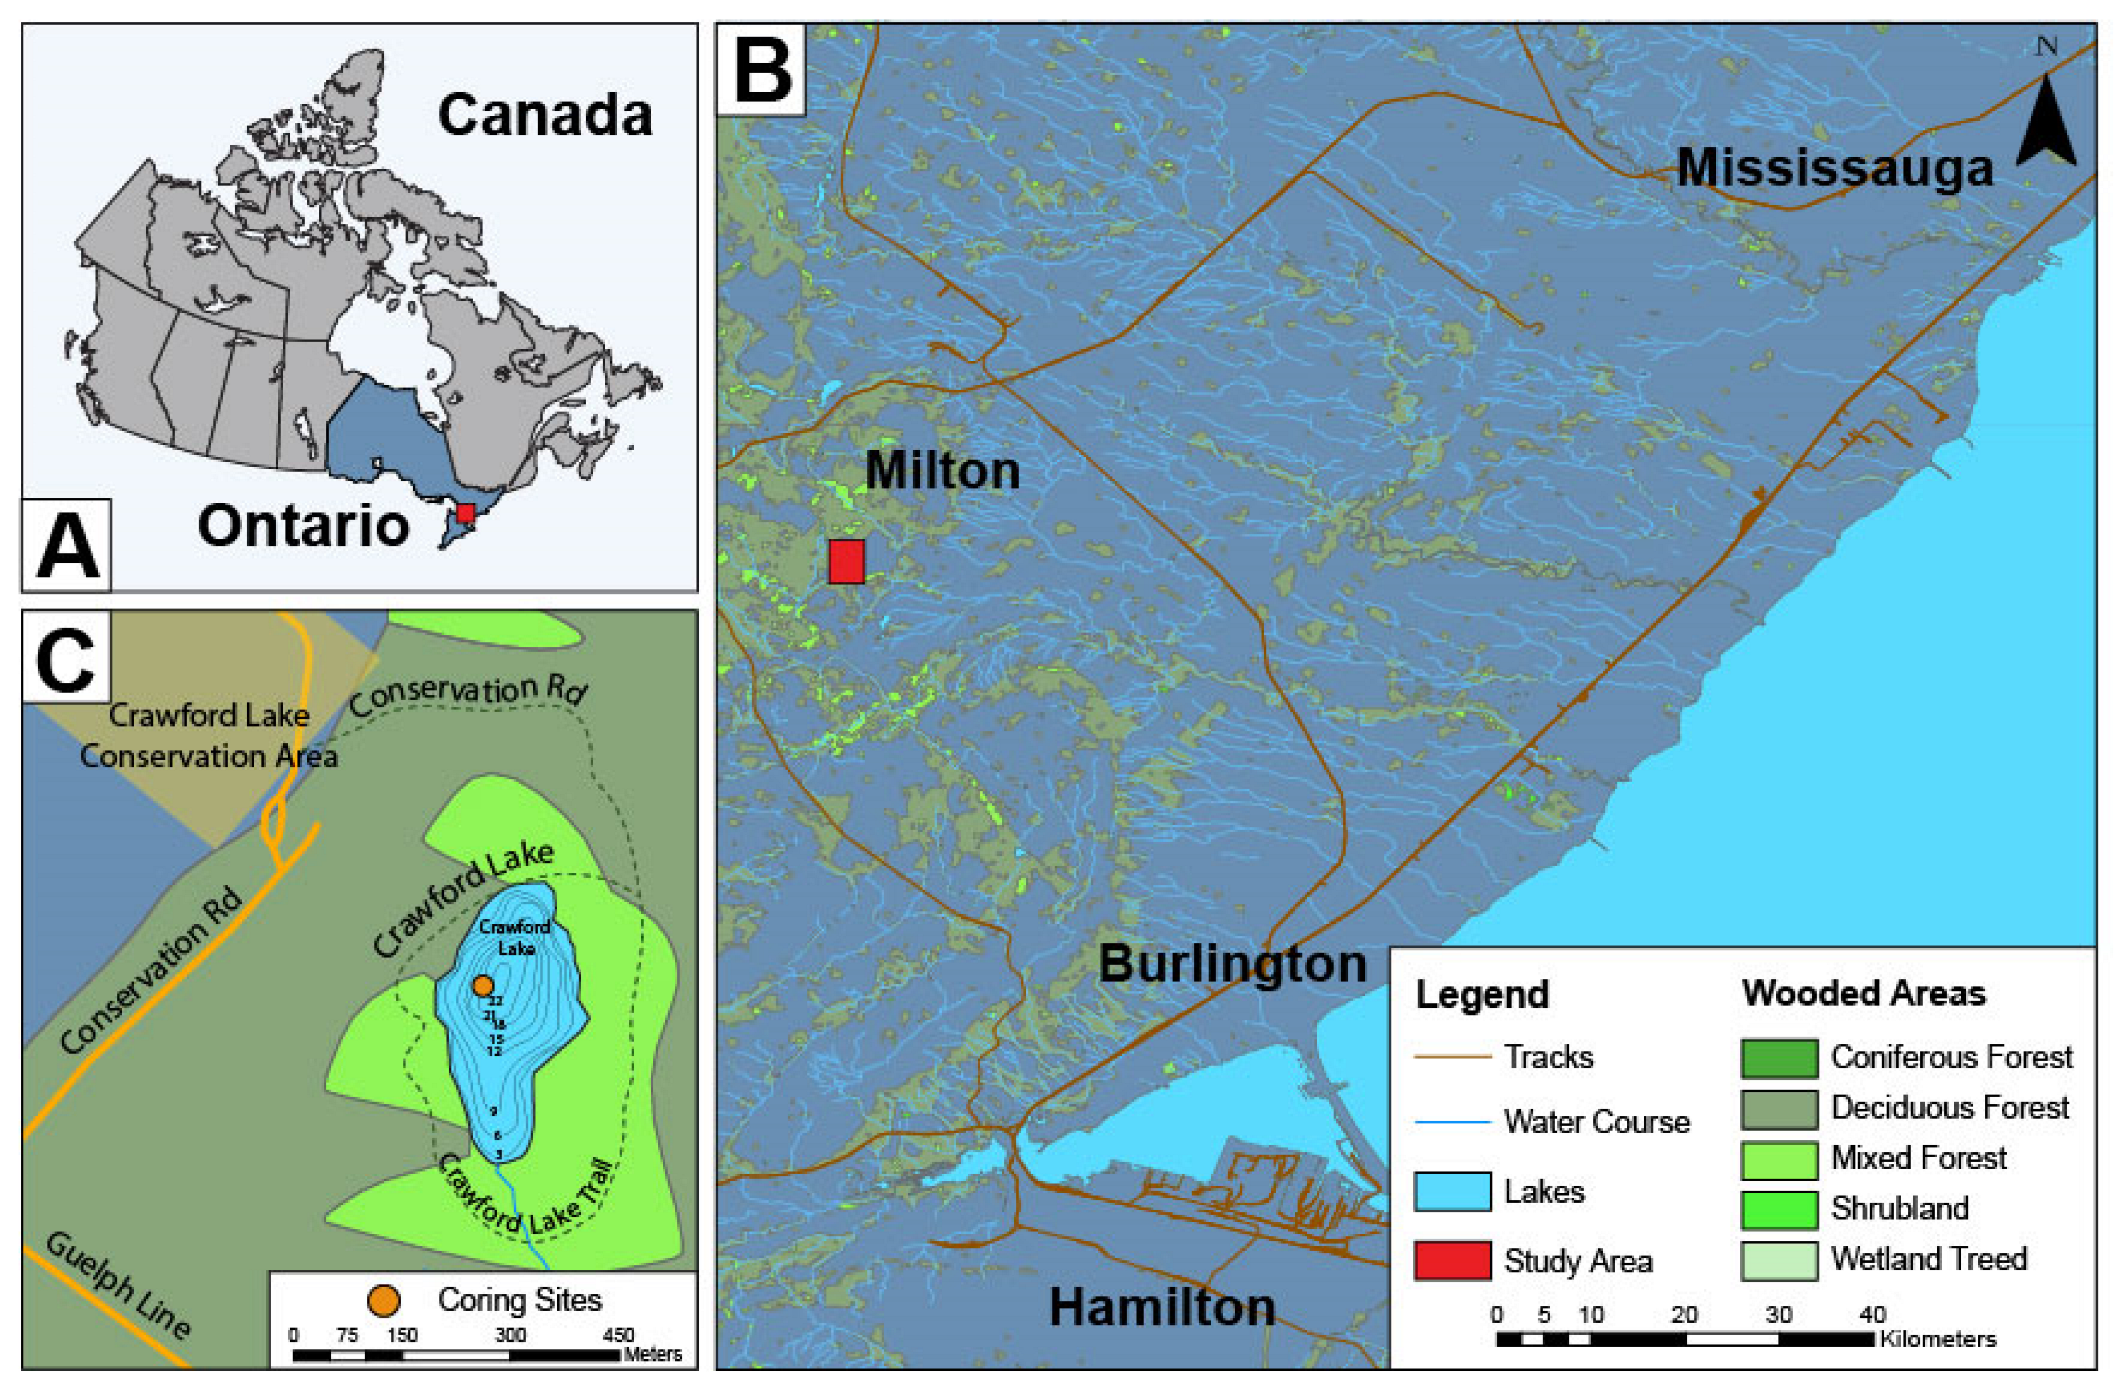
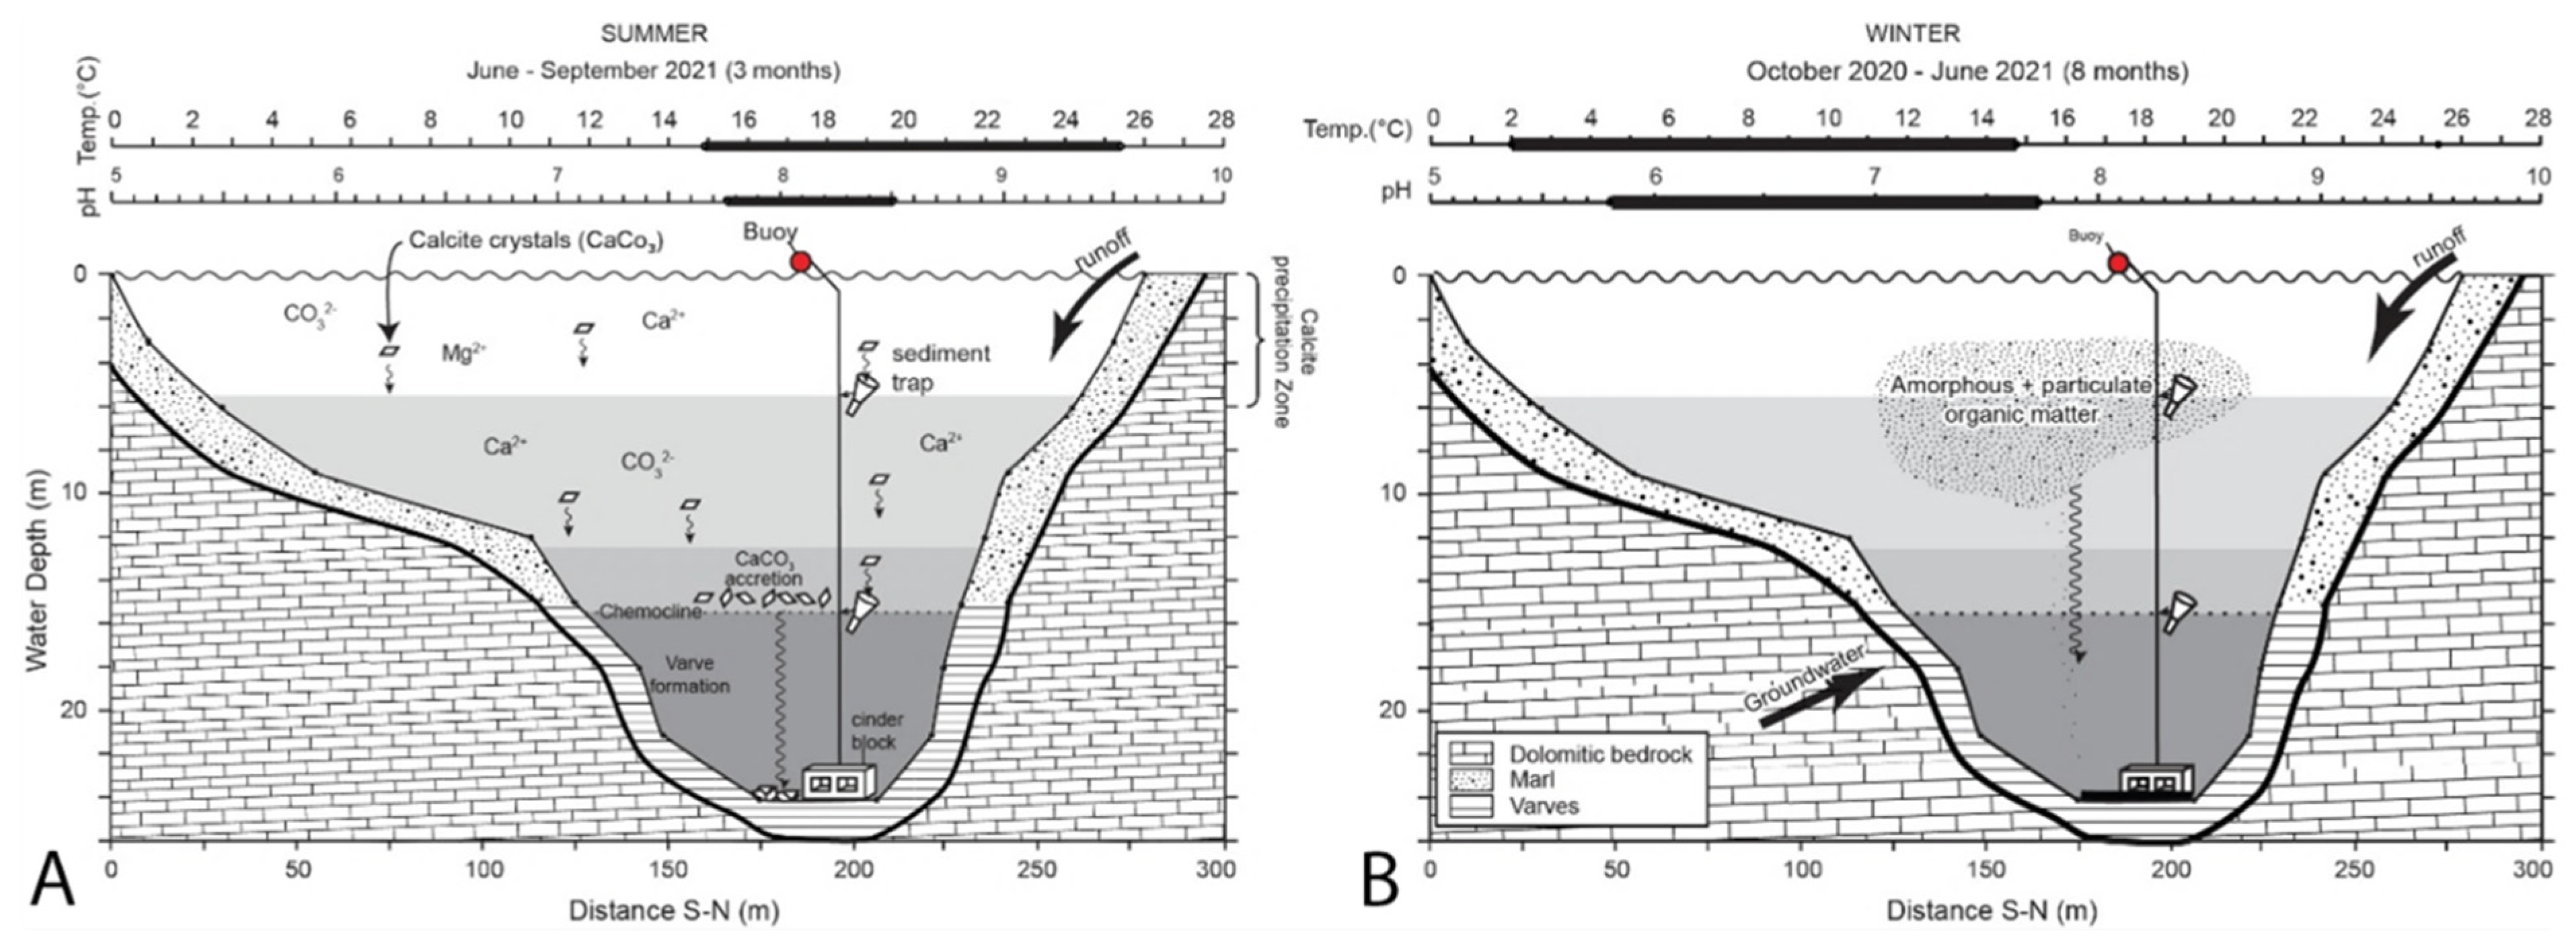
1.2. Lake Physiography, Limnology, and Varve Formation

Crawford Lake is a small 2.4 ha meromictic lake that occupies a karstic basin dissolved in the Silurian dolomite bedrock of the Lockport Formation. It is located approximately 1-km west of the Niagara Escarpment, near the town of Milton (Figure 1) within the Golden Horseshoe region of southern Ontario. The lake has a deep basin where the maximum water depth is 23 m, which in turn overlays a ~ 4.5 m thick post-glacial sedimentary sequence. Previous pollen analysis and radiocarbon dating demonstrate a long depositional history spanning 13 ka in the sequence [38]. A distinct color change from reddish brown to very dark brown observed in all replicated cores marks the lower boundary of the interval analyzed here, and roughly coincides with the beginning of the Canadian Zone (AD 1867). Radiocarbon dating [20,30] and 210Pb and 137Cs measurements of the varved sediment [30] confirm observations, since freeze coring began in the 1970s, that couplets of light and dark laminae accumulate annually below the chemocline of the meromictic Crawford Lake [20,39,40]. The decline in Ulmus (elm pollen) resulting from Dutch elm disease, first noted in southern Ontario in the late 1940s, helps identify the mid-20th century and confirms the chronology of laminated sediments that have accumulated annually since the mid-19thth century [20,39,40].
The superbly preserved and laterally continuous varves consist of dark, predominantly authigenic organic matter laminations that alternate with light-colored authigenic calcite. Llew-Williams (2022) [36] quantified the conditions needed for calcite to precipitate in Crawford Lake and found these to be limited by water temperature and pH—the latter strongly impacted by primary productivity/carbon fixing. Sediment trap studies confirm that calcite precipitates in the upper 6 m of the water column when the water is warmer than 15 °C and pH exceeds 7.76, causing small crystals to sink through the mixolimnion (epilimnion+ metalimnion+ hypolimnion) (Figure 2). Their descent is slowed by the sharp density contrast along the chemocline, where they encounter high alkalinity (mean 848 mg/L, expressed as CaCO3). The small crystals act as nuclei for growth of larger crystals that are dense enough to sink rapidly through the paradoxically slightly acidic monimolimnion to form the light-colored lamina layer that caps the dark-colored sediments characteristic of this lakebed. They consist predominantly of authigenic particulate and amorphous organic matter, which accumulates the rest of the year but most quickly when the mixolimnion is isothermal; mass mortality of plankton results from cooler temperatures and shorter days [34,35,37].
Crawford Lake was long believed to be characterized by anoxic bottom waters, as is typical for meromictic lakes [20,21,34,35,41]; however, recent research has shown that the water below the chemocline (the monimolimnion) of this permanently stratified lake is actually well-oxygenated [30,42]. Baseflow of oxygen-rich groundwater into this small, deep karstic basin supports a rich assemblage of zooplankton, including non-burrowing nektobenthic ostracods adapted to interstitial waters in karstic regions [42]. The preservation of varves does not depend on bottom water anoxia, but rather on the inability of infaunal invertebrates to migrate into the highly alkaline, saline waters of the Crawford Lake monimolimnion to disturb the deposited sediments [42]. This oxic environment inhibits the mobilization of 239Pu [43,44], a by-product of thermonuclear testing during the mid-20th century and the key marker for the proposed Anthropocene epoch [32,45].

1.3. Climatic Cycles and Prominent Trends

Both calcite precipitation and primary production are strongly affected by climatic conditions, so the thickness of the laminae in Crawford Lake can be employed as a climate proxy, as was shown in European lakes [46,47]. We used time series analysis to determine statistically significant correlations between the varve thickness and trends and cycles with known regional climatic influences, notably the Quasi-biennial Oscillation (QBO), El Niño Southern Oscillation (ENSO), Pacific Decadal Oscillation (PDO), and the 11-year Schwabe Sunspot cycle.
The QBO describes the oscillation between westerlies and easterlies in the tropical stratosphere, where the QBO impacts stratospheric circulation during the winter in the Northern Hemisphere. Westward (eastward) phases of the QBO often coincide with abrupt stratospheric warming (cooling) and cold (warm) winters. In Northern Europe and eastern North America, the QBO has a period of approximately ~2.3–2.4 years, although periods of 2.1 years have also been reported [48,49,50]. At the global scale, QBO has been associated with significant climate variability, particularly changes in precipitation patterns [51], with evidence of some variability in this influence at the regional scale [52,53,54], where quasi-biennial cycles have been observed in regional precipitation patterns [55,56,57].
The ENSO is a collective term that refers to the variation in surface-water temperatures in the tropical eastern Pacific (El Niño and La Niña) that are coupled with air surface temperatures in the tropical western Pacific. Through teleconnections, ENSO has a major influence on climate worldwide on inter-annual time scales [58]. These anomalies typically persist for 9 months to 2 years, with an irregular return time of 2–7 years [17,49,59].
Pacific Decadal Oscillation (PDO; ca. 50–70-year periodicity) is a robust recurring phenomenon, whereby waters of the northeastern Pacific Ocean periodically shift between a positive PDO (warm) phase and a negative PDO (cool) phase [59]. Deviations in the timing of this phase shift have been attributed to multiple potential forcing mechanisms [60]. There is a particularly strong linkage between PDO and periodic changes in total solar irradiance (TSI), the amount of solar radiative energy incident on the Earth’s atmosphere. This would produce deviations in the observed PDO phenomena through ocean-atmosphere amplification processes [61,62].
Using a freeze core from the deepest part of the Crawford Lake basin, this research proposes: (1) to characterize and identify the varve chronology between AD 1870 and 2000; (2) identify coherent patterns within the varve deposition that can be used for inter-core correlation across the lake basin below the chemocline; (3) measure the thickness of individual light and dark colored laminations using these measurements in mm for subsequent wavelet and spectral time series analysis; and (4) use time series analysis to identify depositional trends and cycles in varve deposition, and to relate them to known climatic influences on lake productivity and calcite precipitation.

2. Materials and Methods

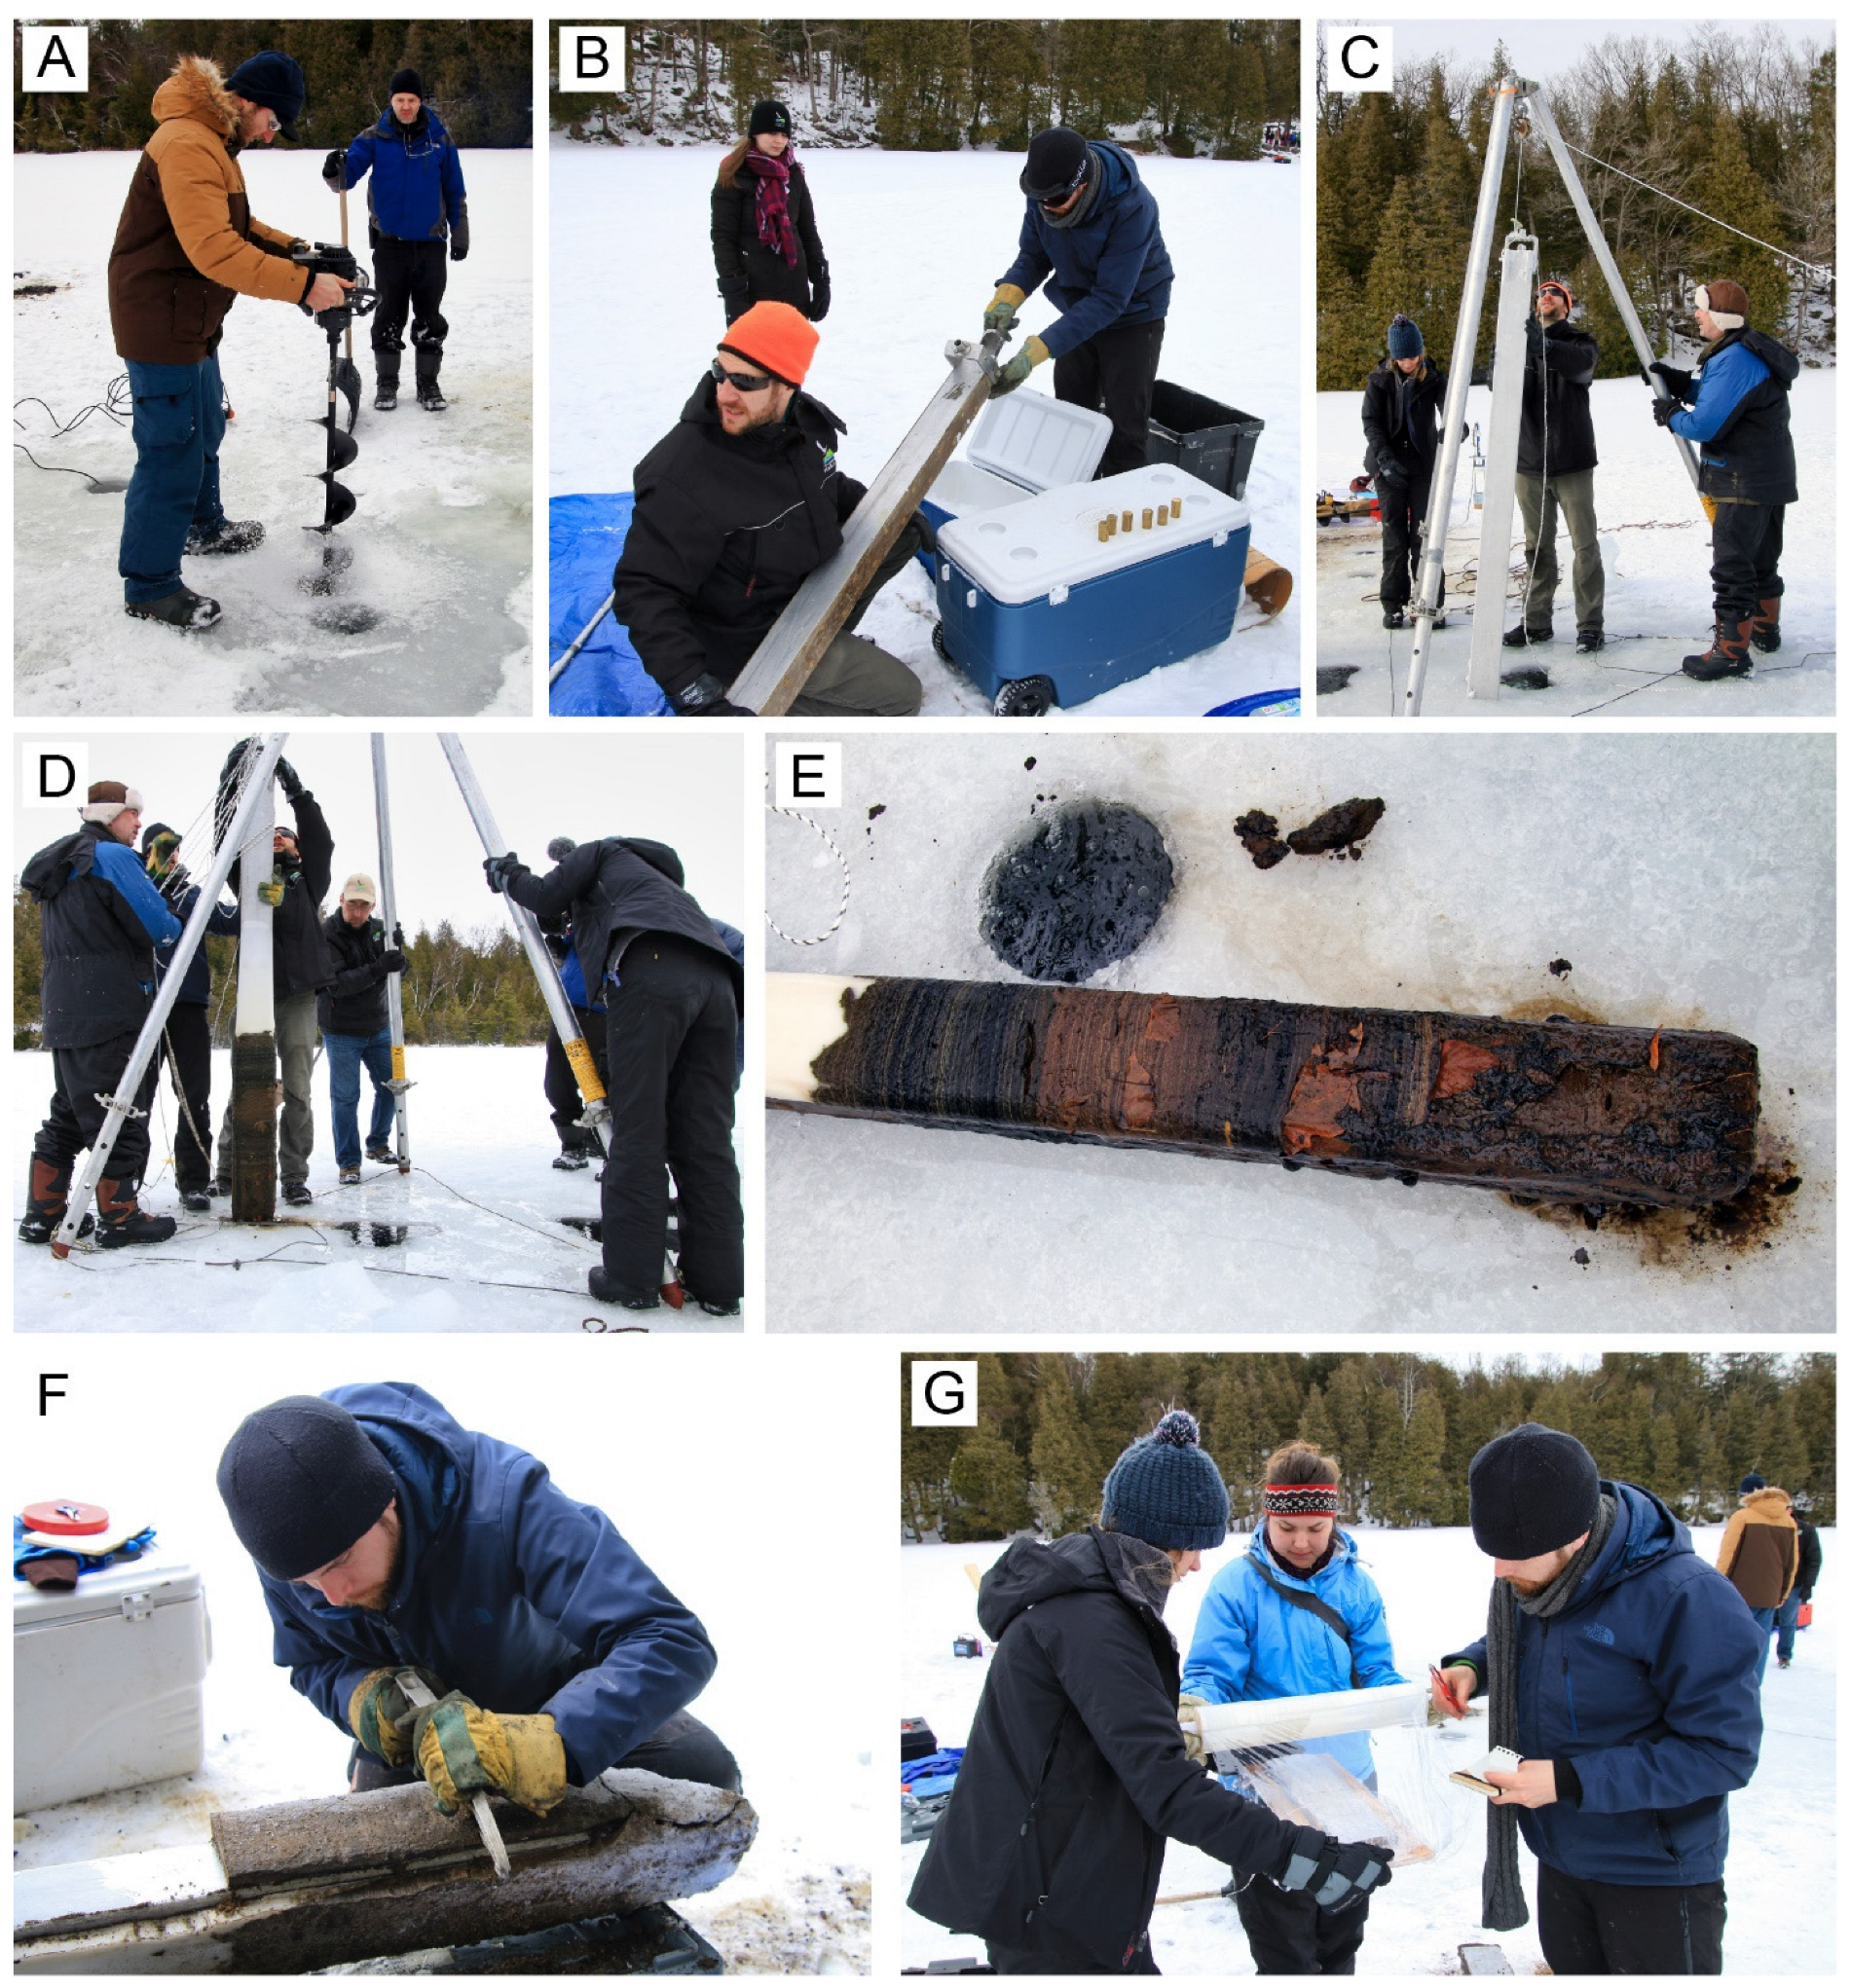
2.1. Freeze Core Collection and Preparation

Several freeze cores were collected from Crawford Lake on 20 February 2019 (fieldwork approved by Conservation Halton (Permit #022-002; Figure 3)) using flat-faced freeze corers that permit the recovery of a frozen and fully undisturbed sedimentary sequence [63,64]. The 87 cm-long freeze core CRA19-2FT-B2 used in this study was taken at 43°28′05″ N, 79°56′55″ W in the deep basin of the lake at a water depth of 23 m (Figure 3B). The coring device is hollow aluminum, allowing it to be filled with a slurry of dry ice (solidified carbon dioxide) and ethanol before being lowered through the water into the sediment water interface. The device was left in situ for ~30 min so that an undisturbed thick frozen layer of lake sediment could adhere to its metallic face. Experimentation with conventional gravity cores while onsite resulted in cores that tended to expand substantially as interstitial gas was released when cores were introduced to lower air pressure conditions at the surface, resulting in loss of sediment from the top of conventional cores [30,42]. Freeze coring, is the only practical method for coring these highly gassy sediments without mixing or compacting the laminations [65,66] (Figure 3E). The freeze core was kept frozen and transported back to Carleton University in Ottawa for analysis. The core was cleaned, photographed, and logged (core cards created for record of materials) while kept frozen.

2.2. Core Photography

In preparation for photographic analysis, the frozen core was cut lengthwise and mounted on a board (Figure 4A). A Canon EOS 6D Mark II equipped with a Canon EF 100 mm f/2.8 L Macro IS USM lens and Canon Macro Ring Lite MR-14EXII flash was mounted on a Canon 120 cm CF camera rail slider (Figure 4B). Use of the camera rail for photographing the core was critical to the research as it ensured that as the camera was moved along the core face, both the camera angle and distance from the core remained unchanged. Prior to photographic analysis, the core face being imaged was allowed to thaw very slightly so that any ice or surface debris on the core face to be photographed could be lightly scraped away with a glass slide. Images were captured with the camera ring flash set at a 22 cm distance from the core face, with images taken every 1 cm along the core as determined by a scale attached to the camera rail. The camera settings used were Av, F11, IOS-Auto, with the exposure composition set to −1. The ring light was set to ETTL or −0.7 (Figure 4A). These settings will vary depending on the strength and type of available ambient light.

2.3. Image Processing

Using Adobe Photoshop 2020, all images were cropped to their center third to eliminate any potential barrel distortion at the edge of the photographic frames, which results from camera lens curvature. This was the reason for using a small spacing of 1 cm between each image captured. The individual images were then aligned and stitched together in Adobe Photoshop 2020 to create a single core profile image. This was carried out by overlapping and matching characteristic sedimentary features within the core from one image to the next and using the blending feature within the software (set to panoramic).

2.4. Varve Dating

With a complete image of the core, the varve record was catalogued, counted, and the chronological year assigned to each varve couplet. To this end, the light-colored calcite mineral rich laminae were coupled with the adjacent dark organic rich laminae above them and counted as one calendar year (a varve). This varve count was repeated and compared with the findings of earlier research [20]. Because the recovery of loose, unconsolidated sediment at the top of freeze cores is uneven, varve years were assigned in relation to an interval of particularly prominent calcite laminae, which can be easily identified with the naked eye within any core from Crawford Lake (Figure 5, Figure 6 and Figure 7). These distinct laminae were deposited during the warm and dry Dust Bowl years of the 1930s across North America [67,68,69,70]. The 1935 varve, an especially warm and dry year, thus characterized by a particularly thick calcite lamina, was then used as the point from which varve counting was carried out along the core, both up and down section. The uppermost recovered laminations in core CRA19-2FT-B2, determined to have been deposited in AD 2001 and 2002, were highly unconsolidated and distorted. As such, the varve record for AD 2000 was the latest year assessed, since the analysis carried out here required a precise determination of varve couplet thickness. The absence of the uppermost varves is not unexpected. Based on previous experience, we have determined that it often takes these laminated sediments several years at the sediment-water interface in meromictic environments to dewater sufficiently to be preserved and properly adhere to the freeze corer [61]. We also observed during another coring campaign in AD 2022 that increasing the time the corer is left in the sediment improved recovery of the upper-most varves. In comparing the recovery at the top of the core between cores CRA19-2FT-B2 (Figure 5 and Figure 6) (left for ~30 min) with CRA22-1FR-3 (Figure 7) (left for ~40 min), the latter obtained approximately 3 cm of additional material (roughly 15 years).
In February 2022, researchers from Brock, Carleton, and Queen’s Universities took freeze cores, including CRA22-1FR-3 (Figure 7), half of which was stored at the Canadian Museum of Nature as the archive core for the GSSP, from Crawford Lake. CRA22-1FR-3 was handled and imaged using the same methods described here for CRA19-2FT-B2 to create a single core profile image. The image was used to count and date the varves of CRA22-1FR-3 while being compared to the CRA19-2FT-B2 chronology shown in Figure 6. The core was then subsampled by precisely cutting out individual varves using a scalpel and sent to Queen’s University for 137Cs isotope analysis and Gregorian year assignments [71]. This dating allowed independent verification of our varve chronology based on varve counting, as did the Pu239 + Pu240 profile from cores CRA19-2FT-B2 and CRA19-2FT-D1 (studied for siliceous microfossils at annual resolution by Marshall et al., in press/2023 [31]) shown in Figure 8.

2.5. Measuring Varve Thickness and Time Series Analysis

With varve counting complete, the thickness of each lamina was determined. The varves were slightly bent/distorted at the point where the sediment was frozen to the freeze corer, resulting from slow sinking into the soft substrate, while the sediment was allowed to freeze to the sampler. To ensure that this distortion did not impact the varve counting and thickness determination results, a line was placed down the center of the image which was where varve measurements were made. Using the annotated core image, the mm width (thickness) of each couplet was measured using the ruler tool in Adobe Illustrator 2020. The width of each individual light and dark lamination, as well as complete varves, were recorded.
Time series analysis was conducted at an annual resolution of varve thickness measurement data from the 1870 onward part of core CRA19-2FT-B2 (Figure 5). As sediment accumulation rates vary temporally, time-series data derived from most sedimentary sequences contain information that consists of discrete chronologic units of uneven sedimentary thickness [61]. This problem is negated when analyzing annually deposited varves that can be associated with absolute chronologic units (e.g., seasons, years, etc.). The thickness of each varve, or whichever variable is being analyzed, within each discrete interval (e.g., color) is recorded individually, resulting in a time series that is independent of the relative sedimentation rate [15,72].
Two time-series analysis techniques were carried out on the varved sediment data using MATLAB [73]. Thomson’s multitaper method [74,75,76] was first conducted to decompose the time-domain data into their frequency-domain counterpart. Unlike a basic Fourier transform, this method of spectral analysis utilizes multiple spectral power estimates, averaging them to eliminate potential biases that may arise when using a single spectral estimate [74]. This results in a display of the periodic elements that are associated with a given signal. Various chi-squared confidence intervals and the red noise level were used to verify the statistical significance of the resultant signal peaks.
Continuous wavelet transforms (CWTs) were then used to display the time-evolution of the periodic elements within the sediment core. The spectral analysis technique described above provides an estimate of signal periodicity but presumes signal stationarity, and, as a result, it cannot show where in time cycles occur. Non-stationary CWTs display time-varying periodicity, providing an indication of the distribution of signals in time, and their potential relationship to other known environmental changes through time [15,77].

3. Results

3.1. Varve Thickness and Chronology

Using a distinctively thick calcite reference lamination assigned to 1935 and counting up and down sections from that reference, a complete varve chronology spanning 1870 to 2000 CE was developed (Figure 6, Supplementary Data). Through this interval, we documented distinctive environmental changes preserved in the core record (e.g., warm, arid Dust Bowl, color change associated with eutrophication, and acid precipitation associated with the Great Acceleration of the mid-20th century [28,30]) on core CRA19-2FT-B2_S1 (Figure 5), as well as the proposed GSSP core CRA22-1FR-3 (Figure 6) at high resolution. These cores, collected in 2019 and 2022, respectively, illustrate the consistent varve deposition and stratigraphic characteristics throughout the deep basin below the chemocline of Crawford Lake. Images of other freeze cores also show these significant sedimentary characteristics (Figure 6), which can be identified in the field and without high-resolution imagery. The proposed GSSP is near the base of the dark lithological unit resulting from reduced calcite precipitation attributed to the mid-20th century Great Acceleration [78], at the base of the calcite lamina deposited in 1950 [30]. The initial major increase in plutonium was measured between samples spanning 1948–1951 in core CRA22-1FR-3 (unpublished data/in prep.) and 1950-53 in core CRA19-2FT-B2 [30], marking the beginning of the Cold War in 1952 and consistent with the calculation of global fallout of radionuclides [79]. High concentrations of metals associated with fly-ash and other elements leached from the surrounding soils are consistent with acidic precipitation, lowering the pH of the epilimnion sufficiently to make calcite laminae from the late 1940s through early 1970s difficult to discern in dark-colored parts of the varved succession. The resulting thin light-colored laminae among dark bands punctuated by a triplet of prominent laminae marking the summers of 1956, 1957 and 1958 CE allow a confident identification of the proposed GSSP 1950 to be made in any freeze core from Crawford Lake (Figure 5, Figure 6 and Figure 7). Gamma analysis of CRA22-1FR-3 bulk sediments sampled across two varve year boundaries showed a decline in 210Pb activity, and a 137Cs peak in approximately 1963 (Figure 9, Table 1). The varve counting and assigning of calendar years throughout this period also correlates with previous studies where varve counting was employed and had been compared to AMS radiocarbon dates [20,21]. Finally, a distinct biotic (algal) shift in the sediment community assembly of 1970 was aligned with documented changes in the algal community of Crawford Lake observed at that time [30,80].
The thinnest calcite laminae were 0.04 mm, deposited in summer 1960 (Table 2 and Table S1). The thinnest dark, organic lamina was 0.11 mm, deposited in 1959. The thinnest total annual deposition was 0.21 mm during 1959. The thickest calcite lamina was 1.53 mm in 1981, while the thickest organic lamina was 3.44 mm in 1996. The thickest varve (calcite and organic couplet) was 3.76 mm thick and was deposited during 1981. The mean summer/winter/annual thickness measurements were 0.37 mm, 0.89 mm, and 1.26 mm, respectively (Table 2 and Table S1). The established chronology, seasonal lamina, and varve thickness data have contributed to preserving a complete image of the core that can be used for comparative baseline purposes in future analyses with other cores collected from the Crawford Lake basin.

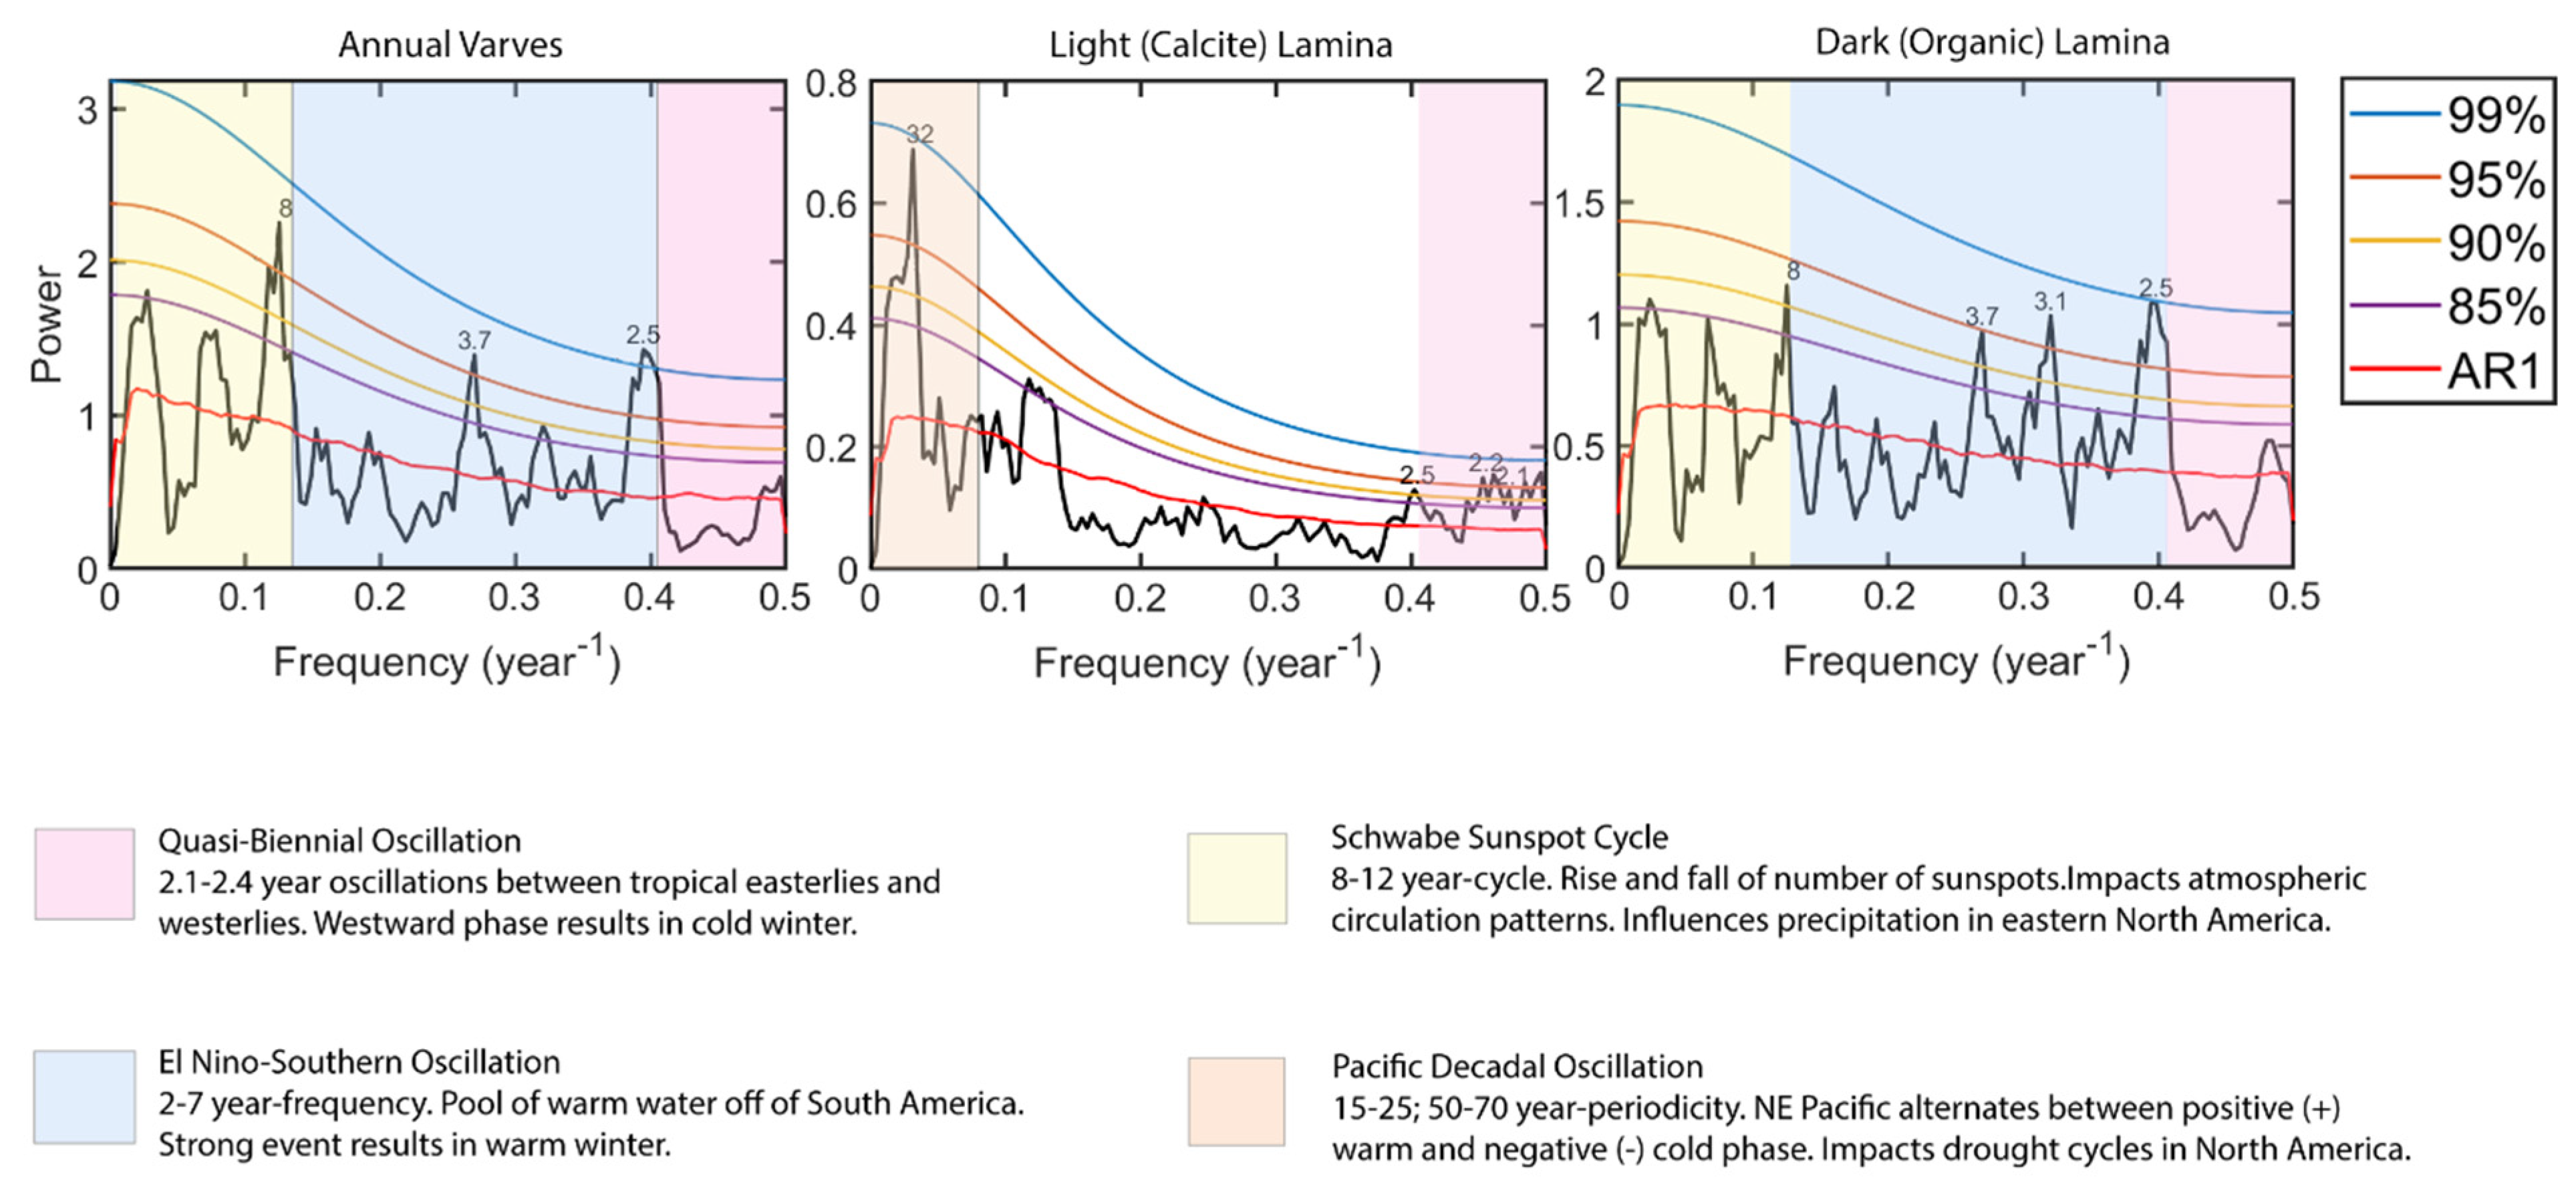
3.2. Spectral Analysis

Spectral analysis of the varve thickness data of each varve spanning the 1870–2000 interval resulted in the identification of several statistically significant cycles in core CRA19-2FT-B2 (Figure 10). In the analysis of total annual deposition, 2.5-, 3.7-, 8- and 8.5-year cycles were detected above the >95% false alarm level. Looking specifically at the calcite components of each couplet, a strong 32-year signal was also present over the 95% false alarm level, with 2.2 and 51-year cycles observed at >90% statistical significance. Analysis of the dark organic rich lamination components revealed the presence of 2.5, 2.6, 3.1 and 3.7-year cycles above the 95% false alarm level and an 8-year cycle at over 90% statistical significance.

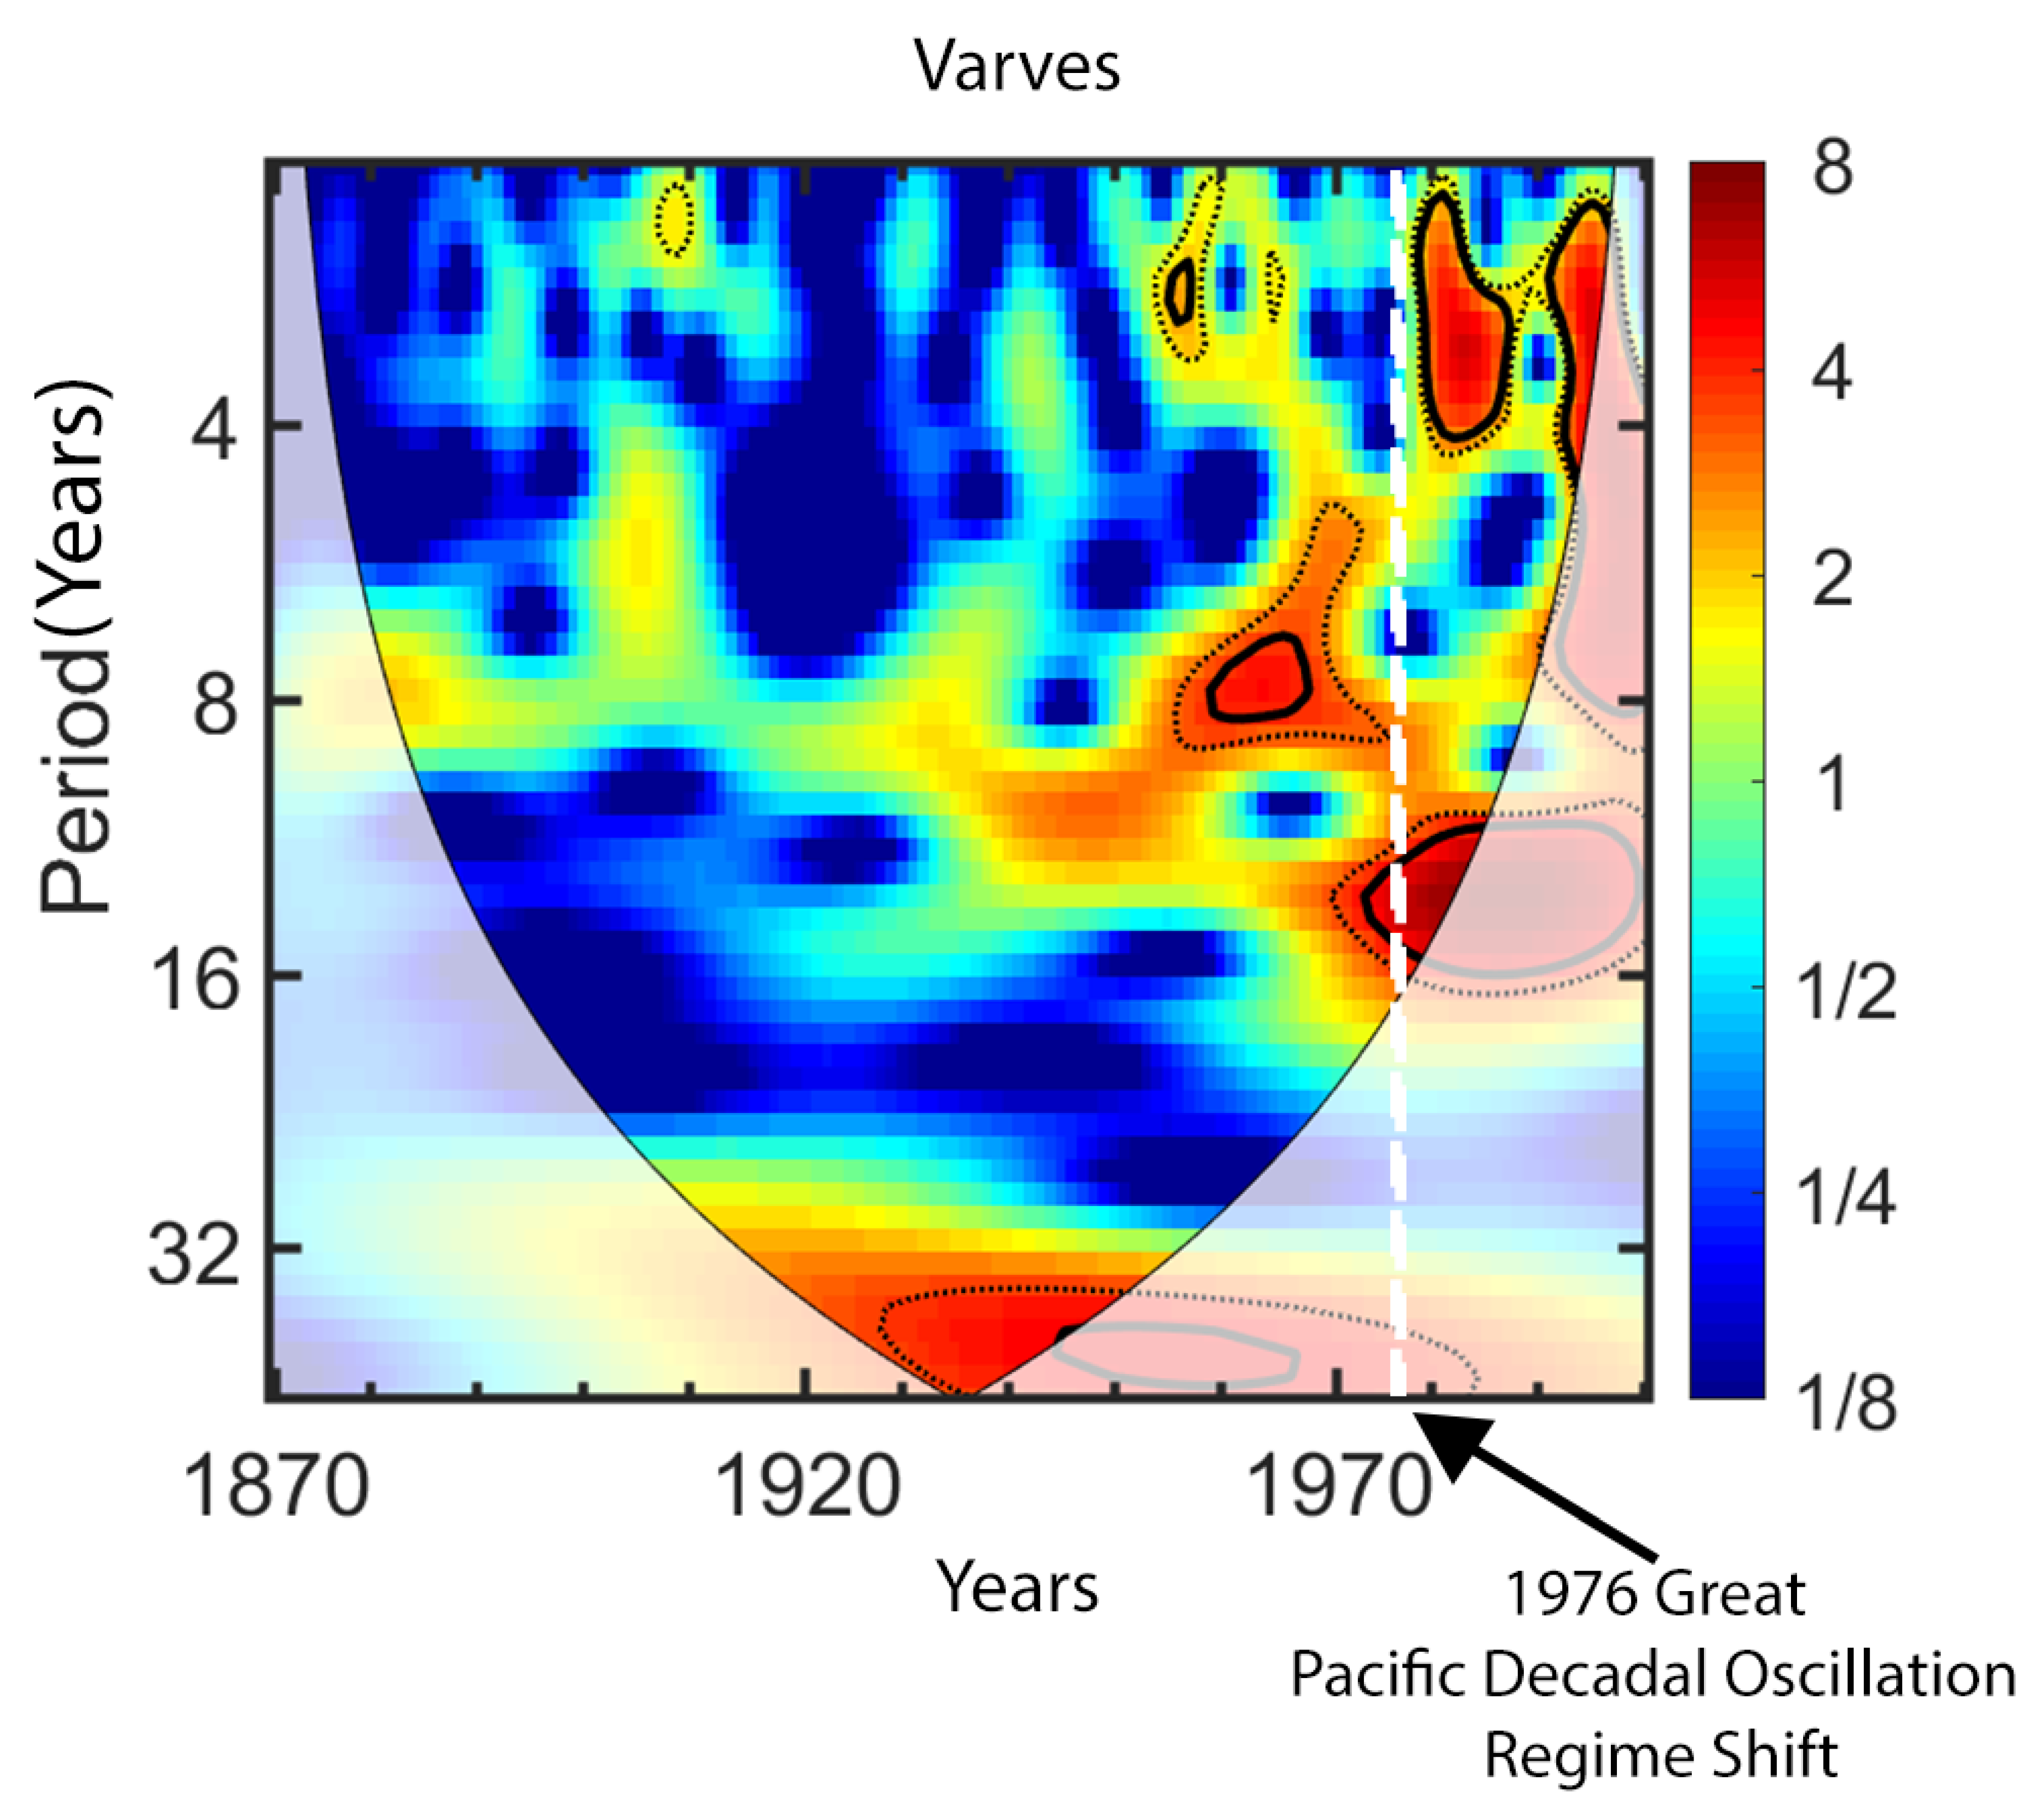
3.3. Continuous Wavelet Transform (CWT) Analysis

Continuous wavelet transforms carried out on the 130-year varve thickness record indicates that periodicities identified with spectral analysis were present intermittently through the 1870–2000 interval (Figure 11). Muted color regions bounded by thin lines in the presented CWTs delineate the statistically significant cone of influence. In the area outside this region of the wavelet spectrum, edge effects became important, with the area within the cone corresponding to actual data analysis, while the area exposed to the edge effect was a trend-based estimation [17,77]. In the 130-year record (Figure 11), repeating 2–4-year cycles were most prominent from 1950–2000, though this pattern appeared periodically earlier in the record. The 8.0–8.5-year cycles were intermittently present in the 1910–2000 interval of the record, being weakly detected from 1910 to 1950 and strongly observed from 1960 to 2000.
There was also some suggestion of a 32–50+ year cycle that persisted throughout the mid-1900s. However, much of this multidecadal cycle resided outside of the cone of influence, making it a possible result of edge effects.

4. Discussion

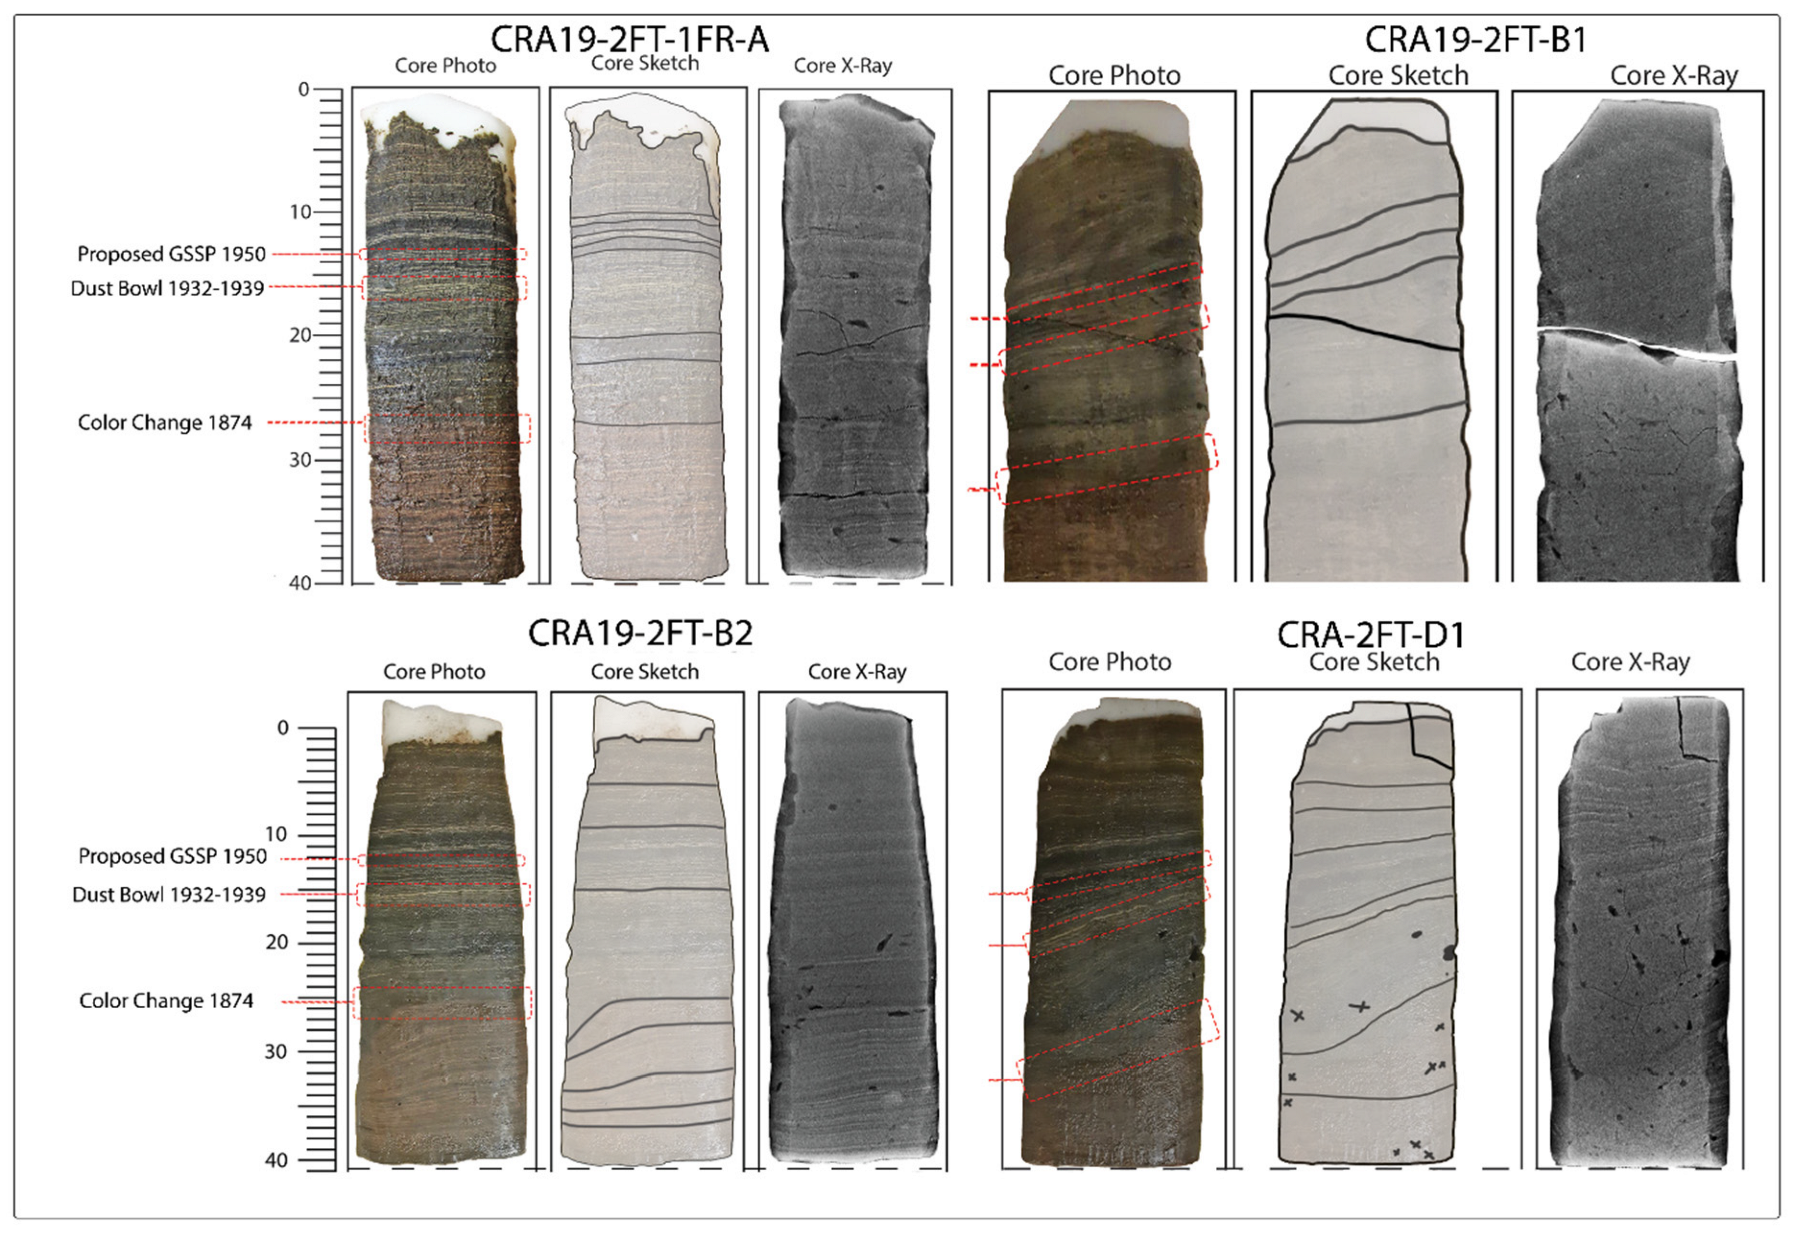
4.1. Sedimentary Record

Varve data show that the thickest light-colored lamination 1.53 mm was deposited in 1981 (Table S1), but this varve lacks the distinct, bright color of calcite-rich laminations we consider “characteristic varves”, suggesting abundant organic matter deposition together with calcite during the biologically productive summer. The 1.41 mm-thick varve deposited in 1935, by contrast, is easily identified due to the bright, consistent color of that summer lamina that only includes organic content in the early and late summer. Microscopic examination of strew slides with the light and dark laminae from the thick 1935 couplet has confirmed that crystals of calcite are the dominant component [36,37]. The drought conditions that dominated during the 1930’s combined with the frequency of hot days was anomalously high in North America, including Southern Ontario [67,68,69,70]. Dust storms were widespread during this period, with 1935 being the standout year where one estimate puts the loss of topsoil from wind erosion at ~771 million metric tons [67]. Cook et al. [67] further investigated the combined impact of increased SST, reduced spring precipitation and the dust feedback resulting from these dust storms and found that the atmospheric dust would have contributed to the severity of the drought conditions during this time. While varve counting has been used in many sedimentary profile studies, e.g., [4], including those within Crawford Lake [20,21], the 210Pb and 137Cs isotope analysis performed on two separate cores, taken three years apart and sampled using the chronology based on varve counting from this study, shows that varve counting within Crawford Lake is reliable and easily reproduced given its distinct features (i.e., color change, Dust Bowl, Great Acceleration).

4.2. Varve Deposition Mechanism and the Anthropocene GSSP

A key component of the sedimentary record in Crawford Lake as the proposed GSSP for the Anthropocene is the presence of undisturbed, seasonally deposited, and laterally continuous varves. Deposition of these laminations is dependent on distinctive limnological conditions that vary seasonally, as well as year to year climatic variability which significantly influences the relative impact of these variables, resulting in deposition of calcite layers of variable thickness and color. Endogenic calcite is commonly precipitated in hard-water lakes during the summer [81], as was suggested by Dickman [34,35] for the light-colored sediments (laminae) from Crawford Lake. Sediment trap analysis confirms the precipitation of calcite during the summer when the mentioned temperature and pH conditions are met [37], capping the organic rich laminae (Figure 2). Climate affects lake productivity, a major component for deposition of the dark organic rich layers, which are deposited during the fall turnover [37,42]. Thick organic-rich varves from 1942 to 1948 and 1961, 1963 to 1968, indicative of higher organic matter and lake productivity, contrast with the lower productivity periods of 1950–1955 when SCPs peaked and a major change in siliceous microfossils occurred, suggesting increased light penetration through the mixolimnion (Figure 7) [30]. It should be noted that the introduction of limiting nutrients to the lake through anthropogenic activities in the catchment likewise had an impact on productivity, influencing the thickness of the dark-colored laminations in the varve couplets [20,82,83]. The above-described Dust Bowl conditions are consistent with those shown to be ideal for calcite precipitation and deposition [36,37], thus we are confident in using 1935 as the main tie-point for assigning this chronology and 1970 as a secondary tie-point based on ground truthing observations [31,80]. The chronology based on varve counting using high-resolution images derived from freeze cores is reliable and easily correlated amongst already collected cores and any future cores taken from the central basin (Figure 5).

4.3. Climate Cycles Influence in Crawford Lake

The high-resolution image analysis of the annually deposited 1870–2000 record preserved in Crawford Lake core CRA19-2FT-B2, and the follow-on time series analysis based on varves and their component light-colored calcite and dark-colored organic-rich lamination thickness data provided unique insights into regional annual and decadal climate trends and cycles. Cycles observed in both the spectral and wavelet analysis results suggest that varve deposition in Crawford Lake is influenced by cyclic climate phenomena. Several large-scale climate oscillations have been identified as influencing the cycles observed in the Crawford Lake varve deposition record. These include: the Quasi-biennial Oscillation (QBO, ~2.1–2.4 years; [48,49,50]); El Niño-Southern Oscillation (ENSO, 2–7-year cycle; [15,17,84,85]); the Schwabe Sunspot cycle (SSC; ~11 years; 9–14 range; [86,87,88]); and possibly the Pacific Decadal Oscillation (PDO, 50–70-years; [62,89]) (Figure 10 and Figure 11). Global teleconnections of these phenomena all have a significant impact on the climate of southern Ontario, which in turn influences the primary productivity and catchment runoff dynamics in lakes of the region, including Crawford Lake [50,90]. In addition, other overprinting phenomena (e.g., the Little Ice Age, which ended in the late 19th century [70]) and anthropogenic influences (e.g., land clearance, lake acidification from industrial fallout; [28,30]) also influence varve deposition [20,21,91].
It is important to note that the expression of these cyclic phenomena do not act independently, with the impact of one or more influences superimposed on one another, either negatively or positively [61,92]. These interactions in turn have a direct impact on sedimentation patterns and primary productivity that is evident in the fossil record, as illustrated for Crawford Lake by Gushulak et al. [28]. A good example of these interactions was provided by Patterson et al. [61] in an investigation of productivity changes in an annually laminated sedimentary sequence from Effingham Inlet on the southwest coast of Vancouver Island. In that study, it was determined that the SSC and ENSO had a significant influence on primary productivity. However, the development of positive and negative phases of the PDO had major influences on the expression of both the SSC and ENSO in the sedimentary record. The nature of these interactions is complex and the subject of ongoing research. Similar interactions likely explain why the cyclic components observed in the Crawford Lake record appear and disappear through time.

4.3.1. Quasi-Biennial Oscillation (QBO)

We attribute high frequency oscillations of 2.1 and 2.3 years observed in the Crawford Lake sedimentary record to the influence of the QBO as reflected in both the light and dark laminae (Figure 10). Sedimentation in Crawford Lake is primarily controlled by precipitation and spring freshet runoff [28,40], as they can lower the alkalinity of the water and concentration of ions needed for calcite precipitation [36,37]. In Canada, the QBO has primarily been observed using winter and spring temperatures and plays a role in the timing of the annual spring loss of lake-ice cover [61,93]. The duration of ice cover on Canadian lakes plays an important role in lake productivity, as the earlier that ice disappears from a lake in the spring means that it warms up and “turns on” earlier, significantly impacting the nature of biotic productivity and sedimentation in lake systems [90]. In southern Ontario, a relationship between the QBO and extreme precipitation has also been recognized [90].
Our analysis indicates that, while the potential role of QBO on sedimentation in Crawford Lake is represented in much of the observed record, there are significant periods when the quasi-biennial signal weakens significantly or disappears entirely. Analysis of the light-colored calcite laminations (Figure 11) shows the strong presence of QBO during the 1930s and 1970/1980s. The strong signals in the 1930s and 1970s coincide with the Dust Bowl and PDO regime shift, respectively, where unusually hot dry conditions and near-global Sea Surface Temperature (SST) anomalies [67,68,69,70] favored the production of the light-colored calcite laminae, also shown in varve thickness measurements where the thickest calcite laminae are recorded in the same periods. At these same time periods, we see the signal lacking in the annual and dark varve analysis, presumably due to the drought-like conditions which would have been reflected more strongly in the calcite layers. A similar intermittent oscillatory behavior has been observed in time-series datasets elsewhere in North America, where similar patterns were interpreted as an indication of phase interference from competing teleconnections (e.g., Greenland, [94]; New England and the Maritimes, [95]; Effingham Inlet, [61]; [49]). We thus interpret intervals in the Crawford Lake record when the probable QBO signal is not expressed in the wavelets due to the influence of other teleconnections (e.g., Atlantic Multi-decadal Oscillation (AMO), ENSO) and other climate drivers (e.g., solar influences) that overwhelm the QBO signal, diminishing its significance until it is indistinguishable from background noise. This interpretation does not, of course, preclude the additional influence of stochastic processes on the observed time series.

4.3.2. El Niño Southern Oscillation (ENSO)

Not all ENSO events impact the Crawford Lake region, but when they do, the anomaly is most noticeable during the winter months [59], as reflected in the spectral analysis of the dark laminations (Figure 10). During El Niño years, warm, dry winter conditions often prevail in southern Ontario, and during La Niña, the winter climate is typically cooler and wetter [96,97].
As described above with QBO, warmer winter weather brought on by El Niño can result in ice cover disappearing earlier in the spring, which significantly impacts lake productivity through the following summer months [49]. As more abundant organisms die out with the onset of colder fall/winter conditions and descend to the lake bottom, thicker, dark-colored organic-rich laminae are produced. Although the influence of El Niño is less pronounced during summer, even a minor increase in lake water temperature would result in greater calcite precipitation in the water column, producing thicker light-colored laminations. The relative influence of ENSO phases also has an impact on runoff from the catchment, particularly during spring freshet with increased stream flow during La Niña and reduced flow associated with El Niño events [67].
In North America, ENSO also has a significant impact on the expression of the Pacific North American (PNA) pattern, a significant influencer of winter temperature and precipitation in its own right [98,99,100]. The PNA pattern is associated with strong fluctuations in the position and strength of the East Asian jet stream. The positive phase of the PNA, which is generally closely associated with El Niño, is in southern Ontario characterized by a lower-than-average winter temperature. In contrast, the negative phase of the PNA tends to be associated with La Niña and is characterized by warmer than average winter temperature [96]. The Little Ice Age (~1300s–1850 in this region) was characterized by a more El Niño-like state, with not only low average summer temperatures but also lower minimum temperatures in general [58,101,102]. Records of glacial advances in mountainous and northern regions of North America also provide evidence of cold summers during the Little Ice Age [101,103,104]. The general El Niño-like state could explain the weaker ENSO-like signal through the earlier part of the record coming out of the LIA. As mentioned with the QBO, phase interference from competing teleconnections during the early part of the record coming out of the LIA interfere with the potential influence of the ENSO signals, as shown in the CWT through the early part of the record where the strong ENSO signal, does not appear until the 1950/1960s, where varves are relatively thin (Figure 11, Supplementary Data A).

4.3.3. Pacific Decadal Oscillation (PDO)

A possible periodicity within the PDO bandwidth is present in the examined Crawford Lake core record beginning about 1930 and is observed in the CWT results (Figure 11) and within the spectral analysis of the light-colored laminae (Figure 10). Of note is the 1976 Pacific climate regime shift (Figure 12) that occurred when the PDO index shifted from dominantly negative (cool conditions) to dominantly positive values (warm conditions). This shift had a significant impact not only on NE Pacific climate but was also experienced far inland [105,106,107]. This transition, because of its widespread influence, has come to be known as the “Great Regime Shift”. It is possible that the anthropogenic stressors through the late 1940s and 50s likely would have obscured the possible observations of a PDO in this data set. The 1976 regime shift is visible in the Crawford Lake record where it also had an impact on the expression of both ENSO and QBO in the post-1976 varve record (Figure 10 and Figure 11). The influence of PDO on the expression of other teleconnections, particularly ENSO, has also been documented elsewhere [108].

4.3.4. Schwabe Sunspot Cycle (SSC)

The observed 7.9–12.8-year cycles observed in the spectral analysis (Figure 10) of the Crawford Lake annual varve thickness data correlates well with the SSC. These are reflected more prominently in the dark, organic-rich, laminations rather than the light, calcite-rich layers (Figure 11). These results demonstrate that lake productivity and catchment dynamics are not only affected by the large-scale ocean-atmosphere teleconnections described above, but also by solar forcing at scales greater than the annual solar driven seasonal cycles. The presence of a record of the SSC within the Crawford Lake core is consistent with numerous previous findings that describe how through both “top down” and “bottom up” amplification processes, solar activity directly impacts climate [89]. These include direct influences on upper atmosphere ozone production and indirect influences on cloud formation, including jet stream trajectory, which in turn collectively has a significant impact on atmosphere-ocean circulation, thus amplifying the relatively weak solar activity fluctuations that occur throughout the ~11-year solar cycle [89,109,110]. At the global scale, Laurenz et al. [111] documented strong correlations between European precipitation patterns and the 11-year SSC, and similar correlations have been observed within Indian rainfall patterns [112]. The SSC has been specifically attributed as the driver of many ~11-year patterns in regional temperature and precipitation observed throughout North America [59,113,114,115,116]. Prokoph et al. [117] recognized a similar 11-year cyclicity in mean annual stream flow data, a metric that can be directly linked to precipitation, from sites across southern Canada. In an analysis of instrumental historical weather data Walsh and Patterson [50,90] observed a direct correlation between the SSC and precipitation throughout eastern North America, including locations close to Crawford Lake.
The CWT results indicate that there was little presence of a decadal signal through to the latter part of the 19th century (Figure 11), suggesting minimal influence of the SSC on sedimentation in Crawford Lake during this time. This interval correlates with the latter phases of the Little Ice Age, an interval when the strength of the SSC was significantly reduced [118].

5. Conclusions

Varve couplets comprising distinct seasonally deposited calcite and organic laminations are very well preserved in cores collected from below the chemocline in Crawford Lake, undisturbed by bioturbation due to elevated salinities within the monimolimnion [37,42]. We utilized a novel, high-resolution photographic image technique to chronologically characterize the depositional record of distinctive varves preserved in a freeze core recovered from Crawford Lake spanning the 1870–2000 interval. These results will be of value to future researchers for the purpose of identifying the age of specific varves, including the proposed Anthropocene GSSP at the base of the calcite lamina deposited in the summer of 1950, and for correlating core records from throughout the Crawford Lake basin.
The thickness of both the light-colored laminae of endogenic calcite and the dark-colored laminae of mainly authigenic organic matter is climate dependent [36,37]. Calcite crystals form in the slightly basic epilimnion during a narrow window during the summer months and descend through the slightly acidic monimolimnion to form a light-colored summer lamina. The cap organic matter accumulates the rest of the year, but more quickly during fall turnover. We compiled seasonal varve thickness measurement data through this time span and used the combined fall (dark-colored organic layers) and summer (light-colored calcite laminations) data to carry out a spectral and continuous wavelet transform time series analysis. The results indicate that several climate teleconnections (Quasi-Biennial Oscillation, El Niño-Southern Oscillation, and possible Pacific Decadal Oscillation) as well as the Schwabe Sunspot Cycle are likely to have impacts on the annual and contained seasonal deposition of varves in Crawford Lake. The interaction of these teleconnections and the Schwabe Sunspot Cycle, as influenced by larger scale climate phenomena (e.g., Little Ice Age), have impacted their expression both negatively and positively in the sedimentary record. A follow-on study has begun to more closely investigate these specific climatic influences.

Supplementary Materials

The following supporting information can be downloaded at: https://www.mdpi.com/article/10.3390/geosciences13030087/s1, Table S1: Complete recording of varve thickness data 1870–2000.

Author Contributions

Conceptualization, R.T.P., F.M.G.M. and K.M.L.; methodology, K.M.L., N.A.N. and C.R.W.; validation, K.M.L., N.A.N., P.B.H. and F.M.G.M.; formal analysis, C.R.W., K.M.L. and B.C.; investigation, K.M.L., C.R.W. and B.M.L.-W.; resources, R.T.P., F.M.G.M., P.B.H. and B.C.; data curation, K.M.L.; writing—original draft preparation, K.M.L., R.T.P., P.B.H. and N.A.N.; writing—review and editing, All Authors; visualization, K.M.L., N.A.N., C.R.W. and B.M.L.-W.; supervision, R.T.P., B.C. and F.M.G.M.; funding acquisition, R.T.P. and F.M.G.M. All authors have read and agreed to the published version of the manuscript.

Funding

This research was supported by Natural Sciences and Engineering Research Council of Canada Discovery Grant #RGPIN05329 to RTP.

Data Availability Statement

The data presented in this study is contained within the supplementary material.

Acknowledgments

We would like to thank the extended Crawford Lake research group as well as all of the individuals from Conservation Halton and the Crawford Lake Conservation Area teams who aided us in our field work. We would also like to thank all the researchers from Carleton, Brock and Queen’s Universities as well as the Canadian Museum of Nature, who have aided with field and lab work for this research. We also acknowledge funding from the Haus der Kulturen der Welt (Berlin) who supported the search for a candidate GSSP site to formally define the Anthropocene.

Conflicts of Interest

The authors declare no conflict of interest. The funders had no role in the design of the study; in the collection, analyses, or interpretation of data; in the writing of the manuscript; or in the decision to publish the results.

References

  1. Smol, J.P. Paleolimnology, an important tool for effective ecosystem management. J. Aquat. Ecosyst. Health 1992, 1, 49–58. [Google Scholar] [CrossRef]
  2. Cohen, A.S. Paleolimnology, The History and Evolution of Lake Systems; Oxford University Press: Oxford, UK, 2004; ISBN 9780195133530. [Google Scholar]
  3. Anderson, R.Y.; Dean, W.E. Lacustrine varve formation through time. Palaeogeogr. Palaeoclimatol. Palaeoecol. 1988, 62, 215–235. [Google Scholar] [CrossRef]
  4. Brauer, A.; Endres, C.; Günter, C.; Litt, T.; Stebich, M.; Negendank, J.F. High resolution sediment and vegetation responses to Younger Dryas climate change in varved lake sediments from Meerfelder Maar, Germany. Quat. Sci. Rev. 1999, 18, 321–329. [Google Scholar] [CrossRef]
  5. Brauer, A. Annually laminated lake sediments and their palaeoclimatic relevance. In The Climate in Historical Times; GKSS School of Environmental Research; Springer: Berlin/Heidelberg, Germany, 2004; pp. 109–127. [Google Scholar] [CrossRef]
  6. Chu, G.; Sun, Q.; Rioual, P.; Boltovskoy, A.; Liu, Q.; Sun, P.; Han, J.; Liu, J. Dinocyst microlaminations and freshwater" red tides" recorded in Lake Xiaolongwan, northeastern China. J. Paleolimnol. 2008, 39, 319–333. [Google Scholar] [CrossRef]
  7. Zolitschka, B.; Francus, P.; Ojala, A.E.K.; Schimmelmann, A. Varves in lakes sediments—A review. Quat. Sci. Rev. 2015, 117, 1–41. [Google Scholar] [CrossRef]
  8. Renberg, I. Concentration and annual accumulation values of heavy metals in lake sediments, their significance in studies of the history of heavy metal pollution. In Paleolimnology IV; Developments in Hydrobiology; Springer: Berlin/Heidelberg, Germany, 1987; Volume 37, pp. 379–385. [Google Scholar] [CrossRef]
  9. Leemann, A.; Niessen, F. Varve formation and the climatic record in an Alpine proglacial lake, calibrating annually-laminated sediments against hydrological and meteorological data. Holocene 1994, 4, 1–8. [Google Scholar] [CrossRef]
  10. Outridge, P.M.; Stern, G.A.; Hamilton, P.B.; Percival, J.B.; McNeely, R.; Lockhart, W.L. Trace metal profiles in the varved sediment of an Arctic lake. Geochim. Cosmochim. Acta 2005, 69, 4881–4894. [Google Scholar] [CrossRef]
  11. Klaminder, J.; Appleby, P.; Crook, P.; Renberg, I. Post-deposition diffusion of 137Cs in lake sediment, Implications for radiocaesium dating. Sedimentology 2012, 59, 2259–2267. [Google Scholar] [CrossRef]
  12. Morse, J.W.; Arvidson, R.S.; Lüttge, A. Calcium carbonate formation and dissolution. Chem. Rev. 2007, 107, 342–381. [Google Scholar] [CrossRef]
  13. Boere, A.C.; Damsté, J.S.S.; Rijpstra, W.I.C.; Volkman, J.K.; Coolen, M.J. Source-specific variability in post-depositional DNA preservation with potential implications for DNA based paleoecological records. Org. Geochem. 2011, 42, 1216–1225. [Google Scholar] [CrossRef]
  14. Parducci, L.; Nota, K.; Wood, J. Reconstructing past vegetation communities using ancient DNA from lake sediments. In Paleogenomics; Springer: Cham, Switzerland, 2018; pp. 163–187. [Google Scholar] [CrossRef]
  15. Prokoph, A.; Patterson, R.T. Application of wavelet and regression analysis in assessing temporal and geographic climate variability, Eastern Ontario, Canada as a case study. Atmos. Ocean. 2004, 42, 201–212. [Google Scholar] [CrossRef]
  16. Ólafsdóttir, K.B.; Geirsdóttir, Á.; Miller, G.H.; Larsen, D.J. Evolution of NAO and AMO strength and cyclicity derived from a 3-ka varve-thickness record from Iceland. Quat. Sci. Rev. 2013, 69, 142–154. [Google Scholar] [CrossRef]
  17. Walsh, C.R.; Patterson, R.T. Regional impact of large-scale climate oscillations on ice out variability in New Brunswick and Maine. PeerJ. 2022, 10, e13741. [Google Scholar] [CrossRef] [PubMed]
  18. Rybak, M.; Rybak, I.; Dickman, M. Fossil chrysophycean cyst flora in a small meromictic lake in southern Ontario, and its paleoecological interpretation. Can. J. Bot. 1987, 65, 2425–2440. [Google Scholar] [CrossRef]
  19. Rybak, M.; Dickman, M. Paleoecological reconstruction of changes in the productivity of a small, meromictic lake in southern Ontario, Canada. Hydrobiologia 1988, 169, 293–306. [Google Scholar] [CrossRef]
  20. Ekdahl, E.J.; Teranes, J.L.; Guilderson, T.P.; Turton, C.L.; McAndrews, J.H.; Wittkokp, C.A.; Stoermer, E.F. Prehistorical record of cultural eutrophication from Crawford Lake, Canada. Geology 2004, 32, 745. [Google Scholar] [CrossRef] [Green Version]
  21. Ekdahl, E.J.; Teranes, J.L.; Wittkop, C.A.; Stoermer, E.F.; Reavie, E.D.; Smol, J.P. Diatom assemblage response to Iroquoian and Euro-Canadian eutrophication of Crawford Lake, Ontario, Canada. J. Paleolimnol. 2007, 37, 233–246. [Google Scholar] [CrossRef]
  22. McAndrews, J.H.; Turton, C.L. Canada Geese Dispersed Cultigen Pollen Grains from Prehistoric Iroquoian Fields to Crawford Lake, Ontario, Canada. Palynology 2007, 31, 9–18. [Google Scholar] [CrossRef]
  23. McAndrews, J.H.; Boyko-Diakonow, M. Pollen analysis of varved sediment at Crawford Lake, Ontario, evidence of Indian and European farming. Quat. Geol. Can. Greenl. 1989, 1, 528–530. [Google Scholar]
  24. Krueger, A.; McCarthy, F. Great Canadian lagerstätten 5. Crawford lake–A Canadian holocene lacustrine konservat-lagerstätte with two-century-old viable dinoflagellate cysts. Geosci. Can. J. Geol. Assoc. Can. 2016, 43, 123–132. [Google Scholar] [CrossRef]
  25. McCarthy, F.M.; Riddick, N.L.; Volik, O.; Danesh, D.C.; Krueger, A.M. Algal palynomorphs as proxies of human impact on freshwater resources in the Great Lakes region. Anthropocene 2018, 21, 16–31. [Google Scholar] [CrossRef]
  26. McNeill, J.R.; Engelke, P. The Great Acceleration, an Environmental History of the Anthropocene Since 1945; The Belknap Press of Harvard University Press: Cambridge, MA, USA, 2014. [Google Scholar]
  27. Steffen, W.; Broadgate, W.; Deutsch, L.; Gaffney, O.; Ludwig, C. The trajectory of the Anthropocene, the great acceleration. Anthr. Rev. 2015, 2, 81–98. [Google Scholar] [CrossRef]
  28. Gushulak, C.; Marshall, M.; Cumming, B.; Llew-Williams, B.; Patterson, R.T.; McCarthy, F.M.G. Siliceous algae response to the ‘Great Acceleration’ of the mid-twentieth century in Crawford Lake (Ontario, Canada), a candidate for the Anthropocene GSSP. Anthr. Rev. 2022, 9, 571–590. [Google Scholar] [CrossRef]
  29. Head, M.J.; Steffen, W.; Fagerlind, D.; Waters, C.N.; Poirier, C.; Syvitski, J.; Zalasiewicz, J.A.; Barnosky, A.D.; Cearreta, A.; Jeandel, C.; et al. The Great Acceleration is real and provides a quantitative basis for the proposed Anthropocene series/Epoch. Episodes 2022, 45, 359–376. [Google Scholar] [CrossRef]
  30. McCarthy, F.M.G.; Patterson, R.T.; Head, M.J.; Riddick, N.L.; Cumming, B.F.; Hamilton, P.B.; Pisaric, M.F.J.; Gushulak, A.C.; Leavitt, P.R.; Lafond, K.M.; et al. The varved succession of Crawford Lake, Milton, Ontario, Canada as a candidate Global Boundary Stratotype Section and Point for the Anthropocene Series/Epoch. Anthr. Rev. 2023; in press. [Google Scholar] [CrossRef]
  31. Marshall, M.; Hamilton, P.B.; Lafond, K.M.; Nasser, N.A.; McCarthy, F.M.G.; Patterson, R.T. Annual-scale assessment of mid-20th century anthropogenic impacts on the algal ecology of Crawford Lake, Ontario, Canada. Peer J. 2023; in press. [Google Scholar] [CrossRef] [PubMed]
  32. Waters, C.N.; Zalasiewicz, J.; Summerhayes, C.; Fairchild, I.J.; Rose, N.L.; Loader, J.; Shotyk, W.; Caerreta, A.; Head, M.J.; Williams, M.; et al. Global Boundary Stratotype Section and Point (GSSP) for the Anthropocene Series, Where and how to look for potential candidates. Earth-Sci. Rev. 2018, 178, 379–429. [Google Scholar] [CrossRef] [Green Version]
  33. Waters, C.N.; Turner, S.D.; Zalasiewicz, J.; Head, M.J. Candidate sites and other reference sections for the Global boundary Stratotype Section and Point (GSSP) of the Anthropocene Series. Anthr. Rev. 2023; in submission. [Google Scholar]
  34. Dickman, M.D. A possible varving mechanism for meromictic lakes. Quat. Res. 1979, 11, 113–124. [Google Scholar] [CrossRef]
  35. Dickman, M.D. Seasonal succession and microlamina formation in a meromictic lake displaying varved sediments. Sedimentology 1985, 32, 109–118. [Google Scholar] [CrossRef]
  36. Llew-Williams, B. The Hydrological and Limnological Characterization of Two Canadian Water Catchments Sensitive to Anthropogenic Influences, Crawford Lake, Ontario and Old Crow Flats, Yukon. Master’s Thesis, Brock University, St. Catharines, ON, Canada, 2022. [Google Scholar]
  37. Llew-Williams, B.M.; McCarthy, F.M.; Krueger, A.M.; Riddick, N.L.; MacKinnon, M.; Lafond, K.M.; Patterson, R.T.; Nasser, N.A.; Head, M.J.; Pisaric, M.; et al. Varve formation in meromictic Crawford Lake, Ontario, Canada, important process for characterizing the Anthropocene epoch. 2023; in review. [Google Scholar] [CrossRef]
  38. Yu, Z.; McAndrews, J.H.; Eicher, U. Middle Holocene dry climate caused by change in atmospheric circulation patterns, Evidence from lake levels and stable isotopes. Geology 1997, 25, 251–254. [Google Scholar] [CrossRef]
  39. Boyko, M. European Impact on the Vegetation around Crawford Lake in Southern Ontario. Ph.D. Thesis, University of Toronto, Toronto, ON, USA, 1973. [Google Scholar]
  40. Boyko-Diakonow, M. The laminated sediments of Crawford Lake, southern Ontario, Canada. Moraines Varves. AA Balkema Rotterdam 1979, 303–307. [Google Scholar]
  41. Zadereev, E.S.; Boehrer, B.; Gulati, R.D. Chapter 1. Introduction, Meromictic Lakes, Their Terminology and Geographic Distribution. In Ecology of Meromictic Lakes; Springer International Publishing: New Yor, NY, USA, 2017; pp. 1–11. [Google Scholar] [CrossRef]
  42. Heyde, A. Crawford Lake Consumers, Water Column and Palynological Studies. Master’s Thesis, Brock University, St. Catherines, ON, Canada, 2021. Available online: https://dr.library.brocku.ca/handle/10464/15161 (accessed on 8 August 2021).
  43. Francis, A. Microbial mobilization and immobilization of plutonium. J. Alloy. Compd. 2007, 444, 500–505. [Google Scholar] [CrossRef]
  44. Geckeis, H.; Salbu, B.; Chaefer, T.; Zavarin, M. Environmental Chemistry of Plutonium, Plutonium Handbook; Lawrence Livermore National Laboratory: Livermore, CA, USA, 2016. [Google Scholar]
  45. Zalasiewicz, J.; Waters, C.N.; Head, M.J.; Poirier, C.; Summerhayes, C.P.; Leinfelder, R.; Grinevald, J.; Steffen, W.; Syvitski, J.; Haff, P.; et al. A formal Anthropocene is compatible with but distinct from its diachronous anthropogenic counterparts, A response to W.F. Ruddiman’s ‘three flaws in defining a formal Anthropocene’. Prog. Phys. Geogr. Earth Environ. 2019, 43, 319–333. [Google Scholar] [CrossRef]
  46. Bonk, A.; Tylmann, W.; Amann, B.; Enters, D.; Grosjean, M. Modern limnology and varve-formation processes in Lake Żabińskie, northeastern Poland, comprehensive process studies as a key to understand the sediment record. J. Limnol. 2015, 74, 358–370. [Google Scholar] [CrossRef] [Green Version]
  47. Roeser, P.; Dräger, N.; Brykała, D.; Ott, F.; Pinkerneil, S.; Gierszewski, P.; Lindemann, C.; Plessen, B.; Brademann, B.; Kaszubski, M.; et al. Differences in calcite varve formation discerned by a dual lake monitoring approach in the southern Baltic lowlands. In Proceedings of the EGU General Assembly Conference, Online, 4–8 May 2020; Available online: https://ui.adsabs.harvard.edu/link_gateway/2020EGUGA..2212343R/ (accessed on 8 August 2021). [CrossRef]
  48. Baldwin, M.P.; Gray, L.J.; Dunkerton, T.J.; Hamilton, K.; Haynes, P.H.; Randel, W.J.; Holton, J.R.; Alexander, M.J.; Hirota, I.; Horinouchi, T.; et al. The quasi-biennial oscillation. Rev. Geophys. 2001, 39, 179–229. [Google Scholar] [CrossRef]
  49. Patterson, R.T.; Swindles, G.T. Influence of ocean-atmospheric oscillations on lake ice phenology in Eastern North America. Clim. Dyn. 2015, 45, 2293–2308. [Google Scholar] [CrossRef] [Green Version]
  50. Walsh, C.R.; Patterson, R.T. Precipitation and temperature trends and cycles derived from historical 1890–2019 weather data for the City of Ottawa, Ontario, Canada. Environments 2022, 9, 35. [Google Scholar] [CrossRef]
  51. Lau, K.M.; Sheu, P. Annual cycle, Quasi-Biennial Oscillation, and Southern Oscillation in global precipitation. J. Geophys. Res. Atmos. 1988, 93, 10975–10988. [Google Scholar] [CrossRef]
  52. Brázdil, R.; Zolotokrylin, A. The QBO signal in monthly precipitation fields over Europe. Theor. Appl. Climatol. 1995, 51, 3–12. [Google Scholar] [CrossRef]
  53. Inoue, M.; Yamakawa, S. Relationships between Stratospheric Quasi-Biennial Oscillation (QBO). J. Geogr. 2010, 119, 441–450. [Google Scholar] [CrossRef] [Green Version]
  54. Seo, J.; Choi, W.; Youn, D.; Park, D.-S.R.; Kim, J.Y. Relationship between the stratospheric Quasi-Biennial Oscillation and the spring rainfall in the western North Pacific. Geophys. Res. Lett. 2013, 40, 5949–5953. [Google Scholar] [CrossRef]
  55. Nastos, P.T.; Zerefos, C.S. On extreme daily precipitation totals at Athens, Greece. Adv. Geosci. 2007, 10, 59–66. [Google Scholar] [CrossRef] [Green Version]
  56. Becker, S.; Hartmann, H.; Coulibaly, M.; Zhang, Q.; Jiang, T. Quasi periodicities of extreme precipitation events in the Yangtze River basin, China. Theor. Appl. Climatol. 2008, 94, 139–152. [Google Scholar] [CrossRef]
  57. Han, T.; Li, S.; Hao, X.; Guo, X. A statistical prediction model for summer extreme precipitation days over the northern central China. Int. J. Climatol. 2020, 40, 4189–4202. [Google Scholar] [CrossRef]
  58. Henke, L.M.; Lambert, F.H.; Charman, D.J. Was the little ice age more or less El Niño-like than the mediaeval climate anomaly? Evidence from hydrological and temperature proxy data. Clim. Past Discuss. 2015, 11, 5549–5604. [Google Scholar] [CrossRef] [Green Version]
  59. Nalley, D.; Adamowski, J.; Khalil, B.; Ozga-Zielinski, B. Trend detection in surface air temperature in Ontario and Quebec, Canada during 1967–2006 using the discrete wavelet transform. Atmos. Res. 2013, 132, 375–398. [Google Scholar] [CrossRef]
  60. Schneider, N.; Cornuelle, B.D. The Forcing of the Pacific Decadal Oscillation. J. Clim. 2005, 18, 4355–4372. [Google Scholar] [CrossRef]
  61. Patterson, R.T.; Chang, A.S.; Prokoph, A.; Roe, H.M.; Swindles, G.T. Influence on the Pacific Decadal Oscillation, El Niño-Southern Oscillation and solar forcing on climate and primary productivity changes in the northeast Pacific. Quat. Int. 2013, 310, 124–139. [Google Scholar] [CrossRef]
  62. Dalton, A.S.; Patterson, R.T.; Roe, H.M.; Macumber, A.L.; Swindles, G.T.; Galloway, J.M.; Falck, H. Late Holocene climatic variability in Subarctic Canada, Insights from a high-resolution lake record from the central Northwest Territories. PLoS ONE. 2018, 13, e0199872. [Google Scholar] [CrossRef] [Green Version]
  63. Patterson, R.T.; Kumar, A. A review of current testate rhizopod (thecamoebian) research in Canada. Palaeogeogr. Palaeoclimatol. Palaeoecol. 2002, 180, 225–251. [Google Scholar] [CrossRef]
  64. Galloway, J.M.; Macumber, A.; Patterson, R.T.; Falck, H.; Hadlari, T.; Madsen, E. Paleoclimatological Assessment of the Southern Northwest Territories and Implications for the Long-Term Viability of the Tibbitt to Contwoyto Winter Road, Part I, Core Collection; Northwest Territories Geoscience Office: Yellowknife, NT, Canada, 2010; NWT Open Report 2010-002; 23p. [CrossRef]
  65. McAndrews, J.H. Fossil history of man’s impact on the Canadian flora, An example from southern Ontario. Can. Bot. Assoc. Bull. 1976, 9, 1–6. [Google Scholar]
  66. Crusius, J.; Anderson, R.F. Core compression and surficial sediment loss of lake sediments of high porosity caused by gravity coring. Limnol. Oceanogr. 1991, 36, 1021–1030. [Google Scholar] [CrossRef]
  67. Cook, B.I.; Miller, R.L.; Seager, R. Dust and sea surface temperature forcing of the 1930s “Dust Bowl” drought. Geophys. Res. Lett. 2008, 35, 1–5. [Google Scholar] [CrossRef]
  68. Seager, R.; Kushnir, Y.; Ting, M.; Cane, M.; Naik, N.; Miller, J. Would advance knowledge of 1930s SSTs have allowed prediction of the Dust Bowl drought? J. Clim. 2008, 21, 3261–3281. [Google Scholar] [CrossRef] [Green Version]
  69. Donat, M.G.; King, A.D.; Overpeck, J.T.; Alexander, L.V.; Durre, I.; Karoly, D.J. Extraordinary heat during the 1930s US Dust Bowl and associated large-scale conditions. Clim. Dyn. 2016, 46, 413–426. [Google Scholar] [CrossRef]
  70. Jacques, J.M.S.; Cumming, B.F.; Smol, J.P. A 900-year pollen-inferred temperature and effective moisture record from varved Lake Mina, west-central Minnesota, USA. Quat. Sci. Rev. 2008, 27, 781–796. [Google Scholar] [CrossRef]
  71. Laird, K.R.; Das, B.; Kingsbury, M.; Moos, M.T.; Pla-Rabes, S.; Ahad, J.M.; Wiltse, B.; Cumming, B.F. Paleolimnological assessment of limnological change in 10 lakes from northwest Saskatchewan downwind of the Athabasca oils sands based on analysis of siliceous algae and trace metals in sediment cores. Hydrobiologia 2013, 720, 55–73. [Google Scholar] [CrossRef]
  72. Prokoph, A.; Fowler, A.D.; Patterson, R.T. Evidence for periodicity and nonlinearity in a high-resolution fossil record of long-term evolution. Geology 2000, 28, 867–870. [Google Scholar] [CrossRef]
  73. MathWorks. MATLAB Version 9.6.0.10 (Time Series); The MathWorks Inc.: Natick, MA, USA, 2019. [Google Scholar]
  74. Thomson, D.J. Spectrum estimation and harmonic analysis. Proc. IEEE 1982, 70, 1055–1096. [Google Scholar] [CrossRef] [Green Version]
  75. Husson, D.; Thibault, N.; Galbrun, B.; Gardin, S.; Minoletti, F.; Sageman, B.; Huret, E. Lower Maastrichtian cyclostratigraphy of the Bidart section (Basque Country, SW France), A remarkable record of precessional forcing. Palaeogeogr. Palaeoclimatol. Palaeoecol. 2014, 395, 176–197. [Google Scholar] [CrossRef] [Green Version]
  76. Dorothée. Red Noise Confidence Levels. MATLAB Central File Exchange. Retrieved 26 August 2020. Available online: https://www.mathworks.com/matlabcentral/fileexchange/45539-rednoise_confidencelevels (accessed on 26 August 2020).
  77. Torrence, C.; Compo, G.P. A practical guide to wavelet analysis. Bull. Am. Meteorol. Soc. 1998, 79, 61–78. [Google Scholar] [CrossRef]
  78. Syvitski, J.; Waters, C.N.; Day, J.; Milliman, J.D.; Summerhayes, C.; Steffen, W.; Zalasiewicz, J.; Cearreta, A.; Galuszka, A.; Hajdas, I.; et al. Extraordinary human energy consumption and resultant geological impacts beginning around 1950 CE initiated the proposed Anthropocene Epoch. Commun. Earth Environ. 2020, 1, 32. [Google Scholar] [CrossRef]
  79. United Nations Scientific Committee on the Effects of Atomic Radiation. UNSCEAR 2000 Report Vol I. In Sources and Effects of Ionizing Radiation. Annex D, Medical Radiation Exposures; UNSCEAR; United Nations: New York, NY, USA, 2000. [Google Scholar]
  80. Bush, I.C.; Cwynar, L.C. Crawford Lake research and development project. In Halton Regional Conservation Authority; Halton Region Conservation Authority: Halton, ON, Canada, 1972; p. 58. [Google Scholar]
  81. Brunskill, G.J.; Ludlam, S.D. Fayetteville Green Lake, New York. I. Physical and chemical limnology 1. Limnol. Oceanogr. 1969, 14, 817–829. [Google Scholar] [CrossRef]
  82. Dustin, N.M.; Wilkinson, B.H.; Owen, R.M. Littlefield Lake, Michigan, Carbonate budget of Holocene sedimentation in a temperate-region lacustrine system 1. Limnol. Oceanogr. 1986, 31, 1301–1311. [Google Scholar] [CrossRef] [Green Version]
  83. McAndrews, J.H.; Turton, C.L. Fungal spores record Iroquoian and Canadian agriculture in 2nd millennium a.d. sediment of Crawford Lake, Ontario, Canada. Veg. Hist. Archaeobotany 2010, 19, 495–501. [Google Scholar] [CrossRef]
  84. Fu, W.; Steinschneider, S. A diagnostic-predictive assessment of winter precipitation over the Laurentian Great Lakes, Effects of ENSO and other teleconnections. J. Hydrometeorol. 2019, 20, 117–137. [Google Scholar] [CrossRef]
  85. Ramesh, N.; Murtugudde, R. All flavours of El Niño have similar early subsurface origins. Nat. Clim. Chang. 2013, 3, 42–46. [Google Scholar] [CrossRef]
  86. Gray, L.J.; Beer, J.; Geller, M.; Haigh, J.D.; Lockwood, M.; Matthes, K.; Cubasch, U.; Fleitmann, D.; Harrison, D.; Hood, L.; et al. Solar influences on climate. Rev. Geophys. 2010, 48. [Google Scholar] [CrossRef] [Green Version]
  87. Martin-Puertas, C.; Matthes, K.; Brauer, A.; Muscheler, R.; Hansen, F.; Petrick, C.; Aldahan, A.; Possnert, G.; Van Geel, B. Regional atmospheric circulation shifts induced by a grand solar minimum. Nat. Geosci. 2012, 5, 397–401. [Google Scholar] [CrossRef] [Green Version]
  88. Usoskin, I.G.; Mursula, K.; Arlt, R.; Kovaltsov, G.A. A solar cycle lost in 1793–1800, early sunspot observations resolve the old mystery. Astrophys. J. 2009, 700, L154. [Google Scholar] [CrossRef]
  89. Deser, C.; Alexander, M.A.; Xie, S.P.; Phillips, A.S. Sea surface temperature variability, Patterns and mechanisms. Annu. Rev. Mar. Sci. 2010, 2, 115–143. [Google Scholar] [CrossRef] [PubMed] [Green Version]
  90. Walsh, C.R.; Patterson, R.T. Attribution of Observed Periodicity in Extreme Weather Events in Eastern North America. Earth Space Sci. 2022, 9, e2022EA002359. [Google Scholar] [CrossRef]
  91. Clark, J.; Royall, P. Transformation of a northern hardwood forest by aboriginal (Iroquois) fire, Charcoal evidence from Crawford Lake, Ontario, Canada. Holocene 1994, 5, 1–9. [Google Scholar] [CrossRef]
  92. Goodrich, G.B. Multidecadal climate variability and drought in the United States. Geogr. Compass 2007, 1, 713–738. [Google Scholar] [CrossRef]
  93. Shabbar, A.; Bonsal, B. Associations between low frequency variability modes and winter temperature extremes in Canada. Atmos. -Ocean. 2004, 42, 127–140. [Google Scholar] [CrossRef] [Green Version]
  94. Appenzeller, C.; Stocker, T.F.; Anklin, M. North Atlantic Oscillation dynamics recorded in Greenland ice cores. Science 1998, 282, 446–449. [Google Scholar] [CrossRef]
  95. Hubeny, J.B.; King, J.W.; Cantwell, M. Anthropogenic influences on estuarine sedimentation and ecology, examples from the varved sediments of the Pettaquamscutt River Estuary, Rhode Island. J. Paleolimnol. 2009, 41, 297–314. [Google Scholar] [CrossRef]
  96. Shabbar, A.; Khandekar, M. The impact of El Nino-Southern oscillation on the temperature field over Canada, Research note. Atmos. -Ocean. 1996, 34, 401–416. [Google Scholar] [CrossRef]
  97. Shabbar, A.; Bonsal, B.; Khandekar, M. Canadian precipitation patterns associated with the Southern Oscillation. J. Clim. 1997, 10, 3016–3027. [Google Scholar] [CrossRef]
  98. Gobena, A.K.; Gan, T.Y. Low-frequency variability in Southwestern Canadian stream flow, links with large-scale climate anomalies. Int. J. Climatol. 2006, 26, 1843–1869. [Google Scholar] [CrossRef]
  99. Horel, J.D.; Wallace, J.M. Planetary-scale atmospheric phenomena associated with the Southern Oscillation. Mon. Weather. Rev. 1981, 109, 813–829. [Google Scholar] [CrossRef]
  100. Soulard, N.; Lin, H.; Yu, B. The changing relationship between ENSO and its extratropical response patterns. Sci. Rep. 2019, 9, 1–10. [Google Scholar] [CrossRef] [PubMed] [Green Version]
  101. Moore, J.J.; Hughen, K.A.; Miller, G.H.; Overpeck, J.T. Little Ice Age recorded in summer temperature reconstruction from vared sediments of Donard Lake, Baffin Island, Canada. J. Paleolimnol. 2001, 25, 503–517. [Google Scholar] [CrossRef]
  102. Dee, S.G.; Cobb, K.M.; Emile-Geay, J.; Ault, T.R.; Edwards, R.L.; Cheng, H.; Charles, C.D. No consistent ENSO response to volcanic forcing over the last millennium. Science 2020, 367, 1477–1481. [Google Scholar] [CrossRef]
  103. Luckman, B.H. The little ice age in the Canadian Rockies. Geomorphology 2000, 32, 357–384. [Google Scholar] [CrossRef]
  104. Lapointe, F.; Bradley, R.S.; Francus, P.; Balascio, N.L.; Abbott, M.B.; Stoner, J.S.; St-Onge, G.; De Coninck, A.; Labarre, T. Annually resolved Atlantic sea surface temperature variability over the past 2,900 y. Proc. Natl. Acad. Sci. USA 2020, 117, 27171–27178. [Google Scholar] [CrossRef]
  105. Mantua, N.J.; Hare, S.R.; Zhang, Y.; Wallace, J.M.; Francis, R.C. A Pacific interdecadal climate oscillation with impacts on salmon production. Bull. Am. Meteorol. Soc. 1997, 78, 1069–1080. [Google Scholar] [CrossRef]
  106. Mantua, N.J.; Hare, S.R. The Pacific decadal oscillation. J. Oceanogr. 2002, 58, 35–44. [Google Scholar] [CrossRef]
  107. Hartmann, B.; Wendler, G. The significance of the 1976 Pacific climate shift in the climatology of Alaska. J. Clim. 2005, 18, 4824–4839. [Google Scholar] [CrossRef] [Green Version]
  108. Rao, J.; Ren, R.; Xia, X.; Shi, C.; Guo, D. Combined impact of El Niño–Southern Oscillation and Pacific Decadal Oscillation on the northern winter stratosphere. Atmosphere 2019, 10, 211. [Google Scholar] [CrossRef] [Green Version]
  109. Labitzke, K. The global signal of the 11-year sunspot cycle in the atmosphere, When do we need the QBO? Meteorol. Zeitschrift. 2001, 12, 209–216. [Google Scholar] [CrossRef] [Green Version]
  110. Meehl, G.A.; Arblaster, J.M.; Matthes, K.; Sassi, F.; Van Loon, H. Amplifying the Pacific climate system response to a small 11-year solar cycle forcing. Science 2009, 325, 1114–1118. [Google Scholar] [CrossRef] [Green Version]
  111. Laurenz, L.; Lüdecke, H.J.; Lüning, S. Influence of solar activity changes on European rainfall. J. Atmos. Sol. Terr. Phys. 2019, 185, 29–42. [Google Scholar] [CrossRef]
  112. Ananthakrishnan, R.; Parthasarathy, B. Indian rainfall in relation to the sunspot cycle, 1871–1978. J. Climatol. 1984, 4, 149–169. [Google Scholar] [CrossRef]
  113. Currie, R.G.; O’Brien, D.P. Periodic 18.6-year and cyclic 10 to 11 year signals in northeastern United States precipitation data. J. Climatol. 1988, 8, 255–281. [Google Scholar] [CrossRef]
  114. Currie, R.G. Luni-solar 18.6-and solar cycle 10--11-year signals in USA air temperature records. Int. J. Climatol. 1993, 13, 31–50. [Google Scholar] [CrossRef]
  115. Mendoza, B.; Lara, A.; Maravilla, D.; Ja´uregui, E. Temperature variability in central Mexico and its possible association to solar activity. J. Atmos. Sol. -Terr. Phys. 2001, 63, 1891–1900. [Google Scholar] [CrossRef]
  116. Mendoza, B.; Velasco, V.; J´auregui, E. A study of historical droughts in southeastern Mexico. J. Clim. 2006, 19, 2916–2934. [Google Scholar] [CrossRef]
  117. Prokoph, A.; Adamowski, J.; Adamowski, K. Influence of the 11-year solar cycle on annual streamflow maxima in Southern Canada. J. Hydrol. 2012, 442, 55–62. [Google Scholar] [CrossRef]
  118. Lamb, H.H. Climate, History and the Modern World; Routledge: London, UK, 2002. [Google Scholar] [CrossRef]
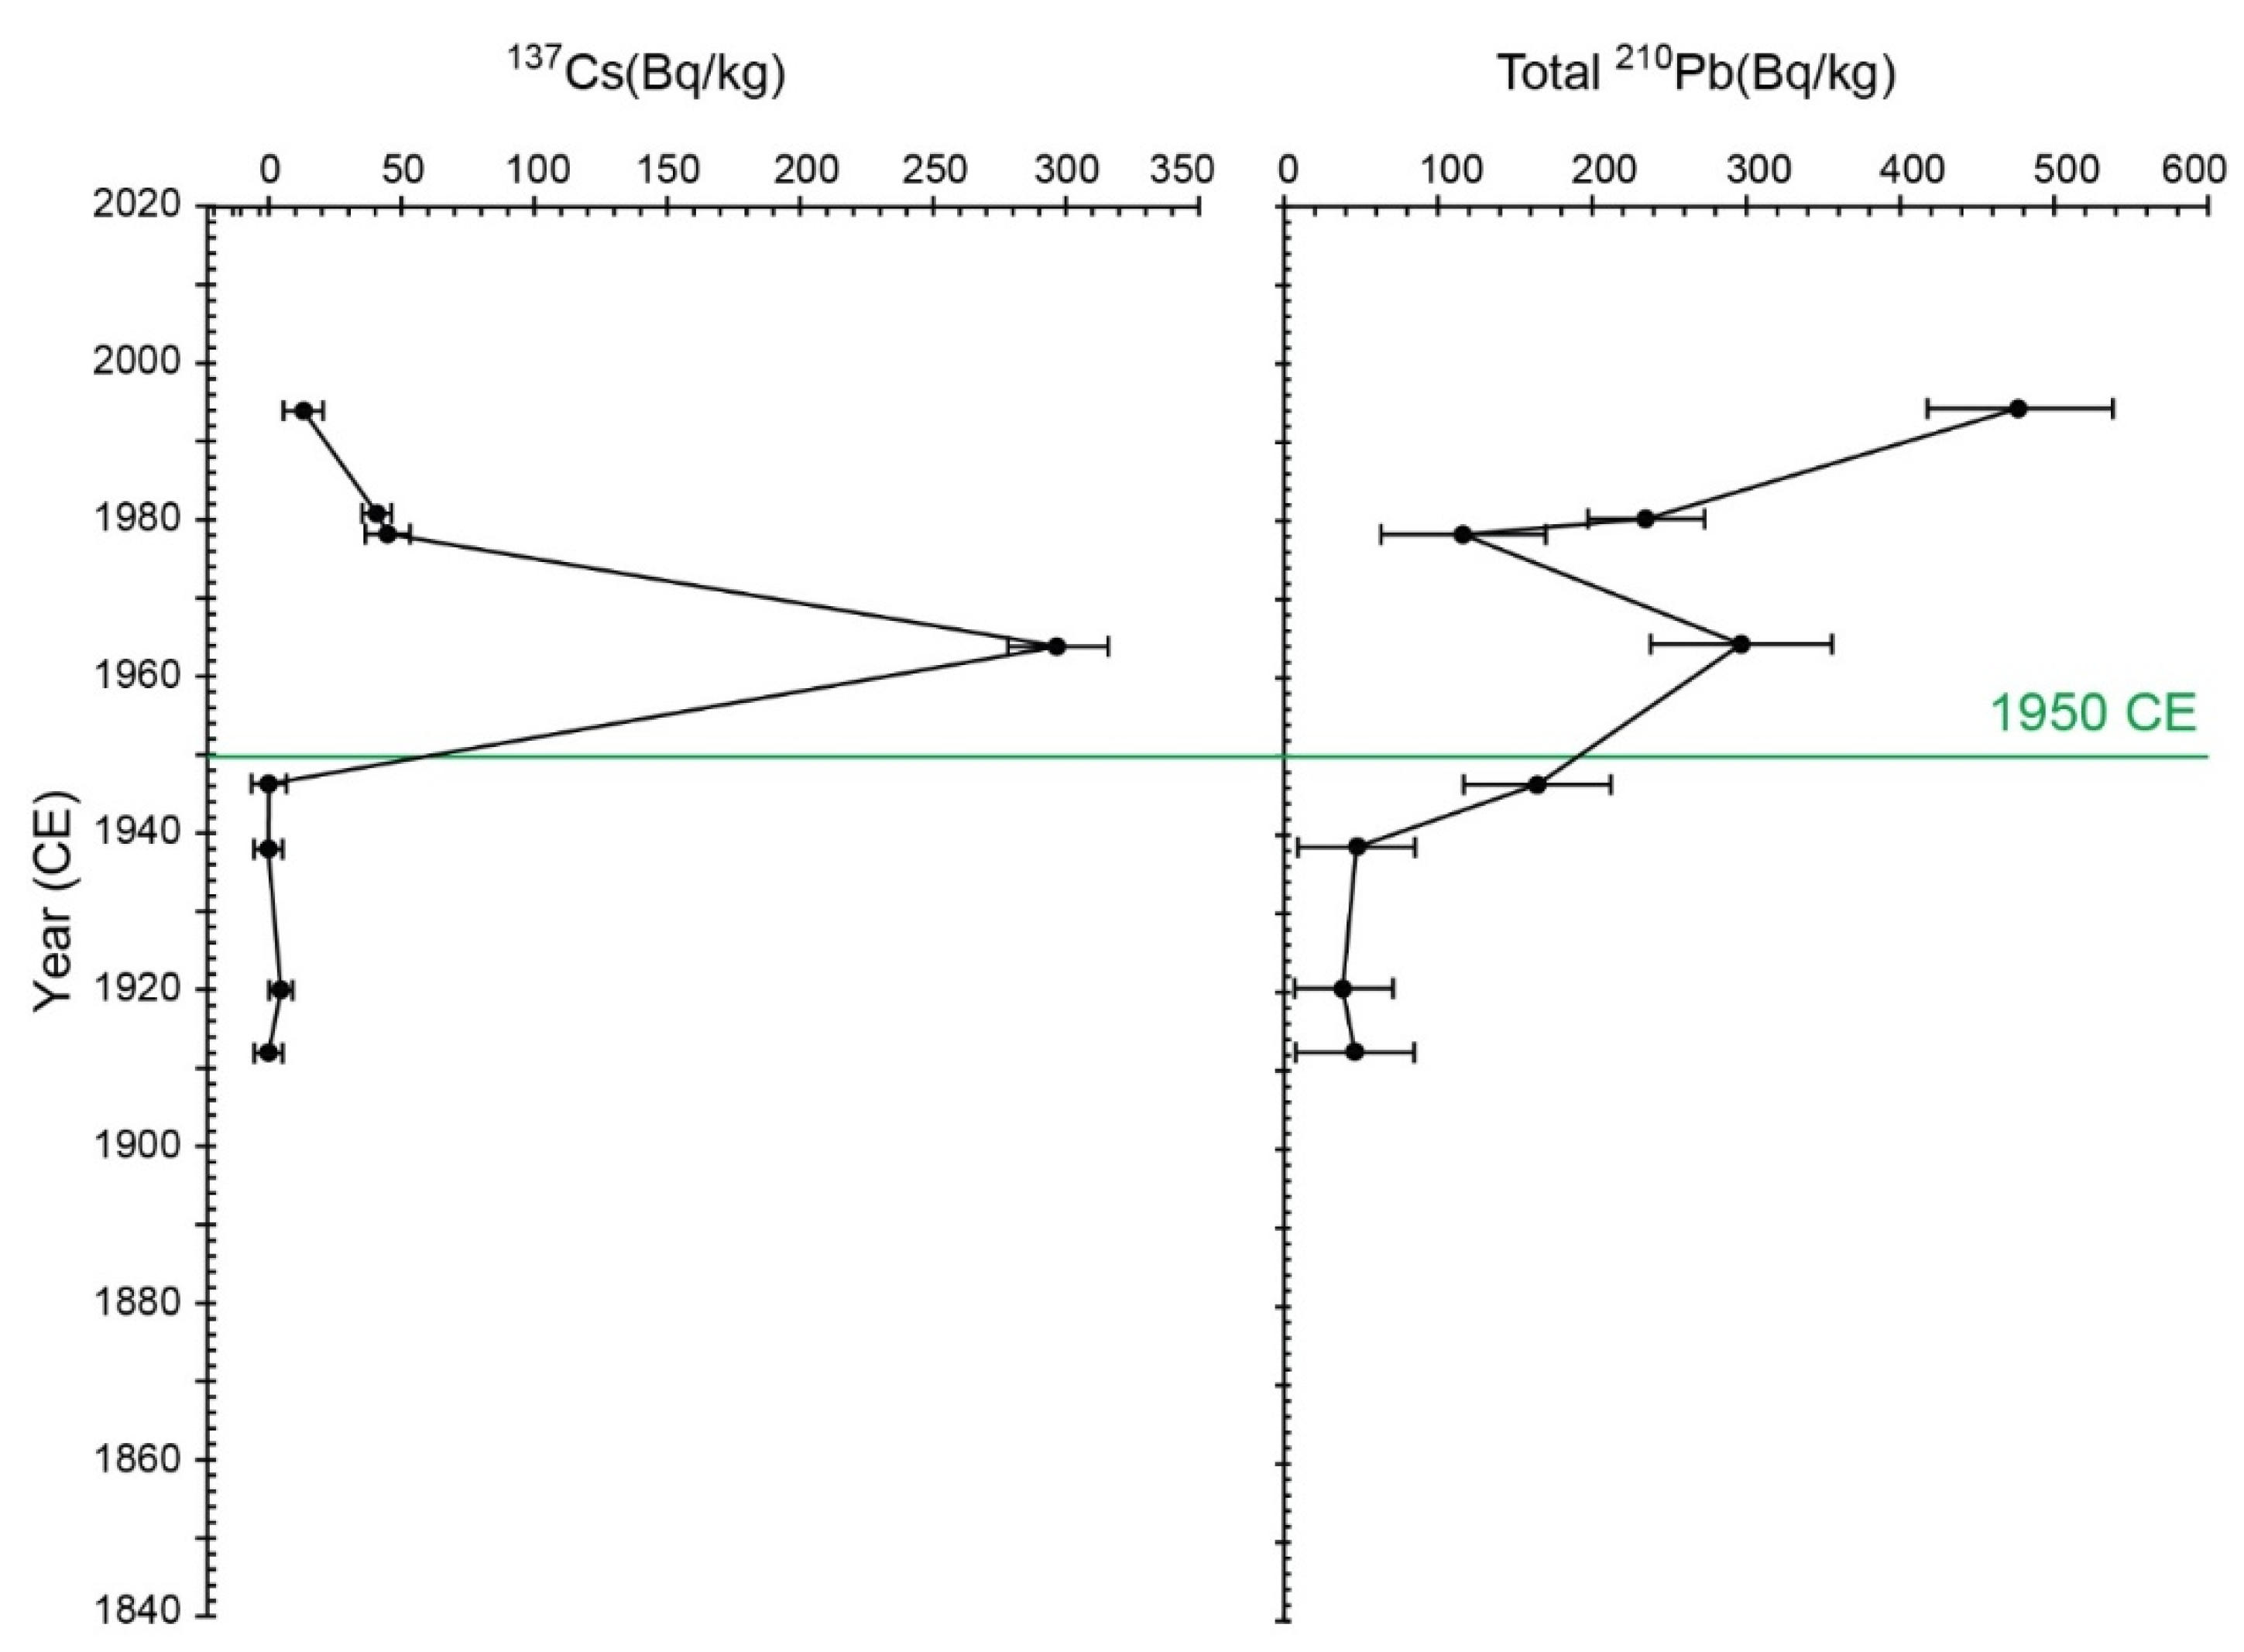
Figure 1. Location of Ontario, Canada (A), Crawford Lake, Milton location map (B) legend describes land use and vegetation. Crawford Lake coring site (C) within Crawford Lake Conservation Area, walking trail is shown with dotted line.
Geosciences 13 00087 g001
Figure 2. Range of temperature and pH measured during summer (A) and winter (B) through the water column of Crawford Lake during the 2021 hydrological year (shown on scales above images). The most rapid influx of organic matter through the epilimnion (upper trap) and to the monimolimnion (lower trap) occurred during fall turnover (B). The range of temperature and pH measured between fall and spring turnover does not satisfy the LSI requirements for precipitation of calcite anywhere in the water column. This confirms the assumption that light-colored calcite caps the organic matter during the summer (Adapted with permission from [37] Llew-Williams et al., 2023).
Geosciences 13 00087 g002
Figure 3. 2019 Coring at Crawford Lake. (A). Creating a hole in the ice for the coring device to be lowered through the water column to the lake bottom. (B). Filling freeze corer with a slurry of dry ice (solidified carbon dioxide) and ethanol. (C). Corer is lowered through the water into the sediment water interface. (D). Freeze core is pulled back up to surface. (E). The corer laid out on the ice, metal side up, which under the winter conditions permitted the sediments to continue to solidify while photos and core logging took place. (F). Core being cleaned and sectioned for transport. (G). Sectioned core segments were laid on labeled boards and wrapped before being placed in dry ice packed coolers for transport to Carleton University.
Geosciences 13 00087 g003
Figure 4. (A). Photography set up showing camera mounted on sliding rail to image a cross section of the core. (B). Ring light mounted on camera.
Geosciences 13 00087 g004
Figure 5. Log cards for core CRA19-2FT-B2 used in this study along with three others from the deep basin of Crawford Lake. Features such as the Dust Bowl, color change resulting from eutrophication associated with logging, and proposed Anthropocene GSSP, are highlighted here to show the ease of identification with basic imaging. Adapted with permission from [30] McCarthy et al., in press/2023.
Geosciences 13 00087 g005
Figure 6. Chronology of varve sequence through the Canadian Zone (1867-Present) of freeze core CRA19-2FT-B2-S1. Note the warping of the flat laminae in cross section, reflecting very slow sinking of the lead-weighted freeze corer in the soft substrate as the sediments adhere to the metal.
Geosciences 13 00087 g006
Figure 7. Core-CRA22-1FR-3. Core taken February 2022 for GSSP archive at the Museum of Nature, Ottawa, ON. The greater warping evident in the cross section reflects longer residence time of the sampler in the substrate during the 2022 expedition to recover thicker sediments to the lakebed.
Geosciences 13 00087 g007
Figure 8. Summary of key Anthropocene markers and associated ecosystem response to increased fossil fuel combustion and industrial emissions in Crawford Lake recorded by siliceous microfossils in samples from freeze cores CRA19-2FT-B2 and CRA19-2FT-D1 collected along varve boundaries using the age model described herein. The total plutonium (239+240Pu) closely mirrors the global fallout of radionuclides calculated based on the yields of individual nuclear tests (United Nations Scientific Committee on the Effects of Atomic Radiation/UNSCEAR, 2000), peaking in 1963 CE but slowing during the moratorium between November 1958 and February 1961, and the plutonium ratios are suggestive of thermonuclear weapons of the Cold War. Reprinted with permission from [30] McCarthy et al., 2023/in press.
Geosciences 13 00087 g008
Figure 9. Results of gamma analysis of samples spanning 2 varve years from core CRA22-1FRA-3, archived at the Canadian Museum of Nature with proposed Anthropocene GSSP, 1950 CE, shown as a solid horizontal line (data in Table 1). The peak activity of 137Cs is consistent with the global peak (1963-64 CE) and limited number of 210Pb points, which are developed in more detail from the 210Pb age model in another core (CL-19) from the deep basin of Crawford Lake [30]. Anomalous results obtained from the thick calcite-rich varve deposited in 1980-81 is attributed to the chemistry of the sediments.
Geosciences 13 00087 g009
Figure 10. Spectral analysis of complete varves, light and dark laminae, showing likely climate cycles that we attribute to each frequency.
Geosciences 13 00087 g010
Figure 11. Continuous wavelet transform analysis of varves, light and dark seasonal lamination. Average length of the QBO, ENSO, SSC, and PDO are overlain to demonstrate their probable forcing of the observed cycles in the varve records.
Geosciences 13 00087 g011
Figure 12. Annual wavelet transform highlighting 1976 PDO regime shift.
Geosciences 13 00087 g012
Table 1. Summary of gamma analysis of bulk sediment sampled along varve boundaries in freeze core CRA22-1FR-3. Grey shading identifies peak in 137Cs activity, consistent with global peak in 1964 CE. B, Cumming, Queen’s U., analyst, using methodology described in McCarthy et al. Adapted with permission from [30] McCarthy et al. in press/2023.
Lab ID Varve Age 137Cs
(Bq/kg)
Error 137Cs
(Bq/kg)
210Pb
(Bq/kg)
Error 210Pb
(Bq/kg)
Queens-1 1994–1995 9.02 7.44 477.21 61.99
Queens-2 1980–198141 5.92 235.19 38.32
Queens-3 1978–1979 44.16 8.24 116.53 54.25
Queens-4 1964–1965 298.04 18.9 295.71 59.2
Queens-5 1946–1947 0 6.59 165.2 48.85
Queens-6 1938–1939 0 5.26 47.7 38.23
Queens-7 1920–1921 3.13 4.61 38.97 32.3
Queens-8 1912–1913 0 5.26 46.1 39.01
Table 2. Subset of varve thickness data showing the maximum, minimum and mean varve thickness of the individual calcite, organic and combined laminae.
LaminaMin (mm)Max (mm)Average (mm)
Calcite0.03961.52950.3711
Organic0.10553.44130.8901
Total Annual 0.21103.75781.2612
Disclaimer/Publisher’s Note: The statements, opinions and data contained in all publications are solely those of the individual author(s) and contributor(s) and not of MDPI and/or the editor(s). MDPI and/or the editor(s) disclaim responsibility for any injury to people or property resulting from any ideas, methods, instructions or products referred to in the content.

