Brief Report

Visual Stratigraphy-Based Age Scale Developed for the Shallow Mount Siple Firn Core, Antarctica

by
Joseph W. Brown
1,*,
Dorothea E. Moser
2,
Daniel B. Emanuelsson
2 and
Elizabeth R. Thomas
2
1
Department of Earth Sciences, University of Cambridge, Cambridge CB2 3ET, UK
2
British Antarctic Survey, Cambridge CB2 3ET, UK
*
Author to whom correspondence should be addressed.
Geosciences 2023, 13(3), 85; https://doi.org/10.3390/geosciences13030085
Submission received: 4 February 2023 / Revised: 23 February 2023 / Accepted: 1 March 2023 / Published: 15 March 2023

Abstract

:
Here we present a case study for using visual stratigraphy to date a shallow firn core from coastal West Antarctica. The Mount Siple ice core has the potential to reconstruct climate in this data-sparse region over recent decades. Line scanned images of the 24 m firn core were used to generate a grey-scale, which displays variability consistent with annual cycles. The resulting Mount Siple age scale spans from 1998 ± 1 to 2017 CE. This study demonstrates that the seasonal changes in the grey-scale record provide an independent method of dating firn cores. However, the presence of melt layers at this site has introduced an error of ±1 year. Visual line stratigraphy has the unique advantage over traditional annual layer counting, based on chemical or isotopic species, of being non-destructive and relatively inexpensive. Visual line stratigraphy has proved to be an effective dating method for this site.

1. Introduction

A firn core sample from Mount Siple, coastal West Antarctica, was collected during the Antarctic Circumnavigation Expedition (ACE) in the austral summer of 2016/2017. During this expedition, firn and ice cores were collected from five sub-Antarctic and coastal sites including: Bouvet Island (South Atlantic), Mertz Glacier (East Antarctica), Peter 1st Island (Bellingshausen Sea), Young Island (part of the Balleny island chain, Ross sea), and Mount Siple [1]. These unique ice cores have the potential to provide vital information about the climate from the data-sparse sub-Antarctic and coastal Antarctic region, which can be used in combination with meteorological data to improve our understanding of regional climate change. This case study focusses on developing a new age-scale for the Mount Siple ice core.
Ice cores are commonly dated using annual layer counting. This involves using chemical or isotopic data that vary seasonally, either as a result of seasonal deposition (e.g., biogenic compounds) or distinct seasonal variability (e.g., temperature). Counting the peaks in chemical or isotopic species, and assigning ages to specific depths, can provide an age scale. However, annual layer counting using water isotopes and other chemical species can be challenging in ice cores subject to surface melting [2]. Melt can alter the chemistry within the ice core, as melt can mobilize ions and disrupt seasonal signals, affecting developed timescales [3]. Different chemical species can also be leached with different efficiencies by the melt. This means that seasonal variation is not always present in the soluble proxies, such as major ion concentrations or water isotopes, reducing the accuracy of dating ice cores by layer counting [4]. We hypothesize that visual stratigraphy may provide a useful additional method for dating ice cores, particularly shallow firn cores where melt layers may be present.
Visual stratigraphy is a well-established dating method that has been used to date other ice cores [5] and it has proved to be an accurate dating tool. Visual stratigraphy uses a line scanner, which constructs a 2 dimensional image of an ice core by taking pictures continuously along an illuminated core. McGwire et al. [6] compared chemical dating methods to an automated annual layer counting method using optical line scanning and found that the two dating methods agreed to within 1% of each other. Visual stratigraphy reveals cyclicity in the grey-scale of polar ice cores. Line scan images can be used to detect and highlight annual layers [7]. There are different factors that could cause the cyclicity in the grey-scale: melt layers, precipitation grain size [8] or dust content [9].
The aim of this case study is to (1) establish if visual stratigraphy is a suitable tool for dating the Mount Siple firn core, (2) improve the melt record of Thomas et al. [1] based on visual (by eye) assignment of melt layers and (3) quantify the influence of melt on a visual stratigraphy generated age scale. The Mount Siple firn core provides a valuable opportunity to explore the potential uses, and limitation, of line scanning on a melt affected firn core. To our knowledge this is the first published line scanning record focused on a shallow firn core from coastal West Antarctica and at a site that is experiencing melt.

2. Materials and Methods

2.1. Drilling, Shipping and Storage

The Mount Siple firn core site (73°43′ S, 126°66′ W) is located on the Amundsen Sea coast, West Antarctica. Mount Siple is an active shield volcano with a height of 3110 m.a.s.l. The firn core was drilled at 685 m.a.s.l [1] to a depth of 24 m using a Kovacs hand drill. The cores were cut to ~80 cm sections, wrapped in layflat tubing, and transported to the British Antarctic Survey (BAS) in a −25 °C freezer. This tubing is used to protect the cores within polystyrene boxes to prevent breakages. However, due to the fragility of firn, some of the core contains some breaks. Despite any breaks, the cores were kept secure so that they could not move out of order or disintegrate fully. The top and bottom of each core was recorded on cutting before transportation and the lengths of the cores were checked in this study to ensure that no firn was lost.

2.2. Line Scanning

The firn core has been analysed using a bespoke visual line scanner at BAS. To ensure the highest quality images, multiple scans were created to ensure the best lighting. The ice core is placed inside and illuminated from the edges with LED lights while the camera captures the images. Line scanning produces high-resolution images that can be used to obtain a grey-scale along a core and is valuable for ice core analysis [10]. The method was optimized by microtoming the sections before scanning, to ensure that surface scratches were removed.
The grey-scale reflects the light absorbance of the ice. It is a unitless value between 0 and 1 and was based on an average across the short axis of the core to avoid a bias. This short axis average greyscale value is taken continuously along the long axis of the core to produce a greyscale with depth profile. Highly reflective pixels appear as white, assigned grey-scale values close to 0. Highly absorbent pixels appear as black, with grey scale values close to 1. For the background image, in the sections where no ice is present, greyscale values are equal to 1. An example grey-scale, and how this corresponds to the background, firn and melt features is presented in Figure 1.

2.3. Error Estimate

To construct the new age scale, the grey scale was first smoothed using a 10,000 point running mean. The resulting peaks were assigned as annual markers. Some peaks were clearer than others, and there were some small peaks that could represent possible years. These were peaks that were not big enough for us to be confident that it represented a year. This was the main source of error when counting the number of years. To calculate an absolute error, we counted the number of the small peaks or large unrealistic gaps that represent possible years. We counted each of these peaks as half years and rounded the total up to the nearest year following the approach of Andersen et al. [11] where they estimate the uncertainty by counting small peaks as half years.

2.4. Identification of Melt

We manually identified melt layers by eye from the line scan images (Figure 1). To account for the non-uniformity of the melt features, we took a conservative approach, extracting several millimeters of data surrounding the melt feature. Melt layers are expected to appear as sub-horizontal, high-density, bubble-sparse bands with distinct boundaries [12,13,14], but variations in their appearance have been documented in previous studies [15]. Bubble-free melt sections appeared dark in colour (close to 1), because they are more transparent than the porous firn matrix, but there were also coarse-grained firn and melt sections with some bubbles that appeared lighter in colour on the line-scan images due to the increased diffraction of light in this medium. Therefore, it was important to look at areas where the values either abruptly increased or decreased relative to the background. These regions are indicative of a change in density and light absorption that is most likely resulting from melt or other post-depositional metamorphism of the surface snow. As these processed cannot be distinguished based on the visual imprint, we jointly classify them as melt. There are also some breaks within the cores which appear as gaps that are black in colour.

3. Results

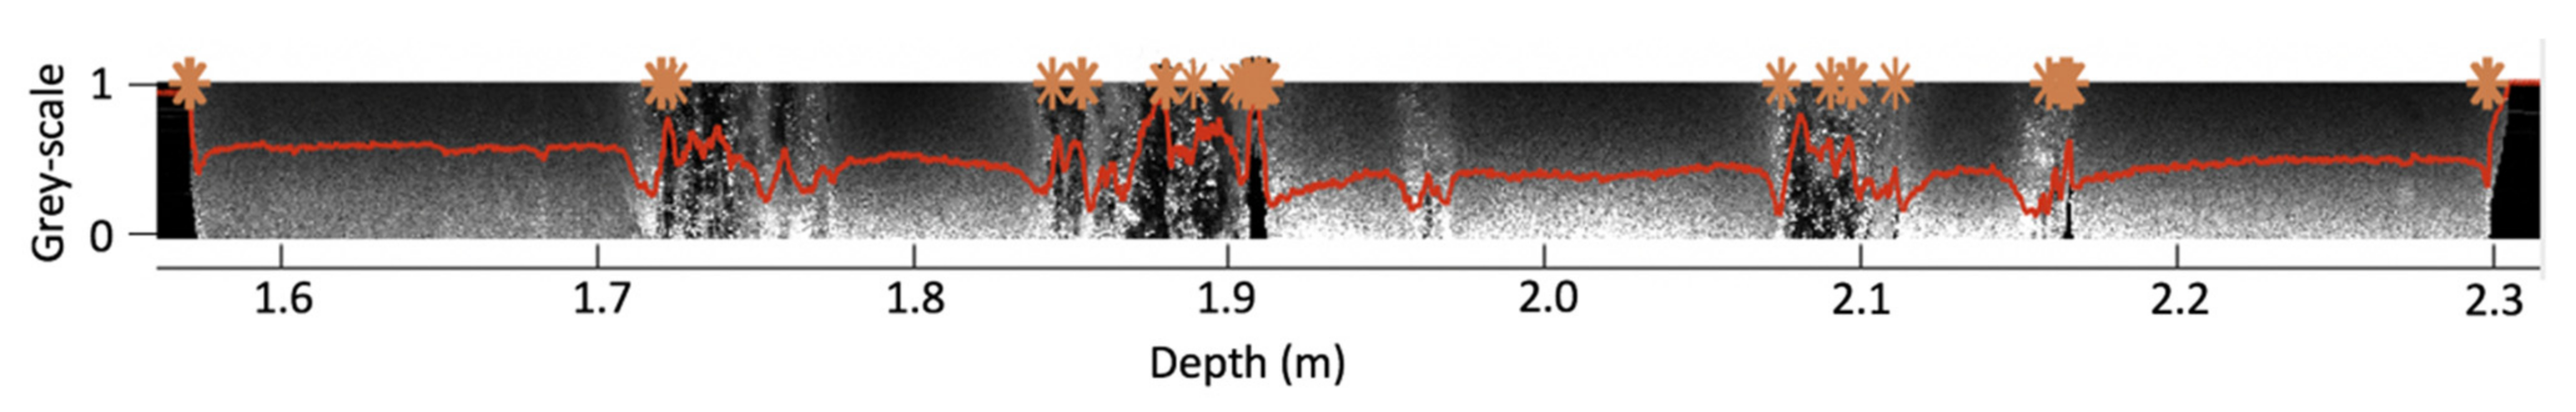
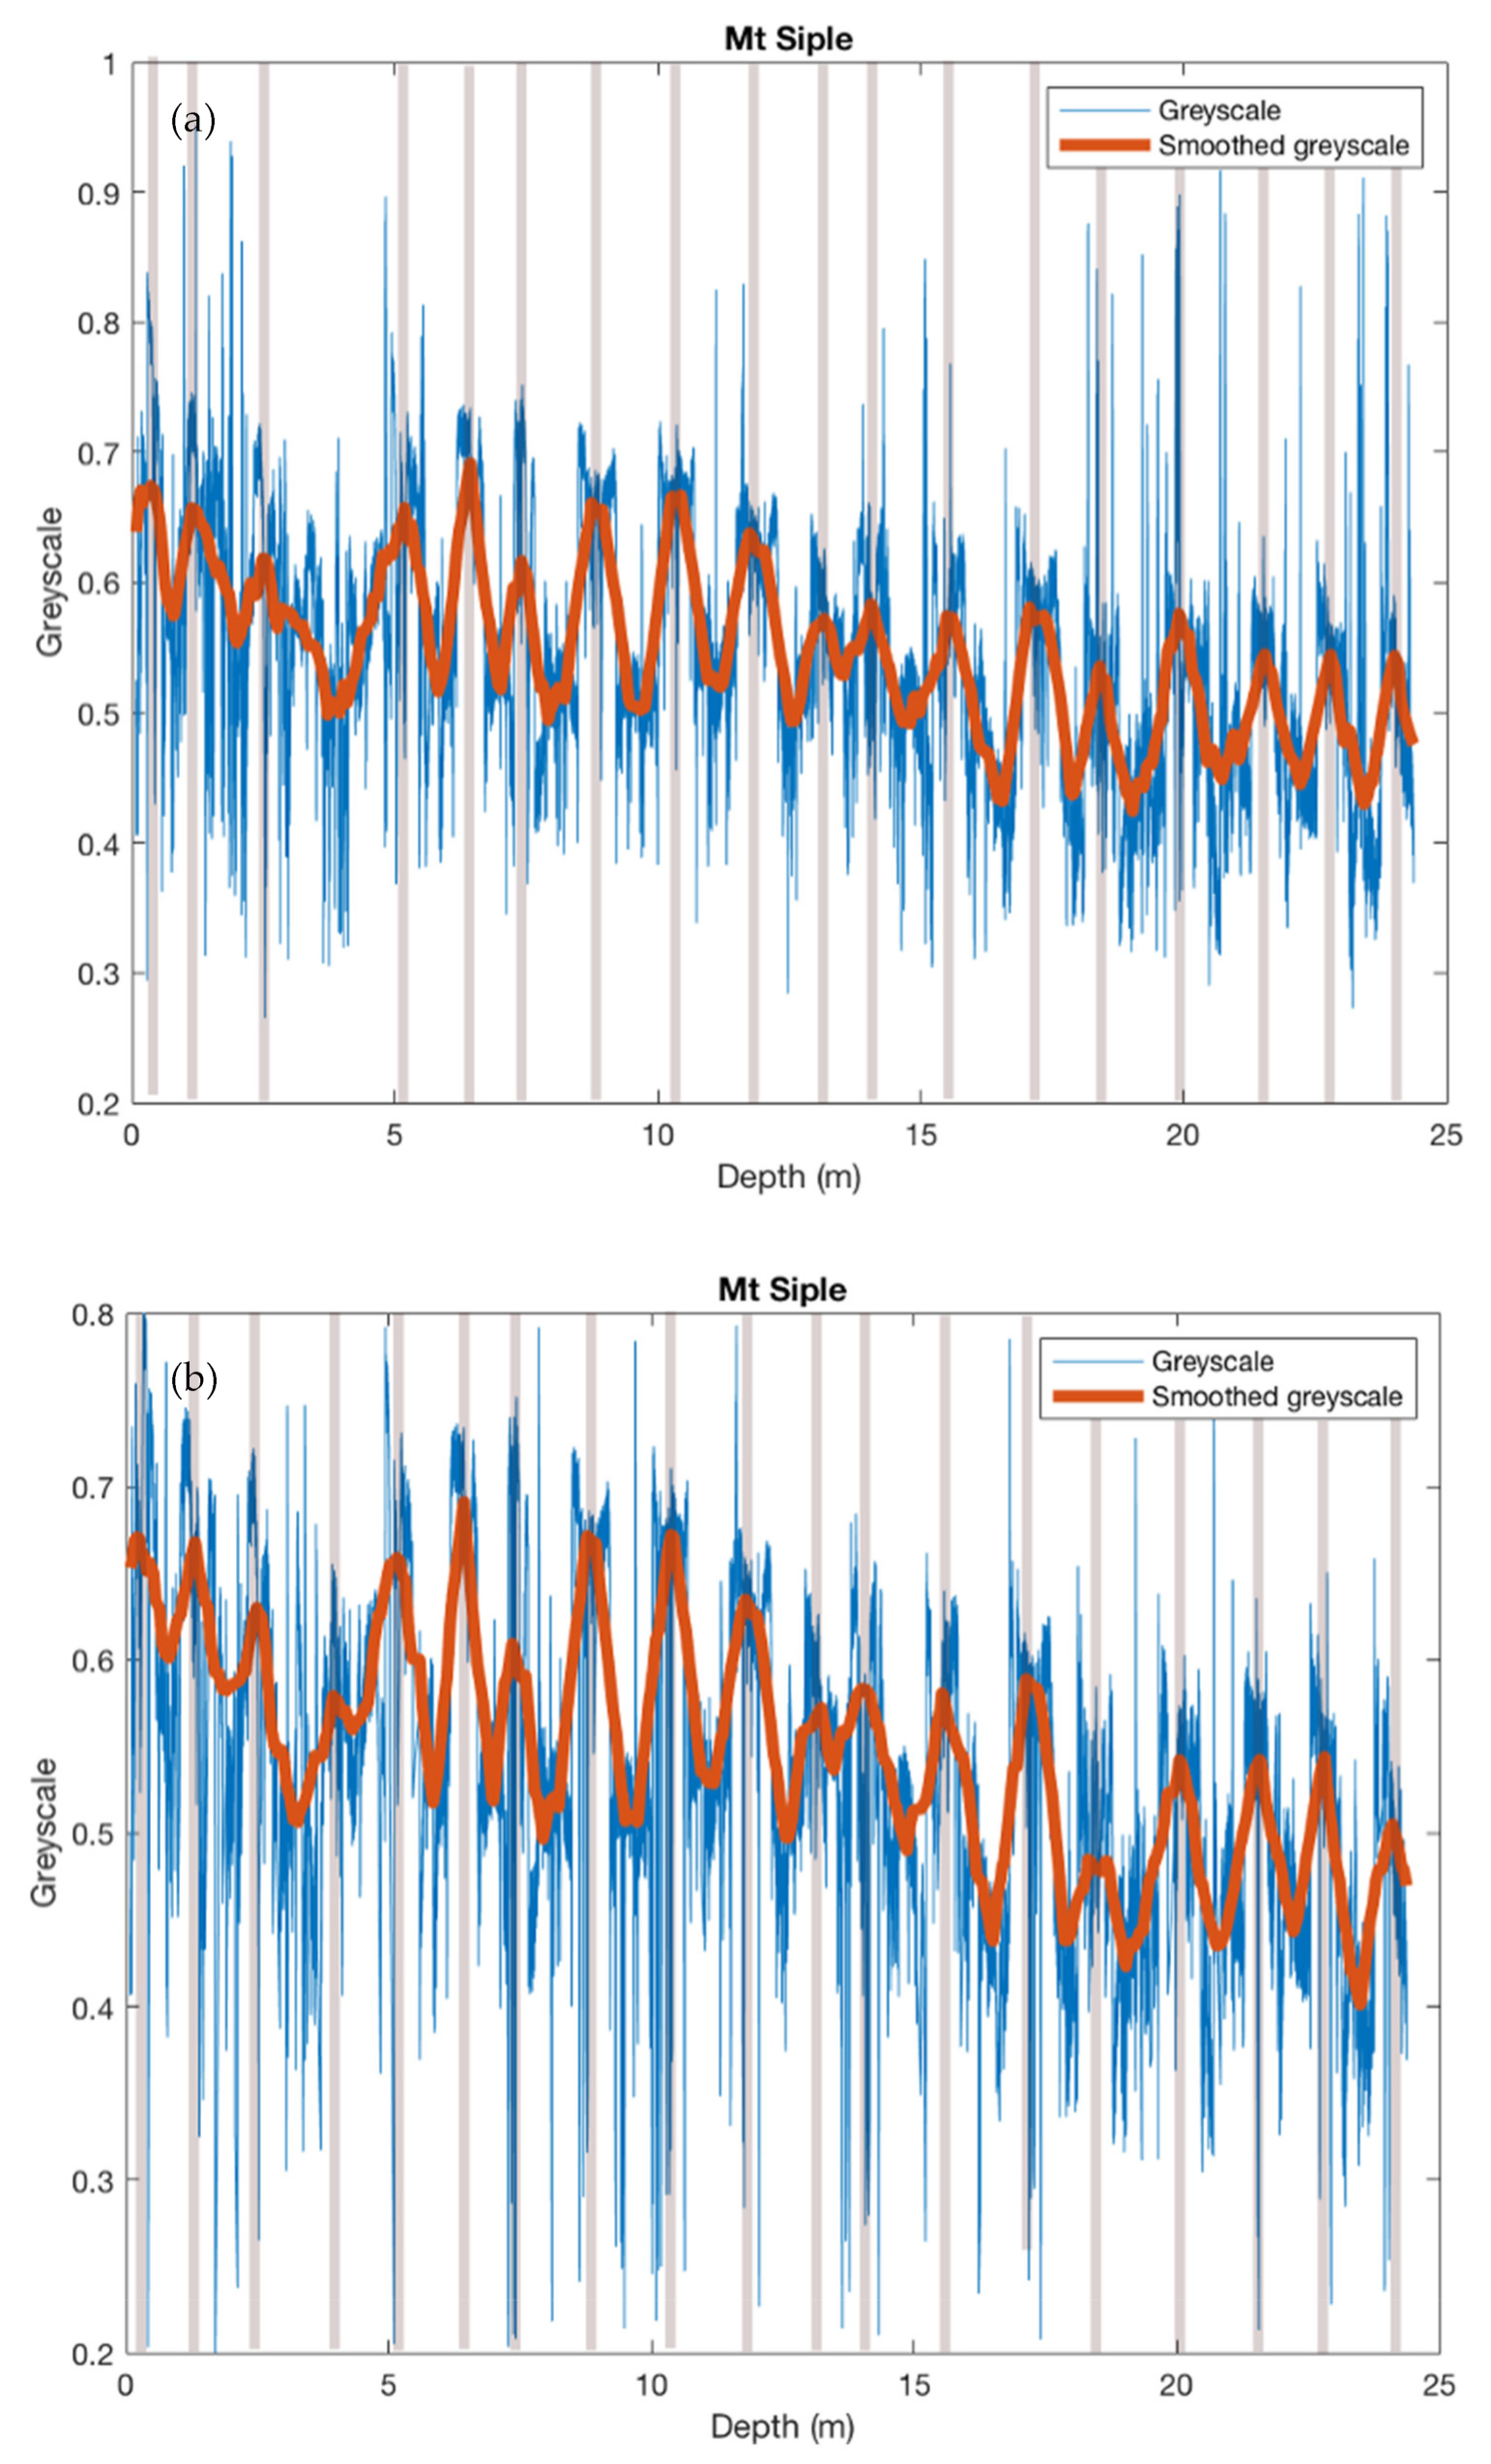
3.1. Line Scan Grey-Scale Data

We obtained a grey-scale record for the full length of the Mount Siple core (Figure 2). The data display a regular cyclicity, with cycles with a wavelength of ~1m. The amplitude of the smoothed (10,000 point moving mean) grey-scale is ~0.1 with the maximum value being ~0.7 and minimum value ~0.4.
To explore the role of melt we compare the grey-scale records both before and after the identified melt layers had been removed (Figure 2). This eliminates any potential artifact of seasonal melting on the grey-scale. The strong seasonal signal remains even after the melt has been removed from the signal. The wavelength remains ~1m and the amplitude of the smoothed grey-scale is unchanged.

3.2. Grey-Scale Annual Layer Counting/Age Scale

The grey-scale cyclicity is interpreted here as annual layers. As discussed in previous studies we hypothesize this is most likely due to changes in density, grain size or dust content [16]. The overall negative trend in the grey-scale with depth is relatedto changes in density.
The number of peaks identified in the grey-scale, and corresponding bottom ages, are shown in Table 1. When using the raw data (Figure 2a), a total of 18 peaks are identified, with a bottom age of 1999 CE ±1 year. This is within the error of the previous estimate 1998 ± 6, based on the density profile [1] However, once the melt layers were removed (Figure 2b) an additional peak was identified at around 4.5 m depth, making the bottom year 1998 CE ± 1 year (see Supplementary Materials). Thus the influence of melt has introduced an additional error at this site of ±1 year. While this is relatively small, and easy to identify, in this case study using a short firn core (24 m), this error may propagate with depth and may be affected more at very melty sites.

3.3. Melt

Using manual detection and judgement of the melt layers on the line scan images, we calculated a melt percentage of 14.8%. This corresponds to around 3.5 m of the core in total which was disregarded when looking at the grey-scale in Figure 2b. This melt percentage is an increase on the previous estimate of 10% [1], which could highlight that more detail can be seen with line scan images. One of the reasons for this increase could be because the melt layers were simplified into layers of uniform thickness at their widest part which causes a degree of overestimation [7]. There will also be a small degree of human error in determining the thicknesses of the melt layers. We also know that melt layers can sometimes not cover the full extent of the core [17], so it is possible that there are differences between the melt layers recorded depending on the surface viewed. Thomas et al., [1] recorded the melt record prior to cutting, whereas this study recorded the melt layers after cutting the core. Although this may cause a discrepancy, the use of a line scanner gains higher clarity of the melt layers so counteracts this effect. Retrospectively, this uncertainty could be tested with the same cores being line scanned before and after cutting.

4. Discussion

4.1. Visual Stratigraphy and Grey-Scale

We interpret the cyclicity of the grey-scale as annual cycles, which is the basis of the age scale development. Cyclicity is seen in multiple records of physical properties of ice cores including grain size, density and anisotropy. Cyclicity in the density has been observed in multiple ice cores in Antarctica and Greenland [18]. As these physical properties of the ice show a similar cyclicity to the grey-scale we interpret these as annual cycles. In this study, we hypothesis that the peaks correspond to the austral summer. Based on the evidence that the first peak occurs during the upper 0.5 m of the firn core.
One possible control on the grey-scale is the dust content. This is often the case for deep ice cores. Winstrup and Svensson, 2009 states that to a first order, the visual stratigraphy is a high-resolution record of the dust content in the ice, displaying annual cycles. Winstrup and Svensson, 2009 studied the NGRIP ice core in Greenland, however, the seasonality of dust deposition to Antarctica is less well defined. While some studies find an observed seasonality in dust concentrations [19,20] trajectory modeling of modern dust transport to Antarctica show limited seasonality (Neff and Bertler, 2015). The dominant source of dust and continental species to the Mt Siple site is Patagonia and New Zealand, both of which display strong transport throughout the year [21]. Thus, we suggest that seasonal dust deposition may not be a dominant control on the seasonal cycles displayed in the grey-scale at Mt Siple.
Another possible control on the grey-scale is the change in precipitation properties in summer and winter. The summer snow is often coarser than winter snow [8]. Alley et al. [5] studied the GISP2 ice core in Greenland, finding that the summer layers were characterized by coarse grained and low density depth hoar. A hoar complex forms in the summers when the sun heats the upper layer of snow, and there is rapid vapour flux upwards through the top layer of snow into the atmosphere, making this layer less dense. During the rapid vapour flux to the surface, large faceted crystals can grow in the low density layers [22]. Alley et al. [5] presents examples of the low density, coarse grained summer layers that produce brighter images than the high density, small grain size winter layers. In sub-Antarctic ice and coastal Antarctic cores, the temperatures are relatively warm, and there is frequent seasonal melting [1,2]. Therefore, the process of hoar formation should occur. Similar grain size changes could control the grey-scale variations in the Mount Siple ice core. This hypothesis matches our results in that the summer layers appear brighter, and the winter layers appear darker. This suggests that the effect of summer warming on the grain structure has a more dominating effect in this coastal Antarctic island than the dust content.

4.2. Benefits of Using Visual Stratigraphy

Our study demonstrates that annual layer counting using visual line stratigraphy can be a useful dating tool. It is especially beneficial in cases where melt layers can be removed, as disentangling the effects of melt can be difficult when using the chemistry data alone. At least in our case study, the seasonality of the grey-scale remained even after the melt layers had been removed. Thus, visual stratigraphy may provide a useful addition to traditional annual layer counting approaches at melt effect sites. This is important as continued climate change and temperature rise sets to see increased melting in West Antarctica in the future [23]. It is important to investigate the melting and links to regional climate in the regions around Mount Siple before sites melt away and ice shelves collapse [24].

5. Conclusions

We have produced a new visual line stratigraphy-based age scale for Mount Siple. We have demonstrated that visual line stratigraphy can be an effective method for shallow firn cores where some evidence of melt is present. This dating method has led to an improved error estimate of the bottom age of the Mount Siple ice core, taking into account the effect of the of melt layers at this site. Visual line stratigraphy clearly reveals 19 seasonal cycles that can be used to date the ice cores by annual layer counting. The seasonal colour changes observed in the grey-scale are not controlled by the visual effects related to the melt layers, which we have demonstrated by removing the effect of melt layers from the Mount Siple grey-scale record. For the Mount Siple firn core, we suggest that the colour change is controlled by the formation of low density, coarse grained depth hoar in the summers as well as coarser summer precipitation. Our new age scale developed for this coastal Antarctic firn core provides the opportunity to investigate the effects of regional climate change on surface melting and compare the ice core to other paleoclimate records.

Supplementary Materials

The following supporting information can be downloaded at: https://www.mdpi.com/article/10.3390/geosciences13030085/s1, Table S1: Mount Siple age scale markers. Each marker represents the winter trough (July in the Southern Hemisphere).

Author Contributions

Methodology, D.B.E.; writing—original draft, J.W.B.; writing—review & editing, D.E.M. and E.R.T. All authors have read and agreed to the published version of the manuscript.

Funding

Funding was provided to subICE by École Polytechnique Fédérale de Lausanne, the Swiss Polar Institute, and Ferring Pharmaceuticals Inc. E.R.T. received core funding from the Natural Environment Research Council to the British Antarctic Survey’s Ice Dynamics and Paleoclimate program. D.E.M. received funding from the NERC doctoral training program (grant No. NE/S007164/1). We are grateful to the drilling team Joel B. Pedro, Bradley Markle and Guisella Gacitúa for the collection of the Mount Siple firn core. The authors would like to acknowledge the coordinators and participants of the Antarctic Circumnavigation Expedition for facilitating collection of the subICE cores, especially, David Walton, Christian de Marliave, Julia Schmale, Robert Brett, Sergio Rodrigues, Francois Bernard, Roger Stilwell, and Frederick Paulsen. We would also like to thank Eric Wolff for his input and contribution to this paper.

Data Availability Statement

The line scanning images are available on request from the corresponding author.

Acknowledgments

We are grateful to the drilling team Joel B. Pedro, Bradley Markle, and Guisella Gacitúa for the collection of the Mount Siple firn core. The authors would like to acknowledge the coordinators and participants of the Antarctic Circumnavigation Expedition for facilitating collection of the subICE cores, especially David Walton, Christian de Marliave, Julia Schmale, Robert Brett, Sergio Rodrigues, Francois Bernard, Roger Stilwell, and Frederick Paulsen. We would also like to thank Eric Wolff for his input and contribution to this paper.

Conflicts of Interest

The authors declare no conflict of interest.

References

  1. Thomas, E.R.; Gacitúa, G.; Pedro, J.B.; King, A.C.F.; Markle, B.; Potocki, M.; Moser, D.E. Physical properties of shallow ice cores from Antarctic and sub-Antarctic islands. Cryosphere 2021, 15, 1173–1186. [Google Scholar] [CrossRef]
  2. Moser, D.E.; Jackson, S.; Kjær, H.A.; Markle, B.; Ngoumtsa, E.; Pedro, J.B.; Segato, D.; Spolaor, A.; Tetzner, D.; Vallelonga, P.; et al. An age scale for the first shallow (sub-)Antarctic ice core from Young Island, Northwest Ross Sea. Geosciences 2021, 11, 368. [Google Scholar] [CrossRef]
  3. Koerner, R.M. Some comments on climatic reconstructions from ice cores drilled in areas of high melt. J. Glaciol. 1997, 43, 90–97. [Google Scholar] [CrossRef] [Green Version]
  4. Moore, J.C.; Grinsted, A.; Kekonen, T.; Pohjola, V. Separation of melting and environmental signals in an ice core with seasonal melt. Geophys. Res. Lett. 2005, 32. [Google Scholar] [CrossRef] [Green Version]
  5. Alley, R.B.; Shuman, C.A.; Meese, D.A.; Gow, A.J.; Taylor, K.C.; Cuffey, K.M.; Fitzpatrick, J.J.; Grootes, P.M.; Zielinski, G.A.; Ram, M.; et al. Visual-stratigraphic dating of the GISP2 ice core: Basis, reproducibility, and application. J. Geophys. Res. Ocean. 1997, 102, 26367–26381. [Google Scholar] [CrossRef]
  6. McGWIRE, K.C.; McCONNELL, J.R.; Alley, R.B.; Banta, J.R.; Hargreaves, G.M.; Taylor, K.C. Dating annual layers of a shallow Antarctic ice core with an optical scanner. J. Glaciol. 2008, 54, 831–838. [Google Scholar] [CrossRef] [Green Version]
  7. Dey, R.; Thamban, M.; Laluraj, C.M.; Mahalinganathan, K.; Redkar, B.L.; Kumar, S.; Matsuoka, K. Application of visual stratigraphy from line-scan images to constrain chronology and melt features of a firn core from coastal Antarctica. J. Glaciol. 2022, 69, 179–190. [Google Scholar] [CrossRef]
  8. Sjögren, B.; Brandt, O.; Nuth, C.; Isaksson, E.; Pohjola, V.; Kohler, J.; Van De Wal, R.S. Determination of firn density in ice cores using image analysis. J. Glaciol. 2007, 53, 413–419. [Google Scholar] [CrossRef] [Green Version]
  9. Winstrup, M.; Svensson, A. Stratigraphical dating of ice cores using high resolution profiles. In IOP Conference Series. Earth and Environmental Science; IOP Publishing: Bristol, UK, 2009. [Google Scholar]
  10. Westhoff, J.; Sinnl, G.; Svensson, A.; Freitag, J.; Kjær, H.A.; Vallelonga, P.; Vinther, B.; Kipfstuhl, S.; Dahl-Jensen, D.; Weikusat, I. Melt in the Greenland EastGRIP ice core reveals Holocene warming events. Clim. Past Discuss. 2021, 2021, 1–36. [Google Scholar]
  11. Andersen, K.K.; Svensson, A.; Johnsen, S.J.; Rasmussen, S.O.; Bigler, M.; Röthlisberger, R.; Ruth, U.; Siggaard-Andersen, M.L.; Steffensen, J.P.; Dahl-Jensen, D.; et al. The Greenland ice core chronology 2005, 15–42 ka. Part 1: Constructing the time scale. Quat. Sci. Rev. 2006, 25, 3246–3257. [Google Scholar] [CrossRef] [Green Version]
  12. Ahn, J.; Headly, M.; Wahlen, M.; Brook, E.J.; Mayewski, P.A.; Taylor, K.C. CO2 diffusion in polar ice: Observations from naturally formed CO2 spikes in the Siple Dome (Antarctica) ice core. J. Glaciol. 2008, 54, 685–695. [Google Scholar] [CrossRef] [Green Version]
  13. Koerner, R.M. Ice core evidence for extensive melting of the Greenland ice sheet in the last interglacial. Science 1989, 244, 964–968. [Google Scholar] [CrossRef] [PubMed]
  14. Orsi, A.J.; Kawamura, K.; Fegyveresi, J.M.; Headly, M.A.; Alley, R.B.; Severinghaus, J.P. Differentiating bubble-free layers from melt layers in ice cores using noble gases. J. Glaciol. 2015, 61, 585–594. [Google Scholar] [CrossRef] [Green Version]
  15. MacDonell, S.; Fernandoy, F.; Villar, P.; Hammann, A. Stratigraphic Analysis of Firn Cores from an Antarctic Ice Shelf Firn Aquifer. Water 2021, 13, 731. [Google Scholar] [CrossRef]
  16. Wegner, A.; Fischer, H.; Delmonte, B.; Petit, J.R.; Erhardt, T.; Ruth, U.; Svensson, A.; Vinther, B.; Miller, H. The role of seasonality of mineral dust concentration and size on glacial/interglacial dust changes in the EPICA Dronning Maud Land ice core. J. Geophys. Res. Atmos. 2015, 120, 9916–9931. [Google Scholar] [CrossRef] [Green Version]
  17. Kinnard, C.; Koerner, R.M.; Zdanowicz, C.M.; Fisher, D.A.; Zheng, J.; Sharp, M.J.; Nicholson, L.; Lauriol, B. Stratigraphic analysis of an ice core from the Prince of Wales Icefield, Ellesmere Island, Arctic Canada, using digital image analysis: High-resolution density, past summer warmth reconstruction, and melt effect on ice core solid conductivity. J. Geophys. Res. Atmos. 2008, 113. [Google Scholar] [CrossRef] [Green Version]
  18. Hörhold, M.W.; Kipfstuhl, S.; Wilhelms, F.; Freitag, J.; Frenzel, A. The densification of layered polar firn. J. Geophys. Res. Earth Surf. 2011, 116, F01001. [Google Scholar] [CrossRef] [Green Version]
  19. Bory, A.; Wolff, E.; Mulvaney, R.; Jagoutz, E.; Wegner, A.; Ruth, U.; Elderfield, H. Multiple sources supply eolian mineral dust to the Atlantic sector of coastal Antarctica: Evidence from recent snow layers at the top of Berkner Island ice sheet. Earth Planet. Sci. Lett. 2010, 291, 138–148. [Google Scholar] [CrossRef]
  20. Albani, S.; Mahowald, N.M.; Delmonte, B.; Maggi, V.; Winckler, G. Comparing modeled and observed changes in mineral dust transport and deposition to Antarctica between the Last Glacial Maximum and current climates. Clim. Dyn. 2011, 38, 1731–1755. [Google Scholar] [CrossRef]
  21. Neff, P.D.; Bertler, N.A. Trajectory modeling of modern dust transport to the Southern Ocean and Antarctica. J. Geophys. Res. Atmos. 2015, 120, 9303–9322. [Google Scholar] [CrossRef] [Green Version]
  22. Colbeck, S.C. Growth of Faceted Crystals in a Snow Cover; Cold Regions Research and Engineering Lab.: Hanover, NH, USA, 1982. [Google Scholar]
  23. Joughin, I.; Alley, R.B. Stability of the West Antarctic ice sheet in a warming world. Nat. Geosci. 2011, 4, 506–513. [Google Scholar] [CrossRef]
  24. Shepherd, A.; Wingham, D.; Rignot, E. Warm ocean is eroding West Antarctic ice sheet. Geophys. Res. Lett. 2004, 31. [Google Scholar] [CrossRef] [Green Version]
Figure 1. Line scanned image from the Mount Siple firn core corresponding to depth (1.6–2.3 m), highlighting the presence of melt layers (marked by stars) overlain by a plot of the grey-scale values (red).
Geosciences 13 00085 g001
Figure 2. (a) Complete grey-scale record for the Mount Siple core (blue) and the 10,000 point moving mean of the grey-scale (red) generated from the original images. The grey bars indicate the counted peaks. (b) As in a, but the melt layers and breaks have been removed.
Geosciences 13 00085 g002
Table 1. Summary table of the core depth and bottom ages for Mount Siple.
SiteDate DrilledPeaks Bottom DepthBottom AgeBottom Age [1]
Mount Siple11/02/171824.38 ± 0.11999 ± 11998 ± 6
Mount Siple with melt removed11/02/171924.38 ± 0.11998 ± 11998 ± 6
Disclaimer/Publisher’s Note: The statements, opinions and data contained in all publications are solely those of the individual author(s) and contributor(s) and not of MDPI and/or the editor(s). MDPI and/or the editor(s) disclaim responsibility for any injury to people or property resulting from any ideas, methods, instructions or products referred to in the content.

