

Probabilistic Analyses of Root-Reinforced Slopes Using Monte Carlo Simulation

Department of Civil, Energy, Environmental and Materials Engineering, Mediterranea University of Reggio Calabria, Via Zehender (già via Graziella)—Feo di Vito, 89122 Reggio Calabria, Italy
*
Author to whom correspondence should be addressed.
Geosciences 2023, 13(3), 75; https://doi.org/10.3390/geosciences13030075
Submission received: 21 December 2022
/
Revised: 19 February 2023
/
Accepted: 6 March 2023
/
Published: 8 March 2023
Abstract
:Among measures that are used to prevent the triggering of shallow landslides and for erosion control, root reinforcement has spread out widely as its contribution to environmental sustainability is high. Although in recent years reliability-based design (RBD) has been applied increasingly to the assessment of slope stability to address the shortcomings of the deterministic approach (which does not consider geotechnical uncertainties explicitly), there is still a lack in the application of this method to root reinforcement. Plants are characterised by high inherent uncertainty, making it necessary to investigate the level of reliability of these soil-bioengineering techniques. In this context, to determine whether or not root-reinforced slopes designed according to Eurocodes (that is, by applying their statistical partial factors), and providing satisfactory factors of safety, may lead to a probability of failure that is, in contrast, unacceptable, the Authors carried out several probabilistic analyses by using Monte Carlo simulation (MCS). MCS was applied to the simplified Bishop Method modified to bear pseudo-static forces representing earthquake loading in mind. To take into account the mechanical effect provided by roots, an apparent root cohesion was added to the Mohr–Coulomb failure criterion. Results showed that not every slope configuration that satisfies the safety criterion has acceptable levels of reliability, and this evidence is caused by the high variability of the design parameters.
1. Introduction
Earthquake-induced landslides have been drawing increased attention from both the authorities and the international scientific community due to the enormous damage they have caused in terms of casualties and the cost of restoring structures and infrastructures. The geomaterials in earthquake-induced landslides are usually made of several granular particles whose movement type starts from sliding and then becomes flow-like after moving a short distance. For this reason, these phenomena do not provide any warning, are challenging to monitor, and often mobilise large volumes at high speed, exhibiting long run-out distances [1]. Therefore, there is a need and a huge push for a protection policy which adopts risk mitigation measures from natural disasters that are sustainable both on the environmental and the economic and social sides.
Among risk mitigation measures, protection works are used to reduce the potential damage due to shallow landslides. In this case, to design mitigation measures correctly, it is crucial to evaluate the impact force caused by the flow; usually, small- or full-scale flume tests are used for this purpose [2,3,4,5,6] without neglecting the similarity criteria with natural phenomena that need to be satisfied for the results to be acceptable. As a measure to prevent the triggering of shallow landslides and for erosion control, reinforcement with vegetation has spread out in the last decade [7,8,9,10,11,12] due to its remarkable contribution to environmental sustainability. At the same time, in addition to fulfilling the function of mitigation for fragile inland and mountain areas, these soil-bioengineering technologies allow the naturalisation of anthropogenic areas with a consequent reduction in terms of environmental impact (compared to more traditional engineering works).
According to recent studies, mechanical and hydrological effects developed by vegetation increase the soil shear strength of the rooted thickness [13,14,15,16,17,18,19]. Concerning the hydrological effect, vegetation regulates the infiltration of meteoric water into the ground intercepting it partly through its epigeal part that slows down the surface runoff velocity and partly by absorbing it with the roots. Moreover, vegetation influences the water transfer between soil and the atmosphere through transpiration and evaporation processes, reducing the volumetric water content and increasing soil suction, with a consequent reduction in soil permeability and an increase in the soil shear strength [15,20,21,22,23]. To understand the mechanical effect, the rooted soil is assimilated to a composite material consisting of fibres with high tensile strength (roots) embedded within a matrix provided with compressive and shear strength (soil). When the soil is subjected to a shear strain state caused by the relative sliding of the grains along a potential failure surface, the shear stresses developing in the soil matrix elongate the roots, mobilising a tensile stress state that increases the rooted-soil shear strength. Roots intersecting potential failure surfaces act like anchors in the resistant zone, developing soil–root interaction mechanisms that are widely known in the context of soil reinforcement with geosynthetics [24,25,26,27,28,29,30,31,32,33,34,35,36,37,38], such as: (i) skin friction between soil and the lateral surface of the roots, and (ii) passive resistance developing due to the root architecture (resistance mobilised in correspondence with the branched portions placed crosswise to the pullout direction). This implies that roots contribute to the shear strength increase as long as the rupture limit conditions are reached by achieving the tensile strength of the individual roots or by pulling them off the soil matrix. Pullout failure is not very common given the complex morphological configuration of the root system, as well as the modification that the soil original structure experiences due to exudates secreted by the roots.
In the first part of the paper, the Authors carried out slope stability analyses for root-reinforced slopes designed by using the deterministic approach with the statistical partial factors of the Eurocodes, to use the results as a benchmark to be compared to the subsequent probabilistic analyses.
The deterministic approach has been widely used in geotechnical design [39,40,41,42,43,44,45,46], although it has a limitation in not considering geotechnical uncertainties explicitly. At present, however, most of the design recommendations or regulations in force are based on the semi-probabilistic concept that uses partial factors on actions, as well as geotechnical parameters and resistances (known as “Load and Resistance Factor Design” in the US, and “Limit State Design” in Europe). The principle underlying this approach is to treat uncertainties directly at the source by introducing the characteristic and design values, which are provided with statistical tools. Failure probability relates to the overlap of load and resistance uncertainty distributions [47]. Therefore, partial factors make it possible to quantify how much each parameter contributes to ensure that the probability of failure does not exceed the established design value. For instance, according to Eurocode EC7 [48], the current partial factors for geotechnical design generally correspond to a probability of failure of 10−3 for earth works and retaining structures and 10−4 for foundations.
In recent years, reliability-based design (RBD) has begun to be increasingly applied to the assessment of slope stability to address the shortcomings of the deterministic approach. Specifically, reliability-based design is a tool that allows the designer to calculate the skill of a structure to fulfil those conditions for which it has been designed [49].
In a rooted soil, the factors contributing to the reinforcement are the tensile resistance of the roots and their spatial distribution within the soil; influence of these factors depends on various aspects ranging from the geometric, biochemical, mechanical, and morphological characteristics of the root system [50,51] to the geotechnical and biochemical characteristics of the soil in contact, to the use of the soil and other environmental peculiarities (climatic characteristics, nutrients, plant age and health, growing location, etc.). All of this involves a high variability in the spatial distribution of the roots and their tensile strength so that the identification of the characteristic parameters to be used together with the partial factors to derive the design parameters is conditioned by uncertainties that cannot be fully taken into account. This entails that, at present, the design of risk mitigation measures by using vegetation may not satisfy the reliability criterion required by the Eurocodes (i.e., a factor of safety FS = 1 may not necessarily imply that the probability of failure does not exceed the established design value). Therefore, it is pretty necessary to use reliability-based design for vegetation-reinforced slopes to investigate whether or not the combination of the uncertainties related to the variability of soil with the even greater uncertainties related to vegetation ensures that this bio-engineering solution remains efficient in the context of reliability. For this purpose, a probabilistic slope stability analysis was performed to assess how variability affects the input design parameters by using Monte Carlo simulation, which treats deterministic mathematical situations through random sampling procedures. This method generates random variables according to their selected probability distributions and uses them as parameters on the chosen deterministic model to determine the probability distribution of the performance function [52,53,54]. Specifically, the research aims to determine whether or not root-reinforced slopes designed according to Eurocodes, and providing satisfactory factors of safety, may lead to a probability of failure that is, in contrast, unacceptable, as the partial factors listed in the Eurocodes, not being calibrated on root parameters, may not capture their high variability.
2. Materials and Methods
2.1. Root Reinforcement
Soil shear strength is usually higher when natural slopes are reinforced with vegetation (i.e., grasses, shrubs, and trees) due to the contribution of both the distribution and density of roots inside the soil and the tensile strength of the single root [55,56]. In order to evaluate the root contribution to the soil reinforcement, laboratory and in situ tests [57,58,59,60,61,62,63,64] or modelling methods [55,56,65,66,67,68,69,70,71,72] can be used.
To express the contribution of roots to the soil shear strength, an additional parameter, , can be added to the Mohr–Coulomb failure criterion as follows:
Therefore, according to this expression, the shear strength increases with increasing cohesion of the rooted soil (it should be noted that the soil shear strength angle ϕ′ stays unchanged).
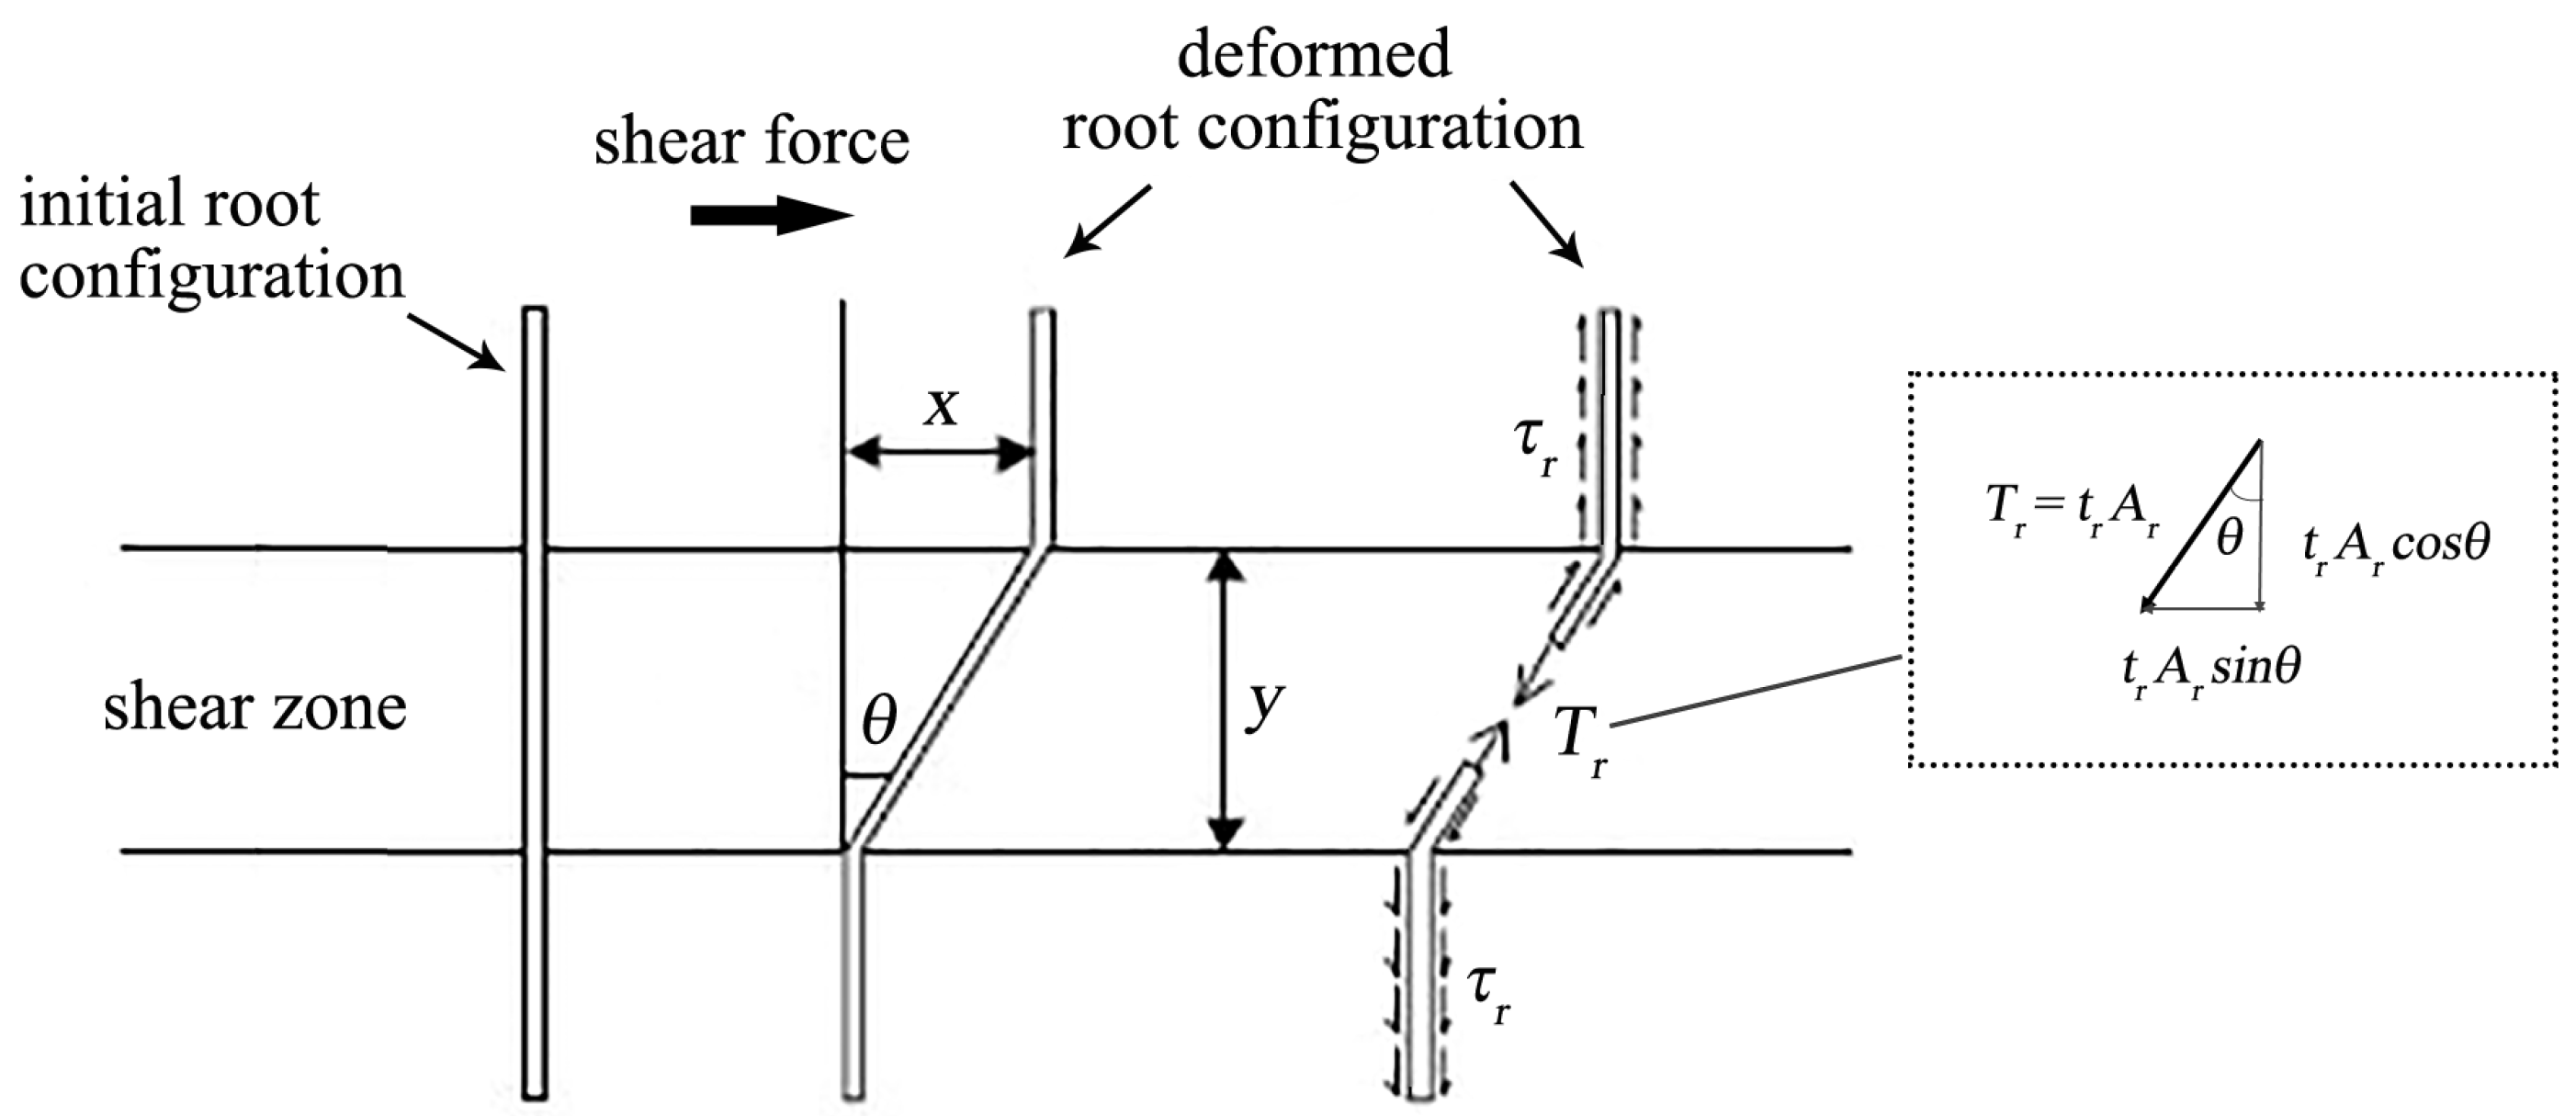
Among the root “breakage” models that allow quantifying this apparent root cohesion , the pioneering and so-called Wu and Waldron’s model was proposed by the two Authors Wu [56] and Waldron [55] independently of each other. At the foundation of Wu and Waldron’s model is the assumption that when a shear force is applied to the soil, the roots—assumed as rigid bars positioned orthogonally to the shear plane—deform in the shear zone (y) rotating rigidly with respect to the initial vertical configuration (θ) due to frictional forces developing at the root–soil interface (Figure 1). Root rotation mobilises the root tensile force, , entirely. By considering θ, two components of the root tensile force can be obtained:
where represents the root tensile force along the vertical direction; and
where is the component acting on the horizontal.
The additional parameter representative of the root strength contribution can be formulated accordingly:
with mobilised root tensile stress, and Ar/A root area ratio (RAR), that is, the ratio of the root cross-sectional area (Ar) to the rooted soil cross-section (A), representative of the spatial distribution of the roots.
By rewriting Equation (4) accordingly and considering the sum of the tensile stress for each single root i, the following expression can be obtained for the root bundle of N roots:
k′ ranges from 0.6 to 1.3 for soils with shear strength angles varying from 20° to 40° [74].
The biggest drawback of Wu and Waldron’s model is assuming that the breaking occurs simultaneously for all the roots which mobilise their full tensile strength, overestimating apparent root cohesion.
In 2005, Pollen and Simon [65] overcame this limitation by formulating a stress-controlled model (RipRoot model) belonging to the fiber bundle models (FBM), which considers a progressive failure of roots starting from the weakest, and redistributes the load to the remaining intact roots crossing the shear surface. The process of loading ends when all roots are broken, the soil–root matrix is no longer able to withstand the driving force, or the root bundle fully supports it.
However, root elastic deformation is not taken into account in the fiber bundle model, unlike the strain-controlled model (root bundle model, RBM) of Schwarz et al. [70], in which equal increments of displacement are imposed on all N roots forming a bundle. The given strain mobilises a resisting tensile force that is calculated by summing the stresses in all roots. Both the FBM and the RBM provide the maximum tensile force that a root bundle can withstand; specifically, the first model calculates the maximum tensile force based on the nominal applied force, while the RBM allows for determining the maximum tensile force as a function of the applied displacement. This maximum tensile force can then be used to obtain the apparent root cohesion by dividing it by the area of the failure surface.
The tensile strength of the single roots can be obtained by carrying out laboratory tests. Tensile tests for roots are performed on specimens previously conditioned at 65% relative humidity and 20 °C temperature, using an apparatus consisting of (i) a device to grip the root; (ii) an actuator to set the desired loading/displacement rate; (iii) a load cell to measure the tensile strength, and (iv) an electrical or optical device to monitor the change in the gauge length (initial distance between two reference points located on the specimen), respectively. The test procedures adopted in various research studies are generally similar; however, they differ substantially in how the specimen is clamped to the clamping system. Tests are carried out at a constant rate of displacement, generally ranging from 2 to 20 mm/min, and they can be considered valid if the rupture occurs near the centre of the specimen. Roots are picked up on-site using excavation methods carried out manually or with pressurised water jets to allow the soil to be removed progressively around the plant without damaging the roots. Giadrossich et al. [59] wrote a complete review on this topic, recommending some laboratory and in situ test procedures.
Results of tensile tests carried out on roots from different species allow expressing the root tensile stress tr as an exponential function [75,76]:
where is the mean diameter of the tested root species and and are empirical parameters depending on species [13]. According to Vergani et al. [77] though, it is more reliable to consider the relationship between tensile force and root diameter since, by using stress, the uncertainty involved in the determination of diameters tends to be necessarily amplified; in addition, the exact point of rupture (and the associated diameter) cannot be known before a test, but the root diameter at the end of a test is reduced because of the strain.
In addition to being affected by the test rate and the modality of clamping the roots, the obtained results depend, among other things, on species and root diameter, root state of conservation (live root or microbial degraded root), plant age and health, seasonal period and environmental conditions. Specimen length is also significant when calculating tensile strength, as long specimens are more likely to have weak spots caused by fibre discontinuities. Results obtained from tensile tests carried out on the same species showed significant variability, with standard deviations up to twice the average value [78,79,80,81,82]; the effect that this high variability has on the calculation of the stability of rooted slopes will be shown in the following paragraphs.
2.2. Input Parameters Variability
Geotechnical variability is a complex attribute resulting from many disparate sources of uncertainties [83]. The three primary sources of geotechnical uncertainties are inherent variability (due to natural geological processes continually modifying the soil on-site), measurement error (that can occur during geotechnical tests), and transformation uncertainty (in situ measurements and laboratory test results allow obtaining design parameters through correlation models). As a result, the proper stability analysis of a natural slope can be undermined by the lack of studies of what should be the correct stratigraphy to consider, the soil design parameters that are difficult to determine correctly [84], and other important factors.
When analysing the stability of a rooted slope, it is also necessary to consider the uncertainties of the root parameters that contribute to the increase in the soil shear strength, which exhibit high variability [78,85]. Very few studies have focused on this topic [74,86,87,88].
The partial factors used in the Load and Resistance Factor Design (LRFD) and Limit State Design (LSD) approaches reflect the level of uncertainty and the importance of a given parameter. In case the design aims to determine the probability of failure, reliability-based design (RBD) can be a useful tool that uses a target reliability index to verify the margin of safety [89]. RBD can also overcome some limitations in the LSD approach, such as the fact that the partial factors listed in the Eurocodes may not be calibrated on certain parameters which instead must necessarily be used in the design (for instance, in the case of parameters to be considered in designing slopes reinforced with vegetation).
Reliability concepts applied to slope stability analyses have spread widely over the past few decades [90,91,92,93,94,95]. Within a probabilistic framework, the design parameters are assumed as random variables to which a statistical distribution must be assigned to describe the range of possible values and their probability of occurrence. Since the factor of safety (FS), which is the output parameter in a slope stability analysis, is also considered a random variable with a probability distribution, the instability of the slope can be obtained, i.e., the percent probability that the analysed slope is unstable. This probability of failure can be used as an indicator of work performance.
One of the quantities generally used to compute the variability of the design parameters is the coefficient of variation, COV:
where and are the standard deviation and the mean value of the variable, respectively.
The slope probability of failure, Pf, can be expressed as:
linking it to the reliability index introduced by Eurocode EC0 [49] as a measure of reliability; represents the cumulative distribution function of the standardised normal distribution.
By defining a performance function g such that a structure is preserved when g > 0 [49], the probability of failure becomes equal to:
In the case of slope stability analyses, the performance function is the factor of safety (FS). When the factor of safety is found to be normally distributed, the reliability index can be calculated as follows:
where and are the mean value and standard deviation of FS, respectively.
The reliability index indicates how many standard deviations separate the mean factor of safety from the critical value (FS = 1).
Different levels of reliability may be adopted, depending on the consequences that may arise from a hypothetic failure scenario. According to EC0 [49], the consequences of failure considered in terms of loss of human life and economic, social, or environmental repercussions allow establishing three different consequences classes, CC (Table 1), which are associated with three reliability classes. For each of them, EC0 recommends minimum values of to be reached to satisfy the ultimate limit state (ULS) criterion, depending on the reference period (Table 2). The probabilistic approach is now widely used in slope stability analyses but its application to root-reinforced slopes has not yet become established in design practice, so it is necessary to increase research studies on this topic. To verify whether or not the partial factors listed in the Eurocodes are fit for this bio-engineering technology, this research investigated how the variability of soil and roots parameters used as input in the stability analyses, as well as the stochastic nature of earthquakes, affect the slope performance. The results were analysed in terms of the reliability index.
2.3. Analysis Methodology
By using EC7 [48] partial factors, various deterministic stability analyses (225 in total) were carried out on slopes with assigned mechanical and geometric characteristics to verify whether or not the beneficial contribution provided to the soil shear strength by root reinforcement allows the designer to satisfy the EC7 safety criterion (FS = 1). Concerning the roots, hr and Δτ were assigned as geometric and mechanical parameters, respectively. hr represents the average value of the root depth (i.e., slope shallow layer on which root reinforcement has an effect), and Δτ is the apparent root cohesion introduced in Equation (1). Subsequently, to verify if the reliability obtained by applying EC7 partial factors in the deterministic analyses that met the safety criterion satisfies what is required by EC0 [49], several probabilistic stability analyses (657 in total) were performed.
For homogeneous slopes with fixed slope height, soil effective cohesion, and soil unit weight values (H, c′, γ), several configurations were analysed by varying the following mechanical and geometric parameters:
- α, inclination angle of the slope to the horizontal;
- ϕ′, effective soil shear strength angle;
- hr, average root depth;
- Δτ, root contribution to the shear strength.
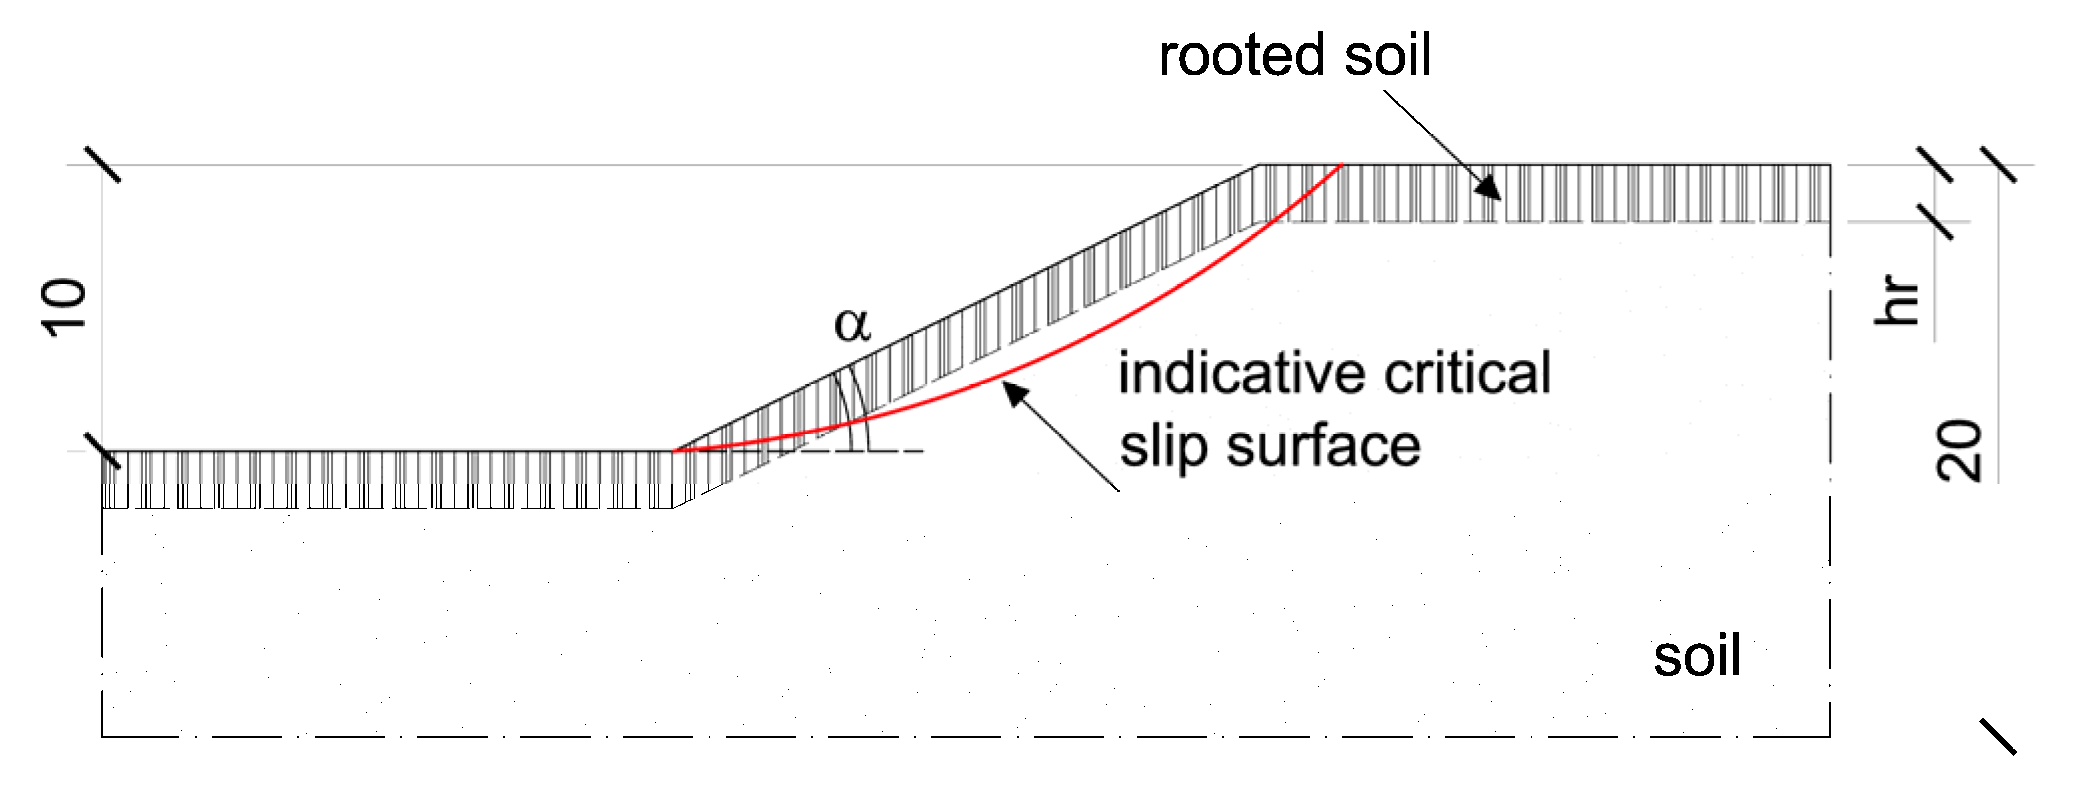
The study domain (Figure 2) was considered to be 20 m high for all the slope geometries analysed; regarding the hydraulic condition, a water table (hydrostatic pressure condition) was positioned so that it did not influence the slope analysis.
The investigated slopes were chosen so that the initial stability condition (represented by the stability index with design value of the effective soil shear strength angle) is equal and corresponds to slopes without vegetation that are in limit equilibrium conditions (). Once additional loads (i.e., in this case, statically applied inertial forces modelling seismic loadings) act on the slope, collapse occurs: the addition of vegetation should help in reaching a new safety condition. The first step was defining the design values for actions and resistances so that these quantities were equal. Afterwards, the characteristic values were back-calculated from them by using partial factors of the Eurocode 7 (specifically, those from the combination 2 of the design approach 1—ref. [48]). Table 3 lists the values used in the parametric analyses.
To select the proper Δτ values to be used in the parametric analyses, it was taken into account that the contribution to the soil shear resistance provided by the roots is difficult to quantify as it depends on different factors, such as the type of plant, its age, the conditions of the site where it grows, and the position where the shear band develops. For this purpose, a wide Δτ range (between 5 and 40 kPa) was analysed [96]. The depth at which plant roots can grow has important implications for vegetated-slope stability analyses. Canadell et al. [97], on the basis of 290 observations in several terrestrial biomes, showed that the maximum rooting depth varies from about 2–3 m (boreal forest, cropland, temperate grassland, deciduous forest, etc.) to about 10–15 m (desert, tropical grassland/savanna). By analysing these data for functional groups, Canadell et al. [97] also showed that the maximum rooting depth was about 7.0 m for trees, 5.1 m for shrubs, and 2.6 m for herbaceous plants. Laboratory tests on grasses also showed how they can grow a root network up to 2 m in depth [98]. Therefore, considering terrestrial biomes where vegetated-slope stability analysis has high practical relevance, the Authors chose to analyse average root depth values ranging from 0.5 to 2 m in the present study. Moreover, it is important to highlight that for some plant species, it is valid to assume that the contribution of roots is significant throughout the slope depth where they are embedded [99,100].
The slope stability analyses were carried out under seismic conditions by using the pseudo-static approach applied to the simplified Bishop Method [101], probably the most popular limit equilibrium method adopted for slope stability analysis. The pseudo-static approach considers the inertial effects of an earthquake by using pseudo-static forces that are proportional to the slope weight through two seismic coefficients (kh and kv) representing the horizontal and vertical components of the seismic acceleration. Even though the vertical component is commonly neglected when slope stability analyses are carried out, and its effect was found to be negligible on the change of the factor of safety when a pseudo-static approach is used [102], the Authors considered it in the context of stochastic analysis. In particular, two different seismic scenarios (Case B and Case C) were analysed with the vertical seismic load acting in the downward direction and compared to the static scenario (Case A).
The first step of the followed procedure consisted of defining the slope geometry and setting the external boundaries; subsequently, a grid of centres was originated and, for each centre, several slip surfaces were analysed. Among the slip surfaces with minimum radius, those that cut the slope for depths of less than 0.5 m were excluded. Finally, the critical slip surface corresponding to the minimum factor of safety (FS) was searched. The factor of safety was calculated according to the following equation:
where r is the radius of the circular slip surface considered; d is the vertical distance between the centre of the circle and the centre of gravity of the i-th slice; W, b, α, ϕ′ and c* are the weight, width, angle of inclination, effective soil shear strength angle and effective cohesion of i-th slice, respectively. It should be noted that c* represents the effective cohesion of the soil–root system (c′ + Δτ) whenever the slip surface crosses the root-reinforced slope zone.
The use of partial factors given in EC7 [48] for slope stability analyses generally leads to a reliability index value greater than 3.8 for a reference period of 50 years, according to EC0 [49]. A total of 50 years can be considered approximately the average value of the design working life for soil bio-engineering works, since it ranges from 10 years to 100 years, according to the time required by vegetation to reach almost the full reinforcing potential [103].
Afterwards, probabilistic analyses were carried out to study the reliability of this design practice, i.e., to make sure that the reliability obtained by applying EC7 partial factors in the deterministic analyses that met the safety criterion was at least equal to = 3.8 (reliability criterion), regardless of how large the variability of the root data was. In this context, the mean values of the design parameters were determined, assigning a statistical distribution to them (mean and standard deviation values were considered spatially constant throughout the slope). Specifically, a normal distribution function was considered for ϕ′ and γ, with coefficients of variation (COV) taken from the literature [84,104,105,106,107] considering the average values of the listed ranges. Δτ was considered as a log-normally distributed random variable, and three different scenarios of COV were chosen to study how the reliability of this design practice can be affected by the wide uncertainty of the data around the mean value characterising Δτ. Values for statistics used in the research are summarised in Table 4.
Concerning the cross-correlation between the strength parameters, which considers the fact that soil characteristics tend to be correlated to one another in a given location, a negative correlation between c* and ϕ′ was chosen (ρ = −0.5) according to some literature findings [90,108,109,110]. In particular, Wolff [109] reported this negative value from laboratory measurements on soils with c′ and ϕ′ similar to those investigated by the Authors. In this research, c* is given entirely by the strength contribution provided by the roots, the soil being cohesionless. To assume a negative correlation means that the root contribution to the shear strength increases with decreasing soil shear strength angle, i.e., the roots are provided with a greater resistance (with equal tr, which depends on plant type and genetics, the root spatial distribution is greater) in soils with lower shear strength angles. This assumption is valid since, from a purely botanical point of view, soils with smaller shear strength angles are characterised by a greater percentage of organic matter that stimulates the production of more ramets (as well as biomass), which in turn will also lead to a greater soil RAR [111,112,113].
The stochastic nature of earthquakes was also considered by using a lognormal distribution for both the horizontal and vertical seismic coefficients with a correlation coefficient of 0.5 [114]. Table 5 shows the statistics used for the seismic input.
The probabilistic approach used in this study is the Monte Carlo simulation (MCS), which was applied to Equation (11) to determine the probability distribution for the output of the analysis (i.e., factor of safety). Monte Carlo simulation was performed considering a high number of samples (n = 1,000,000) in total for each analysis (for which the critical slip surface was searched n times) to ensure the convergence of the trials. This means that 1,000,000 random samples of the uncertain variables (i.e., γ, ϕ′ and Δτ, kh and kv) were generated by using their assigned probability distributions and statistics. Equation (11) was then used to calculate n FS values for each set of the n random samples combined with the other fixed parameters (i.e., H, α and hr), for n critical slip surfaces. Finally, the probability of failure was calculated as follows:
3. Results
3.1. Deterministic Benchmark
Initially, deterministic stability analyses were carried out, according to Design Approach 1, Combination 2 of EC7, on slopes with the characteristics shown in Table 3 to quantify the beneficial contribution provided by the roots to the soil shear strength, and consequently to the slope stabilisation.
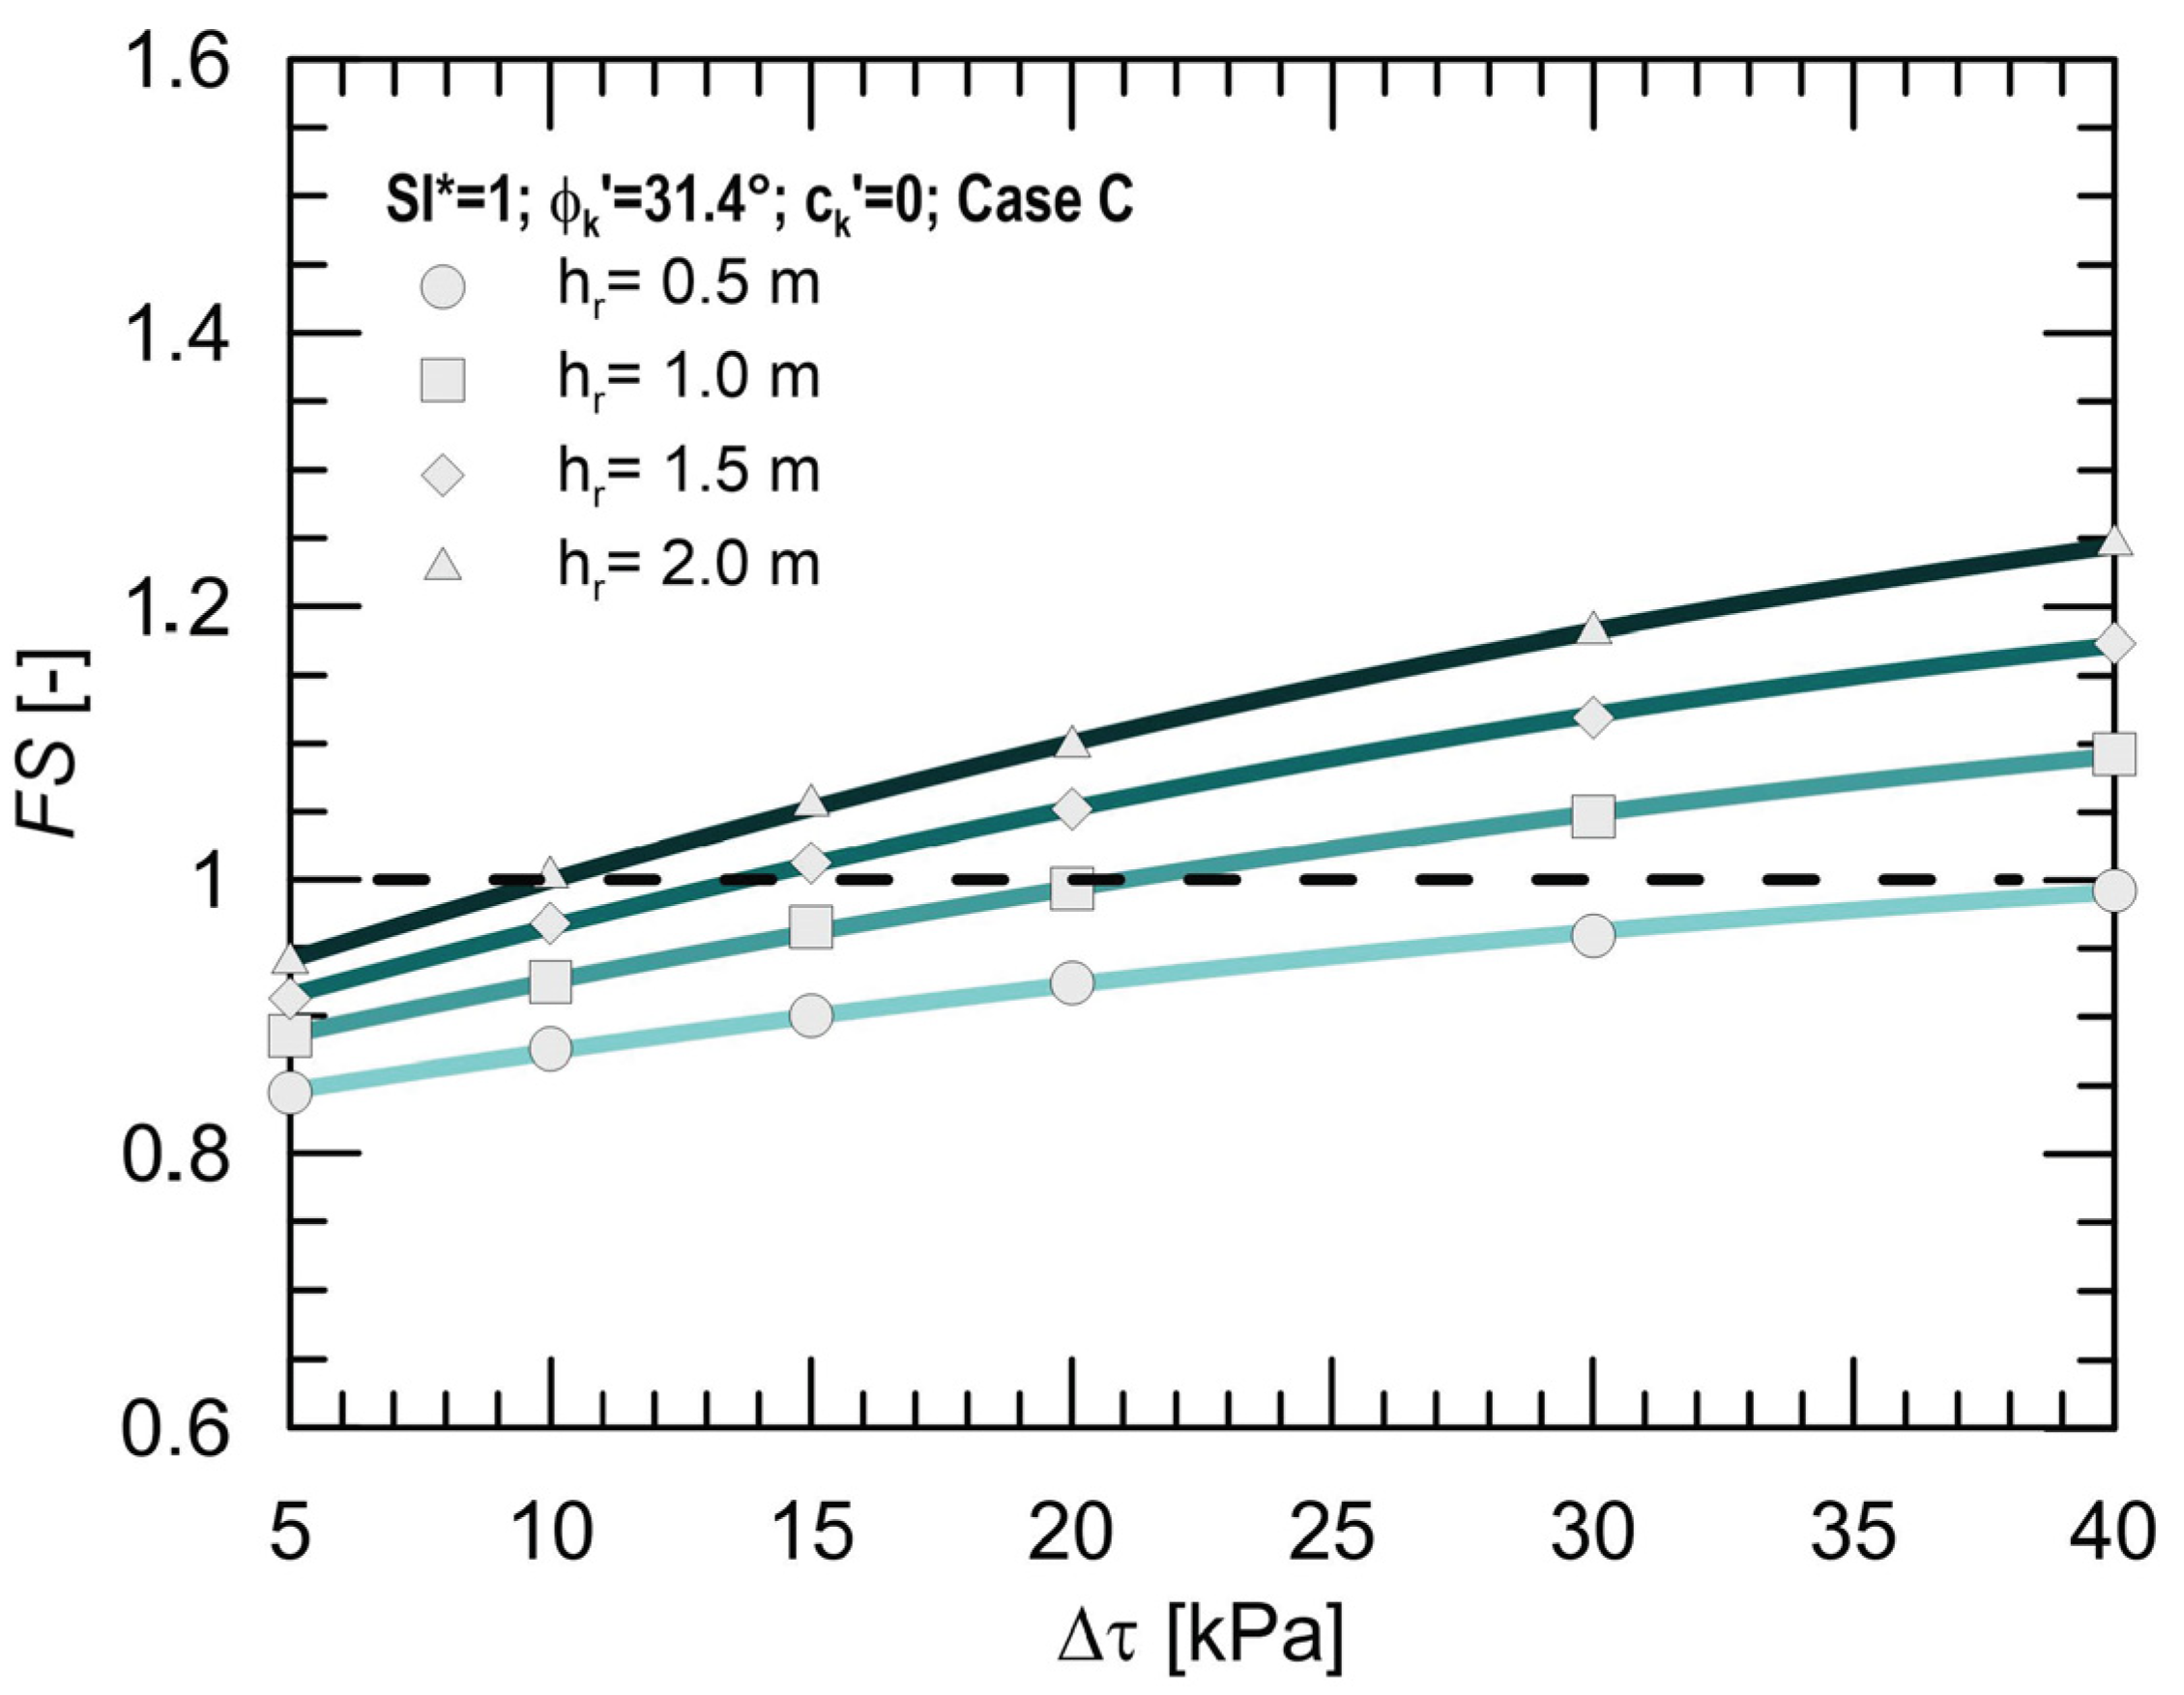
Figure 3 shows the factor of safety trend on varying root contribution to the shear strength Δτ, obtained for a slope configuration with α = 26° and ϕk′ = 31.4°, and the seismic case C. Results for different root depths hr are illustrated. The dashed line in the graph represents the limit equilibrium condition (FS = 1).
By observing the results, an increase in the factor of safety with increasing root contribution to the shear strength can be noted, as expected. Furthermore, with equal Δτ, the FS increases with increasing hr. The factor of safety reaches and exceeds the limit value (FS = 1) when Δτ is greater than about 20, 14 and 10 kPa for hr = 1 m, 1.5 m and 2 m, respectively, whilst a slope instability can be noted when hr = 0.5 m, regardless of the root contribution to the shear strength. Within the range of the investigated Δτ values, the greatest FS increment has been obtained for the greatest root depth. Specifically, when Δτ ranges from 5 to 40 kPa, the increment of the factor of safety is equal to 23% for hr = 1 m; 28% for hr = 1.5 m; and 33% for hr = 2 m.
3.2. Probabilistic Analysis
The following summarises the results of probabilistic analyses that were performed to evaluate whether or not slopes for which the limit equilibrium condition is satisfied are characterised by an acceptable level of reliability as well. The probabilistic analyses were carried out by applying the Monte Carlo simulation on critical slip surfaces that were searched n times, providing the probability distribution for the factor of safety, which was found to be generally normal.
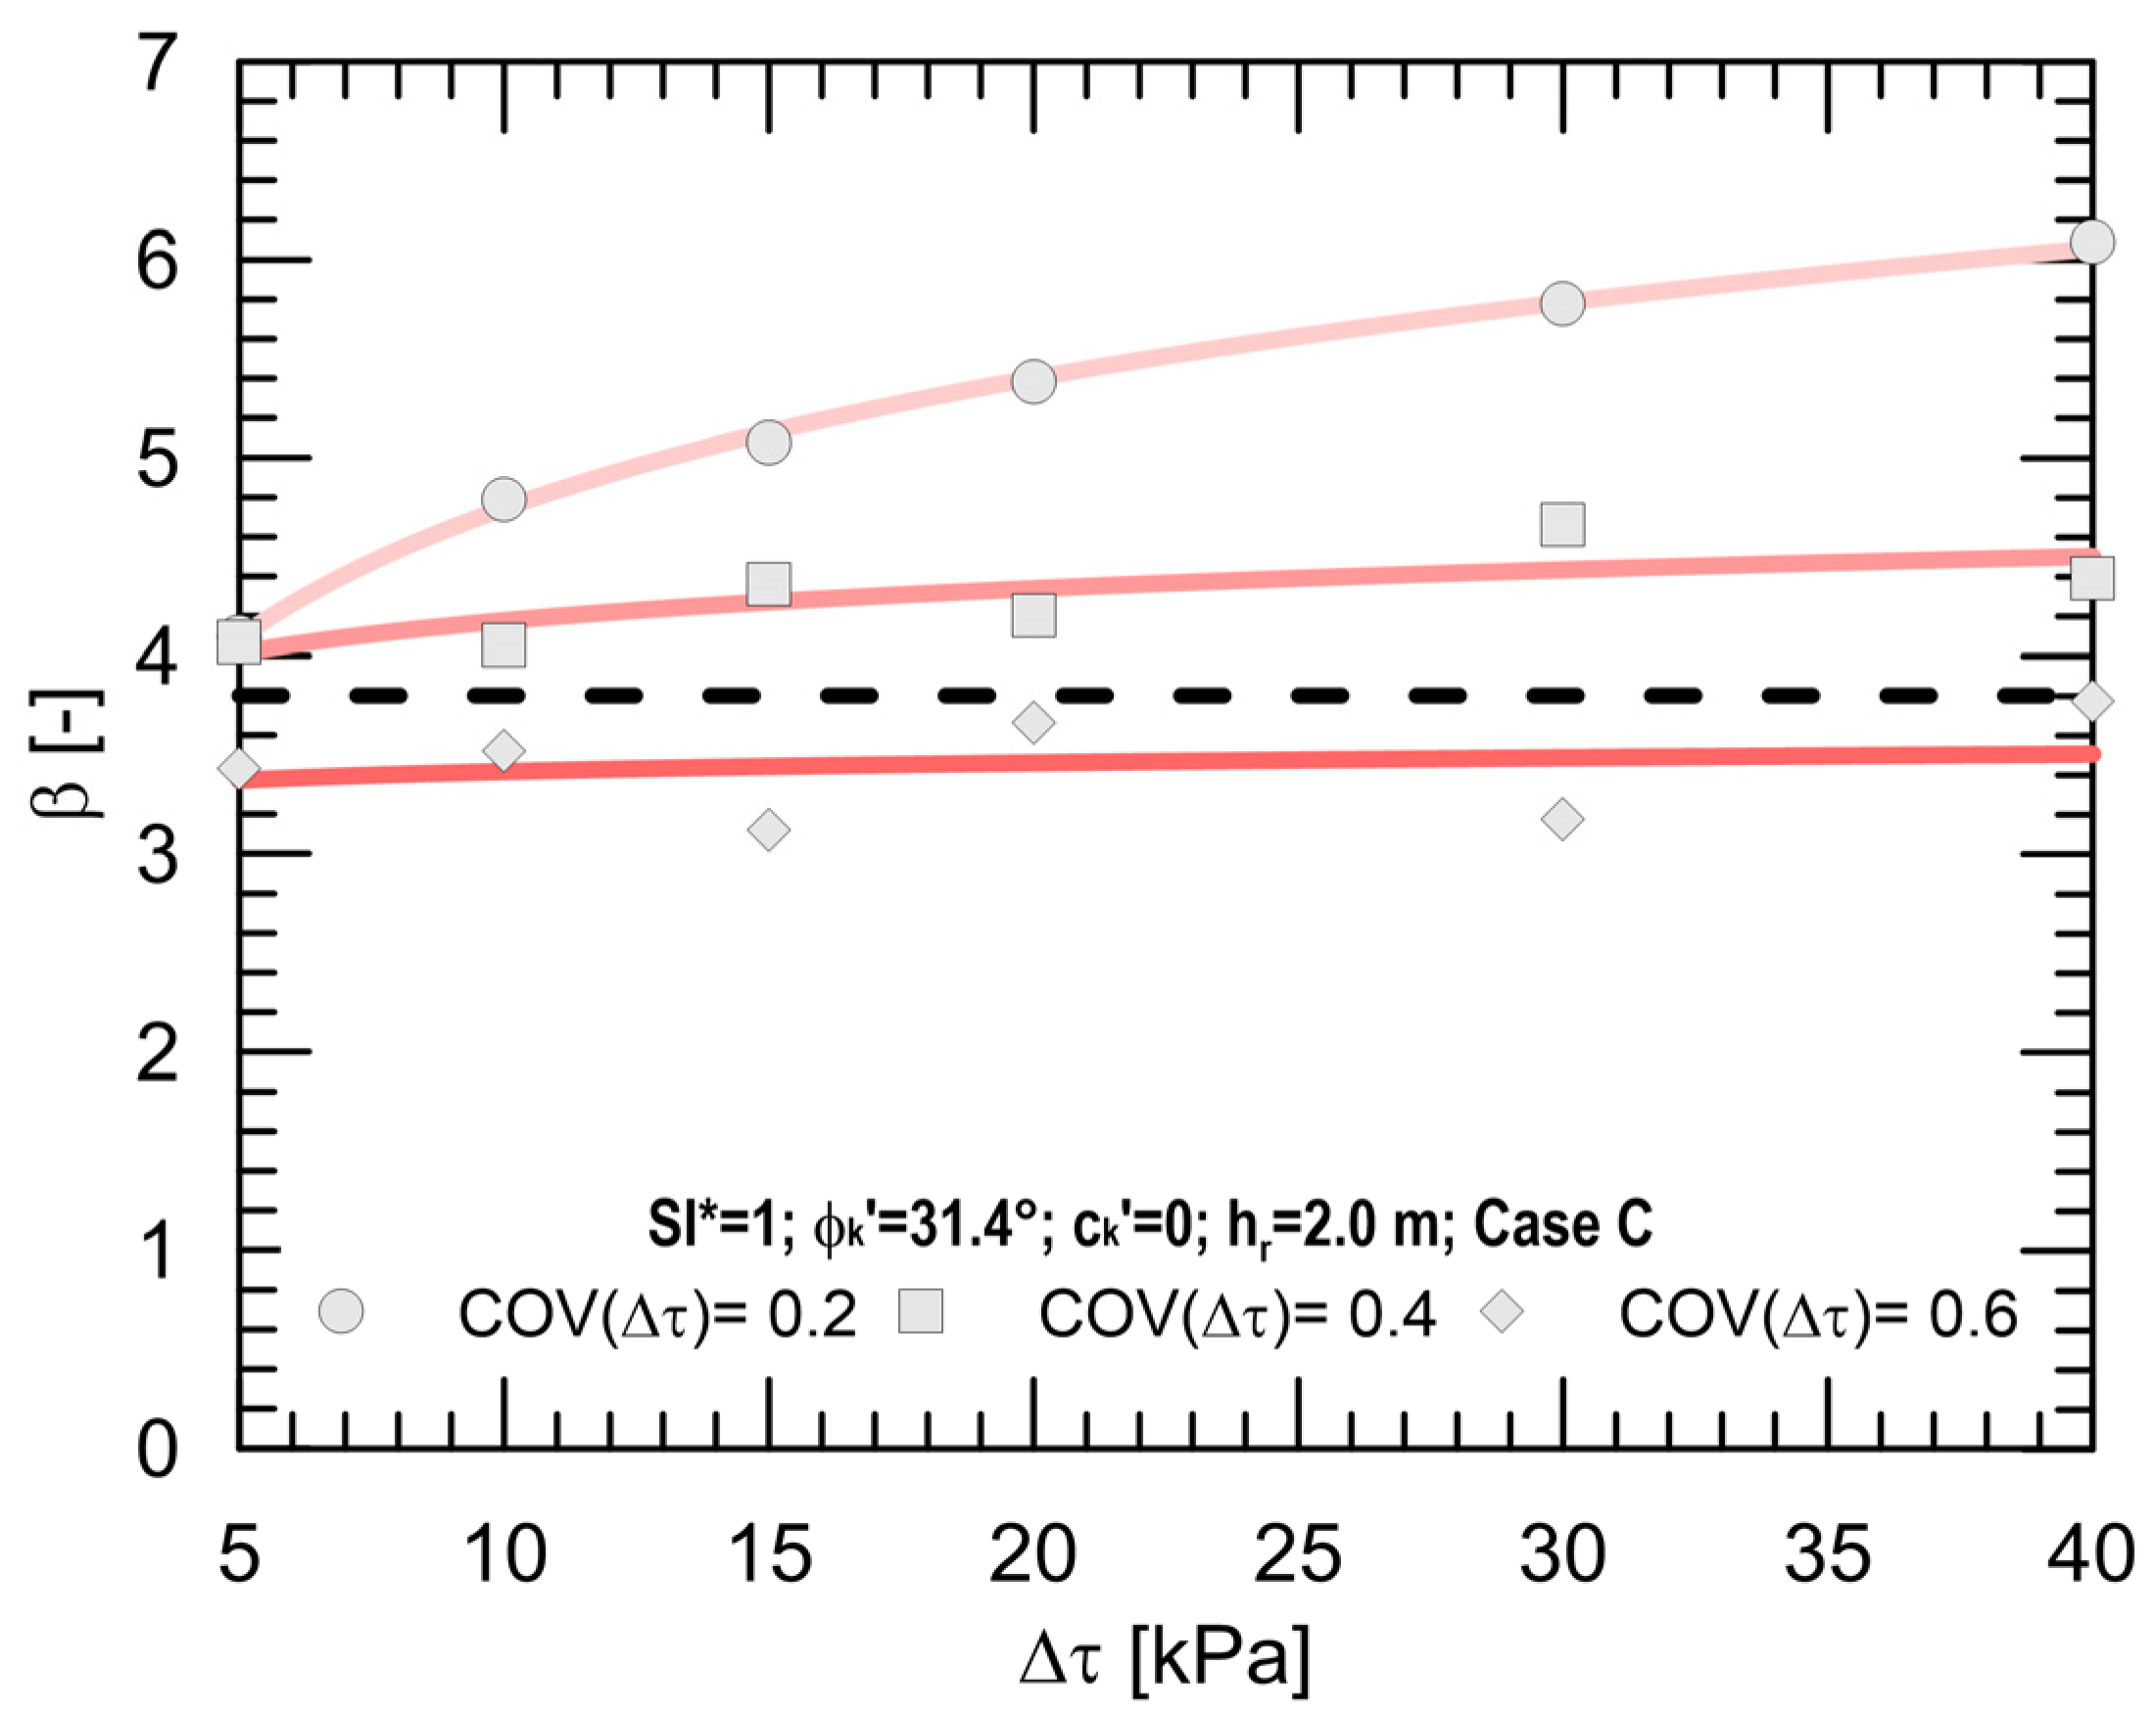
Results in terms of reliability index β for varying root contribution to the shear strength Δτ and root COV values are plotted in Figure 4. They were obtained for a slope configuration with α = 26° and ϕk′ = 31.4° and the seismic case C. Since according to the results previously illustrated in Figure 3 the optimal contribution to the slope reinforcement is offered by root systems with root depth hr = 2 m, this slope configuration is analysed. In this case, the dashed line in the graph represents the minimum value for the reliability criterion to be satisfied in the ULS design.
Results show that the response of the root-reinforced slope in terms of reliability is highly influenced by the COV(Δτ) variation. β highly increases with increasing Δτ for the lowest COV(Δτ) value investigated (20%); on the other hand, the increment of the reliability index is negligible for the highest COV(Δτ) value, showing for it the non-dependence of this parameter on Δτ and cancelling, as a result, the benefit of the roots to offer greater strength. Specifically, β increment is equal to 49% when the root contribution to the shear strength ranges from Δτ = 5 kPa to Δτ = 40 kPa for COV(Δτ) = 20%. Moreover, with equal Δτ, the reliability index decreases with increasing COV(Δτ), as expected; to be more specific, β reaches reductions equal to 16% for the lowest root contribution to the shear strength (Δτ = 5 kPa), and 38% for the highest (Δτ = 40 kPa), ranging from COV(Δτ) = 20% to COV(Δτ) = 60%. Finally, the most important outcome to be noted is that the minimum limit value of the reliability index (β = 3.8) is reached and exceeded only in the case of COV(Δτ) = 20% and 40%. This means that although the limit equilibrium condition was satisfied already for Δτ = 10 kPa in the corresponding deterministic analysis, for the same slope configuration the reliability cannot be guaranteed equally when COV(Δτ) is greater than 40%. Therefore, in light of the above, it is evident that improving the methodology for evaluating root parameters that contribute to increasing soil shear strength is of utmost importance in order to obtain more reliable resultst.
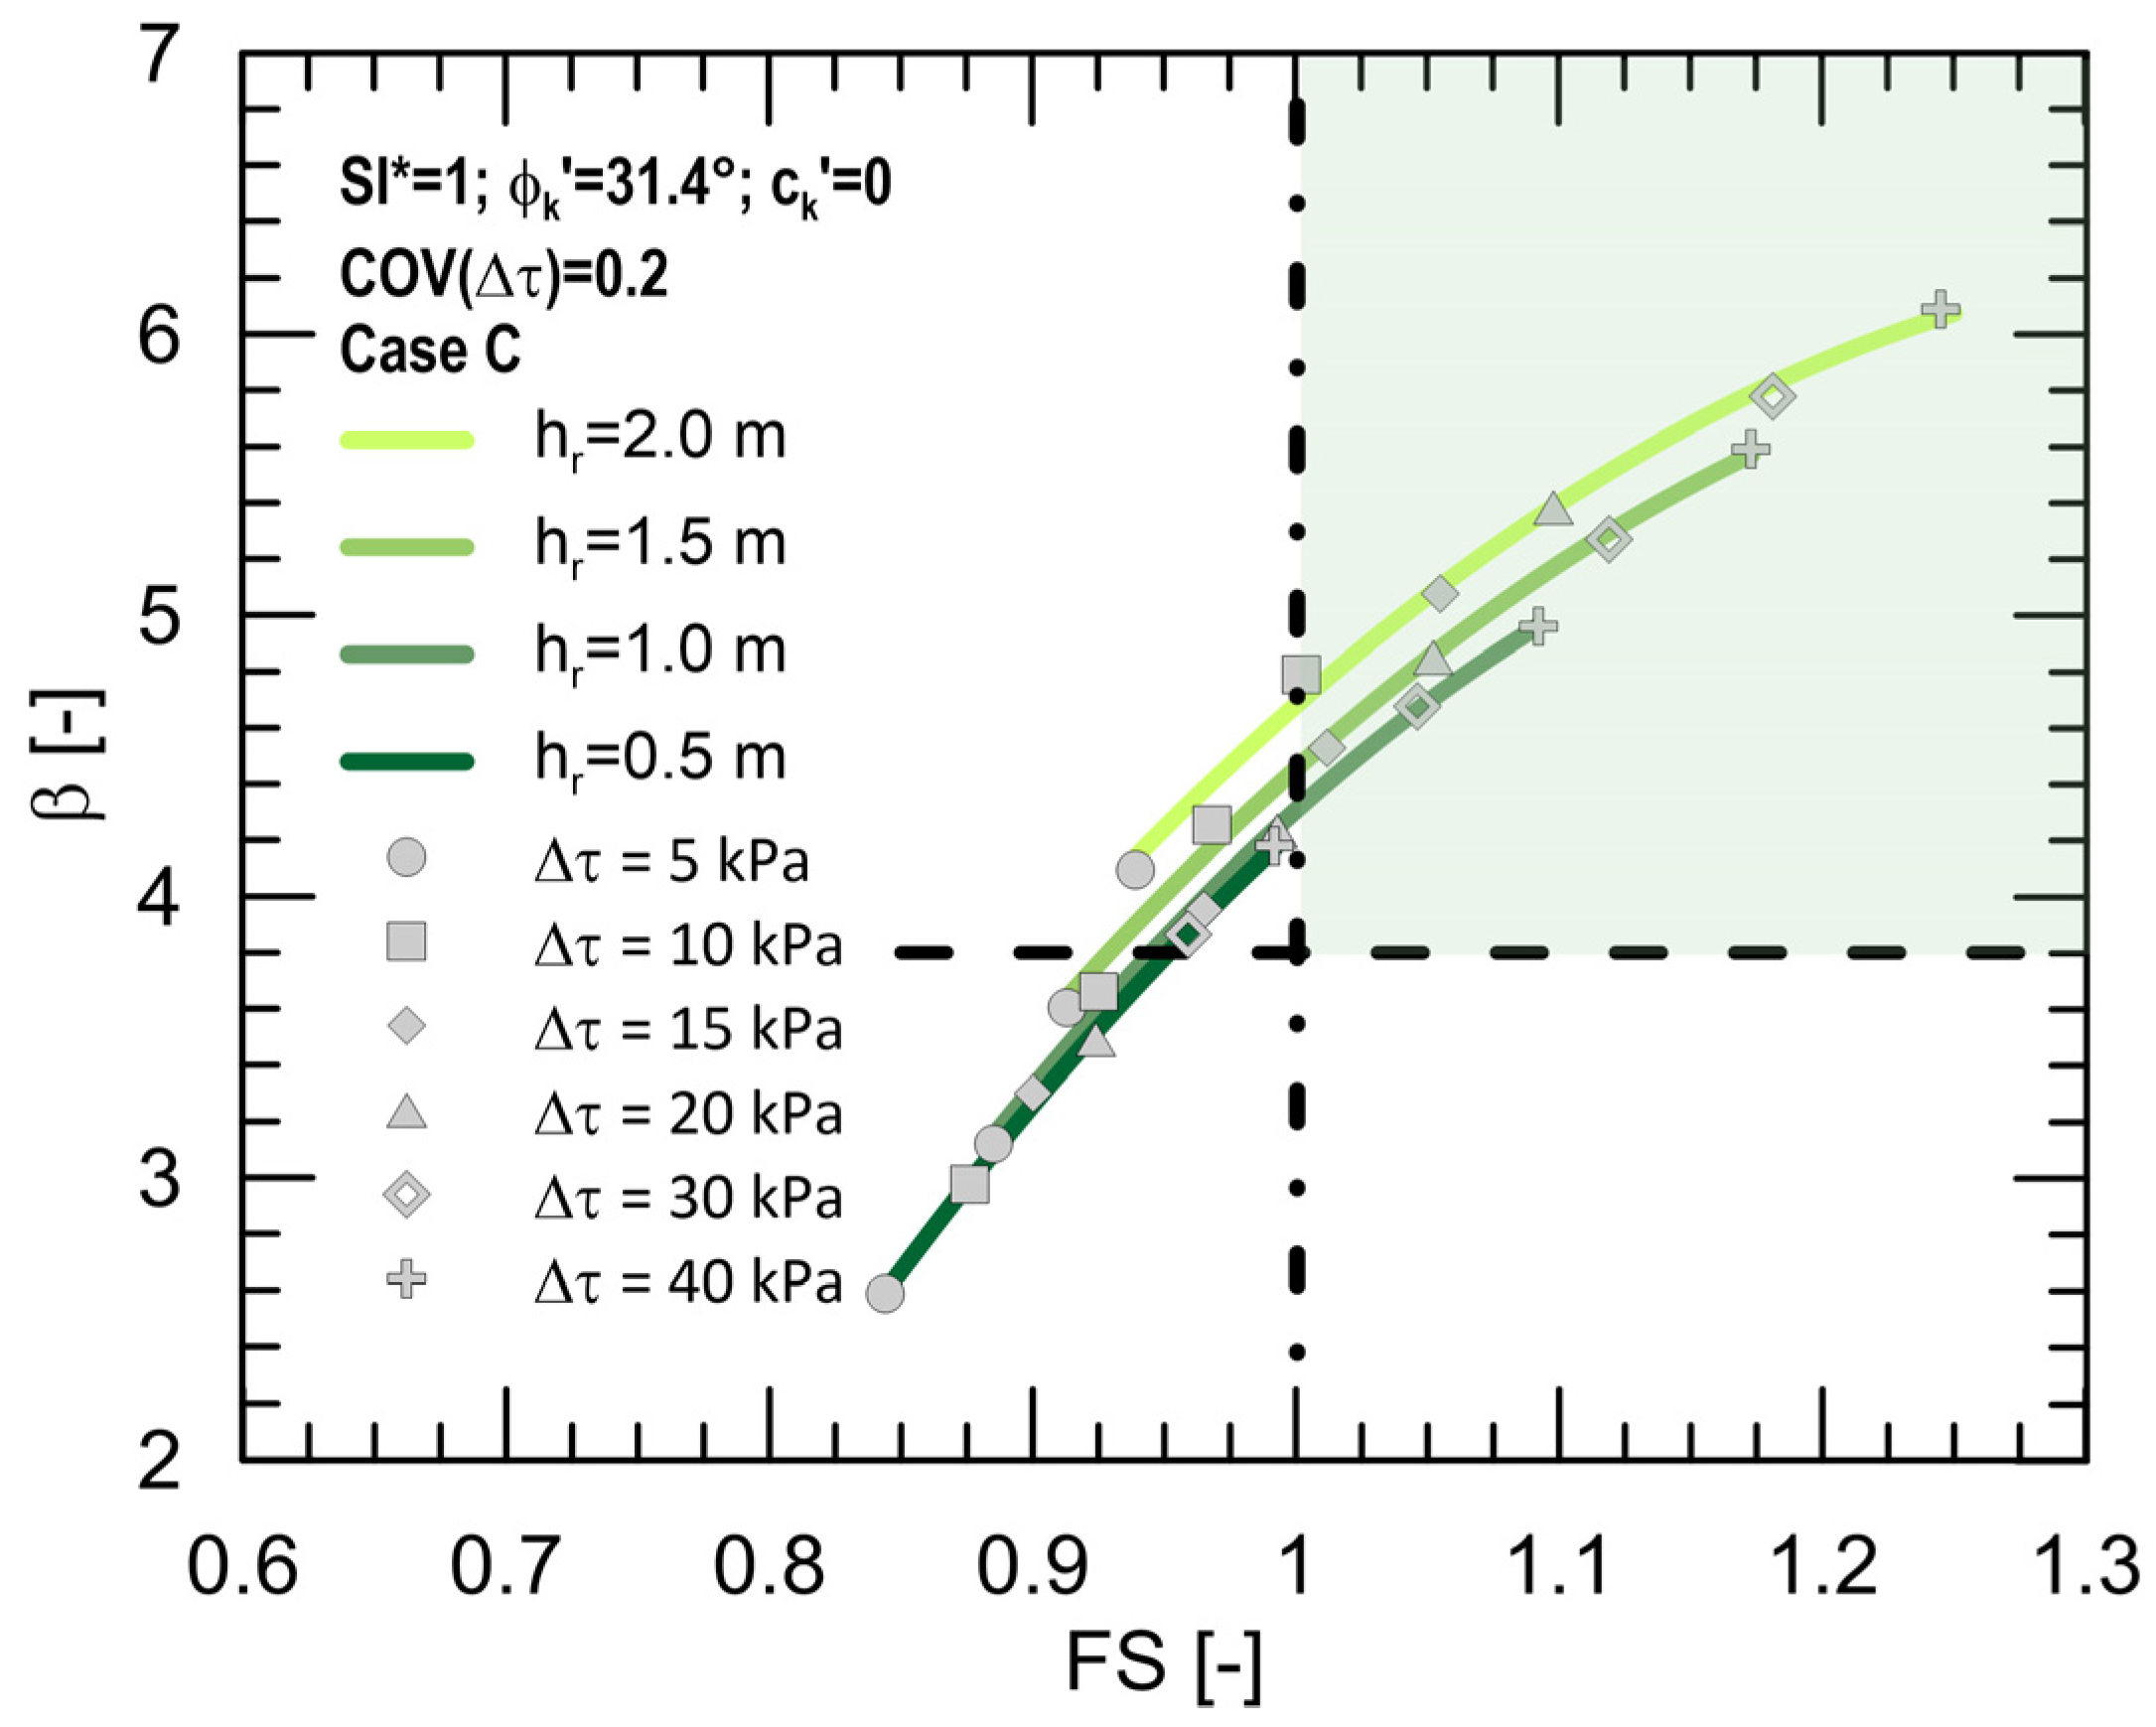
For the same slope configuration and seismic input analysed in the previous figures (α = 26° and ϕk′ = 31.4°, case C), the reliability index (calculated through the probabilistic analyses) and the corresponding factor of safety (obtained through the deterministic analyses) were assembled for all the root depths investigated (Figure 5). The points of each curve represent β-FS pairs obtained for different Δτ values (indicated with different symbols in the legend). The dashed and dash–dot lines, which separate the plot into four quarters, represent the thresholds of the reliability index (β = 3.8) and factor of safety (FS = 1), respectively. The four quarters allow the identification of the zones in which both the deterministic and the probabilistic calculations are satisfied for a specific slope configuration. Results show that any time a fixed performed analysis fulfils the safety requirement (FS = 1), the reliability criterion (β = 3.8) is fulfilled as well. However, it should be observed that these results pertain to the best condition in terms of data uncertainty, that is, the lowest coefficient of variation (COV(Δτ) = 20%).
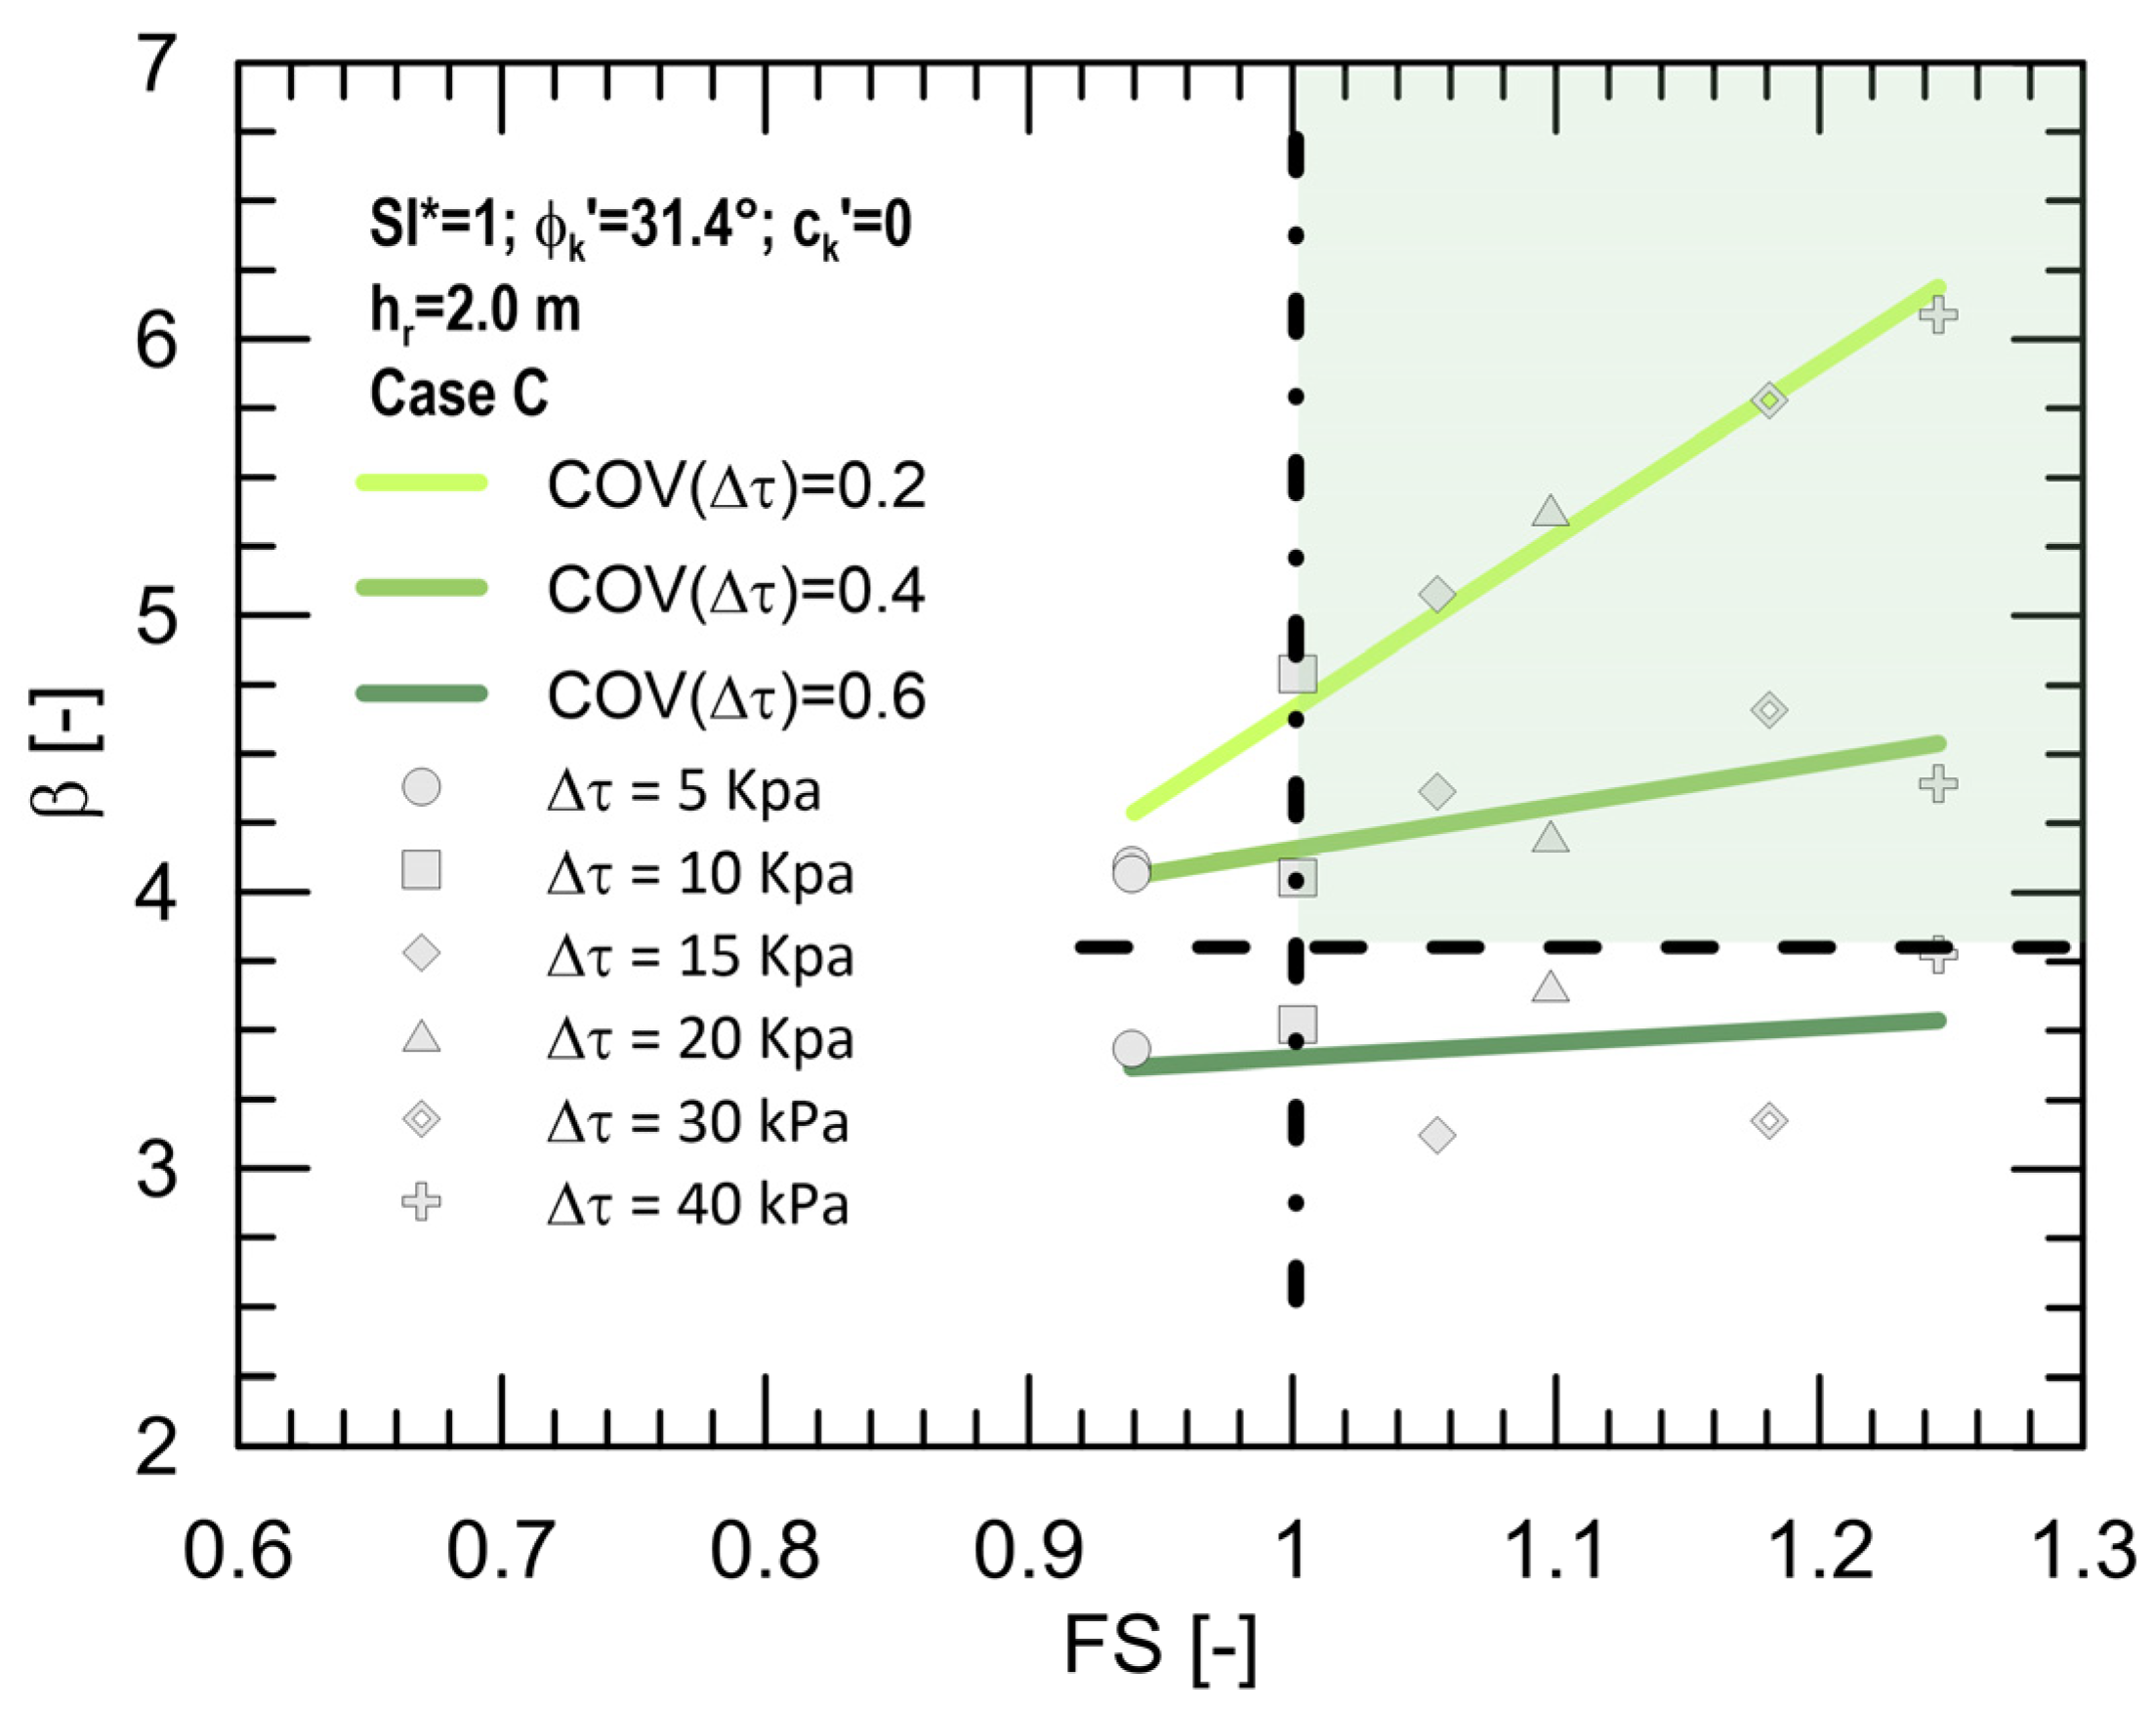
By investigating the other coefficients of variation, a change in performance occurs. For instance, for the same slope configuration and seismic input (α = 26° and ϕk′ = 31.4°, case C) and the best condition in terms of slope thickness reinforced with root (hr = 2 m), the reliability index on varying the corresponding FS is illustrated in Figure 6 for all the root coefficients of variation investigated. In this case, outcomes point out that both the safety and reliability criteria are satisfied only when COV(Δτ) are equal to 20% and 40%. This means that the ultimate limit state partial factors applied to actions and geotechnical parameters in the deterministic analyses cannot guarantee the reliability level required since they were not calibrated to take into account such a large dispersion of data coming from the root contribution; in fact, high COV percentages lead to the achievement of reliability values that are far from the target reliability index.
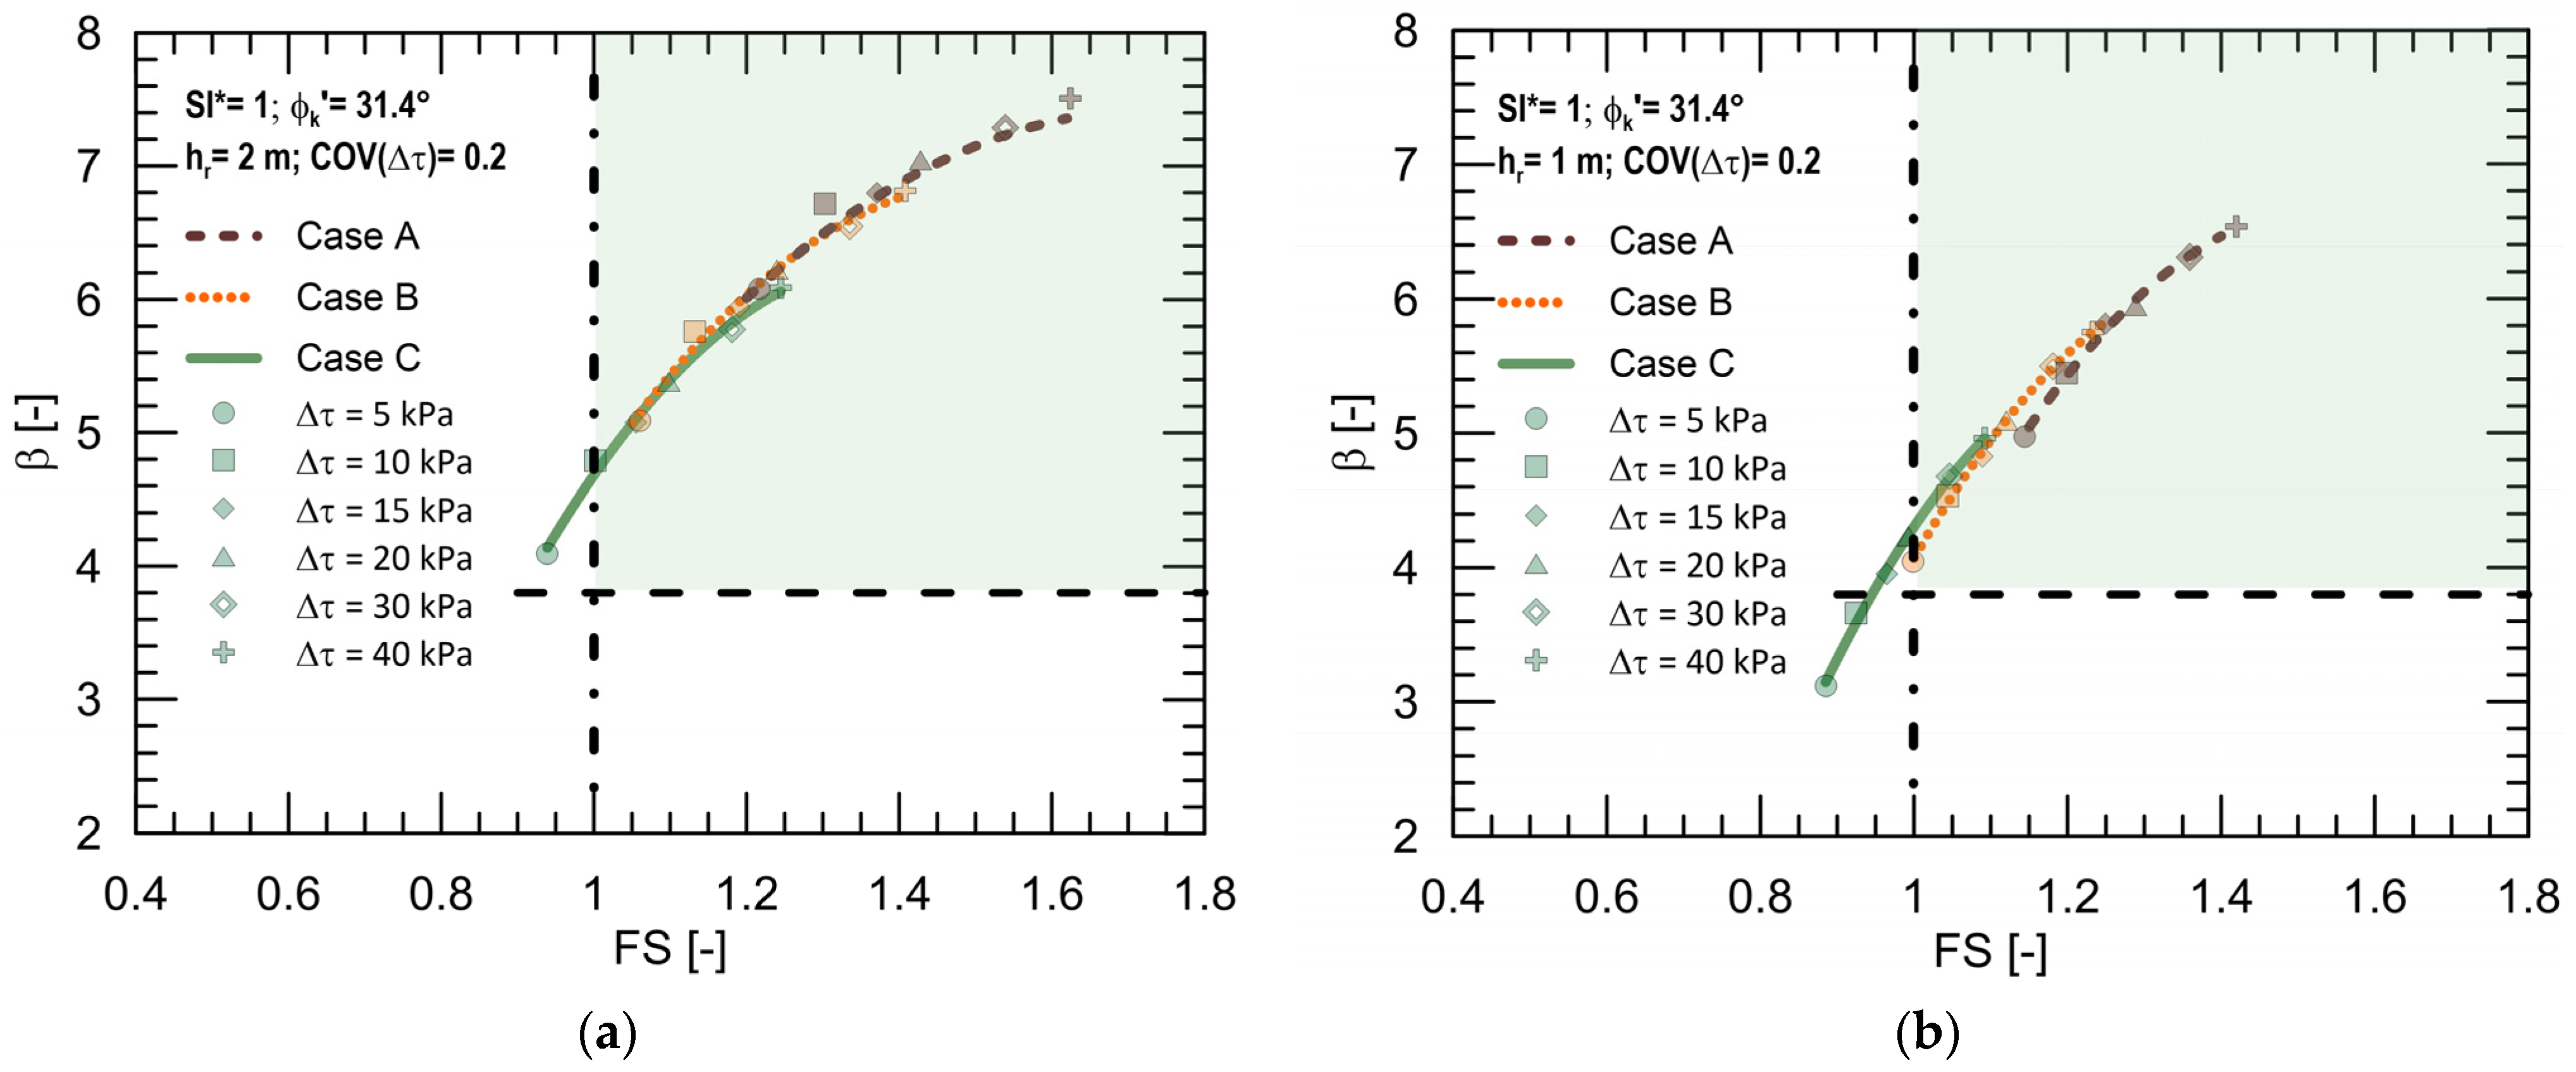
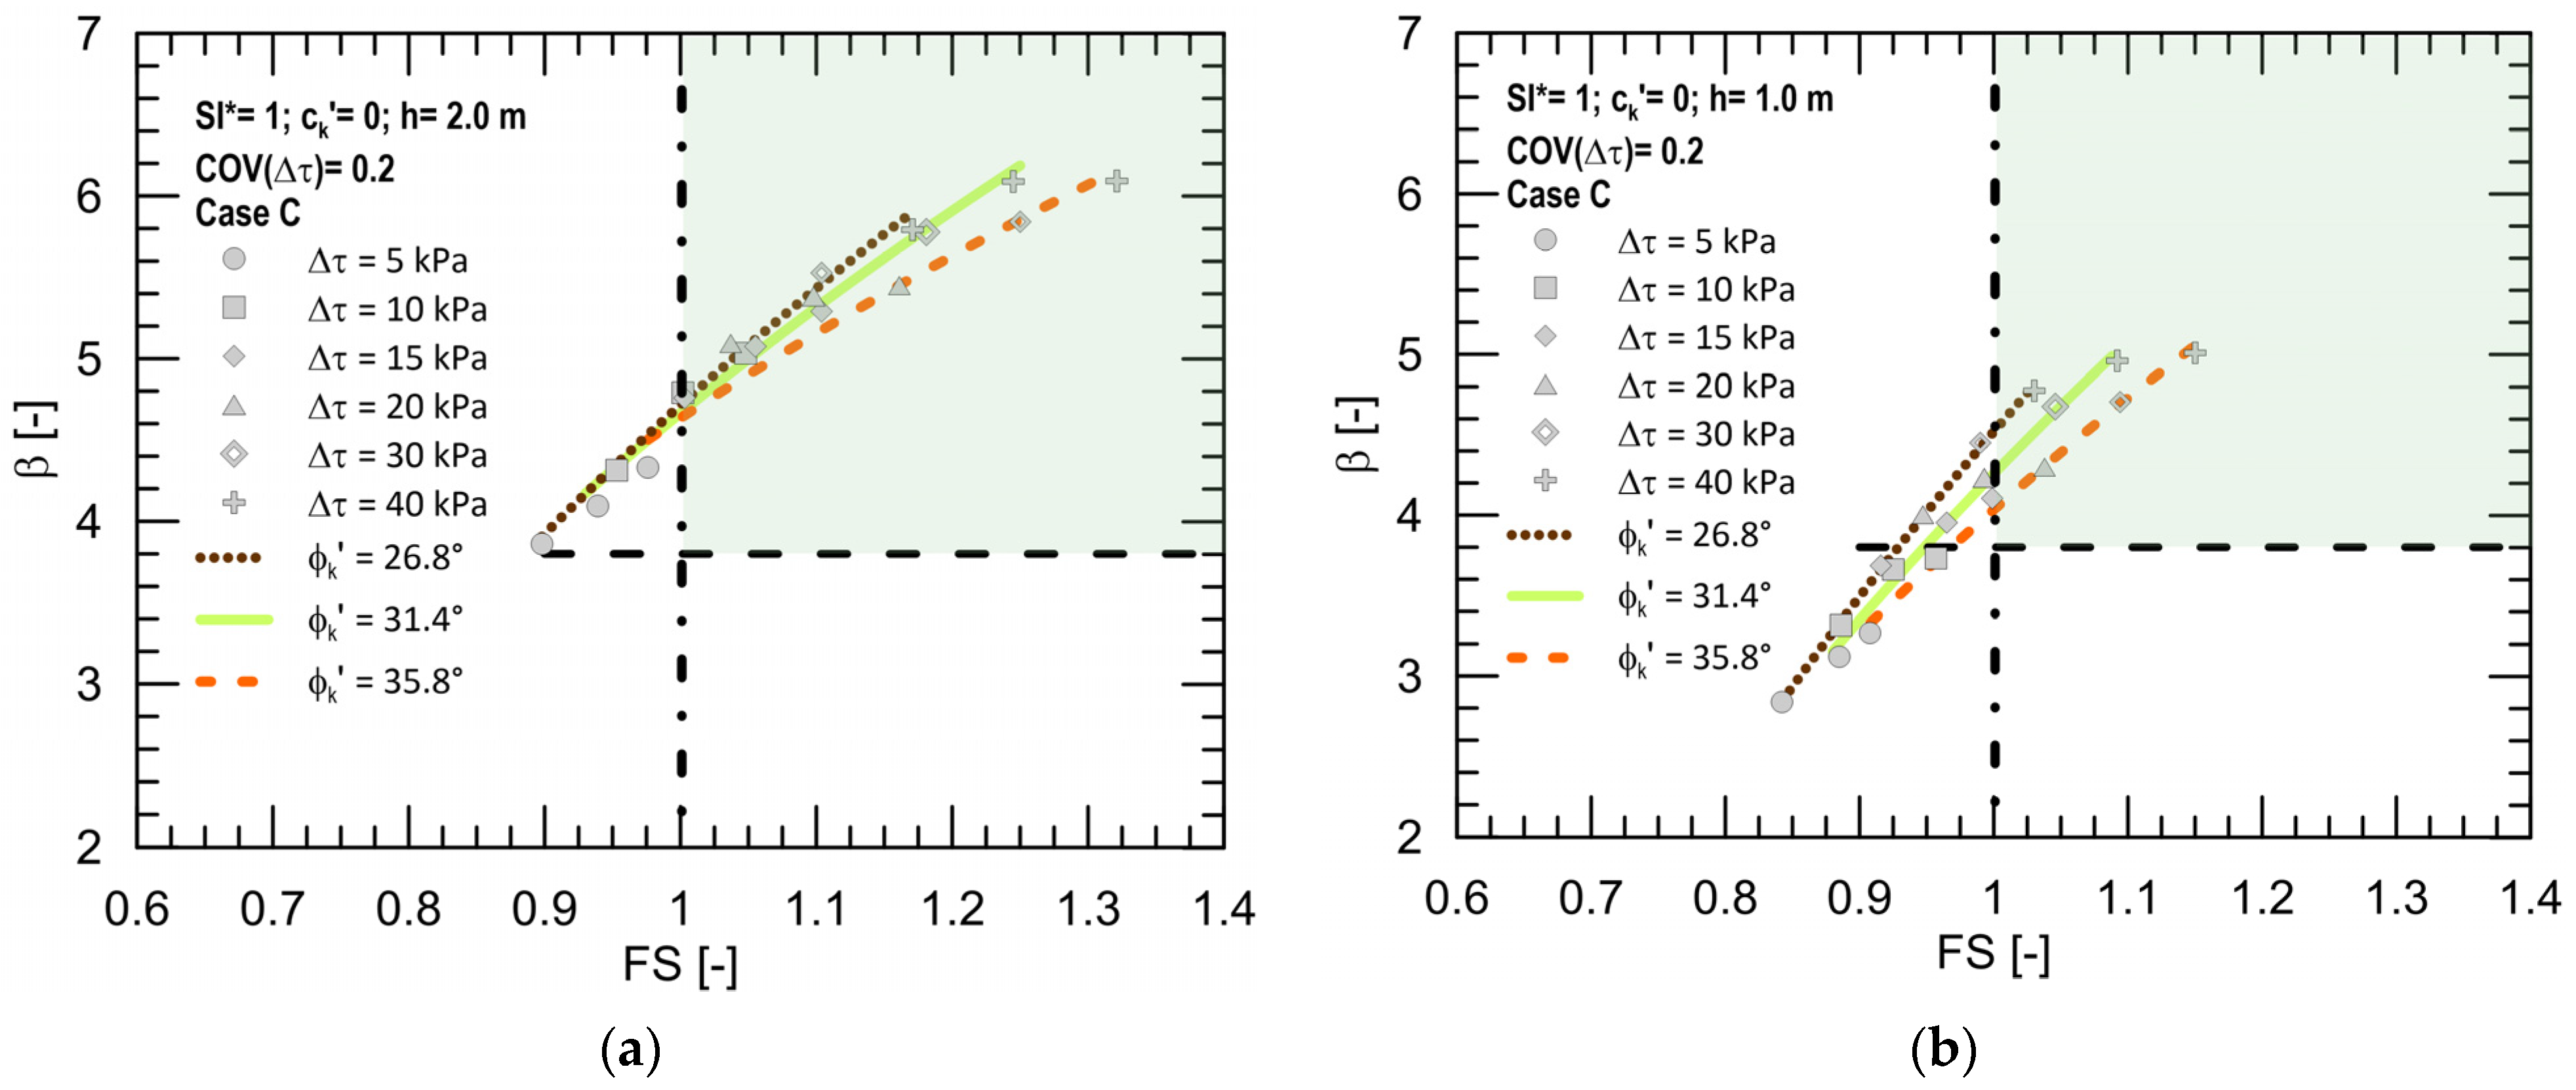
Subsequently, the influence of the seismic input in terms of safety and reliability was investigated on the same slope configuration (α = 26° and ϕk′ = 31.4°) as well. Figure 7 shows the comparison between β-FS curves for varying root contributions to the shear strength, obtained in the case of roots 2 m long (Figure 7a) and 1 m long (Figure 7b), respectively.
The three different curves refer to all the seismic case scenarios investigated and to the best condition in terms of data uncertainty (COV(Δτ) = 20%). The trend in curves highlights that the lower the seismic input, the better the slope stability (considering both the deterministic and the probabilistic aspect), as expected. To be more specific, β-FS combinations that do not satisfy the safety and reliability criteria simultaneously were obtained only for Case C and for the lower root contributions to the shear strength investigated. By analysing the graphs more in-depth it is possible to observe that, ranging from the seismic scenario A to C, in the case of hr = 2 m and with equal Δτ, the reliability index decreases from 19% when Δτ = 40 kPa to 33% when Δτ = 5 kPa. Similarly, for roots with hr = 1 m, the reliability index decreases from 24% when Δτ = 40 kPa to 37% when Δτ = 5 kPa.
To study how different combinations of slope angle of inclination and soil shear strength angle influence the slope response, Figure 8 shows the comparison between β-FS curves for varying root contribution to the shear strength, obtained for all the α-ϕk′ combinations investigated. The analyses refer to roots 2 m long (Figure 8a) and 1 m long (Figure 8b), COV(Δτ) = 20% and seismic case C. It can be noted that β highly increases with increasing root contribution to the shear strength for the other investigated slope configurations as well, congruently with the results obtained for slope with α = 26°, ϕk′ = 31.4°, confirming the good response of this bio-engineering sustainable measure when the best condition both in terms of reinforced slope thickness and data uncertainty is considered. Specifically, when hr = 2 m and the root contribution to the shear strength ranges from Δτ = 5 kPa to Δτ = 40 kPa, β increments are equal to 50% and 41% for the slope combinations α = 22° − ϕk′ = 26.8° and α = 30° − ϕk′ = 35.8°, respectively; when hr = 1 m, β increments are equal to 68% and 53%. Given that all the investigated slopes were chosen with the same initial stability index SI*, this result means that the gradient of the β-FS curves decreases with increasing soil shear strength angle. It can also be noted that, with equal Δτ, the greater the shear strength angle, the greater the combination of reliability index and factor of safety obtained. Moreover, the complete correspondence between both the safety and reliability criteria is achieved for values of Δτ gradually increasing with decreasing soil shear strength angle.
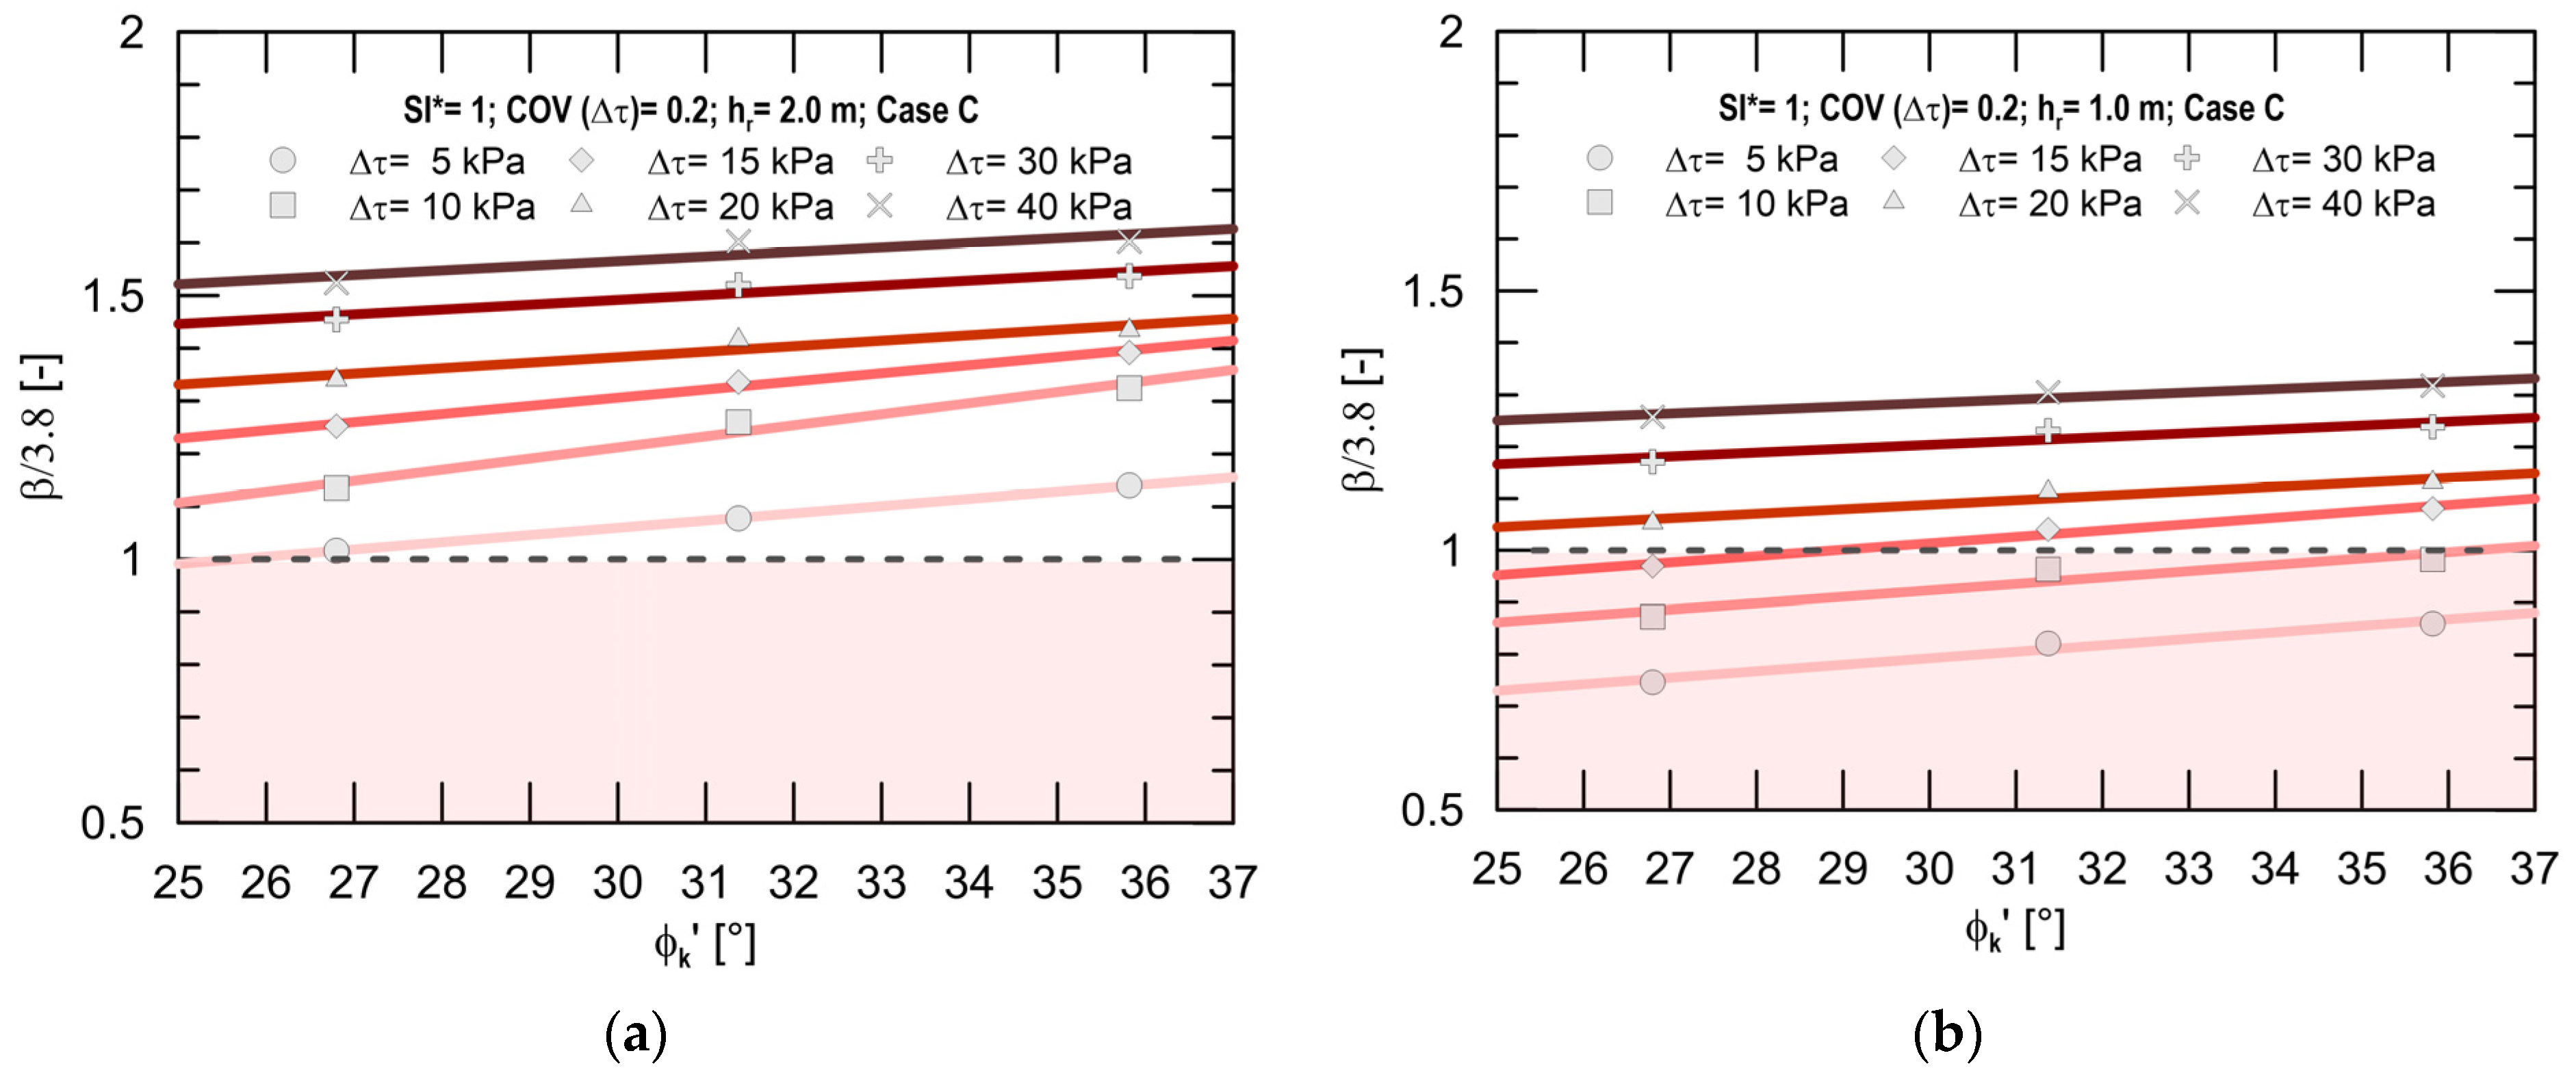
To analyse the discussed findings more in detail, Figure 9 illustrates the trend in β normalised with respect to the reference value (3.8) for varying soil shear strength angle and for different Δτ values, in the case of roots 2 m long (Figure 9a) and 1 m long (Figure 9b), respectively. The analyses refer to the seismic case C and COV(Δτ) = 20%. In the investigated range, results highlight that the normalised reliability increases almost linearly with increasing soil shear strength angle. In particular, ranging from ϕk′ = 26.8° to ϕk′ = 35.8°, in the case of hr = 2 m the normalised reliability reaches increments equal to 12%, 17%, 11%, 7%, 6% and 5% for Δτ = 5 kPa, Δτ = 10 kPa, Δτ = 15 kPa, Δτ = 20 kPa, Δτ = 30 kPa and Δτ = 40 kPa, respectively. When hr = 1 m, these increments are similar (15%, 13%, 12%, 7%, 6% and 5%), showing that the greater the root contribution to the shear strength, the lesser the influence of the soil shear strength angle. Moreover, these graphs help in evaluating whether or not the minimum reliability index value to be used to satisfy the ultimate limit state (ULS) criterion for a reference period of 50 years is reached, for varying the soil shear strength angle and the average root depth. Specifically, it can be noted that the reliability condition is generally always satisfied when hr = 2 m (Figure 9a) while, in the case of hr = 1 m (Figure 9b), β/3.8 never reaches unity for Δτ < 15 kPa; it does only when Δτ = 15 kPa, starting from a soil shear strength angle equal to almost 29°.
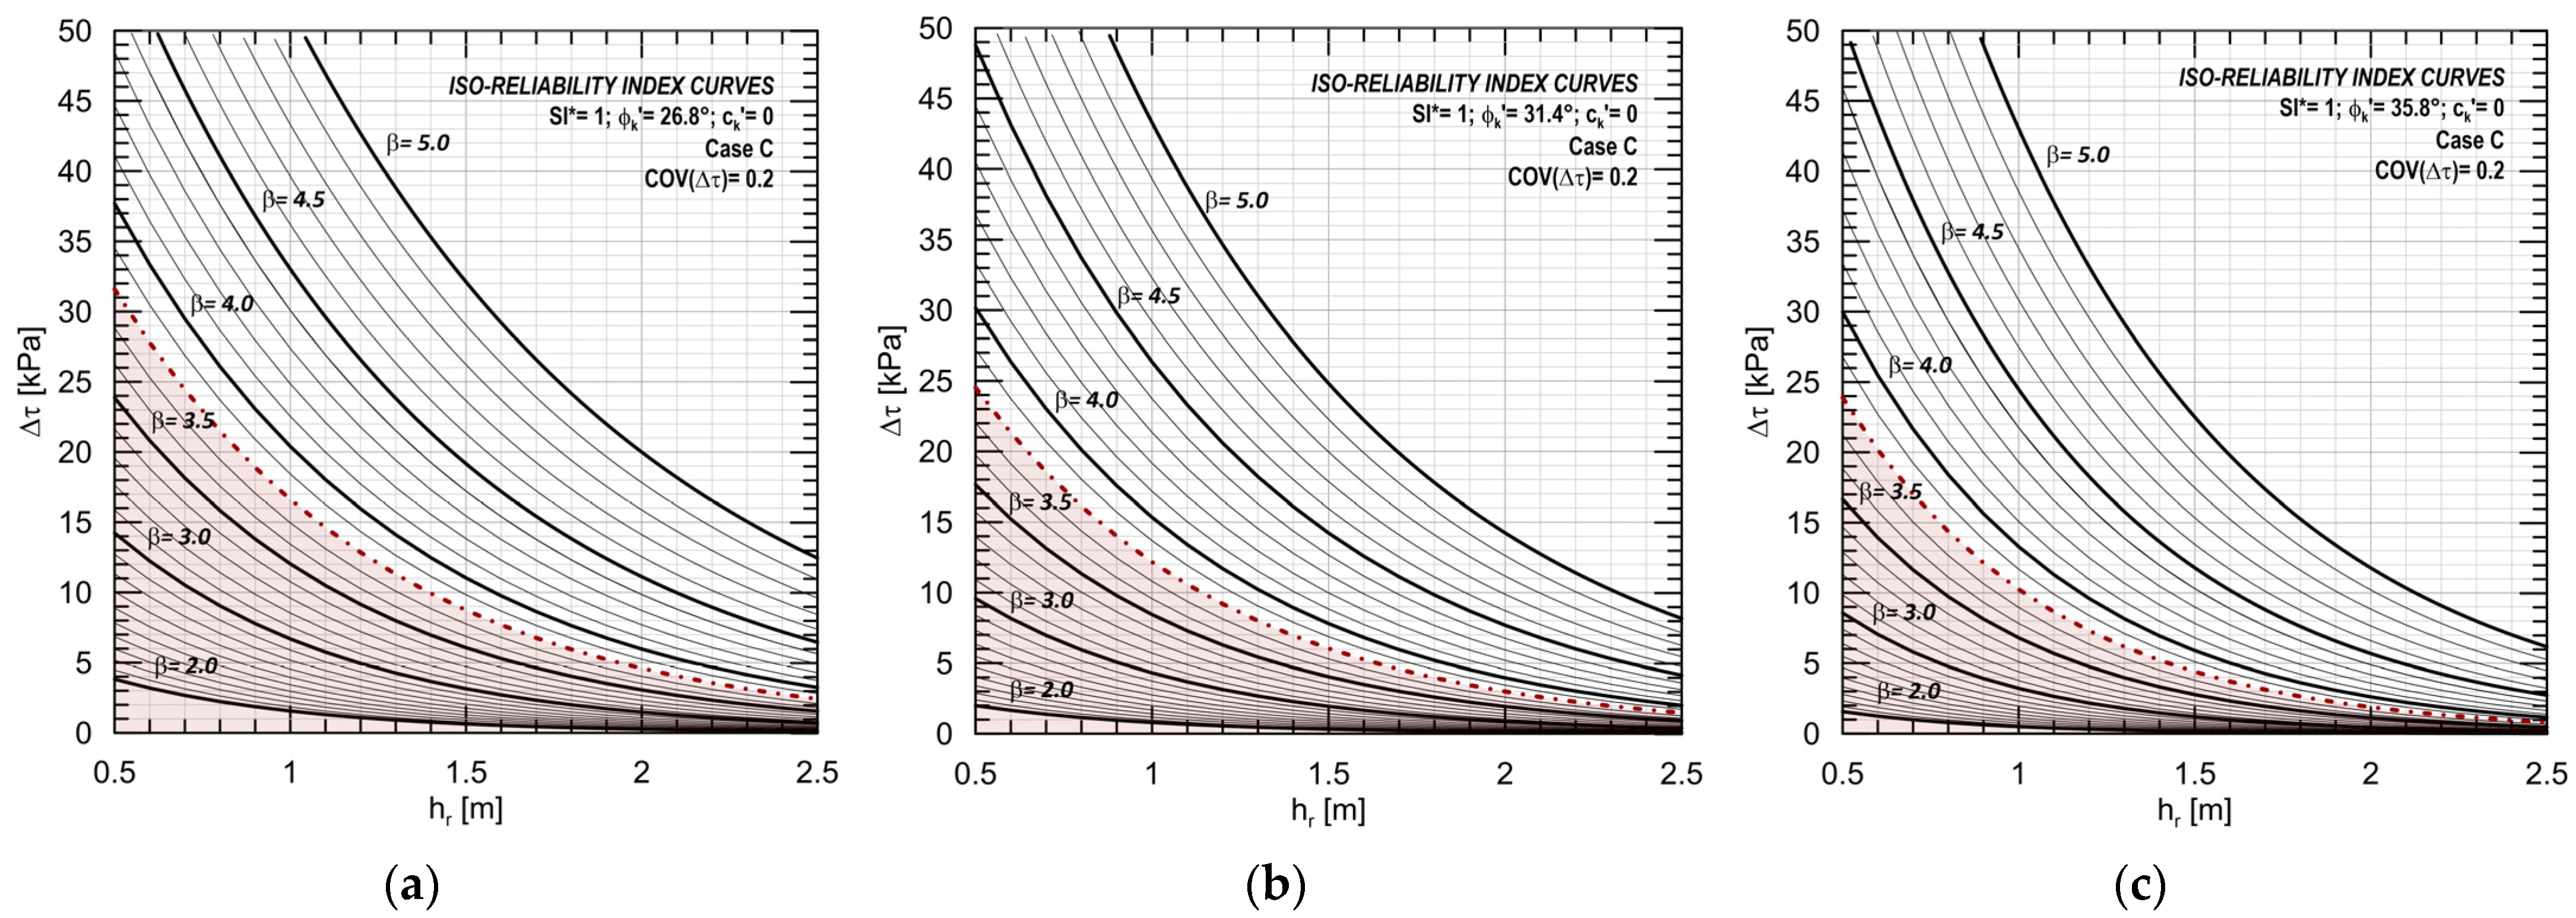
Finally, multiple regression analyses performed on the above-mentioned results allowed the development of iso-reliability charts to optimise the choice of the correct hr-Δτ combinations to be used to achieve the reliability level desired. In particular, Figure 10 illustrates the iso-reliability curves calculated for the three slope configurations and the worst seismic case scenario investigated, with COV(Δτ) = 20%.
4. Discussion and Conclusions
Starting from deterministic slope stability analyses carried out by using EC7 partial factors, Monte Carlo simulation was used on the simplified Bishop Method to perform several probabilistic analyses in order to evaluate whether or not the influence of the uncertainties related to the soil and root parameters would lead to unacceptable probabilities of failure (reliability index). Specifically, the investigated slopes, subjected to potential earthquake-induced shallow landslides, were chosen so that the initial stability condition is equal and corresponds to slopes without vegetation that are in limit equilibrium conditions. The design values for actions and resistances were set equal and used to back-calculate the characteristic values by using EC7 partial factors. The mean and standard deviation values of the design parameters were determined by assigning statistical distributions. For each analysis a high number of samples n was considered, hence calculating n FS values for each set of them, and the resulting probabilities of failure. The influence of different slope geometries, root contributions to the shear strength and their coefficients of variation, as well as different seismic case scenarios, was analysed on the results expressed in terms of reliability index. The main outcome observed is that both the safety and reliability criteria requested by the Eurocodes to design properly cannot be always satisfied simultaneously, meaning that the EC7 partial factors do not fully capture the high variability of root parameters. Therefore, it is important to reduce root-related uncertainties as much as possible (i.e., lower COVs).
Summarising, two goals were set in this research. The first was to guide the designer towards a witting root-reinforced slope stability analysis as, when factor of safety reaches the requirement of the regulations in force, this does not imply that reliability is also guaranteed effectively. The second goal was to provide a tool in the form of iso-reliability charts (for three different slope configurations and for a typical seismic scenario) to optimise the choice of the correct hr-Δτ combinations to be used to achieve the desired reliability level.
The following considerations can be drawn:
- The achievement of the limit equilibrium condition in a certain slope configuration derives from the combinations of strength and depth values of the roots and the seismic input. Root reinforcement generally improves the slope stability: FS increases with increasing both root depth and its contribution to the shear strength for all the geometries and seismic cases analysed.
- The reliability of root-reinforced slopes is highly affected by COV(Δτ) variation. When the coefficient of variation is low, the reliability index rises significantly with rising root contribution to the shear strength; however, this behaviour changes with increasing COV(Δτ): the higher the coefficient of variation, the lower the dependence of the reliability index on the root contribution to the shear strength.
- For all the analyses performed, whenever the safety criterion (FS = 1) is satisfied, the reliability criterion (β = 3.8) is guaranteed as well when the best condition in terms of data uncertainty is considered (COV(Δτ) = 0.2). On the contrary, high COV percentages lead to the achievement of reliability values that can be far from the target reliability index, implying that the ultimate limit state partial factors applied to actions and geotechnical parameters in the deterministic analyses cannot guarantee the reliability level required since they were not calibrated to bear in mind the large dispersion of data coming from the root contribution. In light of the above, it is evident that improving the methodology for evaluating root parameters that contribute to increasing soil shear strength is of utmost importance in order to obtain more reliable results.
- The gradient of the β-FS curves referring to different combinations of slope angle of inclination and soil shear strength angle (same initial stability index SI* = 1) decreases with increasing soil shear strength angle. Moreover, with equal Δτ, the greater the shear strength angle, the greater the combination of reliability index and factor of safety obtained.
- Considering both the deterministic and probabilistic aspects, the lower the seismic input, the better the slope stability (as expected). β-FS combinations that do not satisfy the safety and reliability criteria simultaneously are obtained only for the worst seismic case scenario and the lower root contributions to the shear strength investigated.
Author Contributions
Conceptualization, M.P. and G.C.; data curation, M.P. and G.C.; formal analysis, M.P. and G.C.; investigation, M.P. and G.C.; methodology, M.P. and G.C.; software, M.P.; supervision, G.C.; writing—original draft, M.P.; writing—review and editing, M.P. and G.C. All authors have read and agreed to the published version of the manuscript.
Funding
The research described in this paper was supported by the European Union—FSE—REACT—EU, PON Research and Innovation 2014–2020, DM1062/2021, CCI2014IT16M2OP005 (CUP C35F21001220009 code: I06).
Data Availability Statement
The data presented in this study are available within the manuscript.
Conflicts of Interest
The authors declare no conflict of interest.
References
- Hungr, O.; Leroueil, S.; Picarelli, L. The Varnes classification of landslide types, an update. Landslides 2014, 11, 167–194. [Google Scholar] [CrossRef]
- Ashwood, W.; Hungr, O. Estimating the total resisting force in a flexible barrier impacted by a granular avalanche using physical and numerical modeling. Can. Geotech. J. 2016, 53, 1700–1717. [Google Scholar] [CrossRef]
- Bugnion, L.; McArdell, B.W.; Bartelt, P.; Wendeler, C. Measurements of hillslope debris flow impact pressure on obstacles. Landslides 2011, 9, 179–187. [Google Scholar] [CrossRef] [Green Version]
- Canelli, L.; Ferrero, A.M.; Migliazza, M.; Segalini, A. Debris flow risk mitigation by the means of rigid and flexible barriers—Experimental tests and impact analysis. Nat. Hazards Earth Syst. Sci. 2012, 12, 1693–1699. [Google Scholar] [CrossRef] [Green Version]
- Moraci, N.; Pisano, M.; Mandaglio, M.C.; Gioffrè, D.; Pastor, M.; Leonardi, G.; Cola, S. Analyses and design procedure of a new physical model for debris flows: Results of numerical simulations by means of laboratory tests. Ital. J. Eng. Geol. Environ. 2015, 2, 29–40. [Google Scholar] [CrossRef]
- Vagnon, F.; Segalini, A. Debris flow impact estimation on a rigid barrier. Nat. Hazards Earth Syst. Sci. 2016, 16, 1691–1697. [Google Scholar] [CrossRef] [Green Version]
- Liu, W.; Yang, Z.; He, S. Modeling the landslide-generated debris flow from formation to propagation and run-out by considering the effect of vegetation. Landslides 2021, 18, 43–58. [Google Scholar] [CrossRef]
- Cardile, G.; Pisano, M.; Moraci, N.; Cazzuffi, D. Root reinforcement as a measure for shallow landslides risk mitigation. ArcHistoR 2019, 6, 616–627. [Google Scholar] [CrossRef]
- Masi, E.B.; Segoni, S.; Tofani, V. Root Reinforcement in Slope Stability Models: A Review. Geosciences 2021, 11, 212. [Google Scholar] [CrossRef]
- Tsige, D.; Senadheera, S.; Talema, A. Stability Analysis of Plant-Root-Reinforced Shallow Slopes along Mountainous Road Corridors Based on Numerical Modeling. Geosciences 2020, 10, 19. [Google Scholar] [CrossRef] [Green Version]
- Bischetti, G.B.; Di Fidio, M.; Florineth, F. On the origin of soil bioengineering. Landsc. Res. 2014, 39, 583–595. [Google Scholar] [CrossRef]
- Giupponi, L.; Borgonovo, G.; Giorgi, A.; Bischetti, G.B. How to renew soil bioengineering for slope stabilization: Some proposals. Landsc. Ecol. Eng. 2019, 15, 37–50. [Google Scholar] [CrossRef]
- Cazzuffi, D.; Cardile, G.; Gioffrè, D. Geosynthetic engineering and vegetation growth in soil reinforcement applications. Transp. Infrastruct. Geotechnol. 2014, 1, 262–300. [Google Scholar] [CrossRef]
- Kamchoom, V.; Leung, A.K.; Ng, C.W.W. Effects of root geometry and transpiration on pull-out resistance. Géotech. Lett. 2014, 4, 330–336. [Google Scholar] [CrossRef]
- Mickovski, S.B.; Hallett, P.D.; Bransby, M.F.; Davies, M.C.R.; Sonnenberg, R.; Bengough, A.G. Mechanical reinforcement of soil by willow roots: Impacts of root properties and root failure mechanism. Soil Sci. Soc. Am. J. 2009, 73, 1276–1285. [Google Scholar] [CrossRef]
- Mehtab, A.; Jiang, Y.-J.; Su, L.-J.; Shamsher, S.; Li, J.-J.; Mahfuzur, R. Scaling the Roots Mechanical Reinforcement in Plantation of Cunninghamia R. Br in Southwest China. Forests 2021, 12, 33. [Google Scholar] [CrossRef]
- Sonnenberg, R.; Bransby, M.F.; Hallett, P.D.; Bengough, A.G.; Mickovski, S.B.; Davies, M.C.R. Centrifuge modelling of soil slopes reinforced with vegetation. Can. Geotech. J. 2010, 47, 1415–1430. [Google Scholar] [CrossRef]
- Veylon, G.; Ghestem, M.; Stokes, A.; Bernard, A. Quantification of mechanical and hydric components of soil reinforcement by plant roots. Can. Geotech. J. 2015, 52, 1839–1849. [Google Scholar] [CrossRef]
- Wu, T.H. Root reinforcement of soil: Review of analytical models, test results, and applications to design. Can. Geotech. J. 2013, 50, 259–274. [Google Scholar] [CrossRef]
- Boldrin, D.; Leung, A.K.; Bengough, A.G. Hydro-mechanical reinforcement of contrasting woody species: A full-scale investigation of a field slope. Géotechnique 2021, 71, 970–984. [Google Scholar] [CrossRef]
- Kamchoom, V.; Leung, A.K. Hydro-mechanical reinforcements of live poles to slope stability. Soils Found. 2018, 58, 1423–1434. [Google Scholar] [CrossRef]
- Ng, C.W.W.; Menzies, B. Advanced Unsaturated Soil Mechanics and Engineering; CRC Press: Boca Raton, FL, USA, 2007; 712p. [Google Scholar]
- Ng, C.W.W.; Kamchoom, V.; Leung, A.K. Centrifuge modelling of the effects of root geometry on transpiration-induced suction and stability of vegetated slopes. Landslides 2016, 13, 925–938. [Google Scholar] [CrossRef] [Green Version]
- Bathurst, R.J.; Ezzein, F.M. Insights into geogrid–soil interaction using a transparent granular soil. Géotech. Lett. 2017, 7, 179–183. [Google Scholar] [CrossRef]
- Bergado, D.T.; Shivashankar, R.; Alfaro, M.C.; Chai, J.-C.; Balasubramaniam, A.S. Interaction behaviour of steel grid reinforcements in a clayey sand. Géotechnique 1993, 43, 589–603. [Google Scholar] [CrossRef]
- Derksen, J.; Ziegler, M.; Fuentes, R. Geogrid-soil interaction: A new conceptual model and testing apparatus. Geotext. Geomembr. 2021, 49, 1393–1406. [Google Scholar] [CrossRef]
- Peng, X.; Zornberg, J.G. Evaluation of soil-geogrid interaction using transparent soil with laser illumination. Geosynth. Int. 2019, 26, 206–221. [Google Scholar] [CrossRef]
- Dixon, N. Soil-geosynthetic interaction: Interface behaviour. In Proceedings of the 9th International Conference on Geosynthetics, Guarujá, Brazil, 23–27 May 2010; Palmeira, E.M., Vidal, D.M., Sayão, A.S.J.F., Ehrlich, M., Eds.; International Geosynthetics Society: Austin, TX, USA, 2010; pp. 563–582. [Google Scholar]
- Jewell, R.A. Reinforcement bond capacity. Géotechnique 1990, 40, 513–518. [Google Scholar] [CrossRef]
- Moraci, N.; Cardile, G.; Pisano, M. Soil-geosynthetic interface behaviour in the anchorage zone [Comportamento all’interfaccia terreno-geosintetico nella zona di ancoraggio]. Riv. Ital. Geotech. 2017, 51, 5–25. [Google Scholar]
- Cardile, G.; Pisano, M.; Moraci, N. The influence of a cyclic loading history on soil-geogrid interaction under pullout condition. Geotext. Geomembr. 2019, 47, 552–565. [Google Scholar] [CrossRef]
- Cardile, G.; Pisano, M.; Moraci, N. A predictive model for pullout bearing resistance of geogrids embedded in a granular soil. In Geotechnical Research for Land Protection and Development, Proceedings of the 7th Edition of the Italian National Congress of Geotechnical Researchers, Lecco, Italy, 3–5 July 2019; Lecture Notes in Civil Engineering; Springer International Publishing: Cham, Switzerland, 2020; Volume 40, pp. 438–445. [Google Scholar] [CrossRef]
- Cardile, G.; Pisano, M.; Recalcati, P.; Moraci, N. A new apparatus for the study of pullout behaviour of soil-geosynthetic interfaces under sustained load over time. Geotext. Geomembr. 2021, 49, 1519–1528. [Google Scholar] [CrossRef]
- Cardile, G.; Pisano, M. Advances in soil reinforcement with geosynthetics: From laboratory tests to design practice. Riv. Ital. Geotech. 2020, 54, 52–82. [Google Scholar] [CrossRef]
- Palmeira, E.M. Soil-geosynthetic interaction: Modelling and analysis. Geotext. Geomembr. 2009, 27, 368–390. [Google Scholar] [CrossRef]
- Pisano, M.; Cardile, G.; Moraci, N. The influence of cyclic loading histories on soil-geogrid interface behaviour under pullout conditions. In Proceedings of the 11th International Conference on Geosynthetics, ICG 2018, Seoul, Republic of Korea, 16–21 September 2018; Volume 4, pp. 2543–2548. [Google Scholar]
- Pisano, M.; Cardile, G.; Moraci, N. Soil-geogrid interface behaviour under cyclic pullout conditions. In Proceedings of the 7th lnternational Conference on Earthquake Geotechnical Engineering, Roma, Italy, 17–20 June 2019; Silvestri, F., Moraci, N., Eds.; Earthquake Geotechnical Engineering for Protection and Development of Environment and Constructions. CRC Press: Boca Raton, FL, USA; London, UK; New York, NY, USA, 2019; pp. 4507–4514. [Google Scholar]
- Wang, Z.; Jacobs, F.; Ziegler, M. Experimental and DEM investigation of geogrid-soil interaction under pullout loads. Geotext. Geomembr. 2016, 44, 230–246. [Google Scholar] [CrossRef]
- Deng, D.-p.; Zhao, L.-h.; Li, L. Limit equilibrium slope stability analysis using the nonlinear strength failure criterion. Can. Geotech. J. 2015, 52, 563–576. [Google Scholar] [CrossRef]
- Yang, X.L.; Yin, J.H. Slope stability analysis with nonlinear failure criterion. J. Eng. Mech. ASCE 2004, 130, 267–273. [Google Scholar] [CrossRef]
- Ingegneri, S.; Biondi, G.; Cascone, E.; Di Filippo, G. Influence of cyclic strength degradation on a Newmark-type analysis. In Proceedings of the 7th lnternational Conference on Earthquake Geotechnical Engineering, Roma, Italy, 17–20 June 2019; Silvestri, F., Moraci, N., Eds.; Earthquake Geotechnical Engineering for Protection and Development of Environment and Constructions. CRC Press: Boca Raton, FL, USA; London, UK; New York, NY, USA, 2019; pp. 2996–3004. [Google Scholar]
- Wilson, R.C.; Keefer, D.K. Dynamic analysis of a slope failure from the 6 August 1979 Coyote Lake, California, earthquake. Bull. Seismol. Soc. Am. 1983, 73, 863–877. [Google Scholar] [CrossRef]
- Pradel, D.; Smith, P.M.; Stewart, J.P.; Raad, G. Case history of landslide movement during the Northridge earthquake. J. Geotech. Geoenviron. Eng. 2005, 131, 1360–1369. [Google Scholar] [CrossRef]
- Yan, L.; Matasovic, N.; Kavazanjian, E., Jr. Seismic response of a block on an inclined plane to vertical and horizontal excitation acting simultaneously. In Proceedings of the 11th ASCE Engineering Mechanics Conference, Fort Lauderdale, FL, USA, 19–22 May 1996; pp. 1110–1113. [Google Scholar]
- Di Filippo, G.; Biondi, G.; Cascone, E. Influence of earthquake-induced pore-water pressure on the seismic stability of cohesive slopes. In Proceedings of the 7th International Conference on Earthquake Geotechnical Engineering, Roma, Italy, 17–20 June 2019; Silvestri, F., Moraci, N., Eds.; Earthquake Geotechnical Engineering for Protection and Development of Environment and Constructions. CRC Press: Boca Raton, FL, USA; London, UK; New York, NY, USA, 2019; pp. 2136–2144. [Google Scholar]
- Shinoda, M. Seismic stability and displacement analyses of earth slopes using non-circular slip surface. Soils Found. 2015, 55, 227–241. [Google Scholar] [CrossRef] [Green Version]
- Lacasse, S.; Nadim, F.; Liu, Z.Q.; Eidsvig, U.K.; Le, T.M.H.; Lin, C.G. Risk assessment and dams—Recent developments and applications. In Proceedings of the XVII European Conference on Soil Mechanics and Geotechnical Engineering, Reykjavík, Iceland, 1–6 September 2019; Sigursteinsson, H., Erlingsson, S., Bessason, B., Eds.; Geotechnical Engineering, Foundation of the Future. The Icelandic Geotechnical Society: Reykjavík, Iceland, 2019. [Google Scholar]
- CEN EN 1997-1; Eurocode 7—Geotechnical Design. European Committee for Standardization: Brussels, Belgium, 2004.
- CEN EN 1990; Eurocode—Basis of Structural Design. European Committee for Standardization: Brussels, Belgium, 2002.
- Reubens, B.; Poesen, J.; Danjon, F.; Geudens, G.; Muys, B. The role of fine and coarse roots in shallow slope stability and soil erosion control with a focus on root system architecture: A review. Trees 2007, 21, 385–402. [Google Scholar] [CrossRef]
- Wang, X.; Ma, C.; Wang, Y.; Wang, Y.; Li, T.; Dai, Z.; Li, M. Effect of root architecture on rainfall threshold for slope stability: Variabilities in saturated hydraulic conductivity and strength of root-soil composite. Landslides 2020, 17, 1965–1977. [Google Scholar] [CrossRef]
- Fishman, G.S. Monte Carlo: Concepts, Algorithms, and Applications; Springer: New York, NY, USA, 1996; 698p. [Google Scholar]
- Hammersley, J.M.; Handscomb, D.C. Monte Carlo Methods; Methuen & Co.: London, UK; John Wiley & Sons: New York, NY, USA, 1964; 178p. [Google Scholar]
- Rubinstein, R.Y.; Kroese, D.P. Simulation and the Monte Carlo Method; Wiley-Interscience: New York, NY, USA, 2007; 345p. [Google Scholar]
- Waldron, L.J. The shear resistance of root-permeated homogeneous and stratified soil. Soil Sci. Soc. Am. J. 1977, 41, 843–849. [Google Scholar] [CrossRef]
- Wu, T.H. Investigation of Landslides on Prince of Wales Island, Alaska; Geotechnical Engineering Report 5; Department of Civil Engineering, Ohio State University: Columbia, OH, USA, 1976; 106p. [Google Scholar]
- Eab, K.H.; Likitlersuang, S.; Takahashi, A. Laboratory and modelling investigation of root-reinforced system for slope stabilisation. Soils Found. 2015, 55, 1270–1281. [Google Scholar] [CrossRef] [Green Version]
- Docker, B.B.; Hubble, T.C.T. Quantifying root-reinforcement of river bank soils by four Australian tree species. Geomorphology 2008, 100, 401–418. [Google Scholar] [CrossRef]
- Giadrossich, F.; Schwarz, M.; Cohen, D.; Cislaghi, A.; Vergani, C.; Hubble, T.; Phillips, C.; Stokes, A. Methods to measure the mechanical behaviour of tree roots: A review. Ecol. Eng. 2017, 109, 256–271. [Google Scholar] [CrossRef]
- Karimzadeh, A.A.; Leung, A.K.; Hosseinpour, S.; Wu, Z.; Amini, P.F. Monotonic and cyclic behaviour of root-reinforced sand. Can. Geotech. J. 2021, 58, 1915–1927. [Google Scholar] [CrossRef]
- Lan, H.; Wang, D.; He, S.; Fang, Y.; Chen, W.; Zhao, P.; Qi, Y. Experimental study on the effects of tree planting on slope stability. Landslides 2020, 17, 1021–1035. [Google Scholar] [CrossRef]
- Liang, T.; Knappett, J.A.; Duckett, N. Modelling the seismic performance of rooted slopes from individual root–soil interaction to global slope behaviour. Géotechnique 2015, 65, 995–1009. [Google Scholar] [CrossRef] [Green Version]
- Meijer, G.J.; Bengough, G.; Knappett, J.; Loades, K.; Nicoll, B. In situ root identification through blade penetrometer testing—Part 2: Field testing. Géotechnique 2018, 68, 320–331. [Google Scholar] [CrossRef]
- Pallewattha, M.; Indraratna, B.; Heitor, A.; Rujikiatkamjorn, C. Shear strength of a vegetated soil incorporating both root reinforcement and suction. Transp. Geotech. 2019, 18, 72–82. [Google Scholar] [CrossRef]
- Pollen, N.; Simon, A. Estimating the mechanical effects of riparian vegetation on stream bank stability using a fiber bundle model. Water Resour. Res. 2005, 41, W07025. [Google Scholar] [CrossRef]
- Cohen, D.; Schwarz, M.; Or, D. An analytical fiber bundle model for pullout mechanics of root bundles. J. Geophys. Res. Earth Surf. 2011, 116, F03010. [Google Scholar] [CrossRef] [Green Version]
- Liang, T.; Knappett, J.A.; Leung, A.; Carnaghan, A.; Bengough, A.G.; Zhao, R. A critical evaluation of predictive models for rooted soil strength with application to predicting the seismic deformation of rooted slopes. Landslides 2020, 17, 93–109. [Google Scholar] [CrossRef] [Green Version]
- Mao, Z. Root reinforcement models: Classification, criticism and perspectives. Plant Soil 2022, 472, 17–28. [Google Scholar] [CrossRef]
- Murgia, I.; Giadrossich, F.; Mao, Z.; Cohen, D.; Capra, G.F.; Schwarz, M. Modeling shallow landslides and root reinforcement: A review. Ecol. Eng. 2022, 181, 106671. [Google Scholar] [CrossRef]
- Schwarz, M.; Cohen, D.; Or, D. Root-soil mechanical interactions during pullout and failure of root bundles. J. Geophys. Res. Earth Surf. 2010, 115, F04035. [Google Scholar] [CrossRef] [Green Version]
- Van Beek, L.P.H.; Wint, J.; Cammeraat, L.H.; Edwards, J.P. Observation and simulation of root reinforcement on abandoned mediterranean slopes. Plant Soil 2005, 278, 55–74. [Google Scholar] [CrossRef]
- Mickovski, S.B.; Stokes, A.; van Beek, R.; Ghestem, M.; Fourcaud, T. Simulation of direct shear tests on rooted and non-rooted soil using finite element analysis. Ecol. Eng. 2011, 37, 1523–1532. [Google Scholar] [CrossRef]
- Schmidt, K.M.; Roering, J.J.; Stock, J.D.; Dietrich, W.E.; Montgomery, D.R.; Schaub, T. The variability of root cohesion as an influence on shallow landslide susceptibility in the Oregon Coast Range. Can. Geotech. J. 2001, 38, 995–1024. [Google Scholar] [CrossRef]
- Thomas, R.E.; Pollen-Bankhead, N. Modeling root reinforcement with a fiber-bundle model and Monte Carlo simulation. Ecol. Eng. 2010, 36, 47–61. [Google Scholar] [CrossRef]
- Gray, D.H.; Sotir, R.B. Biotechnical and Soil Bioengineering Slope Stabilization: A Practical Guide for Erosion Control; John Wiley & Sons: New York, NY, USA, 1996; 400p. [Google Scholar]
- Wu, T.H. Slope Stabilization. In Slope Stabilization and Erosion Control—A Bioengineering Approach; Morgan, R.P.C., Rickson, R.J., Eds.; Chapman and Hall, University Press: Cambridge, UK, 1995; pp. 221–264. [Google Scholar]
- Vergani, C.; Chiaradia, E.A.; Bischetti, G.B. Variability in the tensile resistance of roots in Alpine forest tree species. Ecol. Eng. 2012, 46, 43–56. [Google Scholar] [CrossRef]
- Bischetti, G.B.; Chiaradia, E.A.; Simonato, T.; Speziali, B.; Vitali, B.; Vullo, P.; Zocco, A. Root strength and root area ratio of forest species in Lombardy (Northern Italy). Plant Soil 2005, 278, 11–22. [Google Scholar] [CrossRef]
- Cislaghi, A. Exploring the variability in elastic properties of roots in alpine tree species. J. For. Sci. 2021, 67, 338–356. [Google Scholar] [CrossRef]
- Leung, F.T.Y.; Yan, W.M.; Hau, B.C.H.; Tham, L.G. Root systems of native shrubs and trees in Hong Kong and their effects on enhancing slope stability. CATENA 2015, 125, 102–110. [Google Scholar] [CrossRef]
- Likitlersuang, S.; Phan, T.N.; Boldrin, D.; Leung, A.K. Influence of growth media on the biomechanical properties of the fibrous roots of two contrasting vetiver grass species. Ecol. Eng. 2022, 178, 106574. [Google Scholar] [CrossRef]
- Zhang, C.-B.; Chen, L.-H.; Jiang, J. Why fine tree roots are stronger than thicker roots: The role of cellulose and lignin in relation to slope stability. Geomorphology 2014, 206, 196–202. [Google Scholar] [CrossRef]
- Phoon, K.K.; Kulhawy, F.H. Characterization of geotechnical variability. Can. Geotech. J. 1999, 36, 612–624. [Google Scholar] [CrossRef]
- Lacasse, S.; Nadim, F. Uncertainties in characterising soil properties. In Uncertainty in the Geologic Environment: From Theory to Practice; Shackelford, C.D., Nelson, P.P., Roth, M.J.S., Eds.; ASCE GSP 58; American Society of Civil Engineers: Reston, VA, USA, 1996; pp. 49–75. [Google Scholar]
- Ji, J.; Kokutse, N.; Genet, M.; Fourcaud, T.; Zhang, Z. Effect of spatial variation of tree root characteristics on slope stability. A case study on Black Locust (Robinia pseudoacacia) and Arborvitae (Platycladus orientalis) stands on the Loess Plateau, China. CATENA 2012, 92, 139–154. [Google Scholar] [CrossRef]
- Cislaghi, A.; Chiaradia, E.A.; Bischetti, G.B. Including root reinforcement variability in a probabilistic 3-D stability model. Earth Surf. Process. Landf. 2017, 42, 1789–1806. [Google Scholar] [CrossRef]
- Nguyen, T.S.; Likitlersuang, S.; Jotisankasa, A. Influence of the spatial variability of the root cohesion on a slope-scale stability model: A case study of residual soil slope in Thailand. Bull. Eng. Geol. Environ. 2019, 78, 3337–3351. [Google Scholar] [CrossRef]
- Zhu, H.; Zhang, L.M.; Xiao, T.; Li, X.Y. Enhancement of slope stability by vegetation considering uncertainties in root distribution. Comput. Geotech. 2017, 85, 84–89. [Google Scholar] [CrossRef]
- Lacasse, S. Reliability and probabilistic methods. In Proceedings of the 13th International Conference on Soil Mechanics and Foundation Engineering, New Delhi, India, 5–10 January 1994; pp. 225–227. [Google Scholar]
- Cho, S.E. Probabilistic assessment of slope stability that considers the spatial variability of soil properties. J. Geotech. Geoenviron. Eng. ASCE 2010, 136, 975–984. [Google Scholar] [CrossRef]
- Chowdhury, R.N.; Xu, D.W. Geotechnical system reliability of slopes. Reliab. Eng. Syst. Saf. 1995, 47, 141–151. [Google Scholar] [CrossRef]
- Christian, J.T.; Ladd, C.C.; Baecher, G.B. Reliability applied to slope stability analysis. J. Geotech. Eng. 1994, 120, 2180–2207. [Google Scholar] [CrossRef]
- Griffiths, D.V.; Huang, J.; Fenton, G.A. Influence of spatial variability on slope reliability using 2-D random fields. J. Geotech. Geoenviron. Eng. ASCE 2009, 135, 1367–1378. [Google Scholar] [CrossRef] [Green Version]
- Huang, H.W.; Wen, S.C.; Zhang, J.; Chen, F.Y.; Martin, J.R.; Wang, H. Reliability analysis of slope stability under seismic condition during a given exposure time. Landslides 2018, 15, 2303–2313. [Google Scholar] [CrossRef]
- McGuire, M.P.; Vandenberge, D.R. Interpretation of shear strength uncertainty and reliability analyses of slopes. Landslides 2017, 14, 2059–2072. [Google Scholar] [CrossRef]
- Bovolenta, R.; Mazzuoli, M.; Berardi, R. Soil bio-engineering techniques to protect slopes and prevent shallow landslides. Riv. Ital. Geotech. 2018, 3, 44–65. [Google Scholar]
- Canadell, J.; Jackson, R.B.; Ehleringer, J.B.; Mooney, H.A.; Sala, O.E.; Schulze, E.-D. Maximum rooting depth of vegetation types at the global scale. Oecologia 1996, 108, 583–595. [Google Scholar] [CrossRef] [PubMed]
- Foresta, V.; Capobianco, V.; Cascini, L. Influence of grass roots on shear strength of pyroclastic soils. Can. Geotech. J. 2020, 57, 1320–1334. [Google Scholar] [CrossRef] [Green Version]
- Bordoni, M.; Cislaghi, A.; Vercesi, A.; Bischetti, G.B.; Meisina, C. Effects of plant roots on soil shear strength and shallow landslide proneness in an area of northern Italian Apennines. Bull. Eng. Geol. Environ. 2020, 79, 3361–3381. [Google Scholar] [CrossRef]
- Tron, S.; Dani, A.; Laio, F.; Preti, F.; Ridolfi, L. Mean root depth estimation at landslide slopes. Ecol. Eng. 2014, 69, 118–125. [Google Scholar] [CrossRef]
- Bishop, A.W. The use of the slip circle in the stability analysis of slope. Géotechnique 1955, 5, 7–17. [Google Scholar] [CrossRef]
- Zhang, Y.; Zhang, J.; Chen, G.; Zheng, L.; Li, Y. Effects of vertical seismic force on initiation of the Daguangbao landslide induced by the 2008 Wenchuan earthquake. Soil Dyn. Earthq. Eng. 2015, 73, 91–102. [Google Scholar] [CrossRef]
- Bischetti, G.B.; De Cesare, G.; Mickovski, S.B.; Rauch, H.P.; Schwarz, M.; Stangl, R. Design and temporal issues in Soil Bioengineering structures for the stabilisation of shallow soil movements. Ecol. Eng. 2021, 169, 106309. [Google Scholar] [CrossRef]
- Harr, M.E. Reliability-Based Design in Design in Civil Engineering; McGraw-Hill: New York, NY, USA, 1987; 400p. [Google Scholar]
- Kulhawy, F.H. On the evaluation of static soil properties. Stability and Performance of Slopes and Embankments. ASCE Geotech. Spec. Publ. 1992, 31, 95–115. [Google Scholar]
- Lee, I.K.; Ingles, O.G.; White, W. Geotechnical Engineering; Pitman Publishing: London, UK, 1983; 508p. [Google Scholar]
- Phoon, K.K.; Kulhawy, F.H.; Grigoriu, M.D. Reliability-Based Design of Foundations for Transmission Line Structures; Electric Power Research Institute: Palo Alto, CA, USA, 1995; 384p. [Google Scholar]
- Javankhoshdel, S.; Bathurst, R.J. Influence of cross correlation between soil parameters on probability of failure of simple cohesive and c–ϕ slopes. Can. Geotech. J. 2015, 53, 839–853. [Google Scholar] [CrossRef]
- Wolff, T. Analysis and Design of Embankment Dam Slopes: A Probabilistic Approach (Soil Mechanics, Indiana). Ph.D. Thesis, Purdue University, Lafayette, IN, USA, 1986. [Google Scholar]
- Wu, X.Z. Trivariate analysis of soil ranking-correlated characteristics and its application to probabilistic stability assessments in geotechnical engineering problems. Soils Found. 2013, 53, 540–556. [Google Scholar] [CrossRef] [Green Version]
- Huang, L.; Dong, B.-C.; Xue, W.; Peng, Y.-K.; Zhang, M.-X.; Yu, F.-H. Soil particle heterogeneity affects the growth of a rhizomatous wetland plant. PLoS ONE 2013, 8, e69836. [Google Scholar] [CrossRef] [Green Version]
- Li, Z.Q.; Kong, L.Y.; Yang, L.F.; Zhang, M.; Cao, T.; Xu, J.; Wang, Z.X.; Lei, Y. Effect of substrate grain size on the growth and morphology of the submersed macrophyte Vallisneria natans L. Limnologica 2012, 42, 81–85. [Google Scholar] [CrossRef]
- Roscoe, R.; Buurman, P.; Velthorst, E.; Vasconcellos, C.A. Soil organic matter dynamics in density and particle-size fractions as revealed by the 13C/12C isotopic ratio in a Cerrado’s oxisol. Geoderma 2001, 104, 185–202. [Google Scholar] [CrossRef]
- Tsompanakis, Y.; Lagaros, N.D.; Psarropoulos, P.N.; Georgopoulos, E.C. Probabilistic seismic slope stability assessment of geostructures. Struct. Infrastruct. Eng. 2010, 6, 179–191. [Google Scholar] [CrossRef]
Figure 1.
Soil–root interaction model (modified from [73]).
Figure 1.
Soil–root interaction model (modified from [73]).

Figure 2.
Schematic diagram of the slope geometry investigated in the research.

Figure 3.
Factor of safety trend for ϕk′ = 31.4° and seismic case C.

Figure 4.
Reliability trend for varying Δτ and COV(Δτ), for ϕk′ = 31.4° and seismic case C.

Figure 5.
β-FS curves for varying Δτ and hr, for ϕk′ = 31.4°, COV(Δτ) = 20% and seismic case C.

Figure 6.
β-FS curves for varying Δτ and COV(Δτ), for ϕk′ = 31.4°, hr = 2 m and seismic case C.

Figure 7.
β-FS curves for varying Δτ and seismic input, for ϕk′ = 31.4° and COV(Δτ) = 20%, in case of hr = 2 m (a) and hr = 1 m (b), respectively.
Figure 7.
β-FS curves for varying Δτ and seismic input, for ϕk′ = 31.4° and COV(Δτ) = 20%, in case of hr = 2 m (a) and hr = 1 m (b), respectively.

Figure 8.
β-FS curves for varying Δτ and α-ϕk′ combinations, for seismic case C and COV(Δτ) = 20%, in case of hr = 2 m (a) and hr = 1 m (b), respectively.
Figure 8.
β-FS curves for varying Δτ and α-ϕk′ combinations, for seismic case C and COV(Δτ) = 20%, in case of hr = 2 m (a) and hr = 1 m (b), respectively.

Figure 9.
β values normalised with respect to the threshold for varying Δτ and ϕk′, for seismic case C and COV(Δτ) = 20%, in case of hr = 2 m (a) and hr = 1 m (b), respectively.
Figure 9.
β values normalised with respect to the threshold for varying Δτ and ϕk′, for seismic case C and COV(Δτ) = 20%, in case of hr = 2 m (a) and hr = 1 m (b), respectively.

Figure 10.
Iso-reliability index curves for varying Δτ and hr, for seismic case C and COV(Δτ) = 20%, in case of ϕk′ = 26.8° (a), ϕk′ = 31.4° (b), and ϕk′ = 35.8° (c), respectively.
Figure 10.
Iso-reliability index curves for varying Δτ and hr, for seismic case C and COV(Δτ) = 20%, in case of ϕk′ = 26.8° (a), ϕk′ = 31.4° (b), and ϕk′ = 35.8° (c), respectively.


Table 1.
Definition of consequences classes (modified from [49]).
Table 1.
Definition of consequences classes (modified from [49]).
| Consequences Class | Description | |
|---|---|---|
| Loss of Human Life | Economic, Social, or Environmental Consequences | |
| CC3 | High | Very great |
| CC2 | Medium | Considerable |
| CC1 | Low | Small or negligible |
Table 2.
Recommended minimum values for reliability index in the case of ultimate limit state [49].
Table 2.
Recommended minimum values for reliability index in the case of ultimate limit state [49].
| Reliability Class | Minimum Values for β | |
|---|---|---|
| 1 Year Reference Period | 50 Years Reference Period | |
| RC3 | 5.2 | 4.3 |
| RC2 | 4.7 | 3.8 |
| RC1 | 4.2 | 3.3 |
Table 3.
Root-reinforced slopes’ characteristics.
| SLOPE | Parameter | Value |
|---|---|---|
| H (m) | slope height | 10 |
| α (°) | angle of inclination to the horizontal | 22, 26, 30 |
| ϕk′ (°) | characteristic value of soil shear strength angle | 26.8, 31.4, 35.8 |
| ck′ (kPa) | characteristic value of soil cohesion | 0 |
| γk (°kN/m3) | characteristic value of soil unit weight | 18.5 |
| ROOT | Parameter | Value |
| hr (m) | average root depth | 0, 0.5, 1, 1.5, 2 |
| Δτk (kPa) | characteristic value of root contribution to shear strength | 0, 5, 10, 15, 20, 30, 40 |
Table 4.
Statistics used in this research.
| SLOPE | Mean Value | COV (%) | Distribution Type |
|---|---|---|---|
| SI* = 1 α = 22° | ϕm′ = 30.28° | 7 | normal |
| γm = 17.09 kN/m3 | 5 | normal | |
| SI* = 1 α = 26° | ϕm′ = 35.45° | 7 | normal |
| γm = 17.09 kN/m3 | 5 | normal | |
| SI* = 1 α = 30° | ϕm′ = 40.48° | 7 | normal |
| γm = 17.09 kN/m3 | 5 | normal | |
| ROOT | Mean value Δ τm [kPa] | COV (%) | Distribution type |
| 7.06 | 20 | lognormal | |
| Δτk = 5 kPa | 10.15 | 40 | lognormal |
| 14.52 | 60 | lognormal | |
| 14.13 | 20 | lognormal | |
| Δτk = 10 kPa | 20.30 | 40 | lognormal |
| 29.04 | 60 | lognormal | |
| 21.19 | 20 | lognormal | |
| Δτk = 15 kPa | 30.45 | 40 | lognormal |
| 43.56 | 60 | lognormal | |
| 28.25 | 20 | lognormal | |
| Δτk = 20 kPa | 40.60 | 40 | lognormal |
| 58.07 | 60 | lognormal | |
| 42.37 | 20 | lognormal | |
| Δτk = 30 kPa | 60.90 | 40 | lognormal |
| 87.10 | 60 | lognormal | |
| 56.50 | 20 | lognormal | |
| Δτk = 40 kPa | 81.18 | 40 | lognormal |
| 116.14 | 60 | lognormal |
Table 5.
Statistical values for the seismic coefficients.
| Case | Mean Value (-) | COV (%) | Distribution Type |
|---|---|---|---|
| A | kh = 0 | - | - |
| kv = 0 | - | - | |
| B | kh = 0.05 | 10 | lognormal |
| kv = +0.5 kh | 10 | lognormal | |
| C | kh = 0.10 | 10 | lognormal |
| kv = +0.5 kh | 10 | lognormal |
Disclaimer/Publisher’s Note: The statements, opinions and data contained in all publications are solely those of the individual author(s) and contributor(s) and not of MDPI and/or the editor(s). MDPI and/or the editor(s) disclaim responsibility for any injury to people or property resulting from any ideas, methods, instructions or products referred to in the content. |
© 2023 by the authors. Licensee MDPI, Basel, Switzerland. This article is an open access article distributed under the terms and conditions of the Creative Commons Attribution (CC BY) license (https://creativecommons.org/licenses/by/4.0/).
Share and Cite
MDPI and ACS Style
Pisano, M.; Cardile, G. Probabilistic Analyses of Root-Reinforced Slopes Using Monte Carlo Simulation. Geosciences 2023, 13, 75. https://doi.org/10.3390/geosciences13030075
AMA Style
Pisano M, Cardile G. Probabilistic Analyses of Root-Reinforced Slopes Using Monte Carlo Simulation. Geosciences. 2023; 13(3):75. https://doi.org/10.3390/geosciences13030075
Chicago/Turabian StylePisano, Marilene, and Giuseppe Cardile. 2023. "Probabilistic Analyses of Root-Reinforced Slopes Using Monte Carlo Simulation" Geosciences 13, no. 3: 75. https://doi.org/10.3390/geosciences13030075
Note that from the first issue of 2016, this journal uses article numbers instead of page numbers. See further details here.