1. Introduction
Hydrological models are distilled representations of real-world systems that estimate different components of the water cycle and water balance. They help decision-makers make informed choices for the planning and operation of water resources while considering the interconnections between physical, ecological, economic, and social components within a real-world system. Traditional hydrological models involve transforming rainfall observations into runoff/streamflow and Evapo-Transpiration (ET) estimates, upon considering catchment characteristics, including morphological features of river networks. The process usually involves complex calibration approaches of discharge and ET measurements for determining the weights of inherent catchment processes. Several types of hydrological models [
1] varying in complexity exist for determining discharge; however, they cannot be used as-is in the case of flood management scenarios. This is because the discharge measurements need to be fed into hydrodynamic models, which then calculate the inundation height for every pixel/grid of interest within the catchment. The inundation units can be classified into a vector and raster-based units of inundation. The hydrodynamic models can also be categorised into 1D, 2D, and 3D flow models, with increasing computational costs in that order. Combining hydrological and hydrodynamic models, such as SWAT and LISFLOOD-FP [
2], respectively, in operational situations due to their requirements for detailed information of the river system and resulting computational costs is thus impractical for continuous modelling of flood inundation extents. Generally, design rainfall-runoff events are pre-processed, based on which the hydrodynamic models evaluate the inundation extents for designing and evaluating flood disaster recovery [
3]. Such event-based or library lookup scenarios do not include the effects of antecedent climate and catchment characteristics or geomorphological processes, including erosion, which can accentuate the magnitude of design flood extents. Thus, this study focuses on simplifying hydrodynamic approaches without compromising flood extent accuracy. These approaches can complement continuously executing hydrological models without significantly increasing computational costs.
Further complexity in inundation modelling involves the data-scarce nature of river reach geometry. Currently, satellite missions can measure drainage width and length precisely. However, satellite signals cannot penetrate the water surface, and thus we cannot remotely measure the river depth and subsequent profile. Consequently, we depend on field surveys of river bathymetry to estimate the channel-carrying capacity. Several studies have used such river geometry data at point locations across the globe to model contiguous bankfull reach characteristics as a function of discharge [
4,
5,
6,
7]. We note that there is significant uncertainty in the modelled channel shape and the time-varying nature of channel morphology, which can result in divergent estimates of the bankfull carrying capacity of such rivers. Several studies [
8,
9,
10,
11] have analysed the impact of ensemble modelling approaches considering uncertainty in channel bathymetry, shape, and conveyance capacity for hydrodynamic systems implemented for specific sub-basins and catchments. For large-scale operational analysis of inundation extents, we need to deal with insufficient discharge measurements, unreliable drainage morphology, error-prone topographic datasets, uniform rainfall assumptions within catchment boundaries, and computational costs associated with the ensemble-based continuous execution of each of the processes dealing with the same.
Conventional methods to deal with large-scale inundation include generating static flood maps processed for designing flood rainfall events by running computationally complex hydrodynamic models in pre-emptive mode. However, running such models operationally across extensive spatial scales with near real-time data under the above constraints limits the analysis to adopting conceptual inundation modelling approaches. Height Above Nearest Drainage (HAND) is one such static topographic indicator of the inundation potential of a location obtained from the Digital Elevation Model (DEM) [
12]. HAND is a hydrologically consistent indicator of local draining potential compared to other topographic indicators, including the Topographic Wetness Index (TWI) [
13]. HAND value-based thresholding, where raster pixels within a catchment that have HAND values less than the observed gauge level are considered submerged, has been employed to map inundation across different spatial scales. One example is across the entire Amazon basin [
12], subject to the quantity and quality of gauged data. Upon availability of river bathymetry and access to large computational resources, 1D, 2D, and 3D flow routing procedures, including Muskingham–Cunge [
14], mizuRoute [
15], CaMa-Flood [
16], and even Regional Flood Frequency Approach (RFFA)-based methods [
17] can be incorporated to estimate the flow rates needed for rating curve estimation of HAND thresholds.
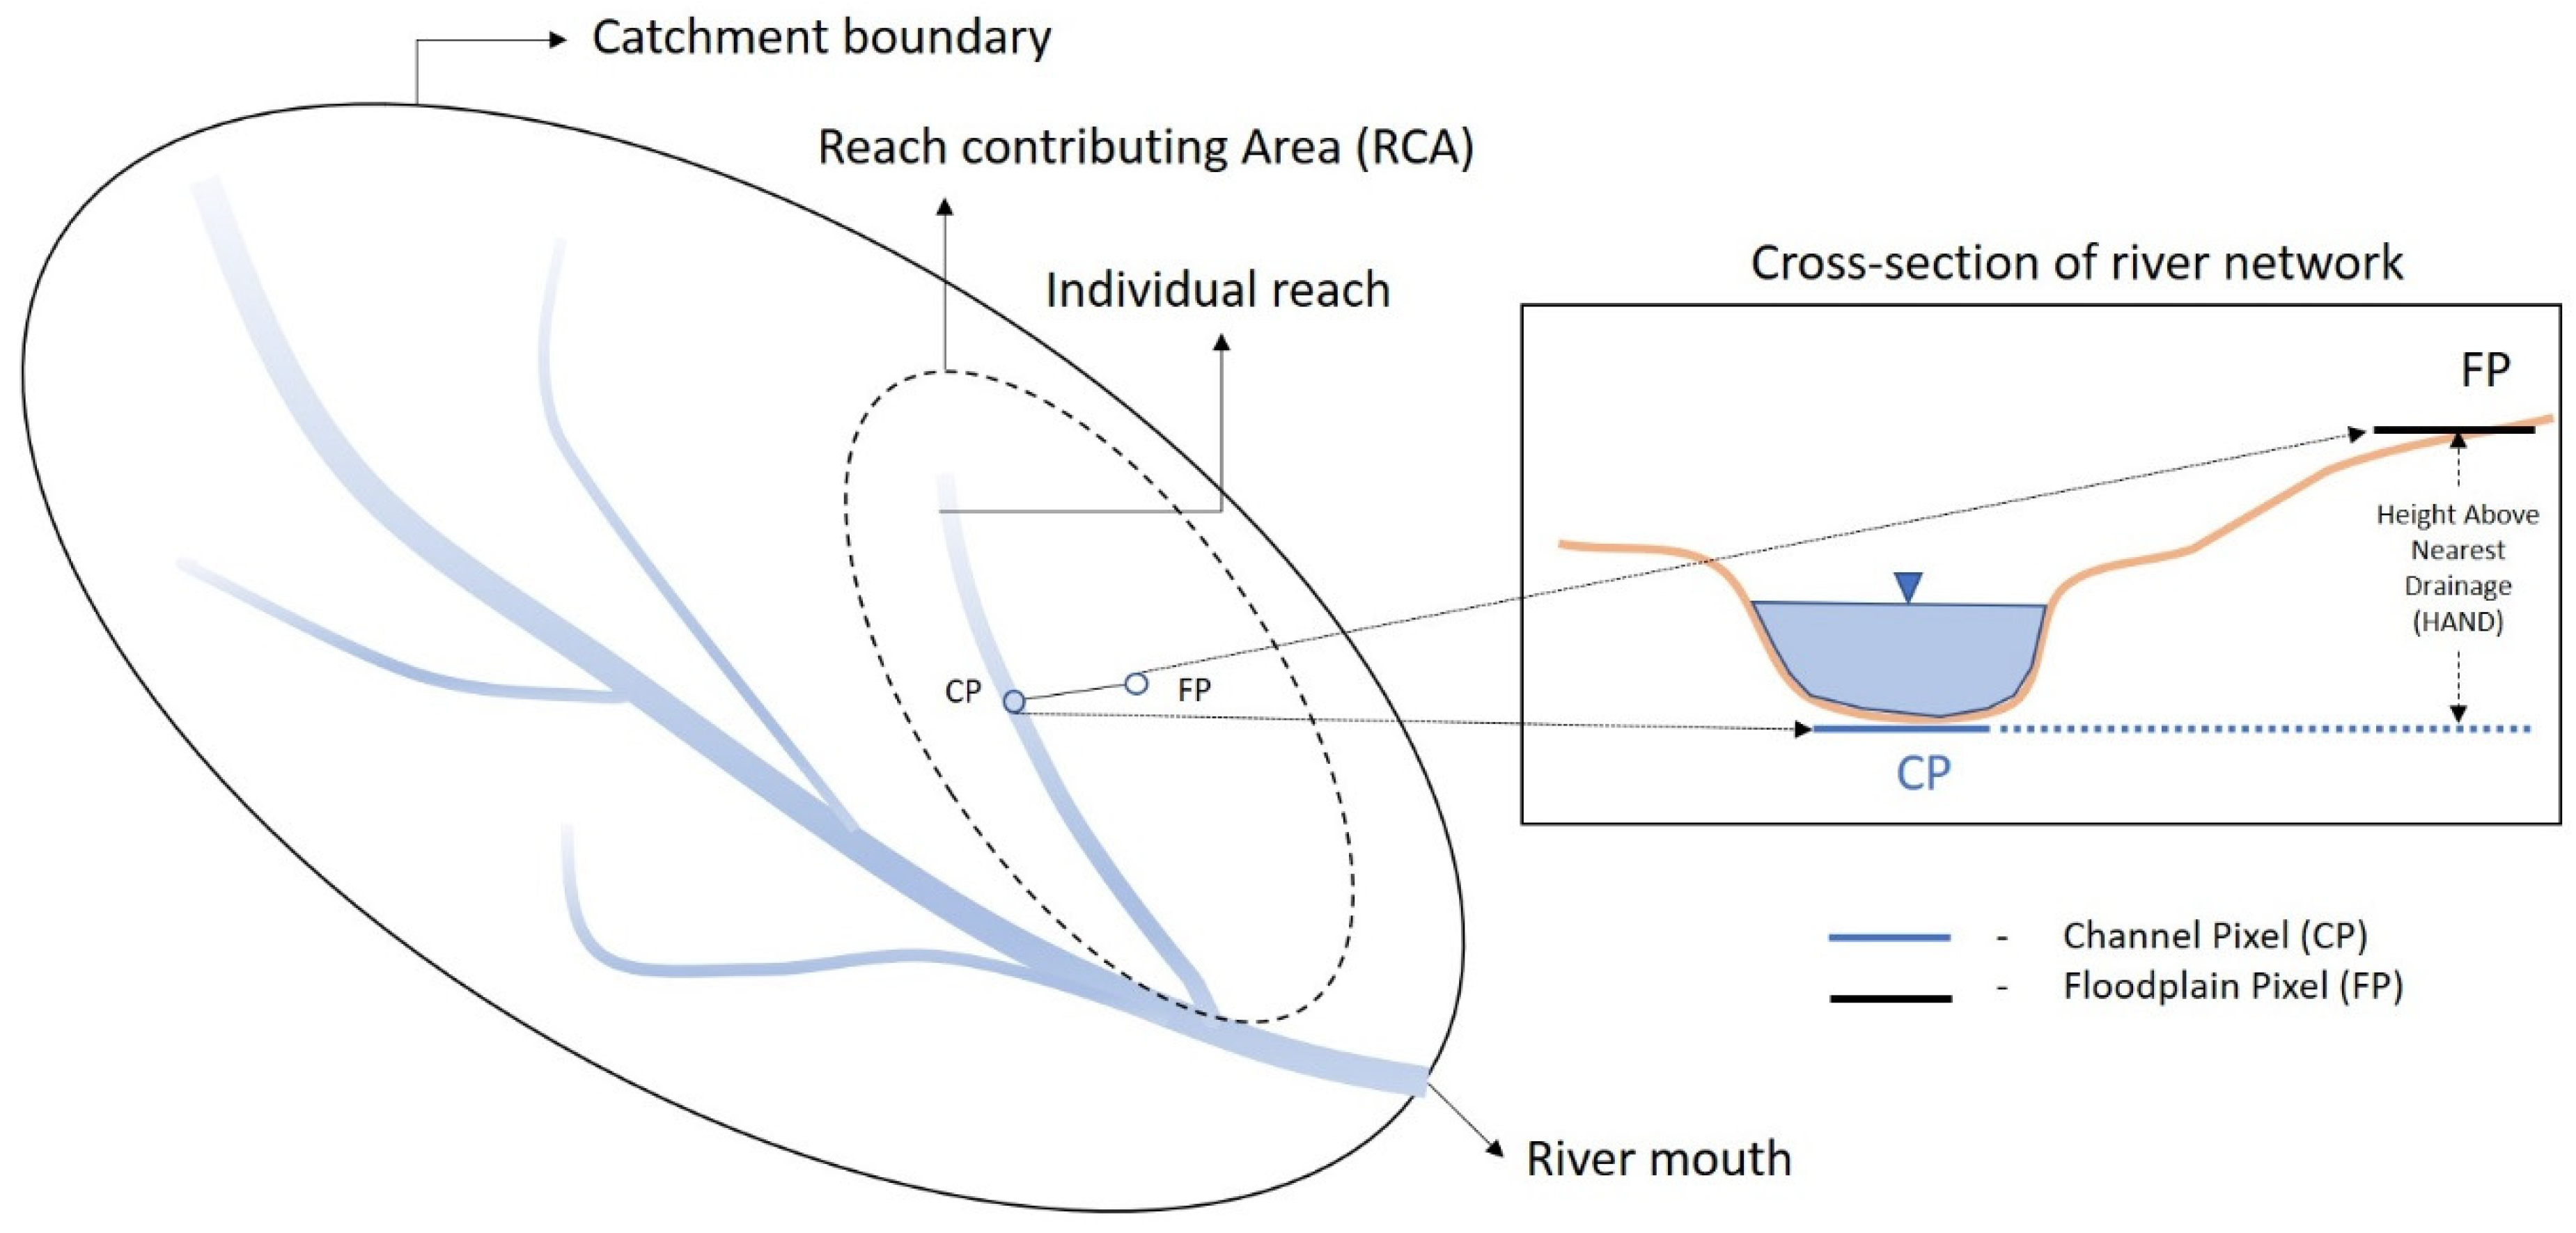
Due to the unavailability of ground-surveyed river geometry data and the need for rapid flood mapping, we consider the Conceptual Flood Routing and HAND-Based Inundation Model (CFRHIM) (Unnithan et al., A novel conceptual flood inundation model for large scale data-scarce regions, submitted to Environmental Modelling and Software, 2022, henceforth referred to as submitted manuscript). CFRHIM has a modular approach that can be coupled with most hydrological models and executed for large time series. It overcomes error-prone topographic information from global access DEM and considers the modelled river bankfull width and depth estimate input. With the paucity of standardised river geometry datasets and the need to achieve improved computational costs across large spatial scales, we rely on the river bathymetry information from [
18] to model the bankfull discharge estimation. CFRHIM models HAND-derived probability inundation extents for each Reach Contributing Area (RCA) (
Figure 1) as a function of synthetic rating curves that incorporate the uncertainty in modelled river geometry datasets.
To better understand the main sources of uncertainty in the CFRHIM modelling framework and in order to improve the overall accuracy of the CFRHIM, we evaluated the sensitivity of HAND-derived inundation extents to:
The product quality of the gridded runoff datasets—AWRA V6 (baseline) and AWRA V7 (better quality),
The quality of the Digital Elevation Model (DEM) datasets—Shuttle Radar Topography Mission (SRTM—not hydrologically conditioned) and Australian Hydrological Geospatial Fabric (GeoFabric—hydrologically conditioned), and
Incorporation of hydrological model processes including:
back-water effects,
modelled Manning’s roughness coefficient, and
precision of HAND intervals derived from synthetic rating curves.
A sensitivity study was performed for the Hawkesbury–Nepean Valley (HNV) catchment in New South Wales (NSW), Australia. Using this case study, we performed a sensitivity analysis to analyse the model uncertainties in mapping flood magnitudes for HNV. Specifically, we examined the nature of fluvial flooding patterns repeatedly observed in HNV and focused on identifying the critical datasets and model processes that control the accuracy of simple conceptual flood inundation extents. This study aimed to ascertain the best CFRHIM configuration, thereby evaluating the applicability of HAND-derived inundation extents to provide downstream applications of operational flood alerts for large-scale data-scarce regions.
2. Methodology
We used gridded runoff from AWRA-L (jointly developed by the Australian Bureau of Meteorology (BoM) and CSIRO) as an input forcing into CFRHIM. In addition, the GeoFabric DEM corrected from the NASA SRTM DEM at 30 m spatial resolution was used to model the HNV catchment topography [
19]. The unique topographic environment of the HNV catchment presents the opportunity to examine the back-water effect (BE) of downstream inundation heights on upstream catchment RCA. The model structure of HAND value-based thresholding to derive inundation extents was subject to different precision intervals to understand the effect of synthetic discharge–flow height relationships developed within each RCA (refer
Figure 1). Furthermore, Manning’s channel roughness coefficient, usually considered a constant value within a basin, was modelled as a function of the slope of the individual reaches [
20]. The modelled roughness values were used to evaluate the probabilistic inundation extents for the 2021 HNV flood event.
2.1. Datasets Used for the March 2021 Flood over Hawkesbury–Nepean
The HNV catchment with an area of 22,000 sq km lies near Western Sydney in NSW in southeast Australia. The catchment is home to over 130,000 inhabitants [
21] and the Wollondilly, Coxs, Grose, Colo, South Creek, and Macdonald tributaries, rich in riparian and mangrove vegetation. The Warragamba Dam is the major dam in the catchment, in addition to Wingecarribee, Avon, Cataract, Cordeaux, and Nepean dams, regulating flow for the water supply of Greater Sydney [
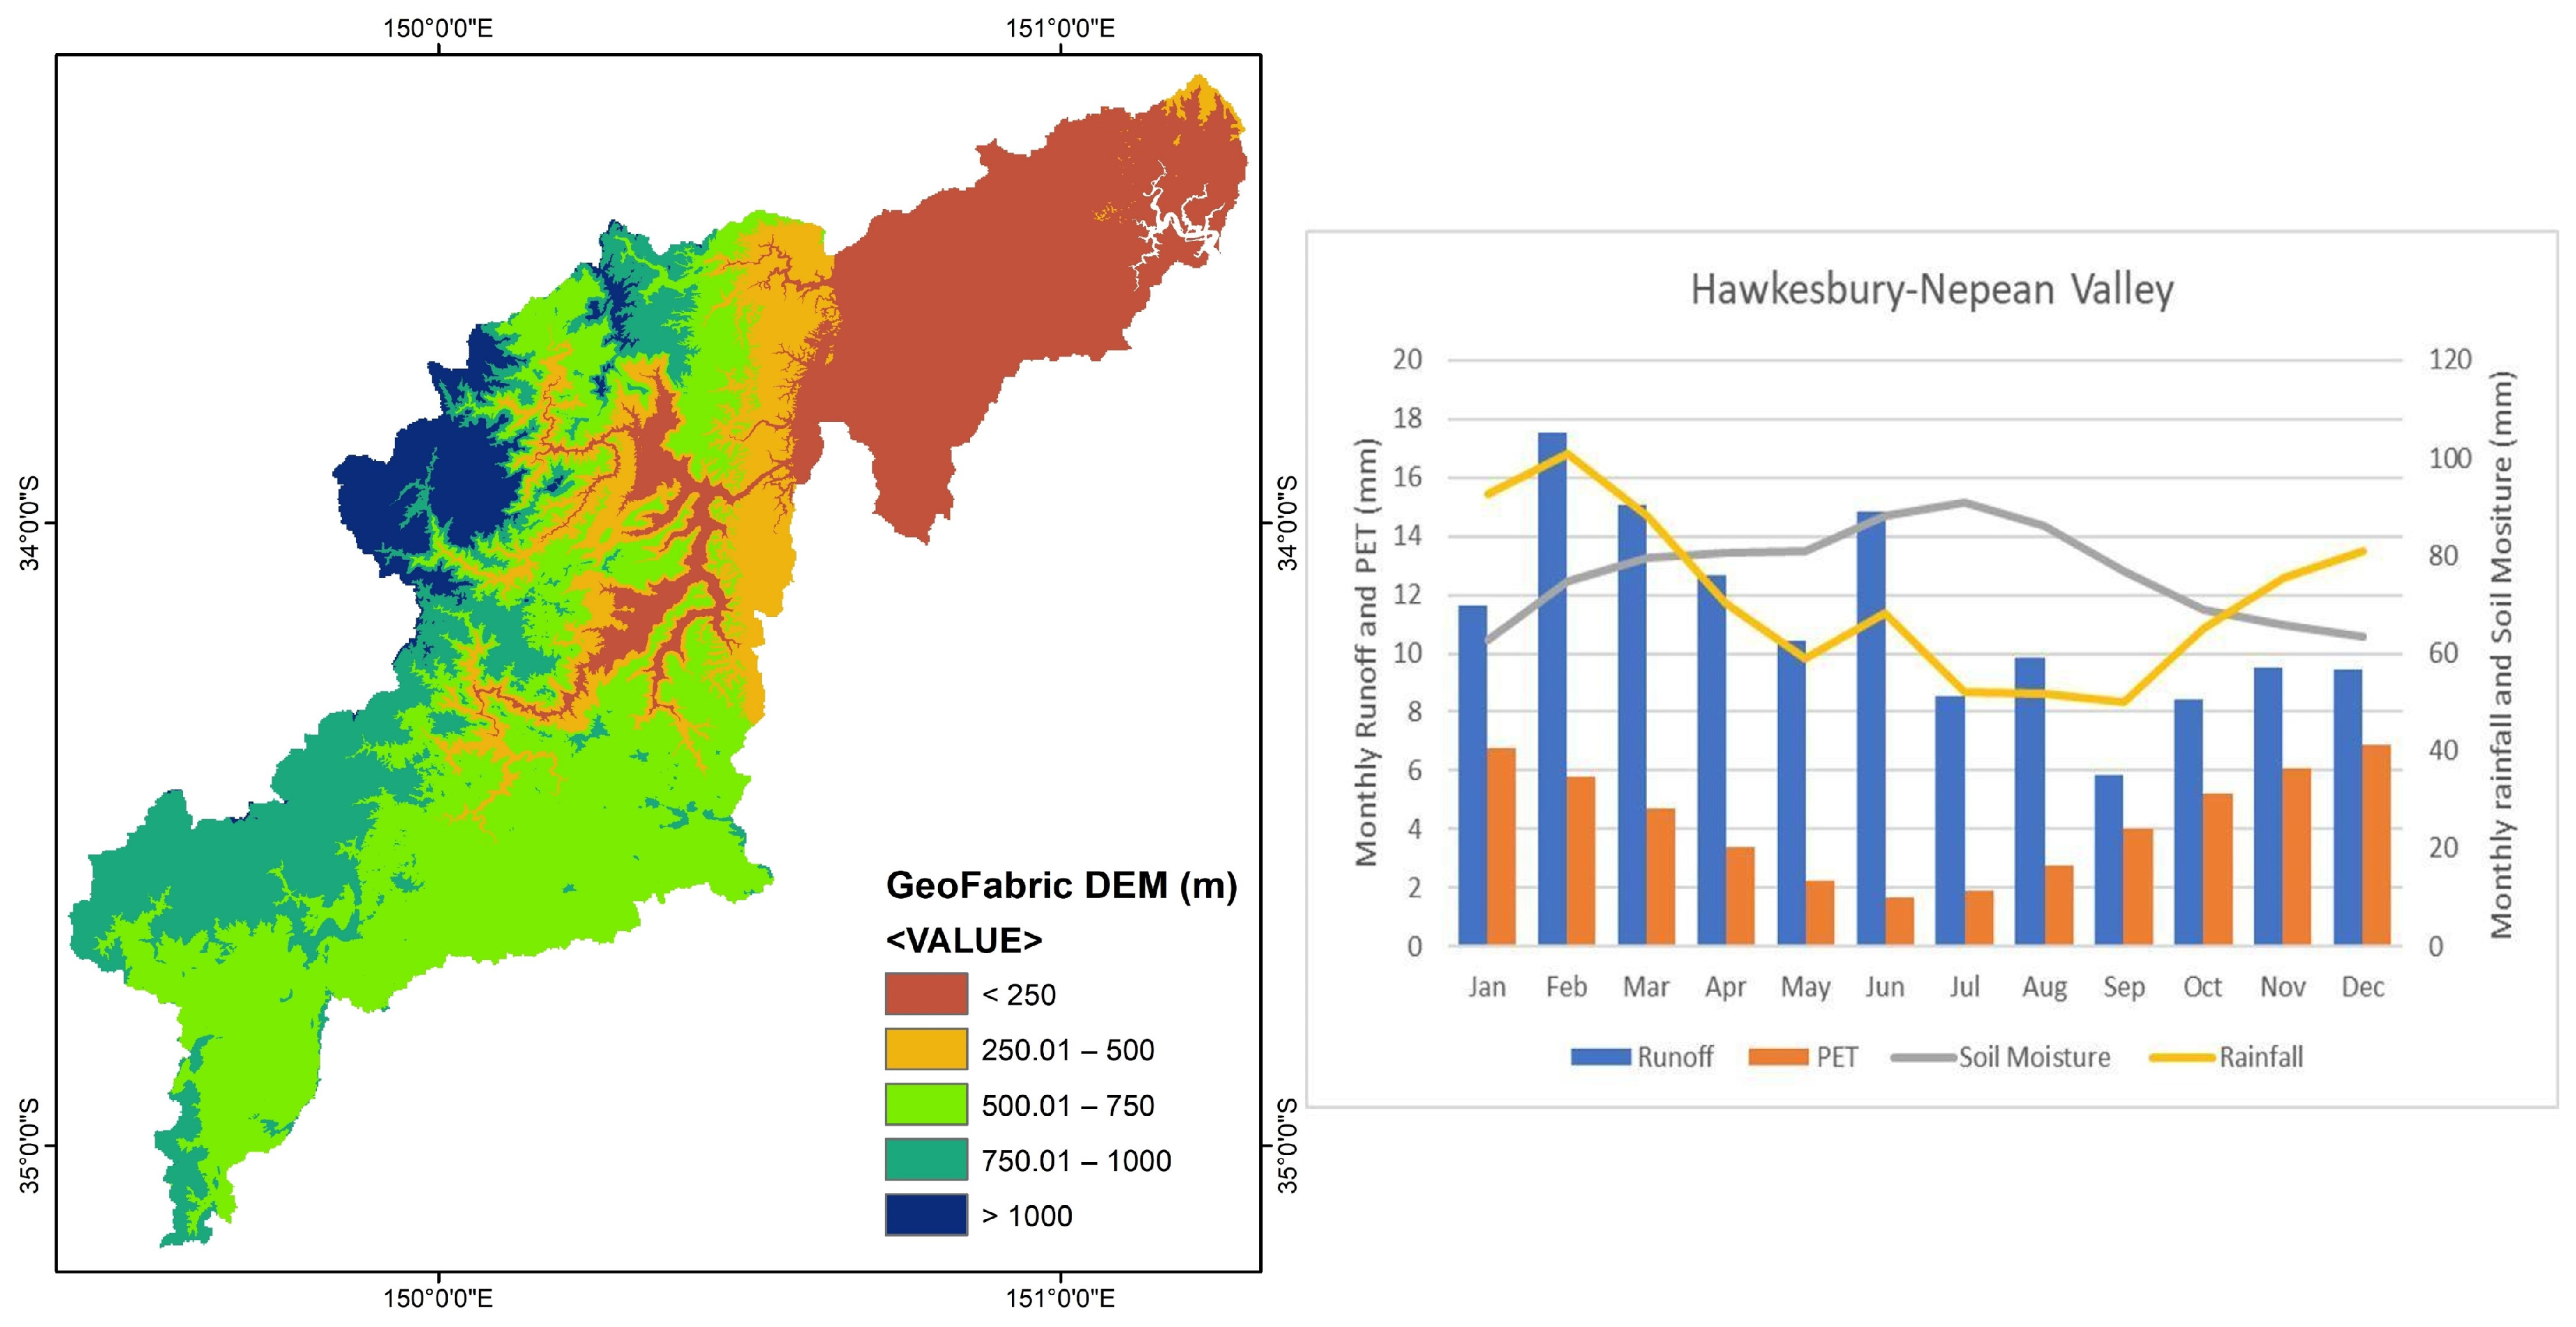
22]. The region has an annual rainfall of 75 cm, with the January to March months over the last 100 years exhibiting high runoff and soil moisture retention capacity (
Figure 2—right panel); however, it witnessed prolonged drought even after the Millennium Drought between 2010 and 2019 before it witnessed a 1 in 5-year flood event in 2020 [
23]. The region again experienced a major 1 in 20-year magnitude flood event from 7–15 March 2021, causing 2 billion AUD in damages with one reported fatality [
24]. We focused on the later flood event because we could readily compare model output with observed flood extents from Copernicus Emergency Management Services (CEMS). CEMS regularly publishes flood extent maps from available EU Sentinel satellite missions for different natural hazards, including flood events, volcanic activity, droughts, and forest fires. The 2021 HNV floods are catalogued as event EMSR504, with flood extent shapefiles publicly available [
25].
The Australian Landscape Water Balance Model, part of the BoM’s operational Australian Water Resources Assessment Landscape (AWRA) modelling system’s 0.05° × 0.05° gridded runoff product, Version 6 (AWRA-V6) and newer Version 7 [
26,
27], are used as input forcing for the CFRHIM inundation model. The inundation performance for model versions V6 and V7 was evaluated as part of the BoM’s mandate for improved runoff estimates [
26], with daily median Kling–Gupta Efficiency (KGE) and Nash–Scutcliffe Efficiency (NSE) upgraded to 0.48/0.50 in case of V7 from 0.43/0.49, respectively, for V6, analysed across 291 sites in Australia. Since flooding is a relatively short-duration phenomenon, improved modelled daily runoff estimates can significantly affect inundation dynamics. More information on version improvement is detailed in the methodology section. The SRTM DEM [
28] and the BoM’s Australian Hydrological Geospatial Fabric (GeoFabric) DEM [
19], both at 30 m spatial resolution, were used to derive the 2021 inundation extents. The GeoFabric DEM is derived from SRTM DEM with a stream network enforced at a scale of 1:25,000. The GeoFabric DEM was used to examine the performance of post-processing of native SRTM DEM to map flooding (
Figure 2—left panel). Furthermore, the GeoFabric DEM is better resolved than the SRTM DEM, to the order of 0.001 m compared to the 1 m interval of SRTM. A step-based topography characterises the HNV catchment, as evidenced by GeoFabric DEM in
Figure 2, with steep upstream channels followed by the floodplain in the Richmond–Windsor regions, with subsequent higher slopes further downstream. The catchment’s stepped nature indicates the back-water effect’s influence on inundation extents, which is explained in the following section.
2.2. Sensitivity Analysis of HAND-Based Inundation Extents
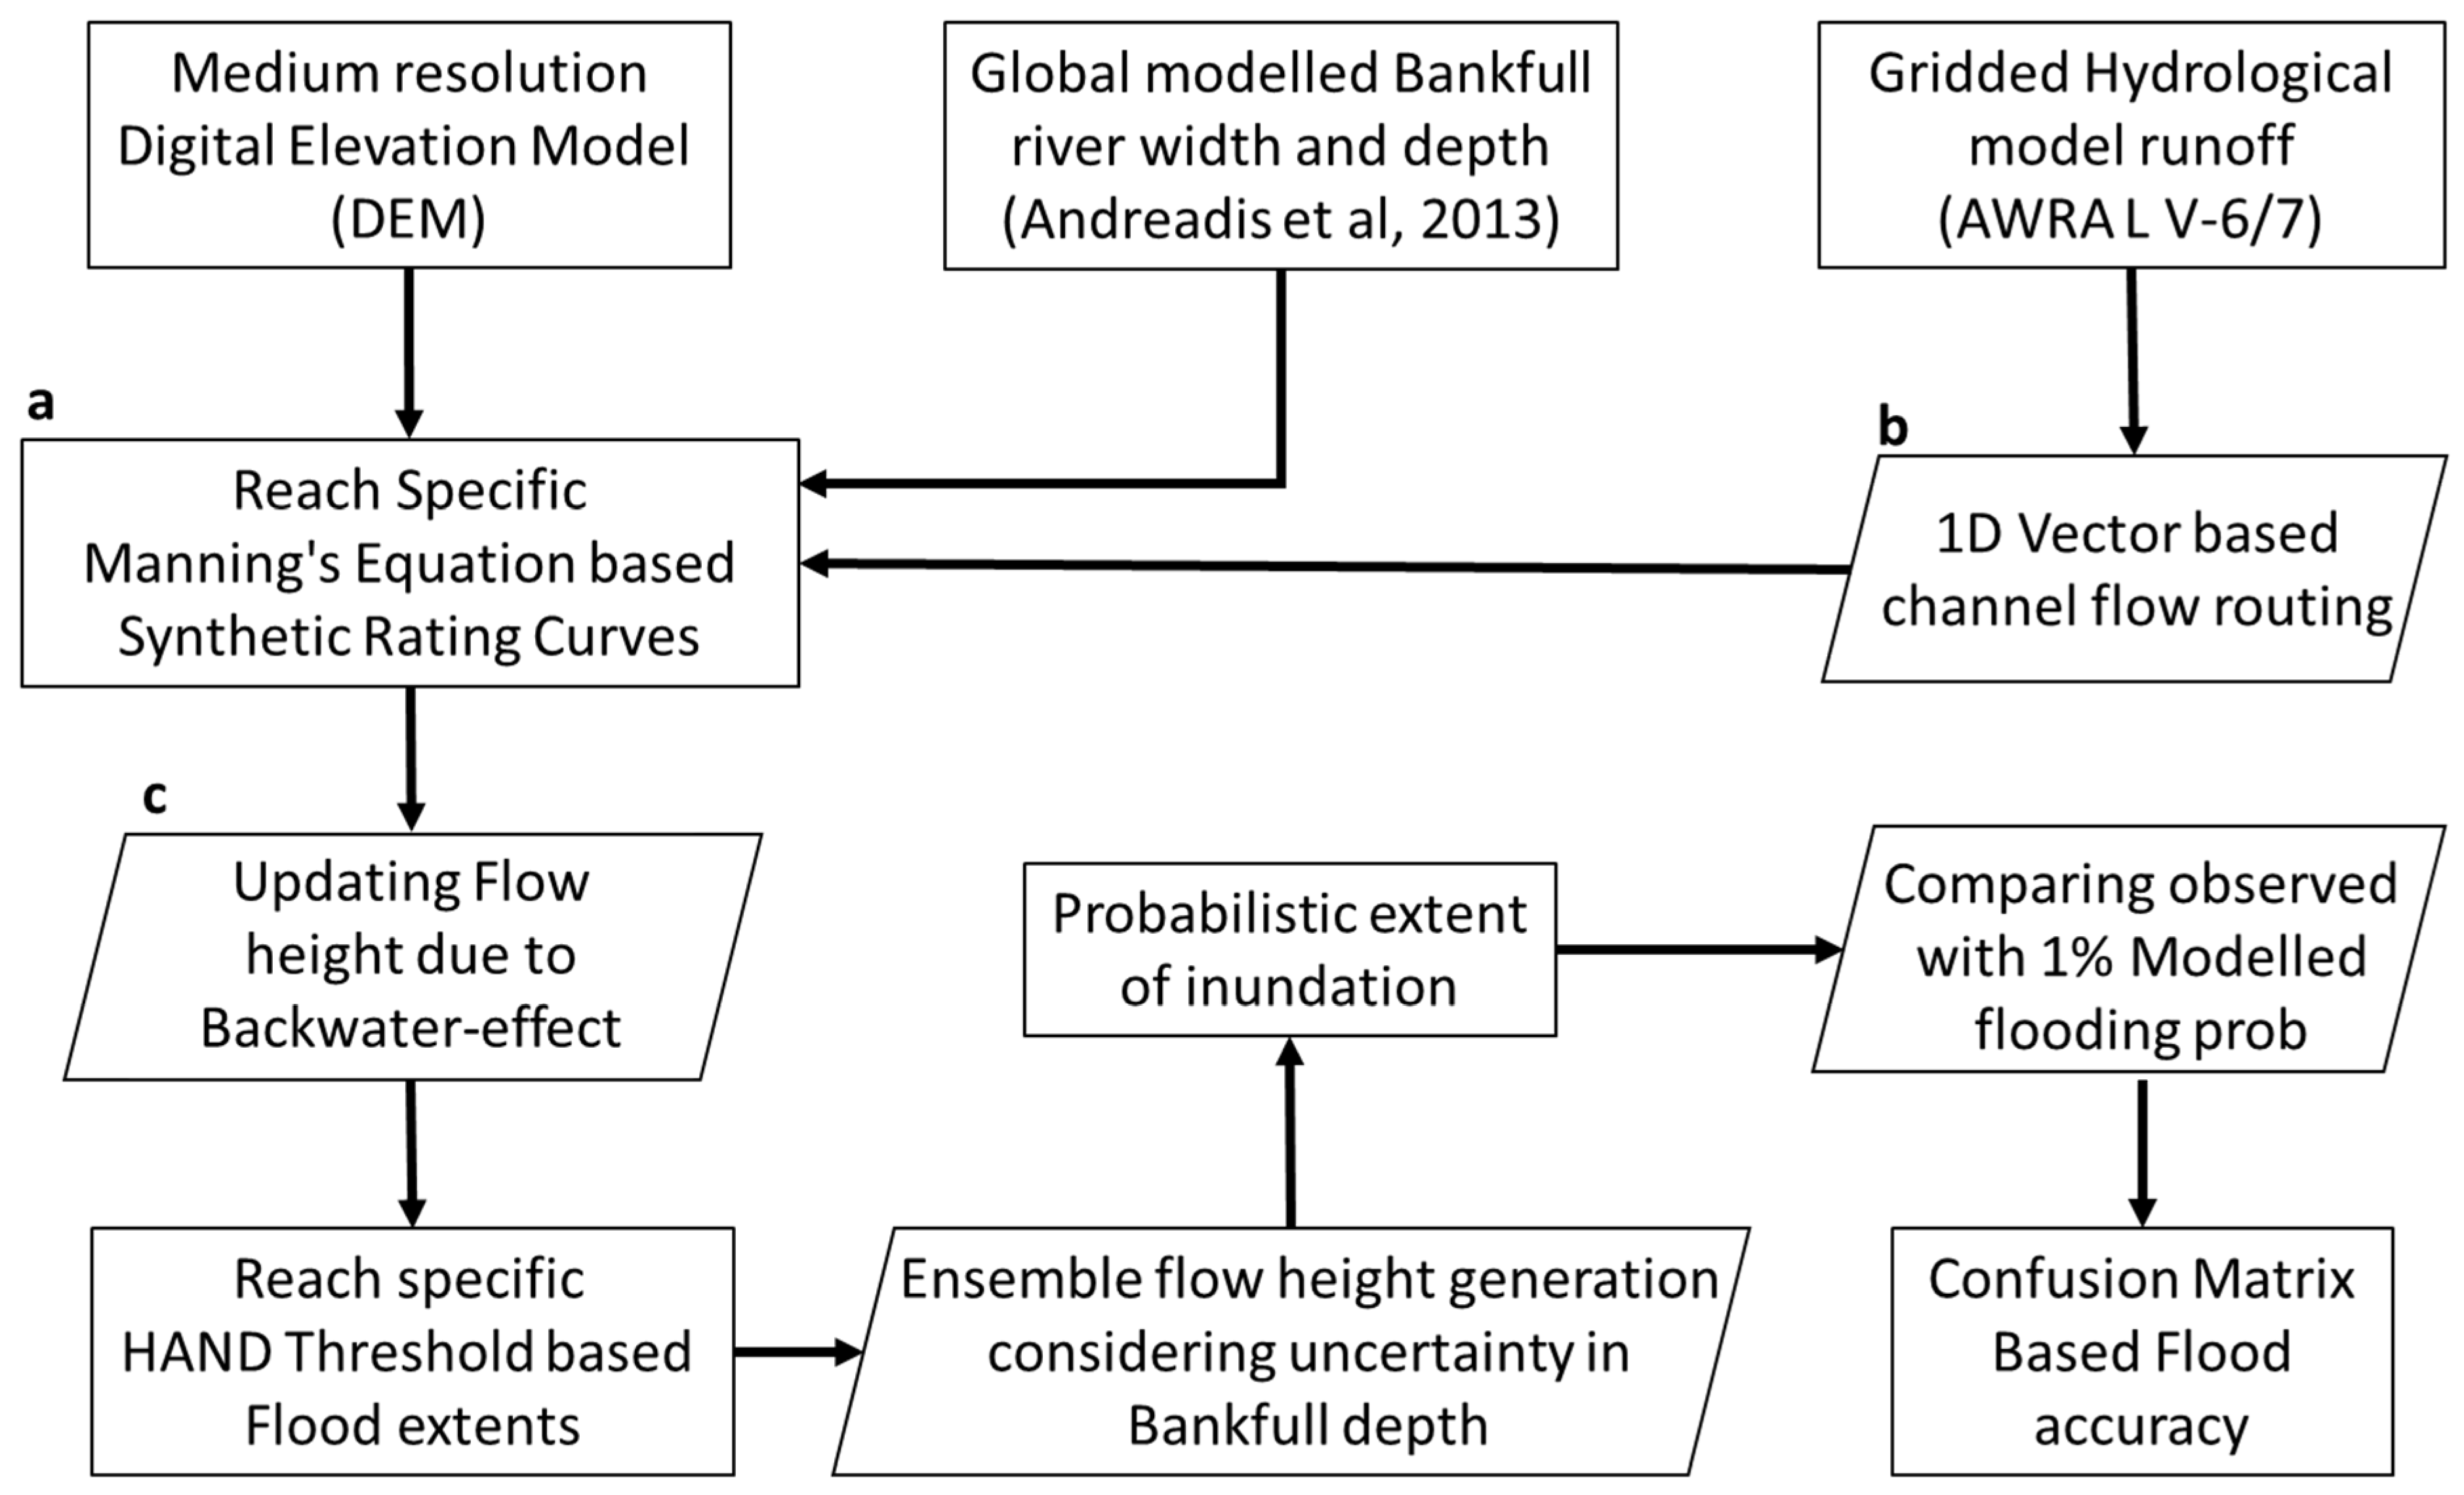
The schematic representing the process flow adopted in this study is shown below in
Figure 3.
A modular approach towards mapping inundation was adopted to divide the region of interest into smaller hydrological units called RCAs. An RCA denotes the set of pixels that drain into a single reach of a channel network that does not branch. A HAND terrain map for each RCA is binarised using pre-defined flow-depth threshold values, and the corresponding extents are pre-processed and stored in a local lookup library. From
Figure 3a, using the modelled river geometry datasets from [
18]—NASA JPL, we generated the synthetic HAND-based rating curves using Manning’s equation for each RCA in the channel network. The rating curves were generated such that overbank flow is considered within the channel by assuming a constant bankfull wetted perimeter for flow heights greater than bankfull depth, i.e., CFRHIM assumes the total flow occurs within the channel and that overbank flow only inundates laterally. Furthermore, Manning’s roughness coefficient
n was modelled as a function of the slope and hydraulic radius of associated reaches as given by [
20]. The inundation extents were compared by keeping the roughness coefficient (
n) constant at 0.03 (representative of a regular channel following the approach introduced by (Chow, 1959)) and by using the following equation,
where
S denotes the reach slope and
r denotes the hydraulic radius. The above relationship was obtained by [
20] for stable bed conditions in main natural channels with high slopes, even during large flow conditions. We evaluated the influence on channel flow upon assuming constant Manning’s roughness co-efficient in data-scarce regions and by varying the same as a function of reach geometry in contrast to calibrating roughness as a function of observed inundated areas [
11]. The area-weighted runoff for each RCA was then routed using the 1-dimensional flow routing procedure approach detailed in (
Figure 3b—Unnithan et al., submitted manuscript). The approach considers the vectorised channel network scheme [
15] used in delineating individual reaches and corresponding RCAs. The discharge is routed considering a spatially constant bankfull velocity to route runoff to the pour point (catchment outlet). Based on the rating curves derived for the river mouth reach, the constant velocity for the routed discharge is then assigned to all the reaches sharing the common pour point for subsequent discharge estimation. The ensemble of inundation depths is obtained from the synthetic rating curve for a given routed discharge. The rating curves consider uncertainty in modelled bankfull depth values, thereby generating an ensemble of flow heights and mapping the spatial extents and depths of inundation from the look-up library for each RCA. The flood extents derived within each RCA are then stitched across all the RCAs, representing the entire catchment area to obtain the comprehensive flood map.
The primary inputs to CFRHIM included the modelled river geometry datasets, the rainfall-runoff product, and topographic information. Model sensitivity to river geometry considers the uncertainty in river depth values affecting inundation extent to a greater degree than bankfull width and the shape of river reaches (Unnithan et al., submitted manuscript). In this study, we first examined the performance of HAND-derived inundation extents to different gridded runoff products by forcing AWRA V6 and AWRA V7 gridded daily runoff products for March 2021. The V7 runoff product involves improved static and dynamic inputs, including the height of the top of the vegetation canopy, spatial maps of tree basal area indicating maximum root water uptake instead of constant spatial value for the entire continent, and updated hydraulic conductivities [
26,
27]. Secondly, model sensitivity to topography was evaluated by comparing the highly resolved, hydrologically consistent, and ground-truthed GeoFabric DEM-derived flood extent to that derived from native SRTM DEM.
Thirdly, we examined the step-like topographic nature of HNV and conceptually represented the presence of the back-water effect (BE) (
Figure 3c), i.e., the build-up of discharge in the downstream floodplain RCAs, which led to the stagnation of inundation in the upstream RCA. We initially estimated the ensemble of flow heights through the method described above. Consequently, the flow height at the terminal downstream reach outlet was propagated to the immediate upstream reaches by accounting for the difference in elevation of an upstream reach with the parent reach. This procedure was iteratively executed upon traversing upstream until the flow height of the parent reach was less than the elevation difference. Finally, due to the highly resolved nature of GeoFabric DEM, we also evaluated the precision of HAND thresholds in intervals of 0.25 m as compared to 1 m resolved SRTM DEM.
2.3. Validation
The modelled probability of inundation maps was compared with Sentinel-derived inundation maps published by CEMS in shapefile (shp) format. Since the comparison could be made only against available flooded/no flood (binary) observed datasets, the modelled inundation maps were reclassified into two categories by considering pixels with a minimum 1% probability of inundation as being flooded. Here, the probability of inundation is the uncertainty in modelled overbank flood discharge-based extent. The resulting binary map was compared with the observed flood map using the confusion matrix (
Table 1), considering the overlap of model flood/no flood (Mod Positive/Mod Negative) pixels with those of observed flood/no flood (Obs Positive/Obs Negative).
We considered the following metrics based on the confusion matrix to evaluate the quality or success rate of the obtained inundation maps: Critical Success Index (CSI) [
29], Youden’s Index (YI) [
30], and Cohen’s Kappa (CK) (Cohen, 1960) [
31], given by
The CSI metric provides the relative accuracy of the model in capturing inundation patterns as a function of observed flooded and non-flooded pixels. A heavy penalty exists in the case of model over-estimation, wherein modelled extents exceed or do not precisely coincide with observed inundation. Thus, we consider a more holistic indicator in YI, which yields the optimum tradeoff between over- and under-estimation of flooding patterns. Cohen’s Kappa is a similar spatial indicator which gives the overall agreement between two different sources of data sets. We report CSI, YI, and CK values for different model result comparisons to infer meaningful patterns captured by the model.
3. Results
We examine the effect of routing within the CFRHIM framework of HAND-based inundation techniques compared to directly mapping HAND extents from the gauged maximum flood discharge level measured at Windsor station in the Hawkesbury–Nepean floodplain. Significant over-estimation exists in the floodplain region in the case of directly mapping HAND-based inundation extent derived from a maximum flood level of 13.43 m across the entire catchment, gauged on 10 March 2021, as compared to the observed inundation for the same day provided by CEMS (
Figure 4). We evaluate the flood maps in terms of the Critical Success Index (CSI), Youden’s Index (YI), and Cohen’s Kappa (CK). With reference to the bar plots in
Figure 4, the CSI indicates high model bias showing over-estimation. For mapping extents directly based on HAND thresholds, we report a CSI of 0.25 for the HNV 2021 flood event. The YI is significantly higher at 0.58 since most of the flooded pixels are captured by the maximum level-HAND extents. The CK denotes the overall agreement between the extents, considering both flooded and non-flooded pixels; hence, we report a significantly low CK of 0.25.
In our first testing case, we investigate the sensitivity of SRTM DEM-based CFRHIM-derived inundation extents to different runoff products, including AWRA V6 and AWRA V7 (
Figure 4). As demonstrated by a higher CK of 0.44 for V7 as opposed to 0.41 for V6, the V7 product with improvements in AWRA model parameterisation related to baseflow and reduced bias upon assigning 50% weightage to terrestrial water storage generates more runoff for the flood event in March 2021 than the V6 product. The inundation extents follow a similar pattern to the input runoff grids. Significant model underestimation exists because of erroneous SRTM DEM, which cannot distinctly delineate the floodplain from the channel pixels, resulting in a skewed channel network and, ultimately, poor modelled inundation accuracy.
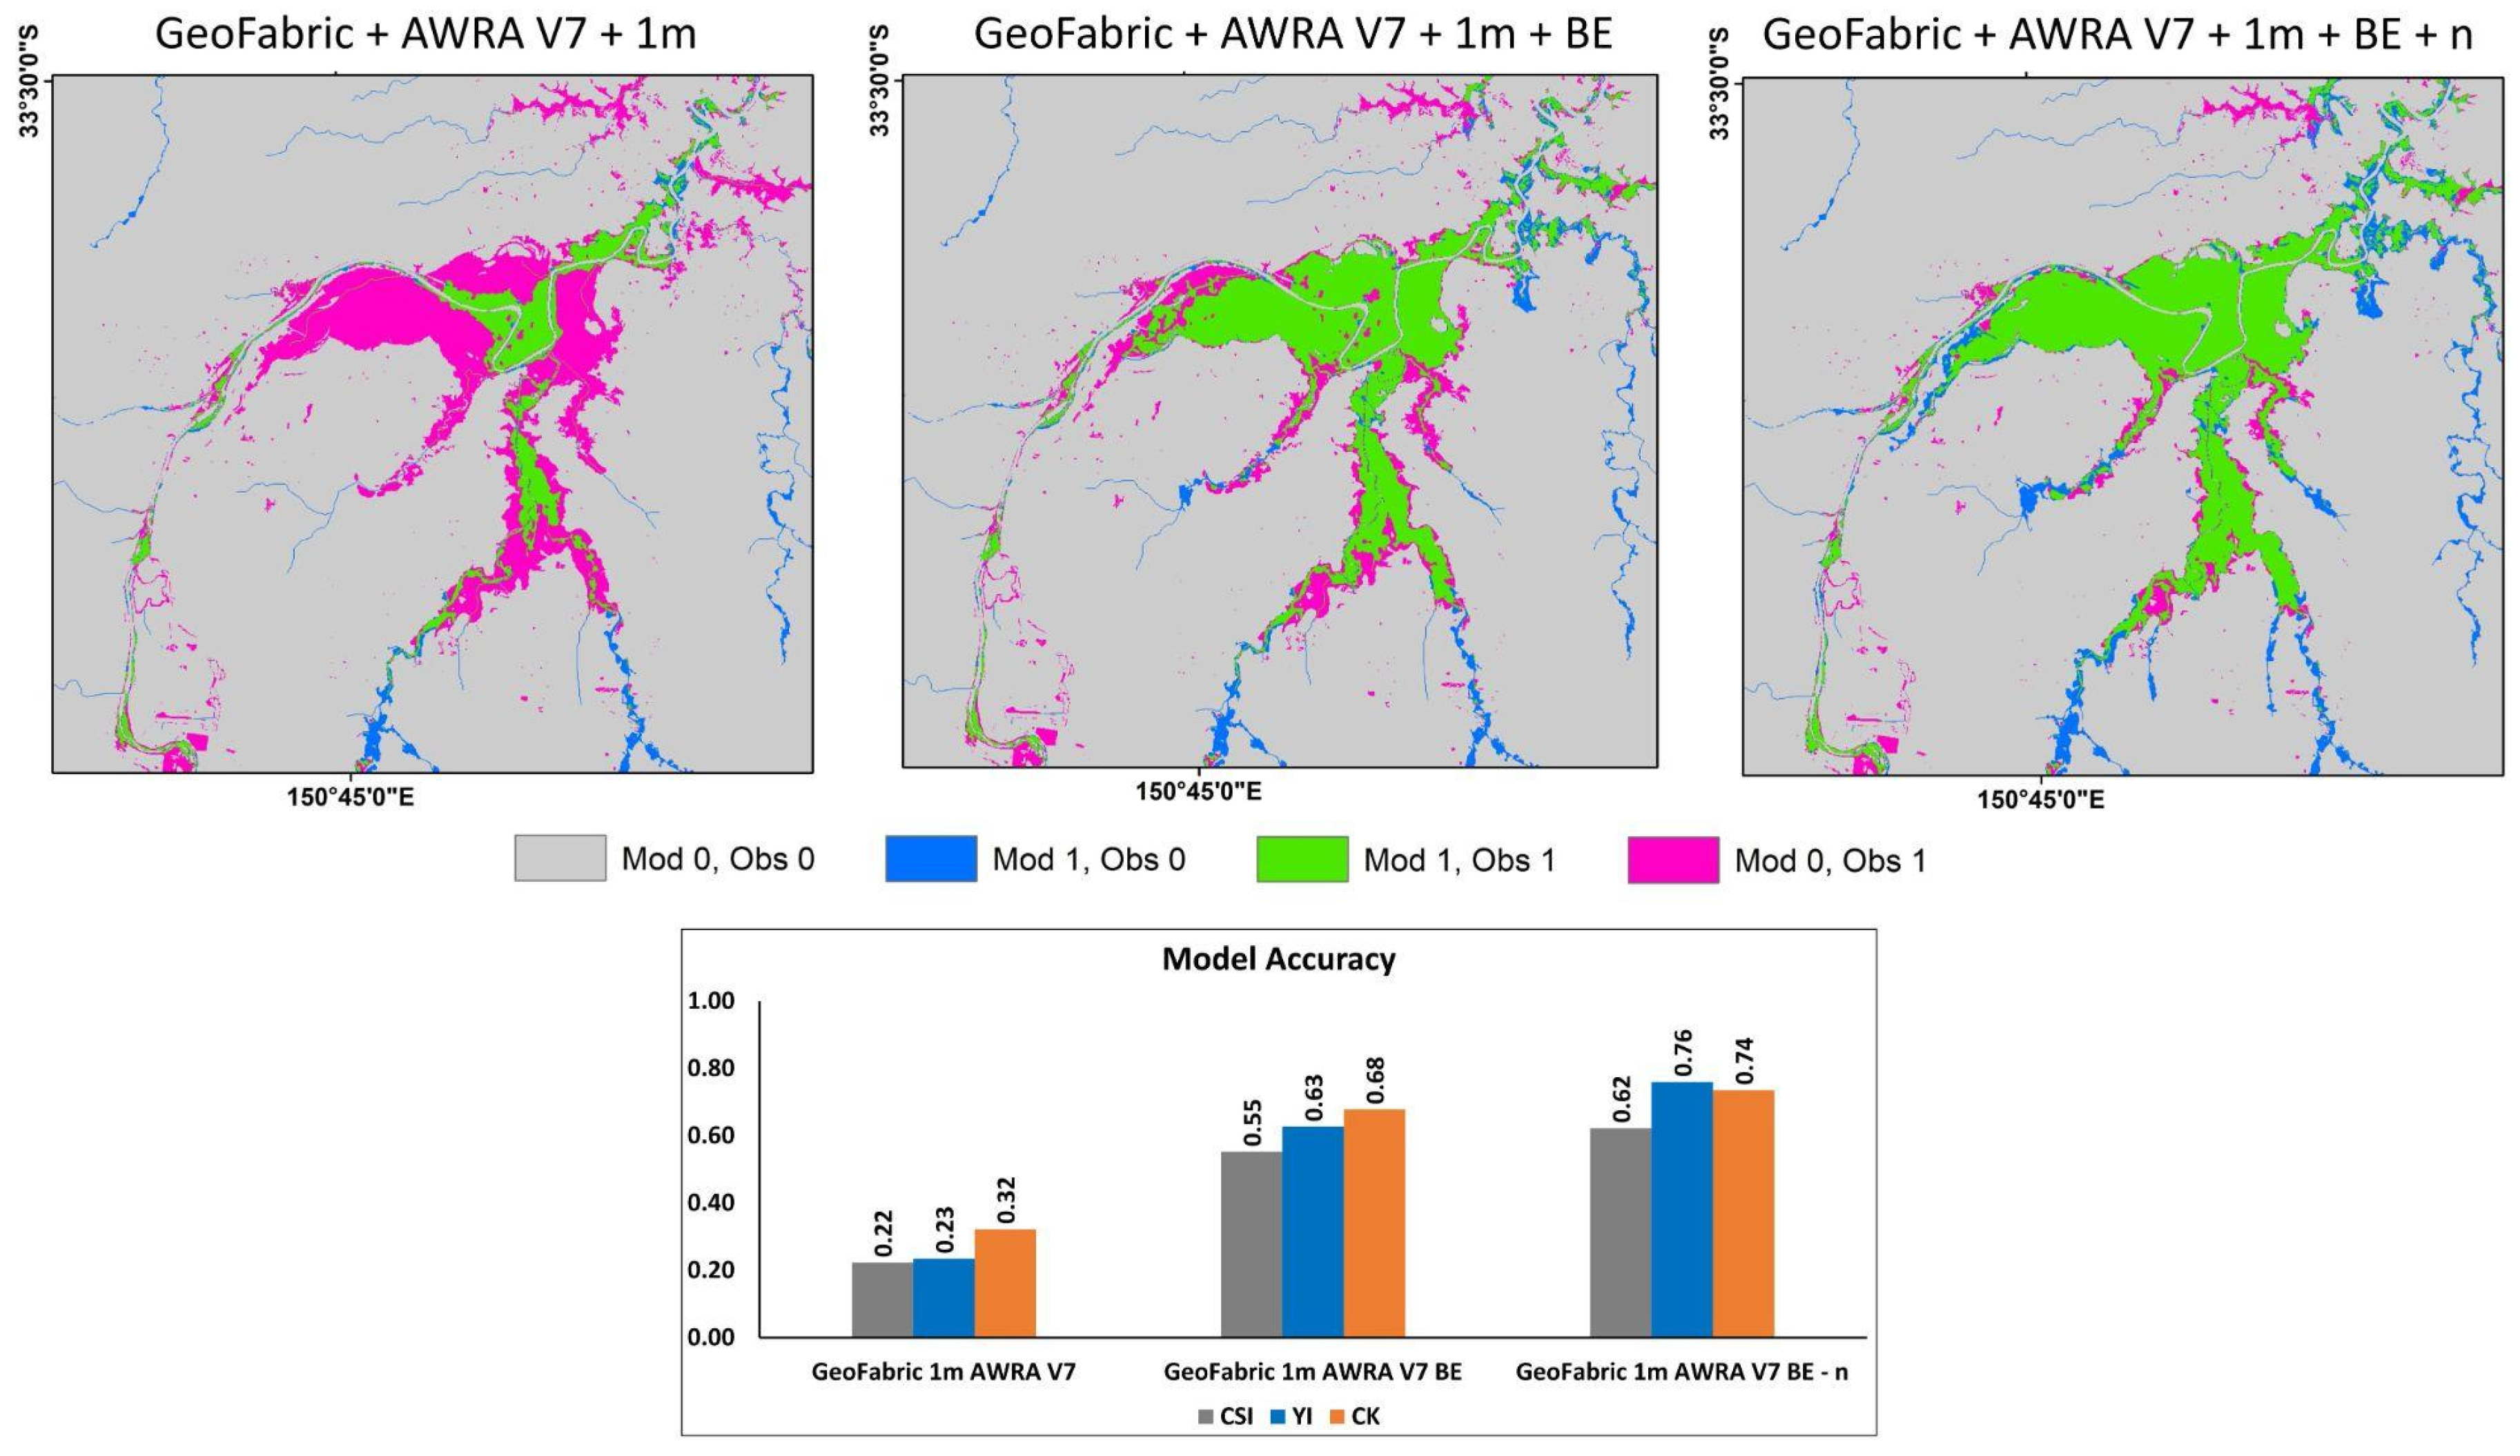
Subsequently, in the second case, we analyse the sensitivity of CFRHIM extents to different DEM products; namely, SRTM and GeoFabric DEM at 30 m resolution with daily gridded AWRA V7 runoff input. The channel network delineated from both DEMs, as shown in
Figure 5, indicates the improved reciprocation of channel morphology from GeoFabric DEM as compared to that derived from SRTM DEM. The ensuing CFRHIM-derived inundation maps depict the flood patterns following the GeoFabric-derived channel network more accurately than SRTM-based channel network. However, the performance evaluated by CK for CFRHIM with GeoFabric DEM and AWRA V7 runoff is significantly lower at 0.32 than that compared to SRTM (0.44). The poorer results can be attributed to the inability of synthetic rating curves to model flooding patterns for individual RCAs within the floodplain. We recognise the step nature of the catchment topography and hence focus on analysing the role of BE affecting inundation extents.
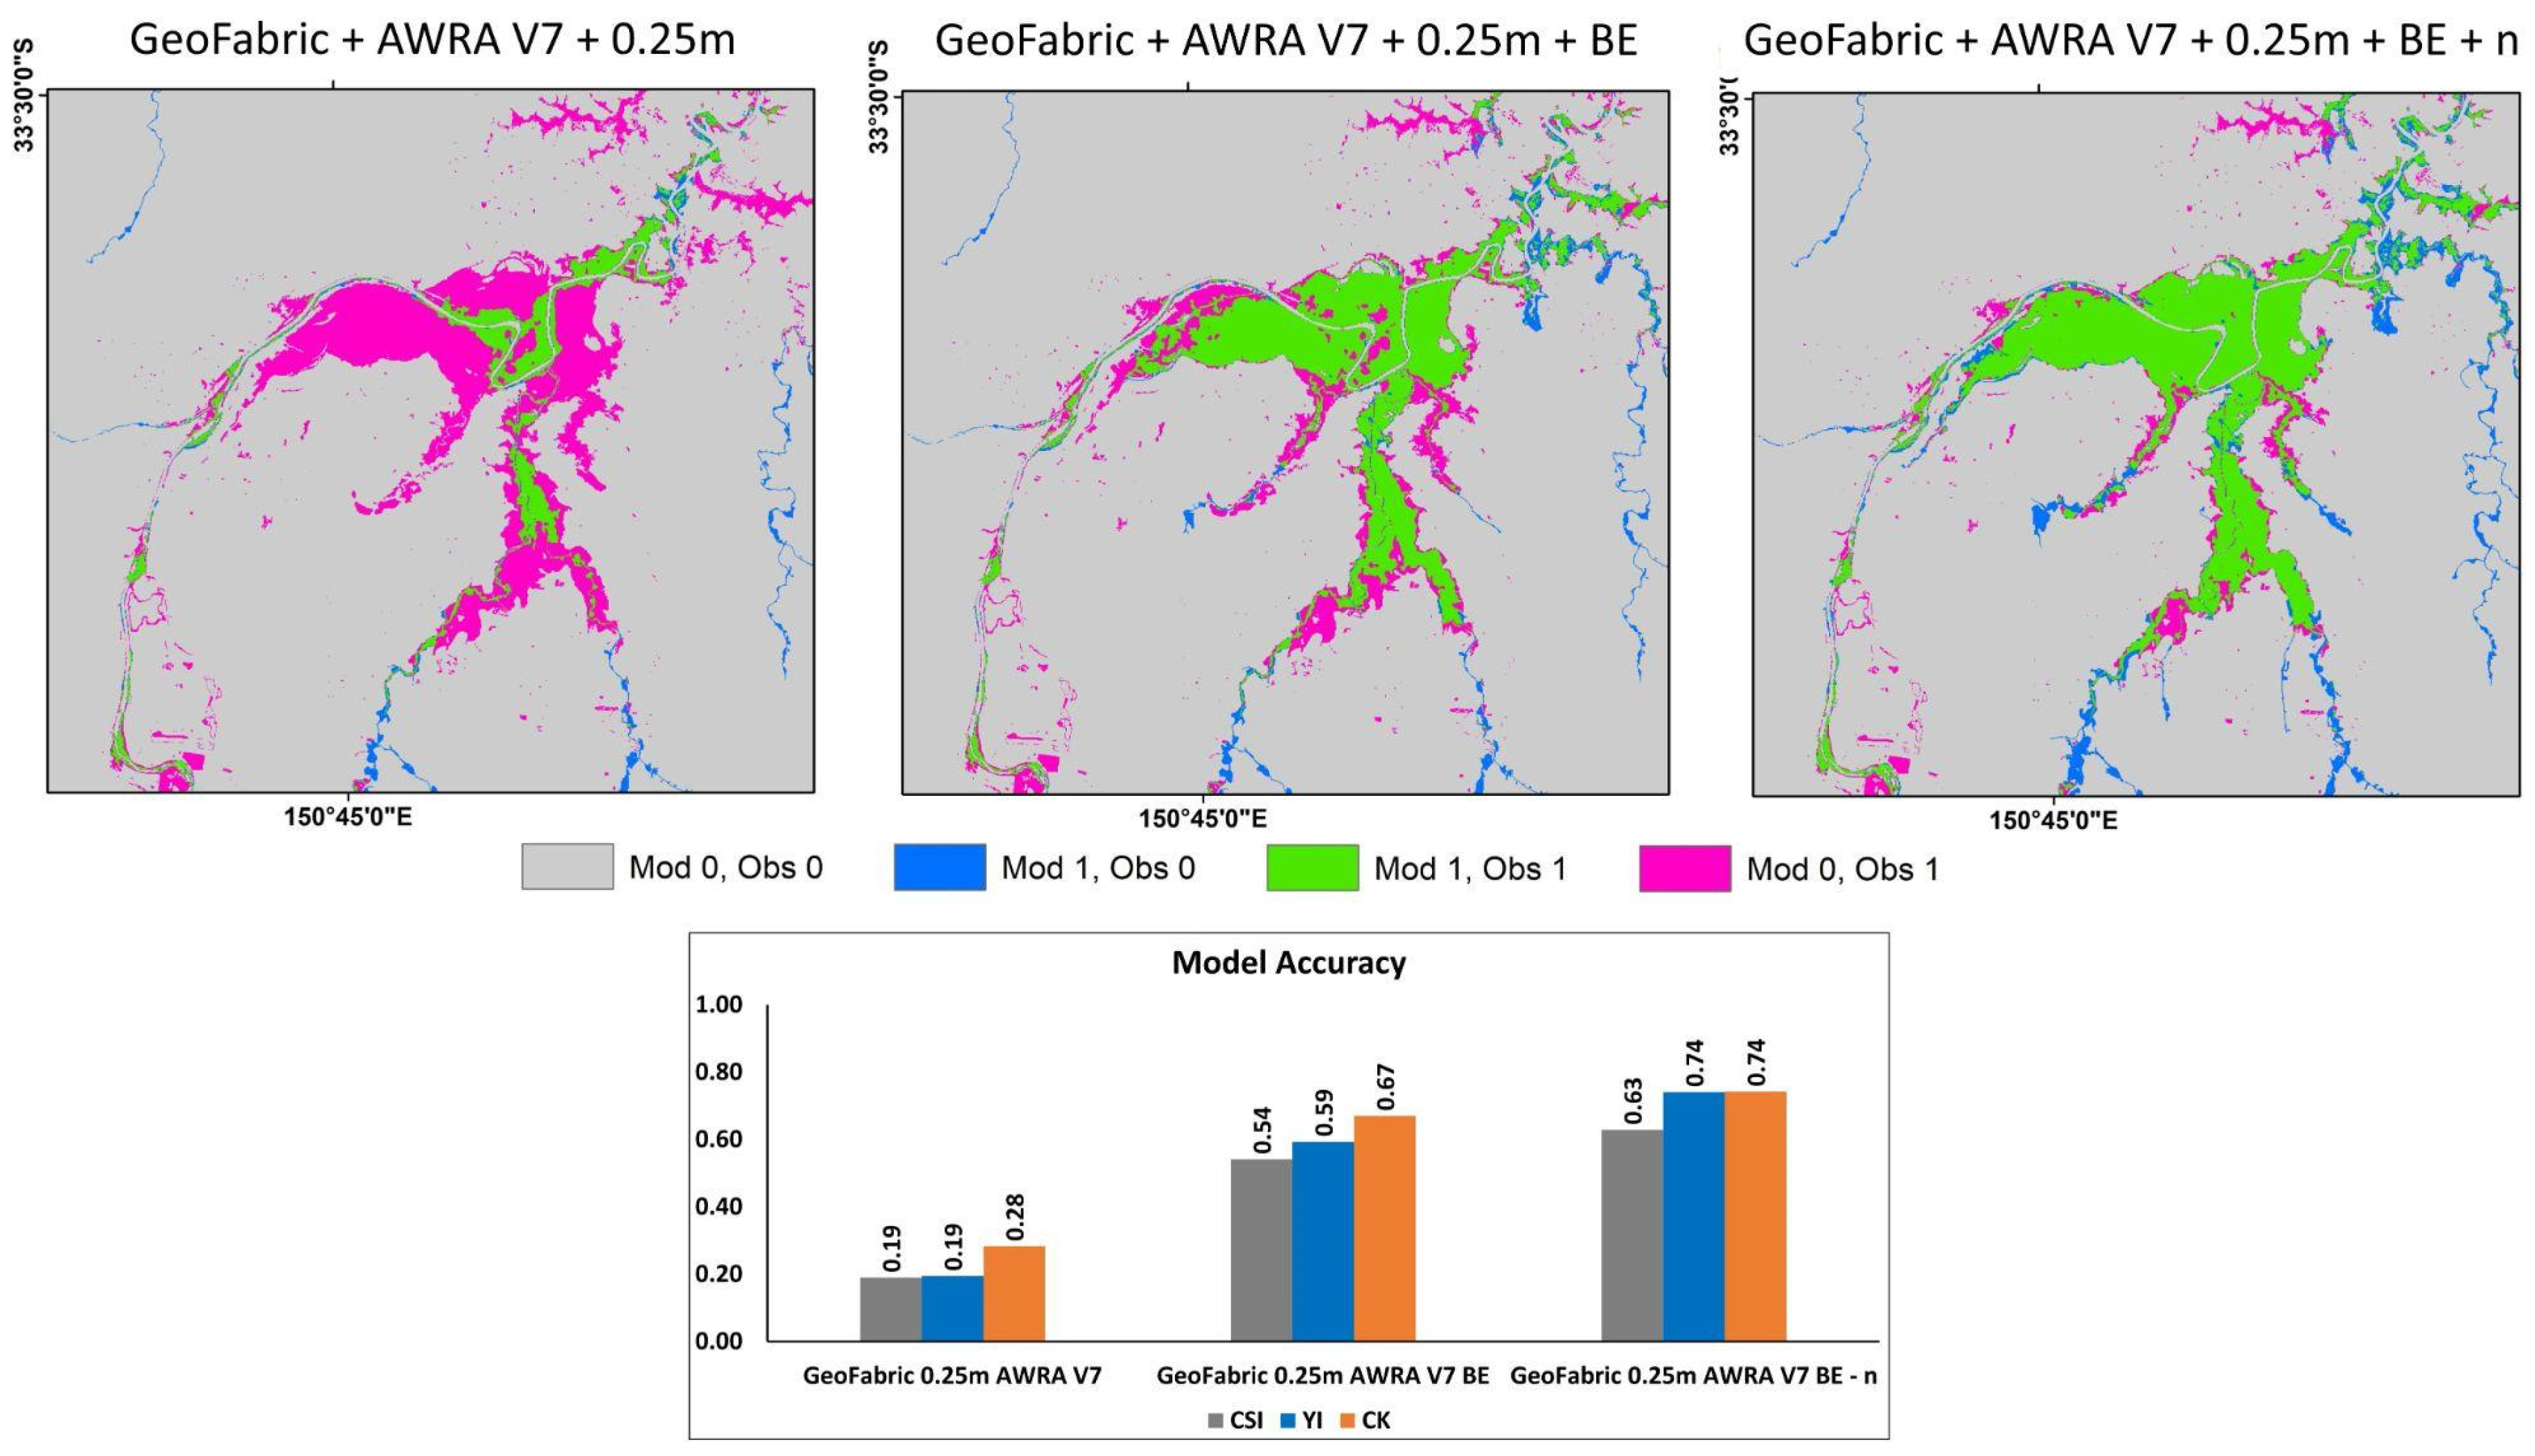
In the third case, as explained earlier, we examine CFRHIM using GeoFabric DEM and AWRAV7 runoff input upon including model processes—BE (back-water effect) and modelled n (Manning’s roughness). The modelled extents including BE significantly capture observed flood extents, thereby indicating the dominant effect of BE in flat floodplain regions that significantly affect inundation accuracy. The CK after including BE within CFRHIM improved to 0.68, a remarkable shift from when not including BE. By relying on more accurate DEM from the GeoFabric framework, we can reliably capture the BE on inundation extents. As explained in the methodology section, we also incorporated the modelled Manning’s roughness coefficient n as a function of S and r. In this case, we report a higher CK of 0.74, thus denoting that flooding patterns are again crucially dependent upon the channel bed roughness in floodplain regions.
In the last case, we evaluate the sensitivity of the CFRHIM framework using the highly resolved GeoFabric DEM by considering the threshold of finer resolution in HAND values. The inundation results presented above consider a 1 m HAND interval between modelled extents derived from the synthetic rating curves described in the methodology section. The CFRHIM-derived extents with and without including BE and modelled
n are as shown in
Figure 6. The model results evaluated by CK show similar values and trends, with slightly better results in the case of 1 m HAND value thresholds. The CFRHIM model approximations in synthetic rating curve generation indicate better accuracy at coarser threshold resolutions, thus achieving accuracy without compromising computational costs/memory costs.


 ,
, 


