Review

Methods for Measuring and Estimating Methane Emission from Ruminants

by
Ida M. L. D. Storm
1,
Anne Louise F. Hellwing
2,
Nicolaj I. Nielsen
3 and
Jørgen Madsen
1,*
1
Department of Large Animal Sciences, University of Copenhagen, Grønnegårdsvej 2, DK-1870 Frederiksberg C, Denmark
2
Department of Animal Science, Aarhus University, AU-Foulum, P.O. Box 50, DK-8830 Tjele, Denmark
3
AgroTech, Agro Food Park 15, DK-8200 Aarhus N, Denmark
*
Author to whom correspondence should be addressed.
Animals 2012, 2(2), 160-183; https://doi.org/10.3390/ani2020160
Submission received: 9 February 2012 / Revised: 8 March 2012 / Accepted: 2 April 2012 / Published: 13 April 2012
(This article belongs to the Special Issue Climate Change and Livestock Management)

Abstract

:

Simple Summary

Knowledge about methods used in quantification of greenhouse gasses is currently needed due to international commitments to reduce the emissions. In the agricultural sector one important task is to reduce enteric methane emissions from ruminants. Different methods for quantifying these emissions are presently being used and others are under development, all with different conditions for application. For scientist and other persons working with the topic it is very important to understand the advantages and disadvantage of the different methods in use. This paper gives a brief introduction to existing methods but also a description of newer methods and model-based techniques.

Abstract

This paper is a brief introduction to the different methods used to quantify the enteric methane emission from ruminants. A thorough knowledge of the advantages and disadvantages of these methods is very important in order to plan experiments, understand and interpret experimental results, and compare them with other studies. The aim of the paper is to describe the principles, advantages and disadvantages of different methods used to quantify the enteric methane emission from ruminants. The best-known methods: Chambers/respiration chambers, SF6 technique and in vitro gas production technique and the newer CO2 methods are described. Model estimations, which are used to calculate national budget and single cow enteric emission from intake and diet composition, are also discussed. Other methods under development such as the micrometeorological technique, combined feeder and CH4 analyzer and proxy methods are briefly mentioned. Methods of choice for estimating enteric methane emission depend on aim, equipment, knowledge, time and money available, but interpretation of results obtained with a given method can be improved if knowledge about the disadvantages and advantages are used in the planning of experiments.

1. Introduction

Livestock and mainly ruminants account for up to one third of the emitted methane worldwide [1], and methane has a greenhouse potential 25 times that of CO2 [2]. Therefore methane accounts for a great part of the emitted CO2-equivalents from agriculture. Over the last 100 years several different methods have been developed with the purpose of measuring and estimating methane emissions from ruminants. These methods have various scopes for application, advantages and disadvantages—but none of them are perfect: Some are expensive, some cheaper; some suited for grazing animals, some for housed livestock; some can handle many animals, some only few. This all affects the measuring results and our interpretation of them. It is therefore important to know the possibilities and limitations of each method. This applies to the understanding of current research results and to the planning of future projects. The present literature within techniques for estimating greenhouse gas emissions from livestock is primarily concerned with individual methods and their validation. Apart from a review with emphasis on grazing livestock was published in 2007 [3], literature comparing a range of different estimation approaches is scarce.
This review briefly presents the most common methods for estimating and measuring methane emissions from ruminants, including newly developed techniques. The focus is on methods at the individual animal scale. Each method is presented and advantages and disadvantages emphasized. Finally, the descriptions are summarized to facilitate comparison.

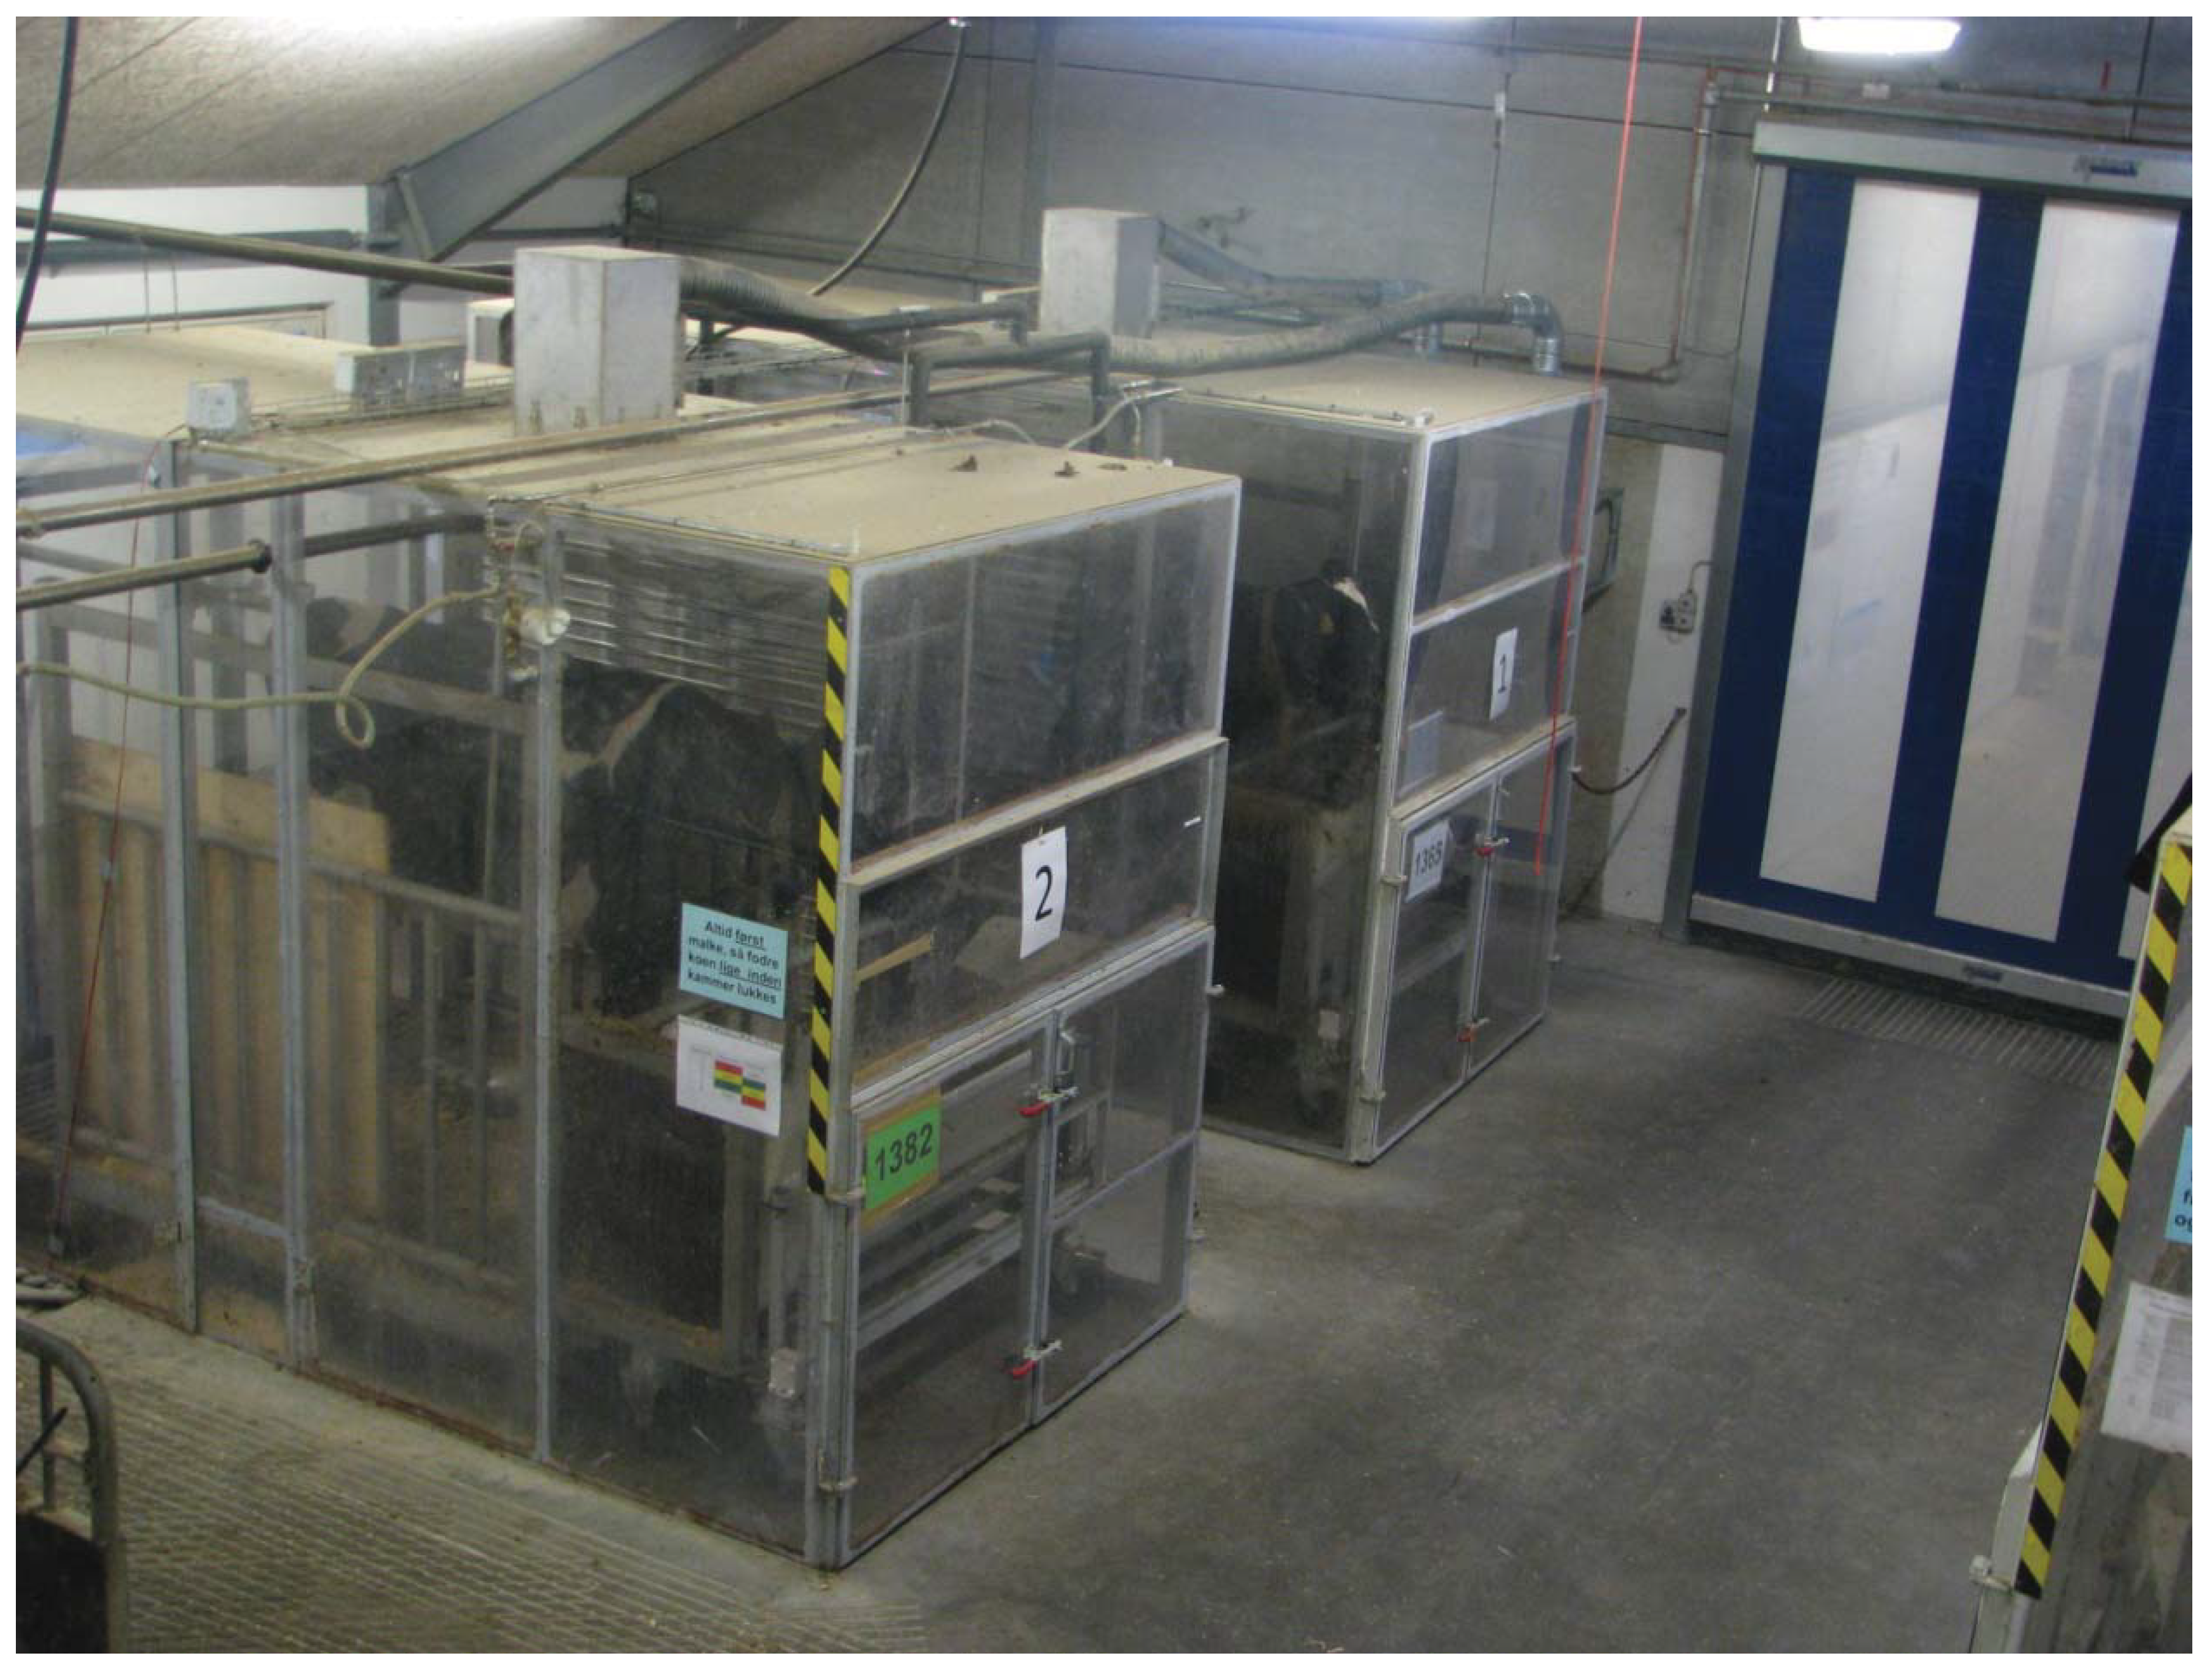
2. Measuring Methane by Means of Chambers

Different chamber systems or respiration chambers have been used for the last 100 years with the main purpose of studying the energy metabolism of animals [4,5]. Methane loss is an inherent part of the energy metabolism in ruminants, and various types of chambers are valuable tools in the investigation of mitigation strategies for methane emissions.
The principle of the chambers is to collect all exhaled breath from the animal and measure e.g., the methane concentration. Animal calorimetric systems, where air composition is measured, are divided into two main types: The closed-circuit [6] and the open-circuit, with the latter being the dominating one [5]. In Figure 1 an outline of an open-circuit system is shown. A pump pumps air from the chamber through a flow meter and different gas sensors. Fresh air for the animal is drawn from outside. In some systems fresh air is drawn through an air conditioning system to control humidity, temperature and mixing of air in the chamber but air can also simply be taken from outside the chamber. The methane emission is calculated from flow and gas concentration in inlet and outlet air from the chamber, but more complex calculations have been developed that also take into account the small differences in inflow and outflow and changes in chamber concentration of gases [7]. The difference between the outgoing and incoming amount of methane corresponds to the methane emission. Many different chambers have been constructed on the basis of this principle including insulated chambers with controlled temperature and humidity [5,8,9,10], more simple types with no insulation of chambers and fresh air inlet from the room [11,12,13], systems where just the head of the animal is placed in the chamber [14,15,16] and systems developed to measure grazing animals [17,18,19].
Figure 1. Diagram of open circuit respiration chamber.
Animals 02 00160 g001
Chambers are regarded as the standard method for estimation of methane emission from ruminants, because the environment can be controlled and the reliability and stability of instruments can be measured [5,20]. However, there is a risk of creating an artificial environment, which affects animal behavior e.g., dry matter intake (DMI). As DMI is one of the main drivers of methane emission a decrease in DMI would not only effect total emission but also the derived estimates like loss of gross energy [21]. Therefore, it has been queried that results obtained in chambers cannot be applied to free ranging animals e.g., animals on pasture [22,23]. Investigations have shown that chambers give more precise estimates of methane emissions than the SF6 tracer technique [11].
Classical chambers for energy metabolism with air conditioning, internal mixing of air and careful tightening to reduce the risk of air loss to the surroundings [8] are expensive to build. Therefore less expensive systems have been developed with methane measurements as the main purpose [11,12,13]. In Denmark four chambers based on open circuit calorimetry have been built. The chambers are 1.8 m (witdh) × 2.5 m (height) × 3.8 m (length) with a volume of approximately 17 m³. The chambers are constructed of a metal frame covered with transparent polycarbonate walls (Figure 2). They are placed so cows can have visual contact with other animals in an existing barn to ensure animal welfare and dry matter intake. Air is drawn from the barn and concentrations of CH4, O2, CO2, and H2 are measured in inlet and outlet air. DMI measured before and during chamber stays have shown that feed intake is unaltered (Hellwing, unpublished data). It clearly shows that design and placement of chambers can reduce the risk of creating an artificial environment and eliminate the risk of reduced DMI. Furthermore, data on methane emission can be combined with data on rumen metabolism and digestibility [24], increasing our understanding of methane production and metabolism.
Figure 2. Respiration chambers constructed at Aarhus University of a steel frame covered with polycarbonate.
Animals 02 00160 g002
Nearly all aspects of feeding and nutrition can be investigated in a chamber system. The level of feeding, effect of feedstuff, effect of chemical and physical composition, restricted versus ad libitum feeding, different feeding schedules, different additives etc. Also changes in emission during the day can be described with the system, but resolution will depend on the number of measurements during a given day.
The variation in measurements is affected by instrument variation as well as within and between animal variations. Within animal variation or day-to-day variation will affect the number of days needed for measuring. The day-to-day coefficient of variation (CV) has been reported to be 7.2% in cattle and sheep [25], 4.3% for dairy cows [26] and 4.7% in sheep [11]. Increasing the number of measuring days will decrease the random error [27]. For methane or energy metabolism studies of three to five days has been used [11,25,26]. The between animal CV has been reported to be 7–8% in restricted fed sheep [25], 17.8% for ad libitum fed cows [26], and 6.1% in restrictively fed sheep [11]. A higher between animal variation during ad libitum feeding than during restricted feeding corresponds well with the findings of Thorbek [28] who studied CO2 and CH4 production by growing calves at high and low feeding levels. A high between animal variation will increase the number of animals needed to document that treatments are significantly different.
In conclusion, chamber systems can be used to examine nearly all aspects of nutrition, and this technique gives results with a day-to-day CV, which can be below 10%, but the variation is dependent on e.g., feeding level. Considerations about design and placement of the chambers can eliminate the risk of reduced feed intake. There is no doubt that this system gives quantitative measurements of methane emission with low tolerance but establishment costs and limited capacity of the system restricts the number of animals, which can be examined experimentally.

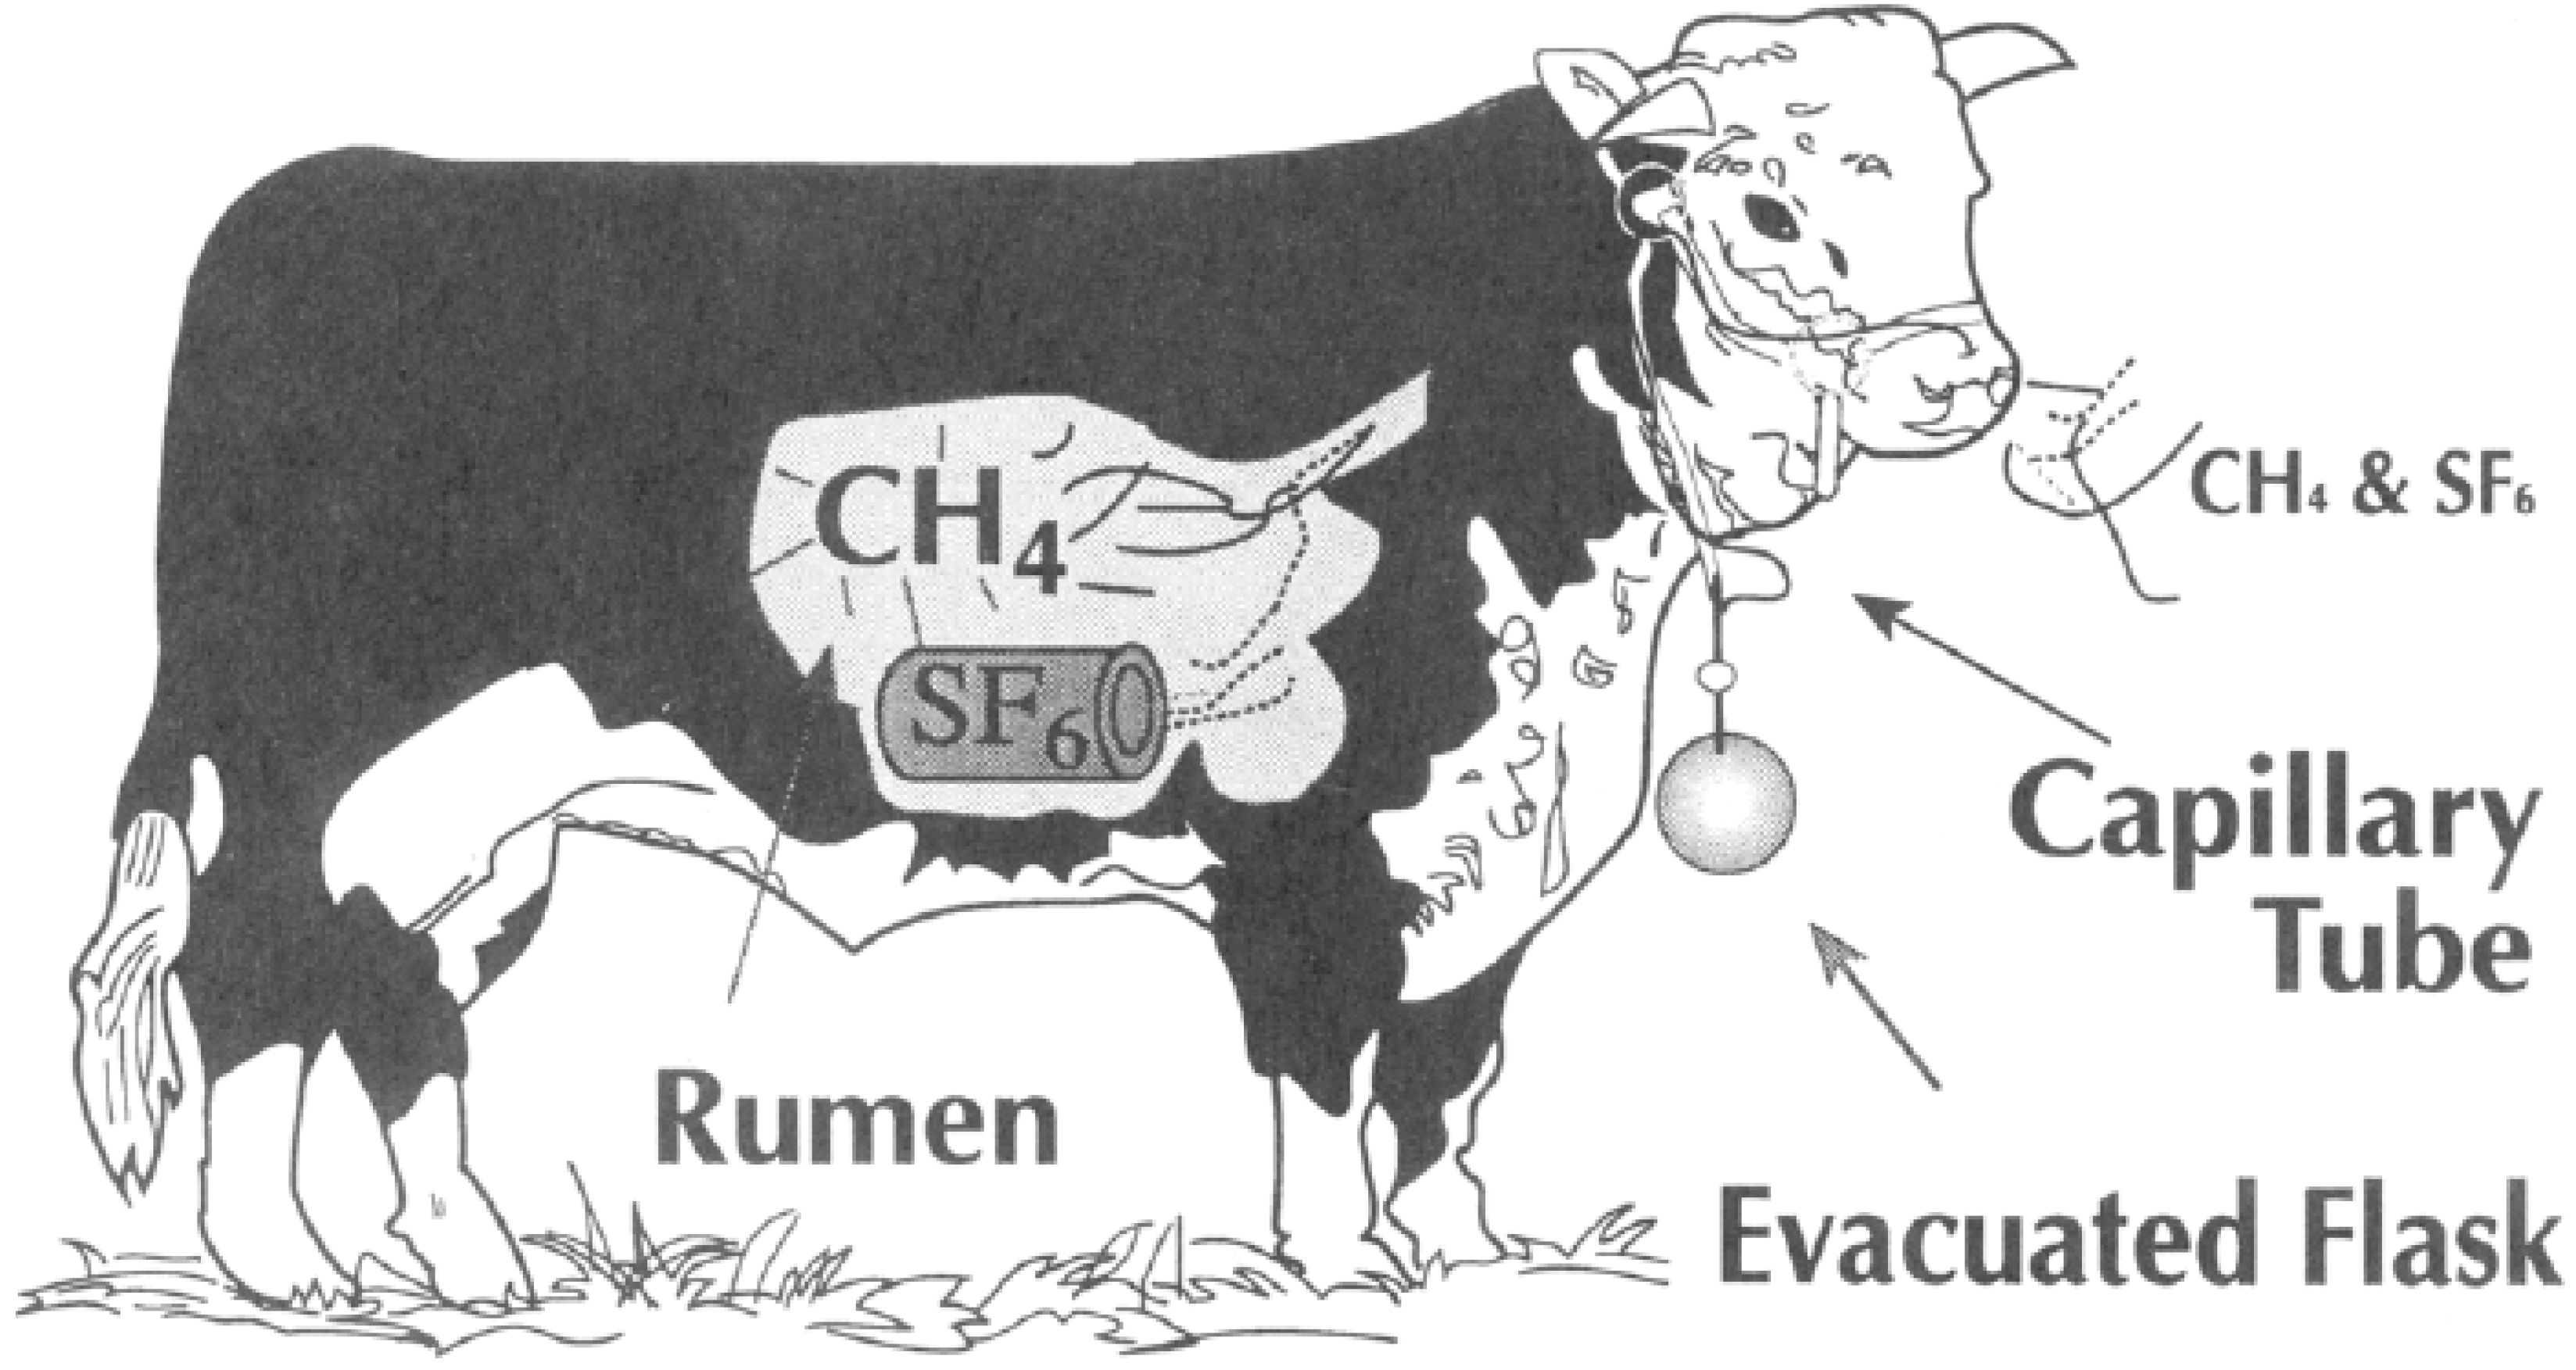
3. Measuring Methane with the SF6 Tracer Technique

This method is relatively new and was first described in 1993–1994 [22,29]. The main purpose of the method was to investigate energy efficacy in free ranging cattle [29], because it had been queried that results obtained in respiration chambers could not be applied to free ranging animals [22,23]. The SF6 method is used widely in New Zealand [30,31], Canada [32,33], Australia [34,35] and the US [22,36], and also north European countries e.g., Sweden [37] and Norway [38] employ the method.
The basic idea behind the method is that methane emission can be measured if the emission rate of a tracer gas from the rumen is known. For this purpose a non-toxic [39], physiologically inert [40], stabile gas is needed. Furthermore, the gas should mix with rumen air in the same way as methane. SF6 was chosen [29], because it fulfills the above criteria, is cheap, has an extremely low detection limit and is simple to analyze.
SF6 is filled into small permeation tubes. The rate of diffusion of SF6 out of the permeation tubes is measured by placing them in a 39 °C water bath and measuring the daily weight loss until it is stable. The permeation tube is then placed in the rumen of an experimental animal and collection of air can start. The sampling apparatus consists of a collection canister, a halter and capillary tubing. The capillary tubing is placed at the nose of the animal and connected with the evacuated canister (Figure 3). The tubing regulates the sampling rate. The sampling time is typically one day [22,29,41], but emission estimates from shorter time intervals have been published [30,36]. The concentration of SF6 and CH4 in the canister is determined by gas chromatography. For more detailed description of equipment and guidance see [41]. The methane emission is calculated from the release rate of SF6 and concentration of SF6 and CH4 in the containers in excess of background level [31] as described in Equation (1).
F C H 4 = F t r a c e r · C C H 4 m e a s u r e d C C H 4 a t m C t r a c e r m e a s u r e d C t r a c e r a t m
where F C H 4 is the total production of CH4, Ftracer is the total production or release of SF6, C C H 4 m e a s u r e d and C t r a c e r m e a s u r e d are the measured concentrations of CH4 and SF6 in the experimental entity e.g., in the unit of ppm, while C C H 4 a t m and C t r a c e r a t m are the concentrations of CH4 and SF6 in atmospheric or background air, measured with the same analyzer and in the same unit.
Results based on direct measurements of gas composition in gas head space in the rumen of cannulated animals have also been published [36,42,43].
The system can be used to investigate nearly all aspects of feeding and nutrition e.g., level of feeding, effect of feedstuff, effect of chemical and physical composition, restricted versus ad libitum feeding, different additives and grazing. Using the method for investigation of dynamics of methane emission is debatable.
Figure 3. Illustration of the SF6 tracer technique. Reprinted with permission from [22]. Copyright (1994) American Chemical Society.
Animals 02 00160 g003
The method has been carefully tested during the last two decades and a number of difficulties have been described. The following problems will briefly be discussed: Maintaining a constant release rate from permeation tubes, effect of release rate upon emission rate of methane, background level determination, inconsistency between methane measurements determined in chambers and with SF6 and within and between animal variation.
The release rate is important and will affect emission estimates if not correctly determined. The release rate from permeation tubes is determined under laboratory conditions by weighing the permeation tubes regularly for at least 1½ months [41,44]. Only highly linear permeation tubes are used (R2 > 0.997) [45]. However, permeation curves have been shown to be slightly curvilinear under laboratory conditions [46,47]. Tests of permeation tubes pre- and post-experiments have also shown differences in permeation rate. Different methods to account for this are described by [46,47]. The permeation tubes are weighted in a laboratory in dry air and the release rate should be the same in the rumen. However, a 6–11% lower release rate in tubes placed in rumen fluid than in air has been observed [48].
It has also been shown that permeation tubes with high release rates give higher methane emissions than tubes with low release rates. It is therefore recommended to use permeation tubes with nearly the same release rate when comparison of different treatments is needed [48,49].
The measured concentration should be corrected for background levels of both SF6 and CH4 [31]. Measuring a representative background concentration under field condition can be difficult, because wind direction and other animals in the field can affect the concentrations [50].
Johnson et al. [22,51] observed a 7% lower methane emission with the SF6 technique than with chambers with cattle, and this can partly be explained by the few percent of methane, which is lost via rectum [52]. Comparisons [53,54] also showed a slightly lower emission (5–10%) with the SF6 technique than with chambers for both cattle and sheep. However, others have shown slightly higher values with the SF6 technique than chambers [26,55], and yet other studies have found much higher values with the SF6 technique than chambers [11,44,46,56,57].
Both within and between animal CV is much higher in experiments with the SF6 technique than with the chambers. In a study by Pinares-Patiño et al. [11] the same animals were measured both with the SF6 technique and in chambers. The within CV was 4.7, 13.5 and 11.7% in chambers, with SF6 and with SF6 in chambers, respectively. Also the between animal CV was twice as high with the SF6 technique as with the chambers. The correlation between the different methods is also inadequate. Both the higher within and between animal variations increase the number of measuring days and number of animals needed to verify differences between treatments.
In conclusion, the SF6 method gives more variable results of methane emission than chamber measurements. This increases the number of animals needed to prove treatment differences. The ability to use the method to quantify the methane emission has been debated in a number of studies [11,56], but the technique is still new and further investigation can hopefully improve the technique. The method is the only available method for measuring individual free ranging animals on e.g., pasture.

4. In Vitro Gas Production Technique for Methane Measurements

The in vitro gas production technique (IVGPT) has been used to simulate ruminal fermentation of feed and feedstuffs [58] for decades. With the increasing interest in green house gas (GHG) emissions from agriculture in recent years, the traditional IVGPTs have been modified to include measurement of methane production e.g., [59,60].
Figure 4. Illustration of a wireless in vitro gas production module. The individual gas production module (a) measures pressure from fermentation in the jar continuously and releases gas at a certain set point above atmospheric pressure. Data is wirelessly transferred from all modules, which can be incubated in a water bath or an incubator (b).
Animals 02 00160 g004
The basic principle of IVGPTs is to ferment feed under controlled laboratory conditions employing natural rumen microbes. Feedstuffs, e.g., subjected to different treatments, are incubated at 39 °C with a mixture of rumen fluid, buffer and minerals for a certain time period, typically 24, 48, 72, 96 or 144 h (Figure 4). The amount of total gas produced during incubation is measured and its composition analyzed, to obtain data on the in vitro production of methane. At the same time it is possible to determine in vitro degradation of the feedstuffs, making it possible to determine whether a reduction in methane production is at the cost of total feed degradation. The output of IVGPT experiments is usually reported as amount of CH4 per gram dry matter (DM), per gram degraded DM (dDM) or per gram degraded NDF (dNDF).
Various IVGPT systems have been employed for methane determination as for example syringes [61,62], rusitec [62], closed vessel batch fermentations [60] and lately fully automated systems [59]. Depending on the system and other laboratory constraints it is possible to conduct up to several hundred parallel incubations at a time, which allows for sufficient amounts of repetitions in experiments to support statistically significant differences between treatments. Residual variation between repeated measurements of methane production conducted with IVGPT is not well reported in the literature. A recent ring-test comparing in vitro gas production kinetics between laboratories reports a repeatabily (variation between duplicates within a series expressed as coefficient of variation (CV)) for asymptotic gas production ranging from 1.8% to 7.6% [63]. Similar or higher CV-percentages are therefore expected for in vitro methane determinations, where an extra analytical level has been added.
The typical time frame for conducting an in vitro experiment is 1–4 weeks, which makes it possible to screen many different feedstuffs and potential additives relatively fast and cheaply. The systems can also be used to explore dose-response curves for potential additives. Compared to in vivo experiments it is also much easier to control fermentation conditions like pH. The cow-to-cow variation observed in vivo can be avoided by using the same ruminal inoculum for all treatments which are to be compared in vitro. Preferably the inoculum is produced by mixing rumen fluid from several donor animals to include as many different rumen microbes as possible.
The method requires access to fresh rumen fluid, which is typically obtained from fistulated cows or other ruminants. Alternative methods of collecting rumen fluid are by esophageal tubing on intact animals or from slaughtered animals. The use of feces or cultures as alternative inoculants has been compared to fresh rumen fluid but only for total gas production/feed degradation [64]. Such alternative sources of inoculum are not expected to be applicable for estimation of CH4 production because of the complexity of the microbial ecosystem of the rumen.
Two studies comparing IVGPT measurements of CH4 production to the SF6-technique and the respiration chamber technique, respectively, show good agreement between the “whole animal”-techniques and IVGPT [62,65]. Results from other studies reporting both in vitro and in vivo give examples of both good agreement between methods as well as the opposite [66,67].
A clear disadvantage of IVGPT is that it only simulates the ruminal fermentation of feed, not emissions and digestibility by the entire animal. Furthermore, under normal conditions it does not include long-term adaptation of the ruminal microorganisms to the tested feedstuffs. It is common to use rumen fluid from animals on a standard feed ration. During live animal experiments it is common practice to have adaptation periods to new feeds of at least 14 days. The animals’ output is not considered stabile before that. For the methane-producing population of ruminal microbes there are indications that the adaptation period after switching to a new feed is more than 30 days [68].
IVGPT results should therefore always be interpreted with care, but it is a very useful technique e.g., as first approach to test potential feedstuffs and additives or when controlled incubation conditions are needed. The IVGP results can then be used to optimize larger and more expensive whole-animal experiments.

5. The CO2 Technique

A newly developed method for estimating methane emissions from livestock is based on the use of CO2 as a tracer gas [69]. Instead of using externally added SF6, the naturally emitted CO2 is used to quantify CH4 emission. The CH4/CO2-ratio in the production of air of the animal(s) in question is measured at regular intervals and combined with the calculated total daily CO2 production of the animal(s). The calculations are the same as for the SF6 tracer technique (Equation (1)), only with CO2 as the tracer gas instead of SF6.
The use of CO2 as a quantifier gas is based on knowledge compiled over more than 100 years from experiments measuring feed requirements and feed composition. The measured feed intake can be converted to heat-production, and there is a close relationship between heat- and CO2-production [70,71,72]. Animals at maintenance are thus emitting 1 L CO2 per 21.5–22.0 KJ of heat produced. Corrections can be made for lactating animals or animals gaining weight. The relation between heat production and CO2 production is partly related to the amount of fat deposited or mobilized and can in practice be as low as 20.0 KJ per L CO2 when large amounts of feed carbohydrates are converted to fat as in high yielding dairy cows. The total CO2 production from stables with different animals, e.g., lactating dairy cows, dry cows and heifers, has likewise been determined by researchers working with ventilation [73].
The CO2 method can be used to quantify methane production under different circumstances. Two examples are the total CH4 production from a whole stable with dairy cows [74] and individual estimates for cows visiting an automated milking system (AMS) [75]. A comparison with respiration chamber measurements has recently been published [76].
The expiration air of cattle contains CO2 and CH4 in concentrations 100 and 1000 times higher than the concentrations in atmospheric air, respectively. Therefore it is only necessary to have 5–10% of the animal’s breath in the air being analyzed. This can easily be achieved in a stable or when individual cows visit an AMS. The method can potentially be developed for application to grazing cattle. As about 95% of CH4 emissions from cows are excreted with expiration air [52], the small amounts excreted through the rectum can be ignored.
Measurements of CH4 and CO2 can be conducted with different types of analyzers - so far the CO2 method has used a portable equipment called Gasmet (Gasmet Tehcnologies Oy, Helsinki, Finland), which is based on infrared measurements (Fourier Transformed Infrared (FTIR), [77]) (Figure 5).
The equipment is portable and can easily be used under very different circumstances. The main disadvantage is that the CO2 production of animals is influenced by the same things as the animals’ requirement for energy. This means that the size, activity and production of the animal influences the amount of CO2 produced. This is not of importance when for instance the quantitative effect of different feeds or supplements on the methane production of different groups of equal animals is going to be established, but may produce larger errors when the quantitative methane production is going to be established on an individual animal or on different groups of animals. Combined with the only partial sampling of animal breath the estimation of individual animal emissions with the CO2-technique is expected to produce higher day-to-day variation than observed in respiration chambers. Fortunately, the method can easily be applied to many animals making it possible to reduce the standard error of means from experiments.
Figure 5. The portable Gasmet (a) used for measuring CH4 and CO2 concentrations in an automated milking system (b).
Animals 02 00160 g005

6. Other Measuring Techniques

6.1. Methods Based on Whole Buildings or Areas

The methods described to far are focused on single animal measurements that fit well within a traditional experimental agricultural setup and are well suited for comparing different treatments. Unfortunately, all these methods will affect animal behavior to some extent, and they are not suitable for measuring e.g., interactions between methane emission and barn design, exchange of methane between grazing animals and their surroundings or whole farm emissions.
During the last decades methods suitable for estimating methane emission both from barns, whole farms, feedlots and paddocks have been develop. For reviews see [3,78,79]. The methods can roughly be divided into non-micrometeorological techniques and micrometeorological techniques. Micrometeorological methods are defined as measuring fluxes of gas in the free atmosphere and relating these fluxes to animal emissions [78].
Two non-micrometeorological methods, which focus on systems rather than individual animals are described by [78]. The first is the external tracer ratio technique, where a tracer is released in the paddock or barn, and the concentrations of tracer and methane are measured in the surroundings [80,81,82]. The second technique is mass balance in barns, where ventilation rate and concentrations in inlet and outlet are used to estimate the emission [83].
The micrometeorological methods are based on measurements of wind velocity and methane concentration, but the number of measuring points and the theories used to calculate emission rates differ between methods. For further details of different technique see: Mass balance [80,84,85], Flux-gradient technique [84,86], Eddy covariance [87,88], Lagrangian dispersion analyses [89,90,91]. These methods are however influenced by instabilities like non-steady state wind or movement of point-emission sources. The recovery of released CH4 in a system tested by McGinn et al. [92] was measured to be 77%. It is also difficult to relate the CH4 production to feed intake for grazing animals, as most methods for assessing feed intake during grazing are associated with errors [93]. A recent study comparing a micrometeorological method with measurements in open-circuit respiration chambers does however show similar values of CH4 production per kg DMI [92].
The micrometeorological methods are still new and further development and documentation on reliability is needed, but the methods are valuable in evaluating whole dairy systems and interactions between animals and landscape.

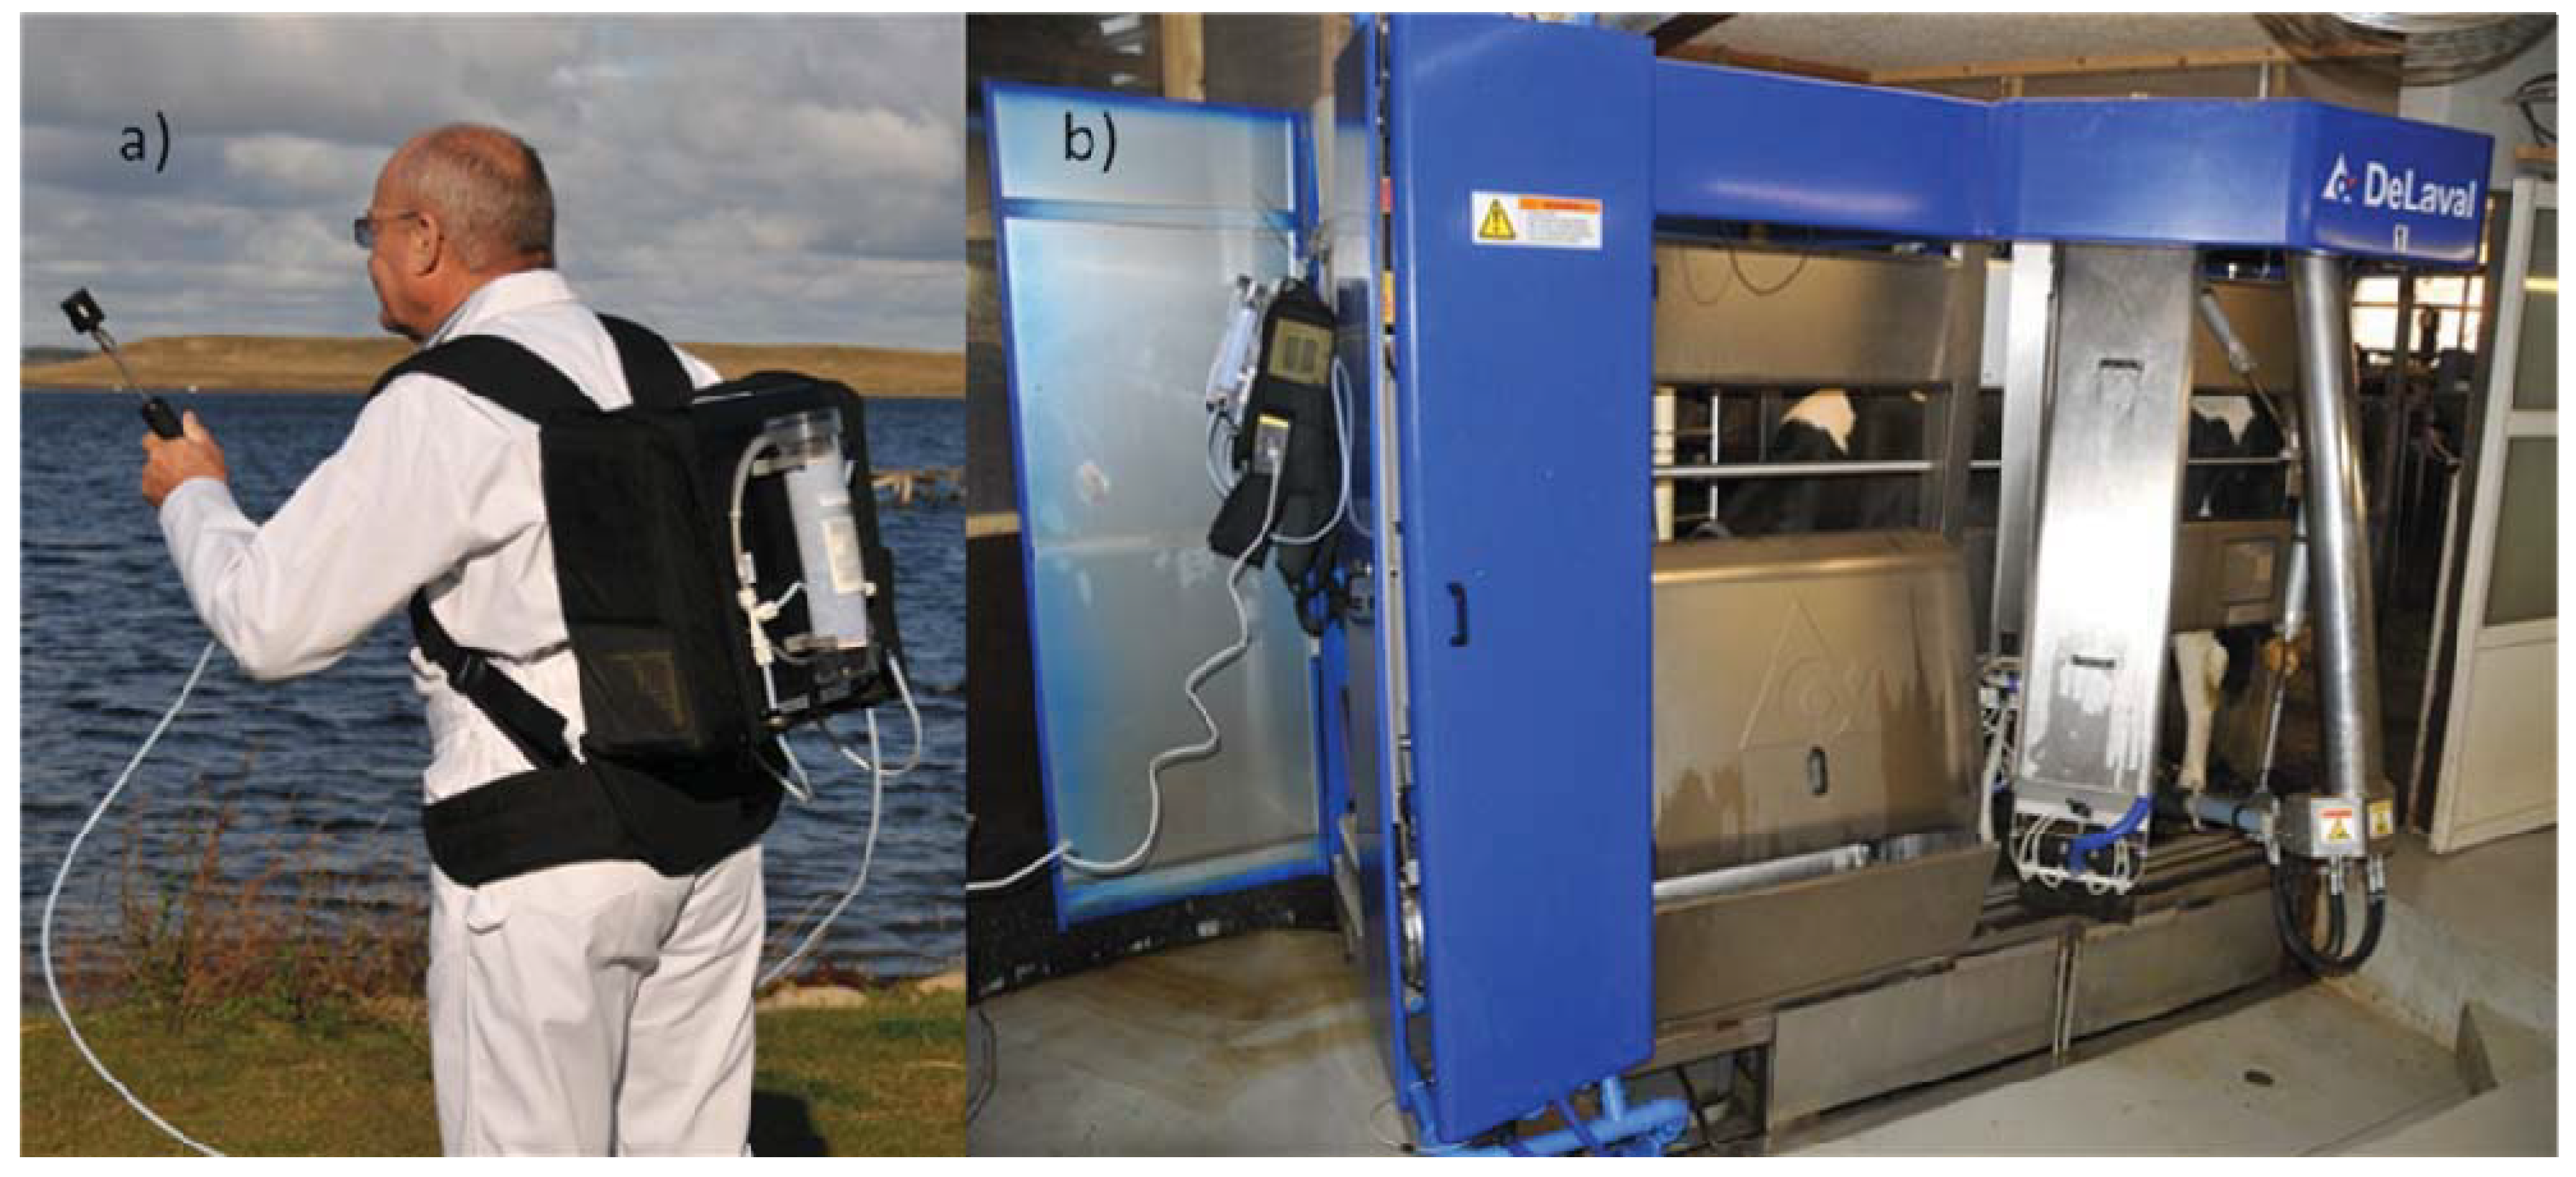
6.2. Combined Feeder and CH4 Analyzer

A newly patented system called GreenFeedTM (C-lock Inc., USA) combines an automatic feeding system with measurements of CH4 and CO2. The animals entering an automatic feeding system are recognized and concentrations of CH4 and CO2 are measured. Air is continuously pumped through the automatic feeding system to quantify flow and thereby CH4 and CO2 emitted during eating. To ascertain how much of the expiration air is collected the system can perform recovery experiments automatically by releasing small amounts of a tracer gas inside the feeders head cabin. Possible applications are inside AMSs, in conventional tie-stalls, and for grazing animals fed supplements. A disadvantage is that it only measures methane emissions when the animals have their head in the feeder and are eating. Correlations with whole-day emissions must therefore be examined thoroughly.

6.3. Proxy Methods

Another type of method is being developed with the aim of examining many animals at a time without invasive intervention and large experimental set-ups. These so-called proxy-methods correlate methane emissions with parameters that can be measured in easily obtainable biological samples like milk or feces. Several studies have examined the fatty acid profiles of milk and correlated these with methane production of the animals. The theory is that certain fatty acids or fats in the milk or feces are correlated with either the feed composition [94] or the amount of methanogenic archae in the rumen [95], which both have an effect on the production of methane. Two recent studies [96,97] indicate some correlations between milk fatty acid profiles and methane emissions, but further studies are required.

7. Models for Predicting Methane Production

In many cases measurements are just not possible e.g., when total national emissions have to be assessed. Therefore there is a global interest in being able to predict methane production using models based on existing data, such as animal characteristics (e.g., weight, breed), feed characteristics (e.g., nutrient and energy content), intake data (dry matter or nutrients) or digested nutrients. Such models often use data derived from experiments conducted with cattle in respiration chambers, but newer techniques for measuring methane, such as the SF6 or CO2 technique, have also been applied in recent years.

7.1. IPCC

Models for estimating cattle methane emissions have been developed which can be used to quantify the production of methane globally, nationally, or locally on the farm. The standard model usually used for calculating cattle methane emissions is issued by the IPCC (the Intergovernmental Panel on Climate Change). The IPCC, often also referred to as the “UN’s Climate Panel”, is an independent international scientific body established by the World Meteorological Organization and the United Nations Environment Programme (UNEP).
The IPCC’s most recent guidelines for estimating enteric methane emission are from 2006. The IPCC operates with three different levels to estimate greenhouse gas emissions [98]. These three levels depend on the quality of the database established in the country in question, and are known as Tiers 1, 2 and 3, where Tier 1 is the simplest calculation method and Tier 3 the most complex and data-dependent method. The three methods are based on the proportion of the cow’s gross energy intake (GE) excreted as methane. Tier 1 thus utilises an emission factor of 6.5% (Ym) and an assumed GE, which results in an estimated methane production of 109 kg/cow/year in Western Europe [98]. When using Tier 2, and especially Tier 3, more information is required to determine Ym, e.g., in relation to the digestibility and nutrient content of the feed. At the present time Ym is mainly determined experimentally from measurements made in respiration chambers, but these will be updated as new techniques come into use. Models are also required to determine the feed and energy intake in relation to the cattle’s production in a given region/country. Furthermore, the use of an official Tier 3 method also requires scientific documentation via an article published in an international journal [98].
Countries participating in the Kyoto protocol submit an annual status report on their national GHG emissions to the UNFCCC (the United Nations Framework Convention on Climate Change). As standard, a CH4 emission coefficient of 6.5% of GE is used for cattle. Exempt from this are intensively fed cattle, defined as cattle receiving >90% concentrate, for which Ym is determined to be 3% of GE [98].
As an example, the calculations of the Danish CH4 emissions employ an Ym of 5.94% for dairy cattle instead of the standard emission coefficient of 6.5% of GE. This Danish factor is determined from calculations using the Karoline model [99], based on feed plans from approximately 15% of Danish dairy cows and the area of fodder beets in Denmark [100].

7.2. Methane Models

Table 1 presents an overview of some recent methane models, which have been developed from measurements in respiration chambers. The table gives an impression of the considerable differences between the existing models in terms of the complexity of input required. Thus, the model developed in [21] only requires the proportion of roughage in the ration, while the model in [101] requires digested amounts of different nutrients. In practice, the latter model can thus only be used in conjunction with a digestion model such as that included in the NorFor feed evaluation system [102]. Several of the models in Table 1 have been developed on the basis of data containing information about the nutrient content of the feedstuffs. However, only few investigations have found that nutrient information improves the ability of the models to predict methane production [101], while e.g., [21] and [103] have found no such benefits of including nutrient information.
Table 1. Predictive methane equations developed from measurements in respiration chambers.
ReferenceEquationR2N
IPCC [98] aMethane (kg/dag) = GE (MJ/d) × Ym/55.65
Yan et al. [103] bMethane (L/d) = 47.8 × DMI − 0.76 × DMI2 − 41 (kg/d)0.75315
Yan et al. [103] bcMethane (L/d) = 0.34 × BW (kg) + 19.7 × DMI (kg/d) + 120.77315
Kirchgessner et al. [104] dMethane (g/d) = 63 + 79 × CF + 10 × NFE + 26 × CP – 212 × Cfat (kg/d)0.6924
Jentsch et al. [101] deMethane (kJ/d) = 1.62 × d_CP − 0.38 × d_Cfat + 3.78 × d_CF + 1.49 × d_NFE +1142 (g/d)0.90337
Ellis et al. [21]Methane (MJ/d) = 0.14 × forage (%) + 8.60.5689
Mills et al. [105] fMethane (MJ/d) = 0.07 × ME (MJ/d) + 8.250.55159
Mills et al. [105] bMethane (MJ/d) = 0.92 × DMI (kg/d) + 5.930.60159
Mills et al. [105] bMethane (MJ/d) = 10.3 × forage (%) + 0.87 × DMI (kg/d) + 1.10.61159
Grainger et al. [26] bMethane (g/d) = 18.5 × DMI (kg/d) − 9.50.5616
a GE = gross energy intake; Ym = emission factor; b DMI = dry matter intake; c BW = body weight; d CF = crude fibre; NFE = N-free extract; CP = crude protein; Cfat = crude fat; e The equation is based on digested amounts which is designated with “d”; f ME = metabolizable energy intake.
A comparison of the above mentioned models leads to large differences in the estimates of methane emission, as was also found with a number of other models in a previous study [106]. The model estimates are also associated with error. The best equations developed by [21] for beef cattle, dairy cattle and beef+dairy cattle had prediction errors (RMSPE) of 14.4, 20.6 and 28.2%, respectively. The models described in [105] had RMSPE between 6.4% and 11.6% when evaluated with the dataset based on which they were developed, but when evaluated with independent datasets the RMSPE rose to 20.6% to 35.3%.
In the NorFor feed evaluation system, a wide range of nutrients consumed by the cow is calculated from a given ration, and the digested amounts of nutrients in the various digestive sections are available [102]. Work is underway by the Research and Development group of the NorFor co-operation to incorporate a predictive equation for methane into NorFor, whereby the methane emission will be estimated at ration level in connection with feed planning. This equation is being developed on the basis of recent methane studies undertaken by research institutions in Denmark, Norway and Sweden.

8. Comparison of Methods

It is thus evident, that several very different methods exist for measuring and estimating methane emissions from cattle. The best choice of method will very much depend on the purpose and the exact circumstances of each experiment. Table 2 contains some general parameters of the major methods described in this review.
Table 2. Comparison of different methods for measuring and estimating methane emissions from cattle.
Method parametersChambersSF6 techniqueIn vitro gas productionCO2 techniqueIPCCOther models
Prerequisites (except for instruments) Access to rumen fluidInformation about CO2 production. Can be calculated [70].Information about e.g., number of animals, intake of gross energyModel dependent, e.g., dry matter intake, nutrient composition
Aspects of feeding which can be investigated
Feeding levelYesYesNoYesNoYes—some models
Physical form of the feedYesYesNo (all feed is ground)YesNoNo
Chemical composition of dietYesYesYesYesNoYes—some models
Supplementation of feed additivesYesYesYesYesNoNo
Influence on animals
Fixation neededYesNo*Depends on aim**
Animal needs to carry equipment NoYes*Depends on aim**
Can be used in milking parlor or automatic milkingNoNo*Yes**
Method estimates
Individual animalsYesYesNoYesYesYes
Within animal variationYesYesNoYesNoNo
Between animal variationYesYesNoYesNoNo
Daily variationYesNoNoYesNoNo
Time resolution 1A few minutes to hours8–24 hMin. 6 hSmall intervals of a few minutes**
Output format
Basicl CH4/day/animall CH4/day/animall CH4/kg dry matterl CH4/day/animall CH4/day/animall CH4/day/animal
Relative to dry matter intakeYesYesYesYesYesYes
Relative to digested organic matterYesYesYesYesNoYes, depends on model
Relative to digested NDFYesYesYesYesNoYes
Relative to milk yieldYesYesNoYes*Yes
Relative to gross energy intakeYesYesNoYes*Yes
* Not relevant for the method; 1 Will depend on individual system settings.
The chamber method has good accuracy and precision for assessing the daily production of CH4 from housed animals but limited capacity with regards to the number of animals. It is therefore best suited for comparison of distinct mitigation strategies in crossover or Latin square experiments. It also provides information on the daily variation in methane emission. It is not applicable to free ranging animals, and because of the limited capacity and the need for training of animals, it cannot be recommended for screening animals, e.g., for assessment of heredity of methane emission.
The SF6 technique has the clear advantage of being suitable for free ranging animals, which constitute a large proportion of livestock worldwide. Like the chamber method it gives good estimates of the between animal and within animal variation in emissions and is also well suited for comparison of distinct mitigation strategies. The residual variation on measurements is higher than with the chamber method, but it is possible to employ more animals per experiment, which provides a better statistical foundation for testing hypotheses. The animals need to carry equipment around and must therefore be selected and trained before the experiments start.
Screening large amounts of feeds and additives is the best application of the in vitro method. This method has a large capacity, making it possible to test many different combinations of feedstuffs and e.g., doses of additives. It is therefore well suited for initial screening of potential treatments before in vivo experiments are initiated. The physical, chemical and microbial environment can be kept more constant between in vitro repeats (within runs) than between individual animals in chamber or SF6 experiments. However, the method only simulates ruminal fermentation and cannot take into account physical factors like passage rate of digesta or physical form of the feed
The CO2 technique is a newly developed approach to estimation of methane emissions from cattle. It can be used under different conditions e.g., estimation of the heredity of methane emission potential by individual measurements on large amounts of animals or for the overall estimation of herd-level emissions from a barn. To estimate total CH4 emission this method relies on calculated values of total CO2 production. It will therefore be less precise than the chamber methods for estimating individual animal emissions. For comparison of mitigation strategies this can however be compensated by increasing the number of animals.
Other methods like the micrometeorological and the proxy techniques are also on the way and may prove very useful in the future.
Finally, the mathematical models are essential for estimating national or global emissions. They are easy to apply and will give estimates of the average emission of the unit(s) in question. The models are based on experimental data and as such are limited in their application by the limitations on the experimental data. A model based on respiration chamber experiments can therefore not be directly applied to free ranging cattle. Furthermore, our understanding of ruminal digestion is not complete, so neither are the models of it. Therefore a continuous need exists for more data to increase our knowledge of this complex system.

9. Conclusions

Many good methods for measuring and estimating methane emissions from ruminants are already in use and new ones are being developed. None of them are however flawless and they all require careful consideration before application. In this context a thorough knowledge of the advantages and disadvantages of experimental methods is extremely important, both when planning experiments and when interpreting own results and the published findings of other researchers.

Acknowledgments

The authors kindly acknowledge the valuable feedback on the manuscript obtained from Peter Lund and Troels Kristensen, Aarhus University.

Conflict of Interest

The authors declare no conflicts of interest.

References

  1. IPCC. Climate Change 2007: Mitigation of Climate Change. IPCC Fourth Assessment Report (AR4). 2007. Available online: http://www.ipcc.ch/publications_and_data/ar4/wg3/en/contents.html (accessed on 30 January 2012).
  2. IPCC. Climate change 2007: The Physical Science Basis. IPCC Fourth Assessment Report (AR4). 2007. Available online: http://www.ipcc.ch/publications_and_data/ar4/wg1/en/contents.html (accessed on 30 January 2012).
  3. Lassey, K.R. Livestock methane emission: From the individual grazing animal through national inventories to the global methane cycle. Agric. Forest Meteorol. 2007, 142, 120–132. [Google Scholar]
  4. Johnson, D.E.; Ferrell, C.L.; Jenkins, T.G. The history of energetic efficiency research: Where have we been and where are we going? J. Anim. Sci. 2003, 81, E27–E38. [Google Scholar]
  5. Mclean, J.A.; Tobin, G. Animal and Human Calorimetry; Cambridge University Press: Cambridge, UK, 1987. [Google Scholar]
  6. Wainman, F.W.; Blaxter, K.L. Closed-Circuit Respiration Apparatus for the Cow and Steer. In Proceedings of the 1st Symposium in Energy Metabolism, Principles, Methods and General Aspects, Copenhagen, Denmark, 15–19 September 1958; pp. 80–84.
  7. Brown, D.; Cole, T.J.; Dauncey, M.J.; Marrs, R.W.; Murgatroyd, P.R. Analysis of gaseous exchange in open-circuit indirect calorimetry. Med. Biol. Eng. Comput. 1984, 22, 333–338. [Google Scholar] [CrossRef] [PubMed]
  8. Derno, M.; Elsner, H.G.; Paetow, E.A.; Scholze, H.; Schweigel, M. Technical note: A new facility for continuous respiration measurements in lactating cows. J. Dairy Sci. 2009, 92, 2804–2808. [Google Scholar] [CrossRef] [PubMed]
  9. Miller, W.H.; Koes, R.M. Construction and operation of an open-circuit indirect calorimetry system for small ruminants. J. Anim. Sci. 1988, 66, 1042–1047. [Google Scholar] [PubMed]
  10. Bryant, A.M.; Hughes, J.W.; Hutton, J.B.; Newth, R.P.; Parr, C.R.; Trigg, T.E.; Young, J. Calorimetric facilities for dairy cattle at Ruakua Animal Research Station. Proc. N. Z. Soc. Anim. Prod. 1977, 37, 158–162. [Google Scholar]
  11. Pinares-Patiño, C.S.; Lassey, K.R.; Martin, R.J.; Molano, G.; Fernandez, M.; MacLean, S.; Sandoval, E.; Luo, D.; Clark, H. Assessment of the sulphur hexafluoride (SF6) tracer technique using respiration chambers for estimation of methane emissions from sheep. Anim. Feed Sci. Technol. 2011, 166–167, 201–209. [Google Scholar]
  12. Yanez-Ruiz, D.R.; Hart, K.J.; Martin-Garcia, A.I.; Ramos, S.; Newbold, C.J. Diet composition at weaning affects the rumen microbial population and methane emissions by lambs. Aust. J. Exp. Agric. 2008, 48, 186–188. [Google Scholar] [CrossRef]
  13. Klein, L.; Wright, A.D.G. Construction and operation of open-circuit methane chambers for small ruminants. Aust. J. Exp. Agric. 2006, 46, 1257–1262. [Google Scholar] [CrossRef]
  14. Place, S.E.; Pan, Y.; Zhao, Y.; Mitloehner, F.M. Construction and operation of a ventilated hood system for measuring greenhouse gas and volatile organic compound emissions from cattle. Animals 2011, 1, 433–446. [Google Scholar] [CrossRef]
  15. Takahashi, J.; Chaudhry, A.S.; Beneke, R.G.; Young, B.A. An open-circuit hood system for gaseous exchange measurements in small ruminants. Small Rumin. Res. 1999, 32, 31–36. [Google Scholar] [CrossRef]
  16. Kelly, J.M.; Kerrigan, B.; Milligan, L.P.; McBride, B.W. Development of a mobile, open-circuit indirect calorimetry system. Can. J. Anim. Sci. 1994, 74, 65–71. [Google Scholar] [CrossRef]
  17. Murray, P.J.; Chadwick, D.C.; Newbold, C.J.; Lockyer, D.R. Measurement of Methane from Grazing Animals—The Tunnel Method. In Measuring Methane Production from Ruminants; Makkar, H.P.S., Vercoe, P.E., Eds.; Springer: Dordrecht, The Netherlands, 2007; pp. 105–109. [Google Scholar]
  18. Murray, P.J.; Moss, A.; Lockyer, D.R.; Jarvis, S.C. A comparison of systems for measuring methane emissions from sheep. J. Agric. Sci. 1999, 133, 439–444. [Google Scholar] [CrossRef]
  19. Lockyer, D.R.; Jarvis, S.C. The measurement of methane losses from grazing animals. Environ. Pollut. 1995, 90, 383–390. [Google Scholar] [CrossRef] [PubMed]
  20. Johnson, K.A.; Johnson, D.E. Methane emissions from cattle. J. Anim. Sci. 1995, 73, 2483–2492. [Google Scholar] [PubMed]
  21. Ellis, J.L.; Kebreab, E.; Odondo, N.E.; McBride, B.W.; Okine, E.K.; France, J. Prediction of methane production from dairy and beef cattle. J. Dairy Sci. 2007, 90, 3456–3467. [Google Scholar] [CrossRef] [PubMed]
  22. Johnson, K.; Huyler, M.; Westberg, H.; Lamb, B.; Zimmerman, P. Measurement of methane emissions from ruminant livestock using a SF6 tracer technique. Environ. Sci. Technol. 1994, 28, 359–362. [Google Scholar] [CrossRef] [PubMed]
  23. Okelly, J.C.; Spiers, W.G. Effect of monensin on methane and heat productions of steers fed lucerne hay either ad-libitum or at the rate of 250 g/hour. Aust. J. Agric. Res. 1992, 43, 1789–1793. [Google Scholar] [CrossRef]
  24. Johannes, M.; Lund, P.; Weisbjerg, M.R.; Hellwing, A.L.F.; Hvelplund, T. The effect of different physical forms of rapeseed as fat supplement on rumen NDF digestion and methane emission in dairy cows. Adv. Anim. Biosci. 2011, 2, 516. [Google Scholar]
  25. Blaxter, K.L.; Clappert, J.L. Prediction of amount of methane produced by ruminants. Br. J. Nutr. 1965, 19, 511–522. [Google Scholar] [CrossRef] [PubMed]
  26. Grainger, C.; Clarke, T.; Mcginn, S.M.; Auldist, M.J.; Beauchemin, K.A.; Hannah, M.C.; Waghorn, G.C.; Clark, H.; Eckard, R.J. Methane emissions from dairy cows measured using sulfur hexafluoride (SF6) and chamber techniques. J. Dairy Sci. 2007, 90, 2755–2766. [Google Scholar] [CrossRef] [PubMed]
  27. Blaxter, K.L. Techniques in energy metabolism studies and their limitations. Proc. Nutr. Soc. 1967, 26, 86–96. [Google Scholar] [CrossRef] [PubMed]
  28. Thorbek, G. Studies on Protein and Energy Metabolism in Growing Calves; Landhusholdingsselskabets forlag: Copenhagen, Denmark, 1980. [Google Scholar]
  29. Zimmerman, P.R. System for Measuring Metabolic Gas Emissions from Animals. US Patent 5,265,618, 30 December 1993. [Google Scholar]
  30. Lassey, K.R.; Pinares-Patiño, C.S.; Martin, R.J.; Molano, G.; McMillan, A.M.S. Enteric methane emission rates determined by the SF6 tracer technique: Temporal patterns and averaging periods. Anim. Feed Sci. Technol. 2011, 166–167, 183–191. [Google Scholar] [CrossRef]
  31. Lassey, K.R.; Ulyatt, M.J.; Martin, R.J.; Walker, C.F.; Shelton, I.D. Methane emissions measured directly from grazing livestock in New Zealand. Atmos. Environ. 1997, 31, 2905–2914. [Google Scholar] [CrossRef]
  32. Mcginn, S.M.; Chung, Y.H.; Beauchemin, K.A.; Iwaasa, A.D.; Grainger, C. Use of corn distillers’ dried grains to reduce enteric methane loss from beef cattle. Can. J. Anim. Sci. 2009, 89, 409–413. [Google Scholar] [CrossRef]
  33. McCaughey, W.P.; Wittenberg, K.; Corrigan, D. Methane production by steers on pasture. Can. J. Anim. Sci. 1997, 77, 519–524. [Google Scholar] [CrossRef]
  34. Grainger, C.; Williams, R.; Clarke, T.; Wright, A.D.G.; Eckard, R.J. Supplementation with whole cottonseed causes long-term reduction of methane emissions from lactating dairy cows offered a forage and cereal grain diet. J. Dairy Sci. 2010, 93, 2612–2619. [Google Scholar] [CrossRef]
  35. Goopy, J.P.; Hegarty, R.S. Repeatability of methane production in cattle fed concentrate and forage diets. J. Anim. Feed Sci. 2004, 13, 75–78. [Google Scholar]
  36. Tekippe, J.A.; Hristov, A.N.; Heyler, K.S.; Cassidy, T.W.; Zheljazkov, V.D.; Ferreira, J.F.S.; Karnati, S.K.; Varga, G.A. Rumen fermentation and production effects of Origanum vulgare L. leaves in lactating dairy cows. J. Dairy Sci. 2011, 94, 5065–5079. [Google Scholar] [CrossRef] [PubMed]
  37. Patel, M.; Wredle, E.; Borjesson, G.; Danielsson, R.; Iwaasa, A.D.; Sporndly, E.; Bertilsson, J. Enteric methane emissions from dairy cows fed different proportions of highly digestible grass silage. Acta Agric. Scand. A Anim. 2011, 61, 128–136. [Google Scholar]
  38. Nes, S.K.; Garmo, T.; Chaves, A.V.; Harstad, O.M.; Iwaasa, A.D.; Krizsan, S.J.; Beauchemin, K.A.; McAllister, T.A.; Norell, L.; Thuen, E.; Vedres, D.; Volden, H. Effects of Neutral Detergent Fiber (aNDF) Digestibility of Grass Silage on Enteric Methane Emissions from Dairy Cows. In Proceedings of Inteternational Conference Greenhouse Gases in Animal Agriculture, Banff, AB, Canada, 3 October 2010; p. 110.
  39. Lester, D.; Greenberg, L.A. The toxicity of sulfur hexafluoride. Arch. Ind. Hyg. Occup. Med. 1950, 2, 348–349. [Google Scholar] [PubMed]
  40. Johnson, K.A.; Huyler, M.; Pierce, C.S.; Westberg, H.; Lamb, B.; Zimmerman, P. The use of SF6 as an inert gas tracer for use in methane measurements. J. Anim. Sci. 1992, 70, 302. [Google Scholar]
  41. Johnson, K.A.; Westberg, H.H.; Michal, J.J.; Cossalman, M.W. The SF6 Tracer Technique: Methane Measurement from Ruminants. In Measuring Methane Production from Ruminants; Makkar, H.P.S., Vercoe, P.E., Eds.; Springer: Dordrecht, The Netherlands, 2007. [Google Scholar]
  42. Cécile, M.; Koolaard, J.; Rochette, Y.; Clark, H.; Jouany, J.P.; Pinares-Patiño, C.S. Effect of release rate of SF6 Tracer on Methane and Carbon Dioxide Emission Estimates Based on Ruminal and Breath Gas Samples. In Proceedings of 4th International Conference on Greenhouse Gases Animal Agriculture, Banff, AB, Canada, 3 October 2010; p. 85.
  43. Coates, T.; Farr, B.; Beauchemin, K.A.; Mcginn, S.M. Can the SF6 Tracer Gas Technique be Used to Accurately Measure Methane Production from Ruminally Cannulated Cattle. In Proceedings of 4th International Conference on Greenhouse Gases Animal Agriculture, Banff, AB, Canada, 3 October 2010; p. 86.
  44. Pinares-Patiño, C.S. Methane Emission from Forage-Fed Sheep, a Study of Variation Between Animals. Ph.D. Thesis, Animal and Biomedical Sciences, College of Sciences, Massey University, Palmerston, New Zealand, 2000. [Google Scholar]
  45. Pinares-Patiño, C.S.; Clark, H. Reliability of the sulfur hexafluoride tracer technique for methane emission measurement from individual animals: An overview. Aust. J. Exp. Agric. 2008, 48, 223–229. [Google Scholar] [CrossRef]
  46. Ulyatt, M.J.; Baker, S.K.; McCrabb, G.J.; Lassey, K.R. Accuracy of SF6 tracer technology and alternatives for field measurements. Aust. J. Agric. Res. 1999, 50, 1329–1334. [Google Scholar] [CrossRef]
  47. Lassey, K.R.; Walker, C.F.; McMillan, A.M.S.; Ulyatt, M.J. On the performance of SF6 permeation tubes used in determining methane emission from grazing livestock. Chemosphere Glob. Chang. Sci. 2001, 3, 367–376. [Google Scholar] [CrossRef]
  48. Vlaming, J.B. Qantifying Variation in Estimated Methane Emission from Ruminants Using the SF6 Tracer Technique. Ph.D. Thesis, Massey Univesity, Palmerton North, New Zealand, 2007. [Google Scholar]
  49. Pinares-Patiño, C.S.; Machmuller, A.; Molano, G.; Smith, A.; Vlaming, J.B.; Clark, H. The SF6 tracer technique for measurements of methane emission from cattle—Effect of tracer permeation rate. Can. J. Anim. Sci. 2008, 88, 309–320. [Google Scholar] [CrossRef]
  50. Williams, S.R.O.; Moate, P.J.; Hannah, M.C.; Ribaux, B.E.; Wales, W.J.; Eckard, R.J. Background matters with the SF6 tracer method for estimating enteric methane emissions from dairy cows: A critical evaluation of the SF6 procedure. Anim. Feed Sci. Technol. 2011, 170, 265–276. [Google Scholar] [CrossRef]
  51. Johnson, K.A.; Huyler, M.T.; Westberg, H.H.; Lamb, B.K.; Zimmerman, P. Measurements of Methane Emissions from Ruminant Livestock Using a Sulfur Hexafluoride Tracer Technique. In Proceedings of 13th Symposium on Energy Metabolism of Farm Animals Aguilera, Mojácar, Spain, 18–24 September 1994; pp. 335–338.
  52. Murray, R.M.; Bryant, A.M.; Leng, R.A. Rates of production of methane in rumen and large-intestine of sheep. Br. J. Nutr. 1976, 36, 1–14. [Google Scholar] [CrossRef] [PubMed]
  53. Mcginn, S.M.; Beauchemin, K.A.; Iwaasa, A.D.; McAllister, T.A. Assessment of the sulfur hexafluoride (SF6) tracer technique for measuring enteric methane emissions from cattle. J. Environ. Qual. 2006, 35, 1686–1691. [Google Scholar] [CrossRef] [PubMed]
  54. Pinares-Patiño, C.S.; D’Hour, P.; Jouany, J.P.; Martin, C. Effects of stocking rate on methane and carbon dioxide emissions from grazing cattle. Agric. Ecosyst. Environ. 2007, 121, 30–46. [Google Scholar] [CrossRef]
  55. Boadi, D.A.; Wittenberg, K.M.; Kennedy, A.D. Validation of the sulphur hexafluoride (SF6) tracer gas technique for measurement of methane and carbon dioxide production by cattle. Can. J. Anim. Sci. 2002, 82, 125–131. [Google Scholar] [CrossRef]
  56. Pinares-Patiño, C.S.; Holmes, C.W.; Lassey, K.R.; Ulyatt, M.J. Measurement of methane emission from sheep by the sulphur hexafluoride tracer technique and by the calorimetric chamber: Failure and success. Animal 2008, 2, 141–148. [Google Scholar] [CrossRef] [PubMed]
  57. Fredeen, A.H.; Cooper, S.; Tate, M.; Main, M.; Yuill, J. Comparison of whole body and breath- sampling methods of measuring methane emission in dairy cows. Can. J. Anim. Sci. 2004, 84, 774. [Google Scholar]
  58. Rymer, C.; Huntington, J.A.; Williams, B.A.; Givens, D.I. In vitro cumulative gas production techniques: History, methodological considerations and challenges. Anim. Feed Sci. Technol. 2005, 123–124, 9–30. [Google Scholar] [CrossRef]
  59. Pellikaan, W.F.; Hendriks, W.H.; Uwimana, G.; Bongers, L.J.G.M.; Becker, P.M.; Cone, J.W. A novel method to determine simultaneously methane production during in vitro gas production using fully automated equipment. Anim. Feed Sci. Technol. 2011, 168, 196–205. [Google Scholar] [CrossRef]
  60. Navarro-Villa, A.; O’Brien, M.; Lopez, S.; Boland, T.M.; O’Kiely, P. Modifications of a gas production technique for assessing in vitro rumen methane production from feedstuffs. Anim. Feed Sci. Technol. 2011, 166–167, 163–174. [Google Scholar] [CrossRef]
  61. Blümmel, M.; Ørskov, E.R. Comparison of in vitro gas production and nylon bag degradability of roughages in predicting feed intake in cattle. Anim. Feed Sci. Technol. 1993, 40, 109–119. [Google Scholar] [CrossRef]
  62. Bhatta, R.; Tajima, K.; Takusari, N.; Higuchi, K.; Enishi, O.; Kurihara, M. Comparison of sulfur hexafluoride tracer technique, rumen simulation technique and in vitro gas production techniques for methane production from ruminant feeds. Int. Congr. Ser. 2006, 1293, 58–61. [Google Scholar] [CrossRef]
  63. Cornou, C.; Hindrichsen, I.K.; Worgan, H.; Bakewell, E.; Yáñez Ruiz, D.R.; Abecia, L.; Tagliapietra, F.; Cattani, M.; Storm, I.M.L.D.; Ritz, C.; Hansen, H.H. A ring test of a wireless in vitro gas production system. Anim. Prod. Sci. 2012. submitted. [Google Scholar]
  64. Mould, F.L.; Kliem, K.E.; Morgan, R.; Mauricio, R.M. In vitro microbial inoculum: A review of its function and properties. Anim. Feed Sci. Technol. 2005, 123–124, 31–50. [Google Scholar] [CrossRef]
  65. Bhatta, R.; Enishi, O.; Takusari, N.; Higuchi, K.; Nonaka, I.; Kurihara, M. Diet effects on methane production by goats and a comparison between measurement methodologies. J. Agric. Sci. 2008, 146, 705–715. [Google Scholar] [CrossRef]
  66. Klevenhusen, F.; Zeitz, J.O.; Duval, S.; Kreuzer, M.; Soliva, C.R. Garlic oil and its principal component diallyl disulfide fail to mitigate methane, but improve digestibility in sheep. Anim. Feed Sci. Technol. 2011, 166–167, 356–363. [Google Scholar] [CrossRef]
  67. Patra, A.K.; Saxena, J. A new perspective on the use of plant secondary metabolites to inhibit methanogenesis in the rumen. Phytochemistry 2010, 71, 1198–1222. [Google Scholar] [CrossRef] [PubMed]
  68. Williams, Y.J.; Popovski, S.; Rea, S.M.; Skillman, L.C.; Toovey, A.F.; Northwood, K.S.; Wright, A.D. A vaccine against rumen methanogens can alter the composition of archaeal populations. Appl. Environ. Microbiol. 2009, 75, 1860–1866. [Google Scholar] [CrossRef] [PubMed]
  69. Madsen, J.; Bjerg, B.S.; Hvelplund, T.; Weisbjerg, M.R.; Lund, P. Methane and carbondioxide ration in excreted air for quantification of the methane prodction from ruminants. Livest. Sci. 2010, 129, 223–227. [Google Scholar] [CrossRef]
  70. Pedersen, S.; Sällvik, K. 4th Report from Working Group on Climatization in Animal Houses—Heat and Moisture Production at Animal and House Level. 2002. Available online: http://www.cigr.org/documents/CIGR_4TH_WORK_GR.pdf (accessed on 30 January 2012).
  71. Chwalibog, A. Husdyrernæring, Bestemmelse af Næringsværdi og Næringsbehov; Faculty of Life Sciences, University of Copenhagen, DSR forlag.: Copenhagen, Denmark, 1991. [Google Scholar]
  72. Elia, M.; Livesey, G. Theory and validity of indirect calorimetry during net lipid synthesis. Am. J. Clin. Nutr. 1988, 47, 591–607. [Google Scholar] [PubMed]
  73. Pedersen, S.; Blanes-Vidal, V.; Jørgensen, H.; Chwalibog, A.; Haeussermann, A.; Heetkamp, M.J.W.; Aarnink, A.J.A. Carbon dioxide production in animal houses: A litterature review. Agric. Eng. Int. CIGR E J. 2008, X, BC 08 008. [Google Scholar]
  74. Bjerg, B.; Zhang, G.; Madsen, J.; Rom, H.B. Methane emission from naturally ventilated livestock buildings can easily be determined from gas concentration measurements. Environ. Monit. Assess. 2012. [Google Scholar] [CrossRef]
  75. Lassen, J.; Løvendahl, P.; Madsen, J. Experiences with large scale breath measurements in dairy cattle in order to select for lower methane production. J. Dairy Sci. 2012, 95, 890–898. [Google Scholar] [CrossRef] [PubMed]
  76. Madsen, J.; Bertelsen, M.F. Methane production by Bennet’s wallabies (Macropus rufogriseus). J. Anim. Sci. 2012. accepted. [Google Scholar]
  77. Teye, F.K.; Alkkiomaki, E.; Simojoki, A.; Pastell, M.; Ahokas, J. Instrumentation, measurement and performance of three air quality measurement systems for dairy buildings. Appl. Eng. Agric. 2009, 25, 247–256. [Google Scholar] [CrossRef]
  78. Harper, L.A.; Denmead, O.T.; Flesch, T.K. Micrometeorological techniques for measurement of enteric greenhouse gas emissions. Anim. Feed Sci. Technol. 2011, 166–167, 227–239. [Google Scholar] [CrossRef]
  79. Denmead, O.T. Approaches to measuring fluxes of methane and nitrous oxide between landscapes and the atmosphere. Plant Soil 2008, 309, 5–24. [Google Scholar] [CrossRef]
  80. Griffith, D.W.T.; Bryant, G.R.; Hsu, D.; Reisinger, A.R. Methane emissions from free-ranging cattle: Comparison of tracer and integrated horizontal flux techniques. J. Environ. Qual. 2008, 37, 582–591. [Google Scholar] [CrossRef] [PubMed]
  81. Kaharabata, S.K.; Schuepp, P.H. Estimating methane emissions from dairy cattle housed in a barn and feedlot using an atmospheric tracer. Environ. Sci. Technol. 2000, 34, 3296–3302. [Google Scholar] [CrossRef]
  82. Marik, T.; Levin, I. A new tracer experiment to estimate the methane emissions from a dairy cow shed using sulfur hexafluoride (SF6). Glob. Biogeochem. Cycles 1996, 10, 413–418. [Google Scholar] [CrossRef]
  83. Demmers, T.G.M.; Burgess, L.R.; Short, J.L.; Philips, V.R.; Clark, J.A.; Wathes, C.M. Ammonia emissions from two mechanically ventilated UK livestock buildings. Atmos. Environ. 1999, 33, 217–227. [Google Scholar] [CrossRef]
  84. Laubach, J.; Kelliher, F.M. Measuring methane emission rates of a dairy cow herd by two micrometeorological techniques. Agric. Forest Meteorol. 2004, 125, 279–303. [Google Scholar] [CrossRef]
  85. Harper, L.A.; Denmead, O.T.; Freney, J.R.; Byers, F.M. Direct measurements of methane emissions from grazing and feedlot cattle. J. Anim. Sci. 1999, 77, 1392–1401. [Google Scholar]
  86. Judd, M.J.; Kellier, F.M.; Ulyatt, M.J.; Lassey, K.R.; Tate, K.R.; Shelton, D.; Harvey, M.J.; Walker, C.F. Net methane emissions from grazing sheep. Glob. Chang. Biol. 1999, 5, 647–657. [Google Scholar] [CrossRef]
  87. Dengel, S.; Levy, P.E.; Grace, J.; Jones, S.K.; Skiba, U.M. Methane emissions from sheep pasture, measured with an open-path eddy covariance system. Glob. Chang. Biol. 2011, 17, 3524–3533. [Google Scholar] [CrossRef]
  88. Baum, K.A.; Ham, J.M.; Brunsell, N.A.; Coyne, P.I. Surface boundary layer of cattle feedlots: Implications for air emissions measurement. Agric. Forest Meteorol. 2008, 148, 1882–1893. [Google Scholar] [CrossRef]
  89. Laubach, J.; Kelliher, F.A. Measuring methane emission rates of a dairy cow herd (II): Results from a backward-Lagrangian stochastic model. Agric. Forest Meteorol. 2005, 129, 137–150. [Google Scholar] [CrossRef]
  90. Flesch, T.K.; Wilson, J.D.; Yee, E. Backward-time lagrangian stochastic dispersion models and their application to estimate gaseous emissions. J. Appl. Meteorol. 1995, 34, 1320–1332. [Google Scholar] [CrossRef]
  91. Flesch, T.K.; Wilson, J.D.; Harper, L.A. Deducing ground-to-air emissions from observed trace gas concentrations: A field trial with wind disturbance. J. Appl. Meteorol. 2005, 44, 475–484. [Google Scholar] [CrossRef]
  92. Tomkins, N.W.; Mcginn, S.M.; Turner, D.A.; Charmley, E. Comparison of open-circuit respiration chambers with a micrometeorological method for determining methane emissions from beef cattle grazing a tropical pasture. Anim. Feed Sci. Technol. 2011, 166–167, 240–247. [Google Scholar] [CrossRef]
  93. Penning, P. Herbage Intake Handbook; British Grassland Society: Warwickshire, UK, 2004. [Google Scholar]
  94. Chilliard, Y.; Martin, C.; Rouel, J.; Doreau, M. Milk fatty acids in dairy cows fed whole crude linseed, extruded linseed, or linseed oil, and their relationship with methane output. J. Dairy Sci. 2009, 92, 5199–5211. [Google Scholar] [CrossRef] [PubMed]
  95. Vlaeminck, B.; Fievez, V.; Cabrita, A.R.J.; Fonseca, A.J.M.; Dewhurst, R.J. Factors affecting odd- and branched-chain fatty acids in milk: A review. Anim. Feed Sci. Technol. 2006, 131, 389–417. [Google Scholar] [CrossRef]
  96. Dijkstra, J.; van Zijderveld, S.M.; Apajalahti, J.A.; Bannink, A.; Gerrits, W.J.J.; Newbold, J.R.; Perdok, H.B.; Berends, H. Relationships between methane production and milk fatty acid profiles in dairy cattle. Anim. Feed Sci. Technol. 2011, 166–167, 590–595. [Google Scholar] [CrossRef]
  97. Montoya, J.C.; Bhagwat, A.M.; Peiren, N.; De Campeneere, S.; De Baets, B.; Fievez, V. Relationships between odd- and branched-chain fatty acid profiles in milk and calculated enteric methane proportion for lactating dairy cattle. Anim. Feed Sci. Technol. 2011, 166–167, 596–602. [Google Scholar] [CrossRef]
  98. IPCC. IPCC Guidelines for National Greenhouse Gas Inventories. 2006. Available online: http://www.ipcc-nggip.iges.or.jp/public/2006gl/vol4.html (accessed on 30 January 2012).
  99. Danfær, A. Methane Emissions from Dairy Cows. In Arbejdsrapport nr. 11 fra Miljøstyrelsen; Olesen, J.E., Jørgensen, H., Danfær, A., Mikkelsen, M.H., Asman, W.A.H., Pedersen, S.O., Eds.; Miljøstyrelsen: Copenhagen, Denmark, 2005. [Google Scholar]
  100. NERI. Denmark’s National Inventory Report. 2011. Available online: http://unfccc.int/national_reports/annex_i_ghg_inventories/national_inventories_submissions/items/5888.php (accessed on 30 January 2012).
  101. Jentsch, W.; Schweigel, M.; Weissbach, F.; Scholze, H.; Pitroff, W.; Derno, M. Methane production in cattle calculated by the nutrient composition of the diet. Arch. Anim. Nutr. 2007, 61, 10–19. [Google Scholar] [CrossRef] [PubMed]
  102. Volden, H.; Larsen, M. Digestion and Metabolism in the Gastrointestinal Tract. In NorFor—The Nordic Feed Evaluation System; EAAP Publication No. 130; Volden, H., Ed.; Academic Publishers: Wageningen, The Netherlands, 2011. [Google Scholar]
  103. Yan, T.; Mayne, C.S.; Porter, M.G. Effects of dietary and animal factors on methane production in dairy cows offered grass silage based diets. Int. Congr. Ser. 2006, 1293, 123–126. [Google Scholar] [CrossRef]
  104. Kirchgessner; Windisch, W.; Müller, H.L. Nutritional Factors for the Quantification of Methane Production. In Proceedings of the 8th International Symposium on Ruminant Physiology, Willingen, Hesse, Germany, 25–30 September 1994; pp. 333–348.
  105. Mills, J.A.N.; Kebreab, E.; Yates, C.M.; Crompton, L.A.; Cammell, S.B.; Dahnoa, M.S.; Agnew, R.E.; France, J. Alternative approaches to predicting methane emissions from dairy cows. J. Anim. Sci. 2003, 81, 3141–3150. [Google Scholar] [PubMed]
  106. Kristensen, T.; Mogensen, L.; Weisbjerg, M.R.; Lund, P.; Aaes, O. Variation i udskillelsen af metan fra kvæg. KvægInfo. 2009. Available online: http://www.landbrugsinfo.dk/kvaeg (accessed on 12 March 2012).

