
Beef Steers and Enteric Methane: Reducing Emissions by Managing Forage Diet Fiber Content
 , , , ,
  and
and
Abstract
:Simple Summary
Abstract
1. Introduction
2. Materials and Methods
2.1. Experimental Design and Animals
2.2. Treatments
2.3. Chemical Analysis of Feed
2.4. Feed Intake and Animal Performance
2.5. Digestibility of Diet and Fiber
2.6. Determination of CH4 Emissions
2.7. Gas Analysis and Calculation
2.8. Prediction Equation Models
2.8.1. Database
2.8.2. Data Pre-Processing
2.8.3. Selection Model
2.9. Statistical Analysis
3. Results
3.1. Intake and Digestibility
3.2. Animal Performance
3.3. Methane Emissions
3.4. Models’ Equations Evaluated
4. Discussion
5. Conclusions
Author Contributions
Funding
Institutional Review Board Statement
Informed Consent Statement
Data Availability Statement
Acknowledgments
Conflicts of Interest
Appendix A

| Author, Year | Country | Measurement Technique | System | Reference |
|---|---|---|---|---|
| Gere et al., 2019 | Argentina | SF6 | Grazing | [76] |
| Maciel et al., 2019 | Brazil | SF6 | Grazing | [5] |
| Oliveira et al., 2016 | Brazil | SF6 | Grazing | [4] |
| Cota et al., 2014 | Brazil | SF6 | Confinement/Grazing | [3] |
| Batalha et al., 2020 | Brazil | SF6 | Confinement | [83] |
| Hoffmann et al., 2021 | Brazil | SF6 | Grazing | [80] |
| Dall-Orsoletta et al., 2016 | Brazil | SF6 | Confinement/Grazing | [68] |
| Koscheck et al., 2020 | Brazil | SF6 | Grazing | [84] |
| Teobaldo et al., 2022 | Brazil | SF6 | Grazing | [85] |
| Silvestre et al., 2021 | Brazil | SF6 | Confinement | [86] |
| Beauchemin and McGinn, 2006 | Canada | Respiration chamber | Confinement | [50] |
| Alemu et al., 2017 | Canada | Respiration chamber | Confinement | [67] |
| Manafiazar et al., 2016 | Canada | GEM | Confinement | [87] |
| Boadi and Wittenberg, 2002 | Canada | SF6 | Confinement | [21] |
| McCaughey et al., 1997 | Canada | SF6 | Grazing | [73] |
| Muñoz et al., 2015 | Chile | SF6 | Grazing | [88] |
| Muñoz et al., 2016 | Chile | SF6 | Grazing | [89] |
| Pinares-Patiño et al., 2003 | France | SF6 | Grazing | [64] |
| Doreau et al., 2011 | France | SF6 | Confinement | [90] |
| Jonker et al., 2018 | New Zealand | GEM | Grazing | [66] |
| Hammond et al., 2016 | UK | GEM | Confinement | [55] |
| Richmond et al., 2015 | UK | SF6 | Grazing | [71] |
| Santander et al., 2023 | Uruguay | SF6 | Confinement | [This study] |
| Dini et al., 2019 | Uruguay | SF6 | Confinement | [77] |
| Dini et al., 2018 | Uruguay | SF6 | Grazing | [61] |
| Orcasberro et al., 2021 | Uruguay | SF6 | Grazing | [78] |
| Loza et al., 2021 | Uruguay | SF6 | Grazing | [79] |
| Dini et al., 2012 | Uruguay | SF6 | Grazing | [37] |
| Aguerre et al., 2011 | USA | Respiration chamber | Confinement | [60] |
References
- Garnett, T.; Godde, C.; Muller, A.; Röös, E.; Smith, P.; De Boer, I.; Ermgassen, E.; Herrero, M.; Van Middelaar, C.; Schader, C.; et al. Grazed and Confused? Ruminating on Cattle, Grazing Systems, Methane, Nitrous Oxide, the Soil Carbon Sequestration Question—And What It All Means for Greenhouse Gas Emissions; FCRN: Oxford, UK, 2017. [Google Scholar]
- MVOTMA (Ministerio de Vivienda, Ordenamiento Territorial y Medio Ambiente). Uruguay: Tercer Informe Bienal de Actualización a la Conferencia de las Partes en la Convención Marco de las Naciones Unidas Sobre el Cambio Climático; MVOTMA: Santiago, Chile, 2019. Available online: https://www.gub.uy/ministerio-ambiente/sites/ministerio-ambiente/files/documentos/noticias/20191231_URUGUAY_BUR3_ESP_1.pdf (accessed on 14 October 2022).
- Cota, O.L.; de Figueiredo, D.M.; Branco, R.H.; Magnani, E.; do Nascimento, C.F.; de Oliveira, L.F.; Mercadante, M.E.Z. Methane emission by Nellore cattle subjected to different nutritional plans. Trop. Anim. Health Prod. 2014, 46, 1229–1234. [Google Scholar] [CrossRef]
- Oliveira, L.F.; Ruggieri, A.C.; Branco, R.H.; Cota, O.L.; Canesin, R.C.; Costa, H.J.U.; Mercadante, M.E.Z. Feed efficiency and enteric methane production of Nellore cattle in the feedlot and on pasture. Anim. Prod. Sci. 2018, 58, 886–893. [Google Scholar] [CrossRef]
- Maciel, I.C.d.F.; Barbosa, F.A.; Tomich, T.R.; Ribeiro, L.G.P.; Alvarenga, R.C.; Lopes, L.S.; Malacco, V.M.R.; Rowntree, J.E.; Thompson, L.R.; Lana, A.M.Q. Could the breed composition improve performance and change the enteric methane emissions from beef cattle in a tropical intensive production system? PLoS ONE 2019, 14, e0220247. [Google Scholar] [CrossRef] [PubMed]
- Beauchemin, K.A.; Ungerfeld, E.M.; Eckard, R.J.; Wang, M. Review: Fifty years of research on rumen methanogenesis: Lessons learned and future challenges for mitigation. Animals 2020, 14, s2–s16. [Google Scholar] [CrossRef] [Green Version]
- Denman, K.L.; Brasseur, G.; Chidthaisong, A.; Ciais, P.; Cox, P.M.; Dickinson, R.E.; Hauglustaine, D.; Heinze, C.; Holland, E.; Jacob, D.; et al. Couplings Between Changes in the Climate System and Biogeochemistry. In Climate Change 2007: The Physical Science Basis. Contribution of Working Group I to the Fourth Assessment Report of the Intergovernmental Panel on Climate Change; Solomon, S., Qin, M.D., Manning, Z., Chen, M., Marquis, K.B., Averyt, M.T., Miller, H.L., Eds.; Cambridge University Press: Berkeley, CA, USA, 2007; pp. 499–587. Available online: https://www.osti.gov/servlets/purl/934721 (accessed on 4 December 2022).
- Broucek, J. Production of Methane Emissions from Ruminant Husbandry: A Review. J. Environ. Prot. 2014, 5, 1482–1493. [Google Scholar] [CrossRef]
- Sejian, V.; Lal, R.; Lakritz, J.; Ezeji, T. Measurement and prediction of enteric methane emission. Int. J. Biometeorol. 2011, 55, 1–16. [Google Scholar] [CrossRef] [PubMed]
- Bervejillo, J. Anuario de OPYPA 2021: Comportamiento del Sector de la Carne Vacuna; Ministerio de Ganadería, Agricultura y Pesca: Sarandí del Yí, Uruguay, 2021. Available online: https://www.gub.uy/ministerio-ganaderia-agricultura-pesca/comunicacion/publicaciones/anuario-opypa-2021/analisis-sectorial-cadenas-productivas/comportamiento (accessed on 20 November 2022).
- Mieres, J.M. Guía para la Alimentación de Rumiantes; Unidad de Agronegocios y Difusión del INIA: Montevideo, Uruguay, 2004; Volume 142, 81p, Available online: http://www.ainfo.inia.uy/digital/bitstream/item/2887/1/111219240807141556.pdf (accessed on 4 December 2022).
- Phelan, P.; Moloney, A.P.; McGeough, E.J.; Humphreys, J.; Bertilsson, J.; O’Riordan, E.G.; O’Kiely, P. Forage Legumes for Grazing and Conserving in Ruminant Production Systems. CRC Crit. Rev. Plant Sci. 2015, 34, 281–326. [Google Scholar] [CrossRef]
- Delevatti, L.M.; Cardoso, A.S.; Barbero, R.P.; Leite, R.G.; Romanzini, E.P.; Ruggieri, A.C.; Reis, R.A. Effect of nitrogen application rate on yield, forage quality, and animal performance in a tropical pasture. Sci. Rep. 2019, 9, 7596. [Google Scholar] [CrossRef] [Green Version]
- Lee, M.A. A global comparison of the nutritive values of forage plants grown in contrasting environments. J. Plant Res. 2018, 131, 641–654. [Google Scholar] [CrossRef]
- Moe, P.W.; Tyrrell, H.F. Methane Production in Dairy Cows. J. Dairy Sci. 1979, 62, 1583–1586. [Google Scholar] [CrossRef]
- Johnson, K.A.; Johnson, D.E. Methane emissions from cattle. J. Anim. Sci. 1995, 73, 2483–2492. [Google Scholar] [CrossRef] [PubMed]
- Primavesi, O.; Frighetto, R.T.S.; Pedreira, M.S.; Lima, M.A.; Berchielli, T.T.; Rodrigues, A.A. Low-fiber sugarcane to improve meat production with less methane emission in tropical dry season. In Proceedings of the 3rd International Methane And Nitrous Oxide Mitigation Conference, Beijing, China, 14–19 September 2003; pp. 185–189. Available online: http://www.coalinfo.net.cn/coalbed/meeting/2203/papers/agriculture/AG066.pdf (accessed on 20 November 2022).
- Hammond, K.J.; Crompton, L.A.; Bannink, A.; Dijkstra, J.; Yáñez-Ruiz, D.R.; O’Kiely, P.; Kebreab, E.; Eugène, M.A.; Yu, Z.; Shingfield, K.J.; et al. Review of current in vivo measurement techniques for quantifying enteric methane emission from ruminants. Anim. Feed Sci. Technol. 2016, 219, 13–30. [Google Scholar] [CrossRef] [Green Version]
- Clark, H.; Kelliher, F.; Pinares-Patiño, C. Reducing CH4 Emissions from Grazing Ruminants in New Zealand: Challenges and Opportunities. Asian Australas. J. Anim. Sci. 2010, 24, 295–302. [Google Scholar] [CrossRef]
- Hammond, K.J.; Hoskin, S.O.; Burke, J.L.; Waghorn, G.C.; Koolaard, J.P.; Muetzel, S. Effects of feeding fresh white clover (Trifolium repens) or perennial ryegrass (Lolium perenne) on enteric methane emissions from sheep. Anim. Feed Sci. Technol. 2011, 166–167, 398–404. [Google Scholar] [CrossRef]
- Boadi, D.A.; Wittenberg, K.M. Methane production from dairy and beef heifers fed forages differing in nutrient density using the sulphur hexafluoride (SF 6) tracer gas technique. Can. J. Anim. Sci. 2002, 82, 201–206. [Google Scholar] [CrossRef] [Green Version]
- Burns, J.C.; Pond, K.R.; Fisher, D.S. Measurement of forage intake. In Forage Quality, Evaluation, and Utilization; Wiley: Hoboken, NJ, USA, 2015; pp. 494–532. [Google Scholar] [CrossRef]
- Smith, W.B.; Galyean, M.L.; Kallenbach, R.L.; Greenwood, P.L.; Scholljegerdes, E.J. Understanding intake on pastures: How, why, and a way forward. J. Anim. Sci. 2021, 99, skab062. [Google Scholar] [CrossRef] [PubMed]
- Sakamoto, L.S.; Souza, L.L.; Gianvecchio, S.B.; de Oliveira, M.H.V.; Silva, J.A.I.d.V.; Canesin, R.C.; Branco, R.H.; Baccan, M.; Berndt, A.; de Albuquerque, L.G.; et al. Phenotypic association among performance, feed efficiency and methane emission traits in Nellore cattle. PLoS ONE 2021, 16, e0257964. [Google Scholar] [CrossRef]
- Ellis, J.L.; Kebreab, E.; Odongo, N.E.; McBride, B.W.; Okine, E.K.; France, J. Prediction of methane production from dairy and beef cattle. J. Dairy Sci. 2007, 90, 3456–3466. [Google Scholar] [CrossRef]
- Ellis, J.L.; Bannink, A.; France, J.; Kebreab, E.; Dijkstra, J. Evaluation of enteric methane prediction equations for dairy cows used in whole farm models. Glob. Change Biol. 2010, 16, 3246–3256. [Google Scholar] [CrossRef]
- Escobar-Bahamondes, P.; Oba, M.; Beauchemin, K.A. An evaluation of the accuracy and precision of methane prediction equations for beef cattle fed high-forage and high-grain diets. Animals 2016, 11, 68–77. [Google Scholar] [CrossRef]
- Santiago-Juarez, B.; Moraes, L.E.; Appuhamy, J.A.D.R.N.; Pellikaan, W.F.; Casper, D.P.; Tricarico, J.; Kebreab, E. Prediction and evaluation of enteric methane emissions from lactating dairy cows using different levels of covariate information. Anim. Prod. Sci. 2016, 56, 557–564. [Google Scholar] [CrossRef]
- Moraes, L.E.; Strathe, A.B.; Fadel, J.G.; Casper, D.P.; Kebreab, E. Prediction of enteric methane emissions from cattle. Glob. Change Biol. 2014, 20, 2140–2148. [Google Scholar] [CrossRef] [Green Version]
- Benaouda, M.; Martin, C.; Li, X.; Kebreab, E.; Hristov, A.N.; Yu, Z.; Yáñez-Ruiz, D.R.; Reynolds, C.K.; Crompton, L.A.; Dijkstra, J.; et al. Evaluation of the performance of existing mathematical models predicting enteric methane emissions from ruminants: Animal categories and dietary mitigation strategies. Anim. Feed Sci. Technol. 2019, 255, 114207. [Google Scholar] [CrossRef]
- Association of Oficcial Analytical Chemists, Inc. Official Method of Analysis. In Chemical and Functional Properties of Food Saccharides, 15th ed.; Helrich, K., Ed.; Association of Oficcial Analytical Chemists, Inc.: Washington, DC, USA, 1990; Volume 1, pp. 73–80. [Google Scholar]
- Van Soest, P.J.; Robertson, J.B.; Lewis, B.A. Methods for Dietary Fiber, Neutral Detergent Fiber, and Nonstarch Polysaccharides in Relation to Animal Nutrition. J. Dairy Sci. 1991, 74, 3583–3597. [Google Scholar] [CrossRef] [PubMed]
- National Research Council. Nutrient Requirements of Dairy Cattle, 7th ed.; National Academies Press: Washington, DC, USA, 2001; 146p. [Google Scholar] [CrossRef] [Green Version]
- Crews, J.H.; Carstens, G.E. Measuring Individual Feed Intake and Utilization in Growing Cattle. In Feed Efficiency in the Beef Industry; Wiley-Blac: Hoboken, NJ, USA, 2012; pp. 21–28. [Google Scholar] [CrossRef]
- Ferreira, M.d.A.; Valadares Filho, S.d.C.; Marcondes, M.I.; Paixão, M.L.; Paulino, M.F.; Valadares, R.F.D. Avaliação de indicadores em estudos com ruminantes: Digestibilidade. Rev. Bras. Zootec. 2009, 38, 1568–1573. [Google Scholar] [CrossRef] [Green Version]
- Gere, J.I.; Gratton, R. Simple, low-cost flow controllers for time averaged atmospheric sampling and other applications. Lat. Am. Appl. Res. 2010, 40, 377–381. [Google Scholar]
- Dini, Y.; Gere, J.; Briano, C.; Manetti, M.; Juliarena, P.; Picasso, V.; Gratton, R.; Astigarraga, L. Methane emission and milk production of dairy cows grazing pastures rich in legumes or rich in grasses in Uruguay. Animals 2012, 2, 288–300. [Google Scholar] [CrossRef] [PubMed] [Green Version]
- Pinares-Patiño, C.; Gere, J.; Williams, K.; Gratton, R.; Juliarena, P.; Molano, G.; MacLean, S.; Sandoval, E.; Taylor, G.; Koolaard, J. Extending the Collection Duration of Breath Samples for Enteric Methane Emission Estimation Using the SF6 Tracer Technique. Animals 2012, 2, 275–287. [Google Scholar] [CrossRef] [Green Version]
- Savian, J.V.; Neto, A.B.; de David, D.B.; Bremm, C.; Schons, R.M.T.; Genro, T.C.M.; do Amaral, G.A.; Gere, J.; McManus, C.M.; Bayer, C.; et al. Grazing intensity and stocking methods on animal production and methane emission by grazing sheep: Implications for integrated crop–livestock system. Agric. Ecosyst. Environ. 2014, 190, 112–119. [Google Scholar] [CrossRef] [Green Version]
- IPCC. 2006 IPCC Guidelines for National Greenhouse Inventories—A Primer, Prepared by the National Greenhouse Gas Inventories Programme; Eggleston, H.S., Miwa, K., Srivastava, N., Tanabe, K., Eds.; IGES: Hayama, Japan, 2006; p. 20. [Google Scholar]
- National Research Council. Beef Cattle Nutrient Requirements Model. 2016. Available online: https://nutritionmodels.com/beef.html (accessed on 14 October 2022).
- Di Rienzo, J.A.; Casanoves, F.; Balzarini, M.G.; Gonzalez, L.; Tablada, M.; RCW; InfoStat. Centro de Transferencia InfoStat, FCA, Universidad Nacional de Córdoba: Argentina. 2020. Available online: http://www.infostat.com.ar (accessed on 14 October 2022).
- R Core Team. R: A Language and Environment for Statistical Computing; R Foundation for Statistical Computing: Vienna, Austria, 2021; Available online: https://www.r-project.org/ (accessed on 20 November 2022).
- Piñeiro, G.; Perelman, S.; Guerschman, J.P.; Paruelo, J.M. How to evaluate models: Observed vs. predicted or predicted vs. observed? Ecol. Modell. 2008, 216, 316–322. [Google Scholar] [CrossRef]
- Van Soest, P.J. Nutritional Ecology of Ruminants, 2nd ed.; Cornell University Press: Ithaca, NY, USA, 1994. [Google Scholar]
- Van Soest, P.J. Symposium on Factors Influencing the Voluntary Intake of Herbage by Ruminants: Voluntary Intake in Relation to Chemical Composition and Digestibility. J. Anim. Sci. 1965, 24, 834–843. [Google Scholar] [CrossRef]
- Zubieta, Á.S.; Savian, J.V.; de Souza Filho, W.; Wallau, M.O.; Gómez, A.M.; Bindelle, J.; Bonnet, O.J.F.; de Faccio Carvalho, P.C. Does grazing management provide opportunities to mitigate methane emissions by ruminants in pastoral ecosystems? Sci. Total Environ. 2021, 754, 142029. [Google Scholar] [CrossRef] [PubMed]
- Riaz, M.Q.; Südekum, K.H.; Clauss, M.; Jayanegara, A. Voluntary feed intake and digestibility of four domestic ruminant species as influenced by dietary constituents: A meta-analysis. Livest. Sci. 2014, 162, 76–85. [Google Scholar] [CrossRef]
- Minson, D.J.; Wilson, J.R. Prediction of Intake as an Element of Forage Quality. In Forage Quality, Evaluation, and Utilization; Wiley: Hoboken, NJ, USA, 1994; pp. 533–563. [Google Scholar] [CrossRef]
- Beauchemin, K.A.; McGinn, S.M. Enteric methane emissions from growing beef cattle as affected by diet and level of intake. Can. J. Anim. Sci. 2006, 86, 401–408. [Google Scholar] [CrossRef] [Green Version]
- Hodgson, J. Grazing Management: Science into Practice; Longman Group UK Ltd.: Harlow, UK, 1990; 203p. [Google Scholar]
- Beauchemin, K.A.; Kreuzer, M.; O’Mara, F.; McAllister, T.A. Nutritional management for enteric methane abatement: A review. Aust. J. Exp. Agric. 2008, 48, 21–27. [Google Scholar] [CrossRef]
- Oba, M.; Allen, M.S. Evaluation of the Importance of the Digestibility of Neutral Detergent Fiber from Forage: Effects on Dry Matter Intake and Milk Yield of Dairy Cows. J. Dairy Sci. 1999, 82, 589–596. [Google Scholar] [CrossRef]
- Hammond, K.J.; Pacheco, D.; Burke, J.L.L.; Koolaard, J.P.P.; Muetzel, S.; Waghorn, G.C.C. The effects of fresh forages and feed intake level on digesta kinetics and enteric methane emissions from sheep. Anim. Feed Sci. Technol. 2014, 193, 32–43. [Google Scholar] [CrossRef]
- Hammond, K.J.; Jones, A.K.; Humphries, D.J.; Crompton, L.A.; Reynolds, C.K. Effects of diet forage source and neutral detergent fiber content on milk production of dairy cattle and methane emissions determined using GreenFeed and respiration chamber techniques. J. Dairy Sci. 2016, 99, 7904–7917. [Google Scholar] [CrossRef] [Green Version]
- O’Connor, J.D.; Sniffen, C.J.; Fox, D.G.; Chalupa, W. A net carbohydrate and protein system for evaluating cattle diets: IV. Predicting amino acid adequacy. J. Anim. Sci. 1993, 71, 1298–1311. [Google Scholar] [CrossRef] [Green Version]
- Olson, K.C.; Cochran, R.C.; Jones, T.J.; Vanzant, E.S.; Titgemeyer, E.C.; Johnson, D.E. Effects of ruminal administration of supplemental degradable intake protein and starch on utilization of low-quality warm-season grass hay by beef steers. J. Anim. Sci. 1999, 77, 1016–1025. [Google Scholar] [CrossRef]
- Bergen, R.; Miller, S.P.; Wilton, J.W. Genetic correlations among indicator traits for carcass composition measured in yearling beef bulls and finished feedlot steers. Can. J. Anim. Sci. 2005, 85, 463–473. [Google Scholar] [CrossRef]
- Swain, M.; Blomqvist, L.; McNamara, J.; Ripple, W.J. Reducing the environmental impact of global diets. Sci. Total Environ. 2018, 610–611, 1207–1209. [Google Scholar] [CrossRef] [PubMed]
- Aguerre, M.J.; Wattiaux, M.A.; Powell, J.M.; Broderick, G.A.; Arndt, C. Effect of forage-to-concentrate ratio in dairy cow diets on emission of methane, carbon dioxide, and ammonia, lactation performance, and manure excretion. J. Dairy Sci. 2011, 94, 3081–3093. [Google Scholar] [CrossRef] [Green Version]
- Dini, Y.; Gere, J.I.; Cajarville, C.; Ciganda, V.S. Using highly nutritious pastures to mitigate enteric methane emissions from cattle grazing systems in South America. Anim. Prod. Sci. 2018, 58, 2329–2334. [Google Scholar] [CrossRef]
- Kurihara, M.; Magner, T.; Hunter, R.A.; McCrabb, G.J. Methane production and energy partition of cattle in the tropics. Br. J. Nutr. 1999, 81, 227–234. [Google Scholar] [CrossRef] [PubMed]
- Benchaar, C.; Pomar, C.; Chiquette, J. Evaluation of dietary strategies to reduce methane production in ruminants: A modelling approach. Can. J. Anim. Sci. 2001, 81, 563–574. [Google Scholar] [CrossRef]
- Pinares-Patiño, C.S.; Baumont, R.; Martin, C. Methane emissions by Charolais cows grazing a monospecific pasture of timothy at four stages of maturity. Can. J. Anim. Sci. 2003, 83, 769–777. [Google Scholar] [CrossRef]
- Moorby, J.M.; Fleming, H.R.; Theobald, V.J.; Fraser, M.D. Can live weight be used as a proxy for enteric methane emissions from pasture-fed sheep? Sci. Rep. 2015, 5, 17915. [Google Scholar] [CrossRef] [Green Version]
- Jonker, A.; Farrell, L.; Scobie, D.; Dynes, R.; Edwards, G.; Hague, H.; McAuliffe, R.; Taylor, A.; Knight, T.; Waghorn, G. Methane and carbon dioxide emissions from lactating dairy cows grazing mature ryegrass/white clover or a diverse pasture comprising ryegrass, legumes and herbs. Anim. Prod. Sci. 2018, 59, 1063–1069. [Google Scholar] [CrossRef]
- Alemu, A.W.; Vyas, D.; Manafiazar, G.; Basarab, J.A.; Beauchemin, K.A. Enteric methane emissions from low– and high–residual feed intake beef heifers measured using GreenFeed and respiration chamber techniques. J. Anim. Sci. 2017, 95, 3727–3737. [Google Scholar] [CrossRef]
- Dall-Orsoletta, A.C.; Almeida, J.G.R.; Carvalho, P.C.F.; Savian, J.V.; Ribeiro-Filho, H.M.N. Ryegrass pasture combined with partial total mixed ration reduces enteric methane emissions and maintains the performance of dairy cows during mid to late lactation. J. Dairy Sci. 2016, 99, 4374–4383. [Google Scholar] [CrossRef] [PubMed] [Green Version]
- Janssen, P.H. Influence of hydrogen on rumen methane formation and fermentation balances through microbial growth kinetics and fermentation thermodynamics. Anim. Feed Sci. Technol. 2010, 160, 1–22. [Google Scholar] [CrossRef]
- Moss, A.R.; Jouany, J.-P.; Newbold, J. Methane production by ruminants: Its contribution to global warming. Ann. Zootech. 2000, 49, 231–253. [Google Scholar] [CrossRef] [Green Version]
- Richmond, A.S.; Wylie, A.R.G.; Laidlaw, A.S.; Lively, F.O. Methane emissions from beef cattle grazing on semi-natural upland and improved lowland grasslands. Animals 2015, 9, 130–137. [Google Scholar] [CrossRef] [PubMed] [Green Version]
- Congio, G.F.d.S.; Bannink, A.; Mogollón, O.L.M.; Hristov, A.N.; Jaurena, G.; Gonda, H.; Gere, J.I.; Cerón-Cucchi, M.E.; Ortiz-Chura, A.; Tieri, M.P.; et al. Enteric methane mitigation strategies for ruminant livestock systems in the Latin America and Caribbean region: A meta-analysis. J. Clean. Prod. 2021, 312, 127693. [Google Scholar] [CrossRef]
- McCaughey, W.P.; Wittenberg, K.; Corrigan, D. Methane production by steers on pasture. Can. J. Anim. Sci. 1997, 77, 519–524. [Google Scholar] [CrossRef]
- Lee, J.M.; Woodward, S.L.; Waghorn, G.C.; Clark, D.A. Methane emissions by dairy cows fed increasing proportions of white clover (Trifolium repens) in pasture. Proc. N. Z. Grassl. Assoc. 2004, 66, 151–155. [Google Scholar] [CrossRef]
- De Andrade, F.L.; Paulo, J.; Rodrigues, P.; Detmann, E.; De Campos, S.; Filho, V.; Messias, M.; Castro, D.; Trece, A.S.; Silva, T.E.; et al. Nutritional and productive performance of dairy cows fed corn silage or sugarcane silage with or without additives. Trop. Anim. Health Prod. 2016, 48, 747–753. [Google Scholar] [CrossRef]
- Gere, J.I.; Bualó, R.A.; Perini, A.L.; Arias, R.D.; Ortega, F.M.; Wulff, A.E.; Berra, G. Methane emission factors for beef cows in Argentina: Effect of diet quality. N. Z. J. Agric. Res. 2019, 64, 260–268. [Google Scholar] [CrossRef]
- Dini, Y.; Cajarville, C.; Gere, J.I.; Fernandez, S.; Fraga, M.; Pravia, M.I.; Navajas, E.A.; Ciganda, V.S. Association between residual feed intake and enteric methane emissions in Hereford steers. Transl. Anim. Sci. 2019, 3, 161–167. [Google Scholar] [CrossRef] [Green Version]
- Orcasberro, M.S.; Loza, C.; Gere, J.; Soca, P.; Picasso, V.; Astigarraga, L. Seasonal Effect on Feed Intake and Methane Emissions of Cow–Calf Systems on Native Grassland with Variable Herbage Allowance. Animals 2021, 11, 882. [Google Scholar] [CrossRef]
- Loza, C.; Gere, J.; Orcasberro, M.S.; Casal, A.; Carriquiry, M.; Juliarena, P.; Ramírez-Bribiesca, E.; Astigarraga, L. Intake, Energy Expenditure and Methane Emissions of Grazing Dairy Cows at Two Pre-Grazing Herbage Masses. Open J. Anim. Sci. 2021, 11, 440–457. [Google Scholar] [CrossRef]
- Hoffmann, A.; Cardoso, A.S.; Fonseca, N.V.B.; Romanzini, E.P.; Siniscalchi, D.; Berndt, A.; Ruggieri, A.C.; Reis, R.A. Effects of supplementation with corn distillers’ dried grains on animal performance, nitrogen balance, and enteric CH4 emissions of young Nellore bulls fed a high-tropical forage diet. Animals 2021, 15, 100155. [Google Scholar] [CrossRef]
- Williams, S.R.O.; Moate, P.J.; Hannah, M.C.; Ribaux, B.E.; Wales, W.J.; Eckard, R.J. Background matters with the SF6 tracer method for estimating enteric methane emissions from dairy cows: A critical evaluation of the SF6 procedure. Anim. Feed Sci. Technol. 2011, 170, 265–276. [Google Scholar] [CrossRef]
- Hammond, K.J.; Humphries, D.J.; Crompton, L.A.; Green, C.; Reynolds, C.K. Methane emissions from cattle: Estimates from short-term measurements using a GreenFeed system compared with measurements obtained using respiration chambers or sulphur hexafluoride tracer. Anim. Feed Sci. Technol. 2015, 203, 41–52. [Google Scholar] [CrossRef]
- Delveaux Araujo Batalha, C.; Morelli, M.; Branco, R.H.; dos Santos Gonçalves Cyrillo, J.N.; Carrilho Canesin, R.; Zerlotti Mercadante, M.E.; Figueiredo Martins Bonilha, S. Association between residual feed intake, digestion, ingestive behavior, enteric methane emission and nitrogen metabolism in Nellore beef cattle. Anim. Sci. J. 2020, 91, e13455. [Google Scholar] [CrossRef]
- Koscheck, J.F.W.; Romanzini, E.P.; Barbero, R.P.; Delevatti, L.M.; Ferrari, A.C.; Mulliniks, J.T.; Mousquer, C.J.; Berchielli, T.T.; Reis, R.A. How do animal performance and methane emissions vary with forage management intensification and supplementation? Anim. Prod. Sci. 2020, 60, 1201–1209. [Google Scholar] [CrossRef]
- Teobaldo, R.W.; Cardoso, A.d.S.; Brito, T.R.; Leite, R.G.; Romanzini, E.P.; Granja-Salcedo, Y.T.; Reis, R.A. Response of Phytogenic Additives on Enteric Methane Emissions and Animal Performance of Nellore Bulls Raised in Grassland. Sustainability 2022, 14, 9395. [Google Scholar] [CrossRef]
- Silvestre, T.; Lima, M.A.; dos Santos, G.B.; Pereira, L.G.R.; Machado, F.S.; Tomich, T.R.; Campos, M.M.; Jonker, A.; Rodrigues, P.H.M.; Brandao, V.L.N.; et al. Effects of Feeding Level and Breed Composition on Intake, Digestibility, and Methane Emissions of Dairy Heifers. Animals 2021, 11, 586. [Google Scholar] [CrossRef]
- Manafiazar, G.; Zimmerman, S.; Basarab, J. Repeatability and variability of short-term spot measurement of methane and carbon dioxide emissions from beef cattle using GreenFeed Emissions Monitoring System. Can. J. Anim. Sci. 2016, 97, 118–126. [Google Scholar] [CrossRef] [Green Version]
- Muñoz, C.; Hube, S.; Morales, J.M.; Yan, T.; Ungerfeld, E.M. Effects of concentrate supplementation on enteric methane emissions and milk production of grazing dairy cows. Livest. Sci. 2015, 175, 37–46. [Google Scholar] [CrossRef]
- Muñoz, C.; Letelier, P.A.; Ungerfeld, E.M.; Morales, J.M.; Hube, S.; Pérez-Prieto, L.A. Effects of pregrazing herbage mass in late spring on enteric methane emissions, dry matter intake, and milk production of dairy cows. J. Dairy Sci. 2016, 99, 7945–7955. [Google Scholar] [CrossRef] [PubMed] [Green Version]
- Doreau, M.; van der Werf, H.M.G.; Micol, D.; Dubroeucq, H.; Agabriel, J.; Rochette, Y.; Martin, C. Enteric methane production and greenhouse gases balance of diets differing in concentrate in the fattening phase of a beef production system. J. Anim. Sci. 2011, 89, 2518–2528. [Google Scholar] [CrossRef] [PubMed]


| Diet | ||
|---|---|---|
| Parameter | Moderate Fiber (MF) | High Fiber (HF) |
| DM, g/kg of fresh matter | 579 | 631 |
| --------------------g/kg, DM basis—----------------- | ||
| OM | 877 | 880 |
| NDF | 491 | 543 |
| ADF | 332 | 392 |
| Lignin | 74 | 82 |
| CP | 148 | 121 |
| EE | 28 | 24 |
| Ash | 123 | 120 |
| NFC | 210 | 192 |
| NFC:NDF | 0.43 | 0.35 |
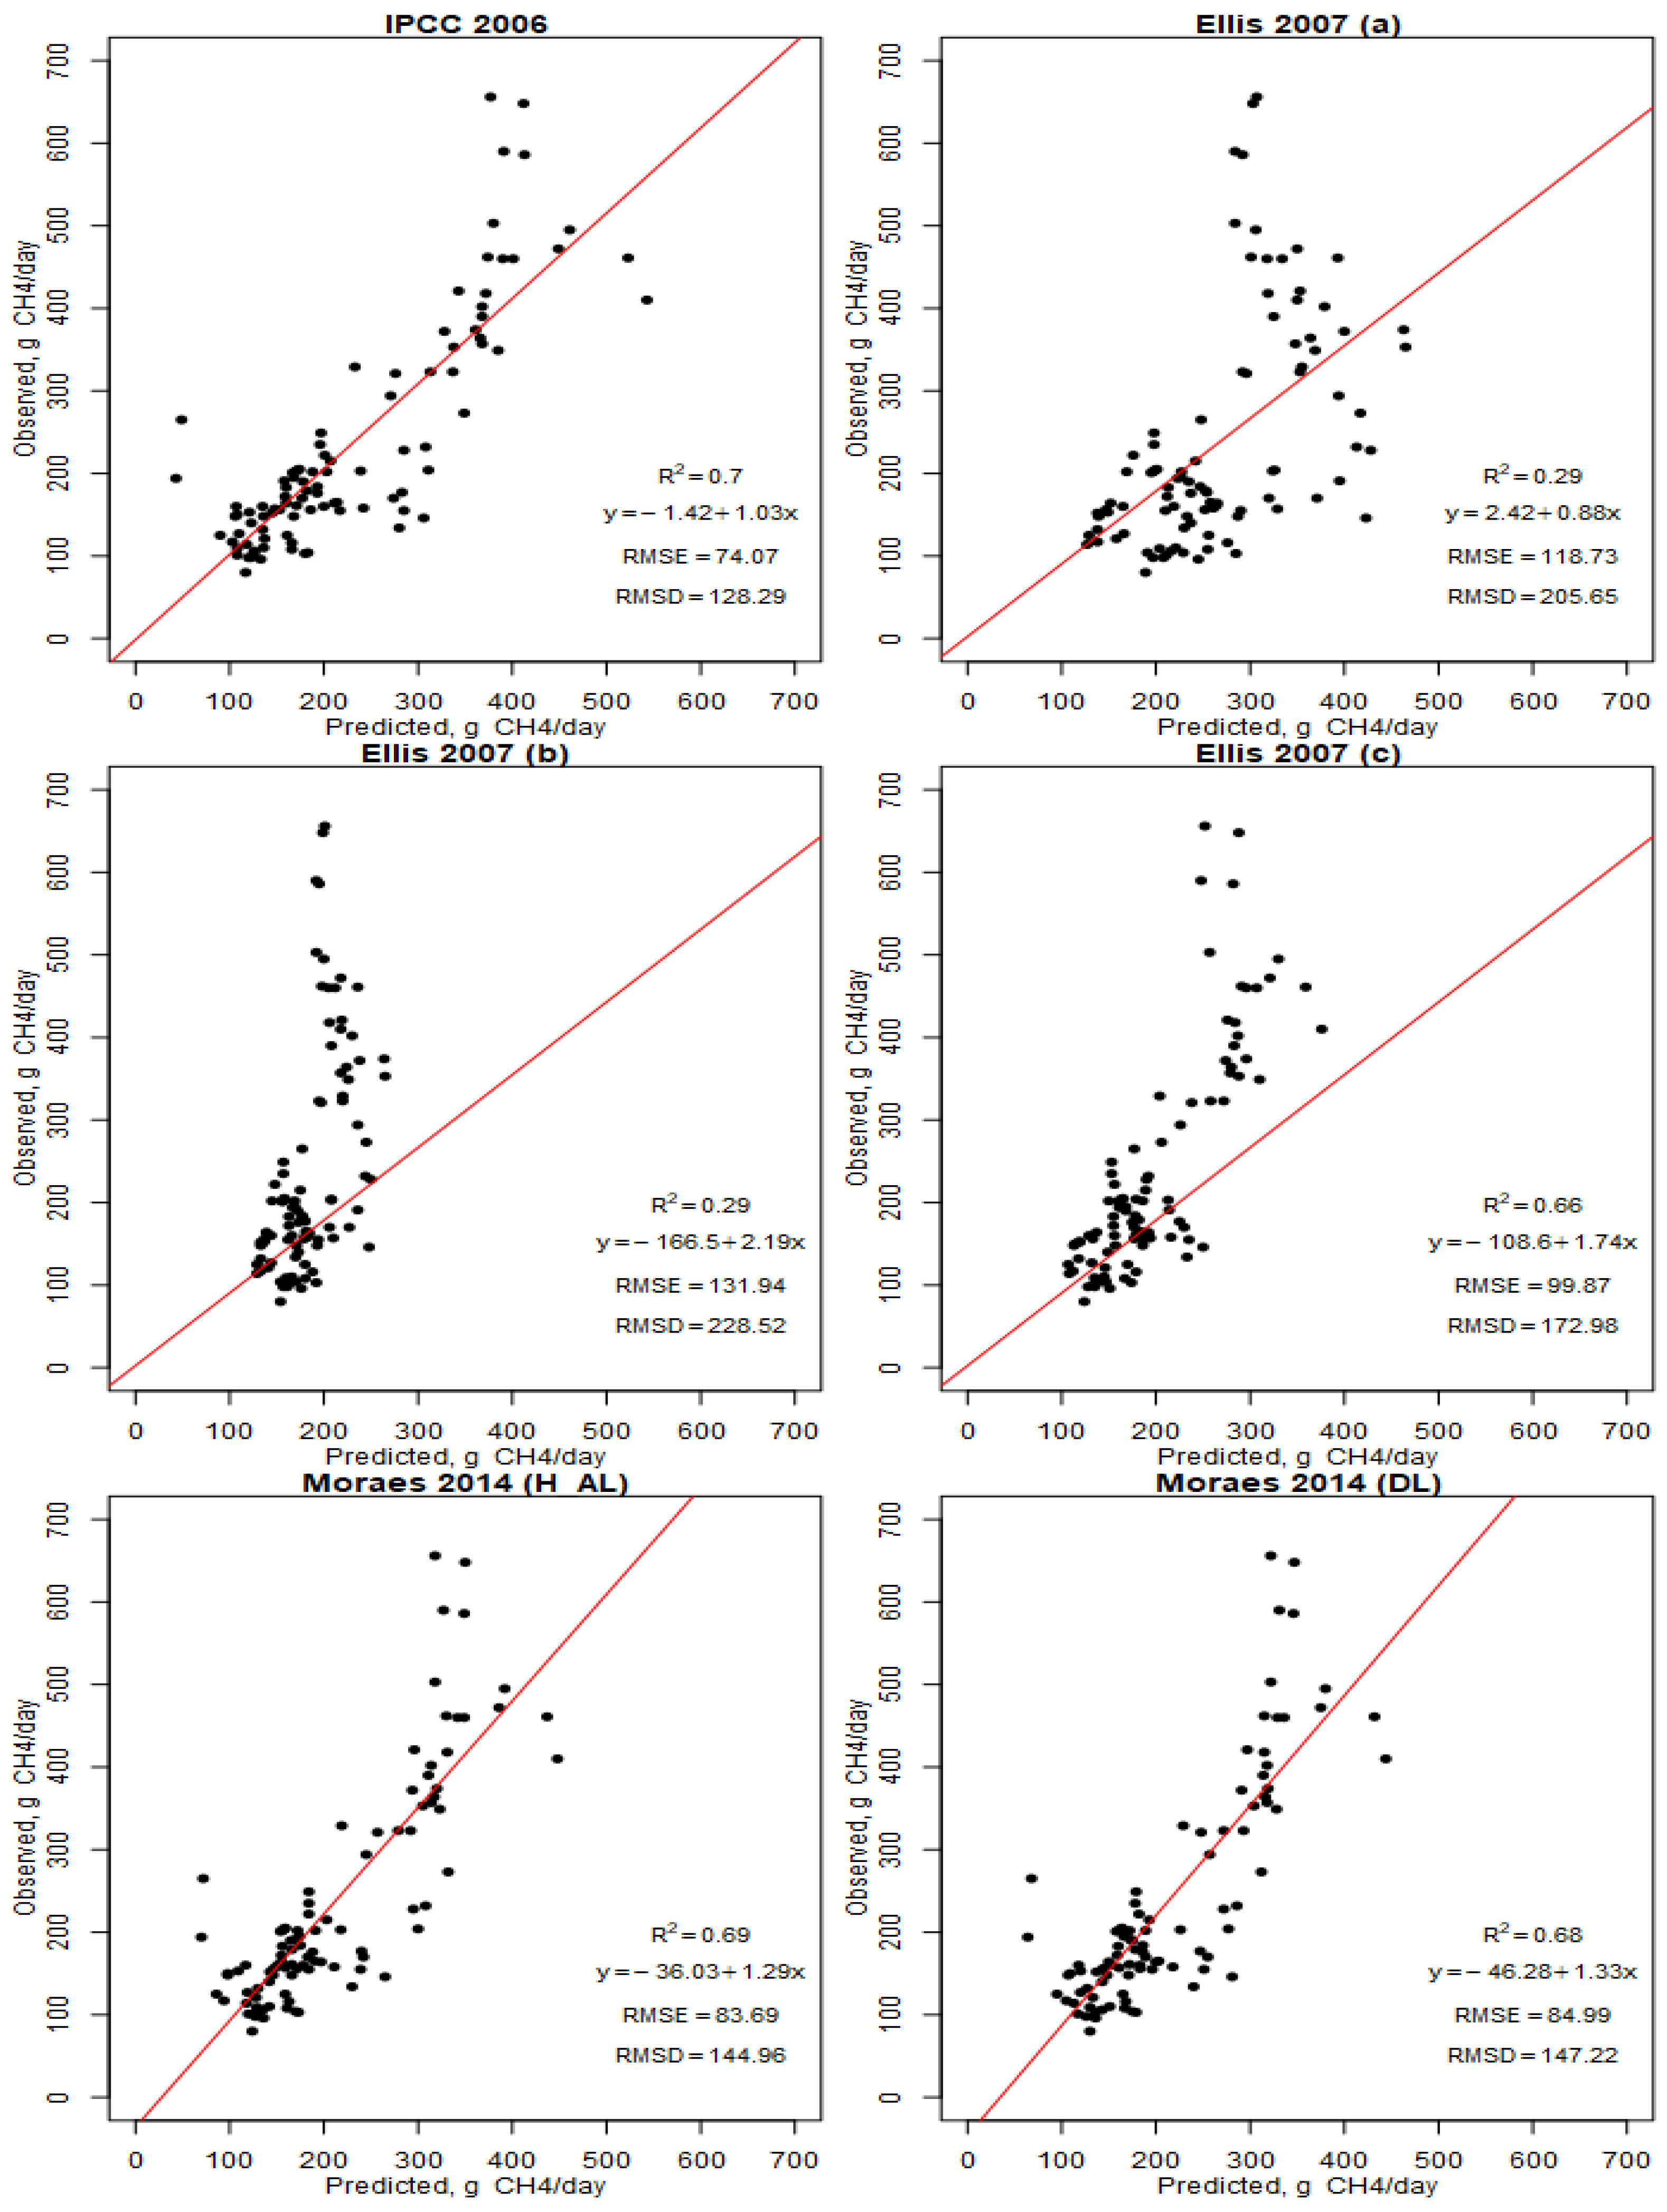
| Author, Year | Model | Equation | Reference |
|---|---|---|---|
| IPCC, 2006 | IPCC 2006 | CH4 = (0.065 × GEI)/0.05565 | [40] |
| Ellis et al., 2007 | Ellis 2007 (a) | CH4 = (3.14 + 2.11 × NDFI)/0.05565 | [25] |
| Ellis et al., 2007 | Ellis 2007 (b) | CH4 = (5.58 + 0.848 × NDFI)/0. 05565 | [25] |
| Ellis et al., 2007 | Ellis 2007 (c) | CH4 = (−1.02 + 0.681 × DMI + 4.81 × forage)/0.05565 | [25] |
| Moraes et al., 2014 | Moraes 2014 (H_AL) | CH4 = −1.487 + 0.046 × GEI + 0.032 × (NDF, %) + 0.006 × BW | [29] |
| Moraes et al., 2014 | Moraes 2014(DL) | CH4= −0.163 + 0.051 × GEI + 0.038 × (NDF, %) | [29] |
| Diet | ||||
|---|---|---|---|---|
| Parameter | Moderate Fiber (MF) | High Fiber (HF) | SEM | p-Value |
| DM, kg/day | 9.9 | 8.2 | 0.23 | <0.001 |
| OM, kg/day | 7.5 | 6.2 | 0.17 | 0.001 |
| NDF, kg/day | 4.9 | 4.5 | 0.12 | 0.02 |
| ADF, kg/day | 3.3 | 3.2 | 0.08 | 0.49 |
| Lignin, kg/day | 0.74 | 0.67 | 0.02 | 0.02 |
| CP, kg/day | 1.5 | 1.0 | 0.03 | <0.001 |
| EE, kg/day | 0.28 | 0.20 | 0.01 | <0.001 |
| Ash, kg/day | 1.2 | 1.0 | 0.03 | <0.001 |
| DMD, % | 60.7 | 50.4 | 1.02 | <0.001 |
| NDFD, % | 56.6 | 47.6 | 1.4 | <0.001 |
| Diet | ||||
|---|---|---|---|---|
| Parameter | Moderate Fiber (MF) | High Fiber (HF) | SEM | p-Value |
| Production | ||||
| Initial LW, kg | 447 | 441 | 9.02 | 0.62 |
| Final LW, kg | 513 | 472 | 8.75 | 0.002 |
| ADG, kg/day | 0.65 | 0.32 | 0.02 | <0.001 |
| Emission | ||||
| CH4, g/day | 214 | 193 | 7.56 | 0.054 |
| CH4, g/kg ADG | 342 | 649 | 48.7 | <0.001 |
| CH4, g/kg DMI | 21.7 | 23.7 | 0.64 | 0.022 |
| CH4, g/kg NDF intake | 44.09 | 43.77 | 1.27 | 0.97 |
| Ym, % | 6.7 | 7.5 | 0.2 | 0.008 |
Disclaimer/Publisher’s Note: The statements, opinions and data contained in all publications are solely those of the individual author(s) and contributor(s) and not of MDPI and/or the editor(s). MDPI and/or the editor(s) disclaim responsibility for any injury to people or property resulting from any ideas, methods, instructions or products referred to in the content. |
© 2023 by the authors. Licensee MDPI, Basel, Switzerland. This article is an open access article distributed under the terms and conditions of the Creative Commons Attribution (CC BY) license (https://creativecommons.org/licenses/by/4.0/).
Share and Cite
Santander, D.; Clariget, J.; Banchero, G.; Alecrim, F.; Simon Zinno, C.; Mariotta, J.; Gere, J.; Ciganda, V.S. Beef Steers and Enteric Methane: Reducing Emissions by Managing Forage Diet Fiber Content. Animals 2023, 13, 1177. https://doi.org/10.3390/ani13071177
Santander D, Clariget J, Banchero G, Alecrim F, Simon Zinno C, Mariotta J, Gere J, Ciganda VS. Beef Steers and Enteric Methane: Reducing Emissions by Managing Forage Diet Fiber Content. Animals. 2023; 13(7):1177. https://doi.org/10.3390/ani13071177
Chicago/Turabian StyleSantander, Daniel, Juan Clariget, Georgget Banchero, Fabiano Alecrim, Claudia Simon Zinno, Julieta Mariotta, José Gere, and Verónica S. Ciganda. 2023. "Beef Steers and Enteric Methane: Reducing Emissions by Managing Forage Diet Fiber Content" Animals 13, no. 7: 1177. https://doi.org/10.3390/ani13071177