
An Experimental Study in Wild Wood Mice Testing Elemental and Isotope Analysis in Faeces to Determine Variations in Food Intake Amount

Abstract
:Simple Summary
Abstract
1. Introduction
2. Materials and Methods
2.1. Field Sampling
2.2. Food Access Limitation and Food Intake Evaluation
2.3. Faeces Collection and Elemental and Isotope Analyses
2.4. Statistical Analysis
3. Results
4. Discussion
5. Conclusions
Author Contributions
Funding
Institutional Review Board Statement
Informed Consent Statement
Data Availability Statement
Acknowledgments
Conflicts of Interest
References
- Frost, P.C.; Song, K.; Wagner, N.D. A beginner’s guide to nutritional profiling in physiology and ecology. Integr. Comp. Biol. 2014, 54, 873–879. [Google Scholar] [CrossRef] [PubMed] [Green Version]
- Pineda-Munoz, S.; Alroy, J. Dietary characterization of terrestrial mammals. Proc. Royal Soc. B 2014, 281, 20141173. [Google Scholar] [CrossRef] [PubMed]
- Birnie-Gauvin, K.; Peiman, K.S.; Raubenheimer, D.; Cooke, S.J. Nutritional physiology and ecology of wildlife in a changing world. Conserv. Physiol. 2017, 5, cox030. [Google Scholar] [CrossRef] [Green Version]
- Perrigo, G. Breeding and feeding strategies in deer mice and house mice when females are challenged to work for their food. Anim. Behav. 1987, 35, 1298–1316. [Google Scholar] [CrossRef]
- Hernández, M.C.; Navarro-Castilla, Á.; Wilsterman, K.; Bentley, G.E.; Barja, I. When food access is challenging: Evidence of wood mice ability to balance energy budget under predation risk and physiological stress reactions. Behav. Ecol. Sociobiol. 2019, 73, 145. [Google Scholar] [CrossRef]
- Hernández, M.C.; Navarro-Castilla, Á.; Barja, I. Wood mouse feeding effort and decision-making when encountering a restricted unknown food source. PLoS ONE 2019, 14, e0212716. [Google Scholar] [CrossRef] [Green Version]
- Lima, S.L. Nonlethal effects in the ecology of predator-prey interactions. Bioscience 1998, 48, 25–34. [Google Scholar] [CrossRef] [Green Version]
- Olsson, O.; Brown, J.S. The foraging benefits of information and the penalty of ignorance. Oikos 2006, 112, 260–273. [Google Scholar] [CrossRef] [Green Version]
- Van de Waal, E.; Borgeaud, C.; Whiten, A. Potent social learning and conformity shape a wild primate’s foraging decisions. Science 2013, 340, 483–485. [Google Scholar] [CrossRef]
- Barnier, F.; Valeix, M.; Duncan, P.; Chamaillé-Jammes, S.; Barre, P.; Loveridge, A.J.; Macdonald, D.W.; Fritz, H. Diet quality in a wild grazer declines under the threat of an ambush predator. Proc. Royal Soc. B 2014, 281, 20140446. [Google Scholar] [CrossRef]
- Navarro-Castilla, Á.; Barja, I. Stressful living in lower-quality habitats? Body mass, feeding behaviour and physiological stress levels in wild wood mouse populations. Integr. Zool. 2019, 14, 114–126. [Google Scholar] [CrossRef] [PubMed] [Green Version]
- Morán-López, T.; Sánchez-Dávila, J.; Torre, I.; Navarro-Castilla, Á.; Barja, I.; Díaz, M. Ungulate presence and predation risks reduce acorn predation by mice in dehesas. PLoS ONE 2022, 17, e0260419. [Google Scholar] [CrossRef] [PubMed]
- Nielsen, J.M.; Clare, E.L.; Hayden, B.; Brett, M.T.; Kratina, P. Diet tracing in ecology: Method comparison and selection. Methods Ecol. Evol. 2018, 9, 278–291. [Google Scholar] [CrossRef]
- Rosellini, S.; Barja, I.; Piñeiro, A. The response of European pine marten (Martes martes L.) feeding to the changes of small mammal abundance. Pol. J. Ecol. 2008, 56, 497–504. [Google Scholar]
- Klare, U.; Kamler, J.F.; Macdonald, D.W. A comparison and critique of different scat-analysis methods for determining carnivore diet. Mamm. Rev. 2011, 41, 294–312. [Google Scholar] [CrossRef]
- Piñeiro, A.; Barja, I. Trophic strategy of the wildcat Felis silvestris in relation to seasonal variation in the availability and vulnerability to capture of Apodemus mice. Mamm. Biol. 2011, 76, 302–307. [Google Scholar] [CrossRef]
- Móré, A.; Mizsei, E.; Vadász, C.; Tóthmérész, B.; Heltai, M. Analysis of mammal mesopredator scat samples indicates significant predation on the endangered Hungarian meadow viper (Vipera ursinii rakosiensis). Wildl. Biol. 2022, 2022, e01033. [Google Scholar] [CrossRef]
- Rosellini, S.; Osorio, E.; Ruiz-González, A.; Piñeiro, A.; Barja, I. Monitoring the small-scale distribution of sympatric European pine martens (Martes martes) and stone martens (Martes foina): A multievidence approach using faecal DNA analysis and camera-traps. Wildl. Res. 2008, 35, 434–440. [Google Scholar] [CrossRef]
- Franco-Trecu, V.; Drago, M.; Riet-Sapriza, F.G.; Parnell, A.; Frau, R.; Inchausti, P. Bias in diet determination: Incorporating traditional methods in Bayesian mixing models. PLoS ONE 2013, 8, e80019. [Google Scholar] [CrossRef] [Green Version]
- Zarzoso-Lacoste, D.; Bonnaud, E.; Corse, E.; Gilles, A.; Meglecz, E.; Costedoat, C.; Gouni, A.; Vidal, E. Improving morphological diet studies with molecular ecology: An application for invasive mammal predation on island birds. Biol. Conserv. 2016, 193, 134–142. [Google Scholar] [CrossRef]
- Monterroso, P.; Godinho, R.; Oliveira, T.; Ferreras, P.; Kelly, M.J.; Morin, D.J.; Waits, L.P.; Alves, P.C.; Mills, L.S. Feeding ecological knowledge: The underutilised power of faecal DNA approaches for carnivore diet analysis. Mamm. Rev. 2019, 49, 97–112. [Google Scholar] [CrossRef]
- Navarro-Castilla, Á.; Sánchez-González, B.; Barja, I. Latrine behaviour and faecal corticosterone metabolites as indicators of habitat-related responses of wild rabbits to predation risk. Ecol. Ind. 2019, 97, 175–182. [Google Scholar] [CrossRef]
- de Andrés, P.J.; Cáceres, S.; Crespo, B.; Silván, G.; Illera, J.C. Non-Invasive determination of annual fecal cortisol, androstenedione, and testosterone variations in a herd of male Asian elephants (Elephas maximus) and their relation to some climatic variables. Animals 2021, 11, 2723. [Google Scholar] [CrossRef] [PubMed]
- Martín, J.; Barja, I.; López, P. Chemical scent constituents in feces of wild Iberian wolves (Canis lupus signatus). Biochem. Syst. Ecol. 2010, 38, 1096–1102. [Google Scholar] [CrossRef]
- Kelly, J.F. Stable isotopes of carbon and nitrogen in the study of avian and mammalian trophic ecology. Can. J. Zool. 2000, 78, 1–27. [Google Scholar] [CrossRef]
- Botha, M.S.; Stock, W.D. Stable isotope composition of faeces as an indicator of seasonal diet selection in wild herbivores in southern Africa. S. Afr. J. Sci. 2005, 101, 371–374. [Google Scholar]
- Munn, A.J.; Dawson, T.J.; Hume, I.D. Endogenous nitrogen excretion by red kangaroos (Macropus rufus): Effects of animal age and forage quality. Physiol. Biochem. Zool. 2006, 79, 424–436. [Google Scholar] [CrossRef] [Green Version]
- Miller, J.F.; Millar, J.S.; Longstaffe, F.J. Stable nitrogen and carbon isotope discrimination between juveniles and adults in an income-breeding small mammal (Peromyscus maniculatus). Mamm. Biol. 2011, 76, 563–569. [Google Scholar] [CrossRef]
- Deschner, T.; Fuller, B.T.; Oelze, V.M.; Boesch, C.; Hublin, J.; Mundry, R.; Richards, M.P.; Ortmann, S.; Hohmann, G. Identification of energy consumption and nutritional stress by isotopic and elemental analysis of urine in bonobos (Pan paniscus). Rapid Commun. Mass Spectrom. 2012, 26, 69–77. [Google Scholar] [CrossRef]
- Holá, M.; Ježek, M.; Kušta, T.; Košatová, M. Trophic discrimination factors of stable carbon and nitrogen isotopes in hair of corn fed wild boar. PLoS ONE 2015, 10, e0125042. [Google Scholar] [CrossRef] [Green Version]
- McLaren, A.A.D.; Crawshaw, G.J.; Patterson, B.R. Carbon and nitrogen discrimination factors of wolves and accuracy of diet inferences using stable isotope analysis. Wildl. Soc. Bull. 2015, 39, 788–796. [Google Scholar] [CrossRef]
- Montanari, S.; Amato, G. Discrimination factors of carbon and nitrogen stable isotopes from diet to hair and scat in captive tigers (Panthera tigris) and snow leopards (Uncia uncia). Rapid Commun. Mass Spectrom. 2015, 29, 1062–1068. [Google Scholar] [CrossRef] [PubMed]
- Roswag, A.; Becker, N.I.; Millesi, E.; Otto, M.S.; Ruoss, S.; Sander, M.; Siutz, C.; Weinhold, U.; Encarnação, J.A. Stable isotope analysis as a minimal-invasive method for dietary studies on the highly endangered common hamster (Cricetus cricetus). Mammalia 2018, 82, 600–606. [Google Scholar] [CrossRef]
- Codron, J.; Codron, D.; Lee-Thorp, J.A.; Sponheimer, M.; De Ruiter, D. Animal diets in the Waterberg based on stable isotopic composition of faeces. S. Afr. J. Wildl. Res. 2005, 35, 43–52. [Google Scholar]
- Sergiel, A.; Barja, I.; Navarro-Castilla, Á.; Zwijacz-Kozica, T.; Selva, N. Losing seasonal patterns in a hibernating omnivore? Diet quality proxies and faecal cortisol metabolites in brown bears in areas with and without artificial feeding. PLoS ONE 2020, 15, e0242341. [Google Scholar] [CrossRef] [PubMed]
- Leslie, D.M., Jr.; Bowyer, R.T.; Jenks, J.A. Facts from feces: Nitrogen still measures up as a nutritional index for mammalian herbivores. J. Wildl. Manag. 2008, 72, 1420–1433. [Google Scholar] [CrossRef]
- Escribano-Ávila, G.; Pettorelli, N.; Virgós, E.; Lara-Romero, C.; Lozano, J.; Barja, I.; Cuadra, F.S.; Puerta, M. Testing Cort-Fitness and Cort-Adaptation hypotheses in a habitat suitability gradient for roe deer. Acta Oecol. 2013, 53, 38–48. [Google Scholar] [CrossRef]
- Carpio, A.J.; Guerrero-Casado, J.; Ruiz-Aizpurua, L.; Tortosa, F.S.; Vicente, J. Interpreting faecal nitrogen as a non-invasive indicator of diet quality and body condition in contexts of high ungulate density. Eur. J. Wildl. Res. 2015, 61, 557–562. [Google Scholar] [CrossRef] [Green Version]
- Schetter, T.A.; Lochmiller, R.L.; Leslie, D.M., Jr.; Engle, D.M.; Payton, M.E. Examination of the nitrogen limitation hypothesis in non-cyclic populations of cotton rats (Sigmodon hispidus). J. Anim. Ecol. 1998, 67, 705–721. [Google Scholar] [CrossRef]
- Clark, J.E.; Hellgren, E.C.; Parsons, J.L.; Jorgensen, E.E.; Engle, D.M.; Leslie, D.M. Nitrogen outputs from fecal and urine deposition of small mammals: Implications for nitrogen cycling. Oecologia 2005, 144, 447–455. [Google Scholar] [CrossRef]
- Mbatha, K.R.; Ward, D. Using faecal profiling to assess the effects of different management types on diet quality in semi-arid savanna. Afr. J. Range Forage Sci. 2006, 23, 29–38. [Google Scholar] [CrossRef]
- Gil-Jiménez, E.; Villamuelas, M.; Serrano, E.; Delibes, M.; Fernández, N. Fecal nitrogen concentration as a nutritional quality indicator for European rabbit ecological studies. PLoS ONE 2015, 10, e0125190. [Google Scholar] [CrossRef] [PubMed]
- Hagen, K.B.; Besselmann, D.; Cyrus-Eulenberger, U.; Vendl, C.; Ortmann, S.; Zingg, R.; Kienzle, E.; Kreuzer, M.; Hatt, J.; Clauss, M. Digestive physiology of the plains viscacha (Lagostomus maximus): A large herbivorous hystricomorph rodent. Zoo Biol. 2015, 34, 345–359. [Google Scholar] [CrossRef] [Green Version]
- Crawford, K.; Mcdonald, R.A.; Bearhop, S. Applications of stable isotope techniques to the ecology of mammals. Mamm. Rev. 2008, 38, 87–107. [Google Scholar] [CrossRef]
- Boecklen, W.J.; Yarnes, C.T.; Cook, B.A.; James, A.C. On the use of stable isotopes in trophic ecology. Annu. Rev. Ecol. Evol. Syst. 2011, 42, 411–440. [Google Scholar] [CrossRef] [Green Version]
- Ben-David, M.; Flaherty, E.A. Stable isotopes in mammalian research: A beginner’s guide. J. Mammal. 2012, 93, 312–328. [Google Scholar] [CrossRef] [Green Version]
- Voigt, C.C. Studying animal diets in situ using portable stable isotope analyzers. Biotropica 2009, 41, 271–274. [Google Scholar] [CrossRef]
- Sponheimer, M.; Robinson, T.; Ayliffe, L.; Passey, B.; Roeder, B.; Shipley, L.; Lopez, E.; Cerling, T.; Dearing, D.; Ehleringer, J. An experimental study of carbon-isotope fractionation between diet, hair, and feces of mammalian herbivores. Can. J. Zool. 2003, 81, 871–876. [Google Scholar] [CrossRef]
- Hwang, Y.T.; Millar, J.S.; Longstaffe, F.J. Do δ15N and δ13C values of feces reflect the isotopic composition of diets in small mammals? Can. J. Zool. 2007, 85, 388–396. [Google Scholar] [CrossRef]
- Blumenthal, S.A.; Chritz, K.L.; Rothman, J.M.; Cerling, T.E. Detecting intraannual dietary variability in wild mountain gorillas by stable isotope analysis of feces. Proc. Natl. Acad. Sci. USA 2012, 109, 21277–21282. [Google Scholar] [CrossRef] [Green Version]
- Bauduin, S.; Cassaing, J.; Issam, M.; Martin, C. Interactions between the short-tailed mouse (Mus spretus) and the wood mouse (Apodemus sylvaticus): Diet overlap revealed by stable isotopes. Can. J. Zool. 2013, 91, 102–109. [Google Scholar] [CrossRef]
- Heylen, D.; Schmidt, O.; Dautel, H.; Gern, L.; Kampen, H.; Newton, J.; Gray, J. Host identification in unfed ticks from stable isotope compositions (δ13C and δ15N). Med. Vet. Entomol. 2019, 33, 360–366. [Google Scholar] [CrossRef]
- Gurnell, J.; Flowerdew, J.R. Live Trapping Small Mammals. A Practical Guide, 3rd ed.; The Mammal Society: London, UK, 1994. [Google Scholar]
- Navarro-Castilla, Á.; Barja, I. Antipredatory response and food intake in wood mice (Apodemus sylvaticus) under simulated predation risk by resident and novel carnivorous predators. Ethology 2014, 120, 90–98. [Google Scholar] [CrossRef]
- Latshaw, W.L.; Miller, E.C. Elemental composition of the corn plant. J. Agric. Res. 1924, 27, 845–861. [Google Scholar]
- Bahar, B.; Monahan, F.J.; Moloney, A.P.; O’Kiely, P.; Scrimgeour, C.M.; Schmidt, O. Alteration of the carbon and nitrogen stable isotope composition of beef by substitution of grass silage with maize silage. Rapid Commun. Mass Spectrom. 2005, 19, 1937–1942. [Google Scholar] [CrossRef]
- Szpak, P.; Millaire, J.; White, C.D.; Longstaffe, F.J. Influence of seabird guano and camelid dung fertilization on the nitrogen isotopic composition of field-grown maize (Zea mays). J. Archaeol. Sci. 2012, 39, 3721–3740. [Google Scholar] [CrossRef]
- Ahmad, N.; Sahrin, N.; Talib, N.; Ghani, F.S.A. Characterization of energy content in food waste by using thermogravimetric analyser (TGA) and elemental analyser (CHNS-O). J. Phys. Conf. Ser. 2019, 1349, 012140. [Google Scholar] [CrossRef]
- Jahren, A.H.; Kraft, R.A. Carbon and nitrogen stable isotopes in fast food: Signatures of corn and confinement. Proc. Natl. Acad. Sci. USA 2008, 105, 17855–17860. [Google Scholar] [CrossRef] [PubMed] [Green Version]
- Schwarz, R.; Kaspar, A.; Seelig, J.; Künnecke, B. Gastrointestinal transit times in mice and humans measured with 27Al and 19F nuclear magnetic resonance. Magn. Reson. Med. 2002, 48, 255–261. [Google Scholar] [CrossRef]
- Padmanabhan, P.; Grosse, J.; Asad, A.B.; Radda, G.K.; Golay, X. Gastrointestinal transit measurements in mice with 99mTc-DTPA-labeled activated charcoal using NanoSPECT-CT. EJNMMI Res. 2013, 3, 60. [Google Scholar] [CrossRef] [Green Version]
- Groen, K.; Trimbos, K.B.; Hein, S.; Blaauw, A.I.; van Bodegom, P.M.; Hahne, J.; Jacob, J. Establishment of a faecal DNA quantification technique for rare and cryptic diet constituents in small mammals. Mol. Ecol. Resour. 2022, 22, 2220–2231. [Google Scholar] [CrossRef] [PubMed]
- Montgomery, S.S.J.; Montgomery, W.I. Intrapopulation variation in the diet of the wood mouse Apodemus sylvaticus. J. Zool. 1990, 222, 641–651. [Google Scholar] [CrossRef]
- Ozaki, S.; Fritsch, C.; Valot, B.; Mora, F.; Cornier, T.; Scheifler, R.; Raoul, F. How do richness and composition of diet shape trace metal exposure in a free-living generalist rodent, Apodemus sylvaticus. Environ. Sci. Technol. 2019, 53, 5977–5986. [Google Scholar] [CrossRef]
- Kohn, M.J. Carbon isotope compositions of terrestrial C3 plants as indicators of (paleo) ecology and (paleo) climate. Proc. Natl. Acad. Sci. USA 2010, 107, 19691–19695. [Google Scholar] [CrossRef] [Green Version]
- Chibowski, P.; Brzeziński, M.; Suska-Malawska, M.; Zub, K. Diet/hair and diet/faeces trophic discrimination factors for stable carbon and nitrogen isotopes, and hair regrowth in the yellow-necked mouse and bank vole. Ann. Zool. Fenn. BioOne 2022, 59, 171–185. [Google Scholar] [CrossRef]
- Sare, D.T.J.; Millar, J.S.; Longstaffe, F.J. Tracing dietary protein in red-backed voles (Clethrionomys gapperi) using stable isotopes of nitrogen and carbon. Can. J. Zool. 2005, 83, 717–725. [Google Scholar] [CrossRef]
- Cassaing, J.; Derré, C.; Moussa, I.; Cheylan, G. Diet variability of Mediterranean insular populations of Rattus rattus studied by stable isotope analysis. Isotopes Environ. Health Stud. 2007, 43, 197–213. [Google Scholar] [CrossRef]
- Bergstrom, B.J. Would East African savanna rodents inhibit woody encroachment? Evidence from stable isotopes and microhistological analysis of feces. J. Mammal. 2013, 94, 436–447. [Google Scholar] [CrossRef] [Green Version]
- Hobbie, E.A.; Shamhart, J.; Sheriff, M.; Ouimette, A.P.; Trappe, M.; Schuur, E.A.G.; Hobbie, J.E.; Boonstra, R.; Barnes, B.M. Stable isotopes and radiocarbon assess variable importance of plants and fungi in diets of arctic ground squirrels. Arct. Antarct. Alp. Res. 2017, 49, 487–500. [Google Scholar] [CrossRef] [Green Version]
- Selva, N.; Hobson, K.A.; Cortés-Avizanda, A.; Zalewski, A.; Donázar, J.A. Mast pulses shape trophic interactions between fluctuating rodent populations in a primeval forest. PLoS ONE 2012, 7, e51267. [Google Scholar] [CrossRef]
- Codron, J.; Duffy, K.J.; Avenant, N.L.; Sponheimer, M.; Leichliter, J.; Paine, O.; Sandberg, P.; Codron, D. Stable isotope evidence for trophic niche partitioning in a South African savanna rodent community. Curr. Zool. 2015, 61, 397–411. [Google Scholar] [CrossRef]
- Galetti, M.; Rodarte, R.R.; Neves, C.L.; Moreira, M.; Costa-Pereira, R. Trophic niche differentiation in rodents and marsupials revealed by stable isotopes. PLoS ONE 2016, 11, e0152494. [Google Scholar] [CrossRef]
- Bovendorp, R.S.; Simoes, L.G.; Sarmento, M.M.; Camargo, P.B.; Percequillo, A.R. Age and habitat quality matters: Isotopic variation of two sympatric species of rodents in Neotropical Forest. Hystrix Ital. J. Mammal. 2017, 28, 214–221. [Google Scholar]
- Balčiauskas, L.; Skipitytė, R.; Balčiauskienė, L.; Jasiulionis, M. Resource partitioning confirmed by isotopic signatures allows small mammals to share seasonally flooded meadows. Ecol. Evol. 2019, 9, 5479–5489. [Google Scholar] [CrossRef]
- Haveles, A.W.; Fox, D.L.; Fox-Dobbs, K. Carbon isoscapes of rodent diets in the Great Plains USA deviate from regional gradients in C4 grass abundance due to a preference for C3 plant resources. Palaeogeogr. Palaeoclim. Palaeoecol. 2019, 527, 53–66. [Google Scholar] [CrossRef]
- Stephens, R.B.; Hobbie, E.A.; Lee, T.D.; Rowe, R.J. Pulsed resource availability changes dietary niche breadth and partitioning between generalist rodent consumers. Ecol. Evol. 2019, 9, 10681–10693. [Google Scholar] [CrossRef] [Green Version]
- Balčiauskas, L.; Balčiauskienė, L.; Garbaras, A.; Stirkė, V. Diversity and diet differences of small mammals in commensal habitats. Diversity 2021, 13, 346. [Google Scholar] [CrossRef]
- Palo, R.T.; Olsson, G.E. Nitrogen and carbon concentrations in the stomach content of bank voles (Myodes glareolus): Does food quality determine abundance? Open Ecol. J. 2009, 2, 86–90. [Google Scholar] [CrossRef]
- Balčiauskas, L.; Ežerinskis, Ž; Stirkė, V.; Balčiauskienė, L.; Garbaras, A.; Remeikis, V. The elemental composition of small mammals in a commercial orchard–meadow system. Chemosphere 2022, 296, 134048. [Google Scholar] [CrossRef] [PubMed]
- Crowley, B.E.; Castro, I.; Soarimalala, V.; Goodman, S.M. Isotopic evidence for niche partitioning and the influence of anthropogenic disturbance on endemic and introduced rodents in central Madagascar. Sci. Nat. 2018, 105, 44. [Google Scholar] [CrossRef]
- Balčiauskas, L.; Skipitytė, R.; Garbaras, A.; Stirkė, V.; Balčiauskienė, L.; Remeikis, V. Isotopic niche of syntopic granivores in commercial orchards and meadows. Animals 2021, 11, 2375. [Google Scholar] [CrossRef] [PubMed]
- Balčiauskas, L.; Skipitytė, R.; Garbaras, A.; Stirkė, V.; Balčiauskienė, L.; Remeikis, V. Stable isotopes reveal the dominant species to have the widest trophic niche of three syntopic Microtus voles. Animals 2021, 11, 1814. [Google Scholar] [CrossRef]
- Balčiauskas, L.; Stirkė, V.; Garbaras, A.; Skipitytė, R.; Balčiauskienė, L. Stable isotope analysis supports omnivory in bank voles in apple orchards. Agriculture 2022, 12, 1308. [Google Scholar] [CrossRef]
- Khammes, N.; Aulagnier, S. Diet of the wood mouse, Apodemus sylvaticus in three biotopes of Kabylie of Djurdjura (Algeria). Folia Zool. 2007, 56, 243–252. [Google Scholar]
- MacAvoy, S.E.; Macko, S.A.; Arneson, L.S. Growth versus metabolic tissue replacement in mouse tissues determined by stable carbon and nitrogen isotope analysis. Can. J. Zool. 2005, 83, 631–641. [Google Scholar] [CrossRef]
- Mirón, L.L.M.; Herrera, L.G.M.; Ramírez, N.P.; Hobson, K.A. Effect of diet quality on carbon and nitrogen turnover and isotopic discrimination in blood of a New World nectarivorous bat. J. Exp. Biol. 2006, 209, 541–548. [Google Scholar] [CrossRef] [Green Version]
- Miller, J.F.; Millar, J.S.; Longstaffe, F.J. Carbon-and nitrogen-isotope tissue–diet discrimination and turnover rates in deer mice, Peromyscus maniculatus. Can. J. Zool. 2008, 86, 685–691. [Google Scholar] [CrossRef]
- Holišová, V. Potrava mysice krovinne Apodemus sylvaticus L. na Ceskomoravske vrchovine. Zool. Listy 1960, 9, 135–158. [Google Scholar]
- Watts, C.H.S. The foods eaten by wood mice (Apodemus sylvaticus) and bank voles (Clethrionomys glareolus) in Wytham Woods, Berkshire. J. Anim. Ecol. 1968, 37, 25–41. [Google Scholar] [CrossRef]
- Karasov, W.H.; Martínez del Rio, C. Physiological Ecology: How Animals Process Energy, Nutrients, and Toxins; Princeton University Press: Princeton, NJ, USA, 2007. [Google Scholar]
- Speakman, J.R. The physiological costs of reproduction in small mammals. Philos. Trans. R. Soc. Lond. B Biol. Sci. 2008, 363, 375–398. [Google Scholar] [CrossRef] [Green Version]
- Fuller, B.T.; Fuller, J.L.; Sage, N.E.; Harris, D.A.; O’Connell, T.C.; Hedges, R.E.M. Nitrogen balance and δ15N: Why you’re not what you eat during pregnancy. Rapid Commun. Mass Spectrom. 2004, 18, 2889–2896. [Google Scholar] [CrossRef] [PubMed]
- Robb, G.N.; Woodborne, S.; De Bruin, P.R.; Medger, K.; Bennett, N.C. The influence of food quantity on carbon and nitrogen stable isotope values in southern African spiny mice (Acomys spinosissimus). Can. J. Zool. 2015, 93, 345–351. [Google Scholar] [CrossRef] [Green Version]
- Carter, W.A.; Bauchinger, U.; McWilliams, S.R. The importance of isotopic turnover for understanding key aspects of animal ecology and nutrition. Diversity 2019, 11, 84. [Google Scholar] [CrossRef] [Green Version]


| C | N | δ13C | δ15N | ||||||
|---|---|---|---|---|---|---|---|---|---|
| Mean | SE | Mean | SE | Mean | SE | Mean | SE | ||
| Pooled data | 43.98 | 0.34 | 4.83 | 0.08 | −22.91 | 0.22 | 3.89 | 0.15 | |
| Range (min-max) | (27.80–50.30) | (3.10–9.00) | (−27.60–−17.30) | (0.20–8.30) | |||||
| Sex | male | 43.45 | 0.49 | 4.84 | 0.15 | −22.92 | 0.29 | 4.18 | 0.19 |
| female | 44.37 | 0.47 | 4.83 | 0.10 | −22.90 | 0.34 | 3.48 | 0.23 | |
| Breeding condition | breeder | 43.72 | 0.52 | 4.85 | 0.13 | −22.47 | 0.31 | 4.02 | 0.20 |
| non-breeder | 44.21 | 0.45 | 4.81 | 0.11 | −23.28 | 0.29 | 3.78 | 0.22 | |
| Age | juveniles | 44.12 | 1.58 | 4.58 | 0.25 | −23.13 | 0.90 | 3.77 | 0.63 |
| subadults | 44.09 | 0.52 | 4.88 | 0.15 | −23.53 | 0.36 | 3.63 | 0.26 | |
| adults | 43.97 | 0.48 | 4.84 | 0.11 | −22.48 | 0.28 | 4.09 | 0.20 | |
| C (%) | N (%) | ||||||
|---|---|---|---|---|---|---|---|
| Mean | SE | Statistic | Mean | SE | Statistic | ||
| Food groups | <1 g | 44.08 | 1.02 | ANOVA F4,113 = 1.284, p = 0.281 | 4.90 | 0.24 | ANOVA F4,113 = 0.545, p = 0.703 |
| 1–<2 g | 42.88 | 0.94 | 4.85 | 0.20 | |||
| 2–<3 g | 44.53 | 0.51 | 4.77 | 0.22 | |||
| 3–<4 g | 43.31 | 0.92 | 4.65 | 0.14 | |||
| 4–5 g | 44.94 | 0.55 | 5.01 | 0.16 | |||
| δ13C | δ15N | |||||
|---|---|---|---|---|---|---|
| Factors | df | F | p | df | F | p |
| Corrected model | 9 | 2.537 | 0.011 | 9 | 2.293 | 0.022 |
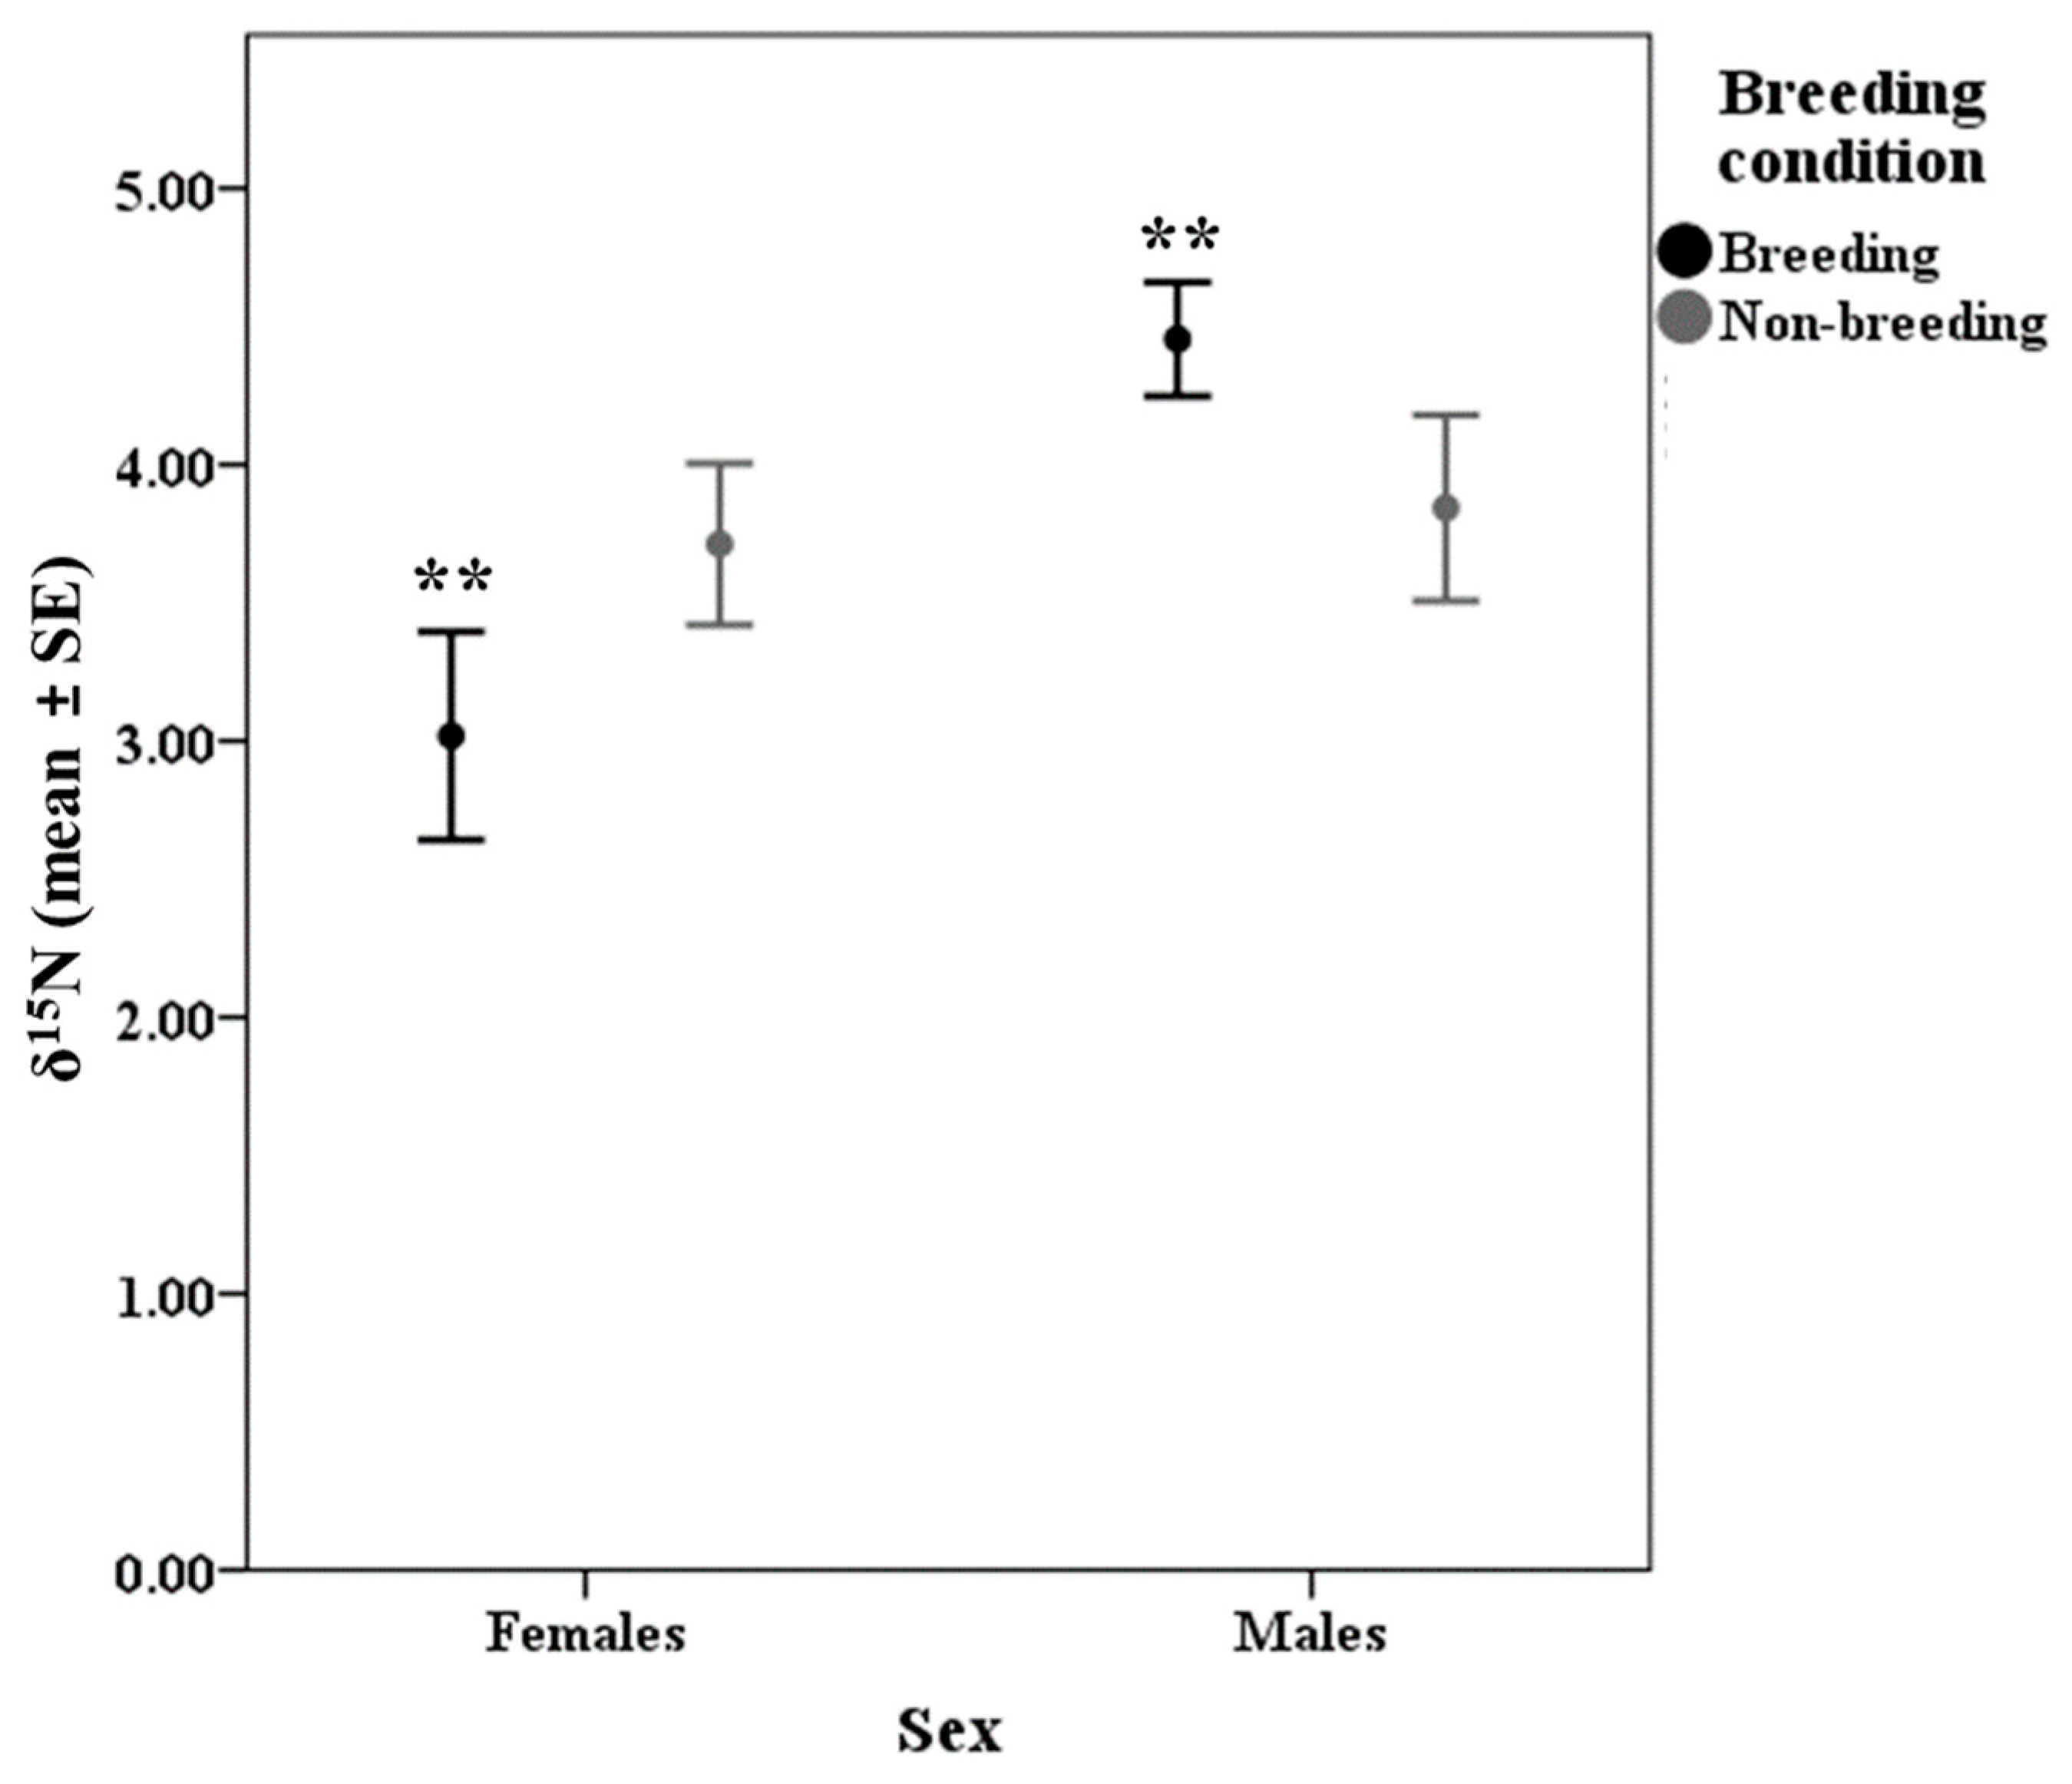
| Sex | 1 | 2.303 | 0.132 | 1 | 6.110 | 0.015 |
| Breeding condition | 1 | 0.018 | 0.892 | 1 | 0.054 | 0.817 |
| Age | 2 | 1.051 | 0.353 | 2 | 0.166 | 0.848 |
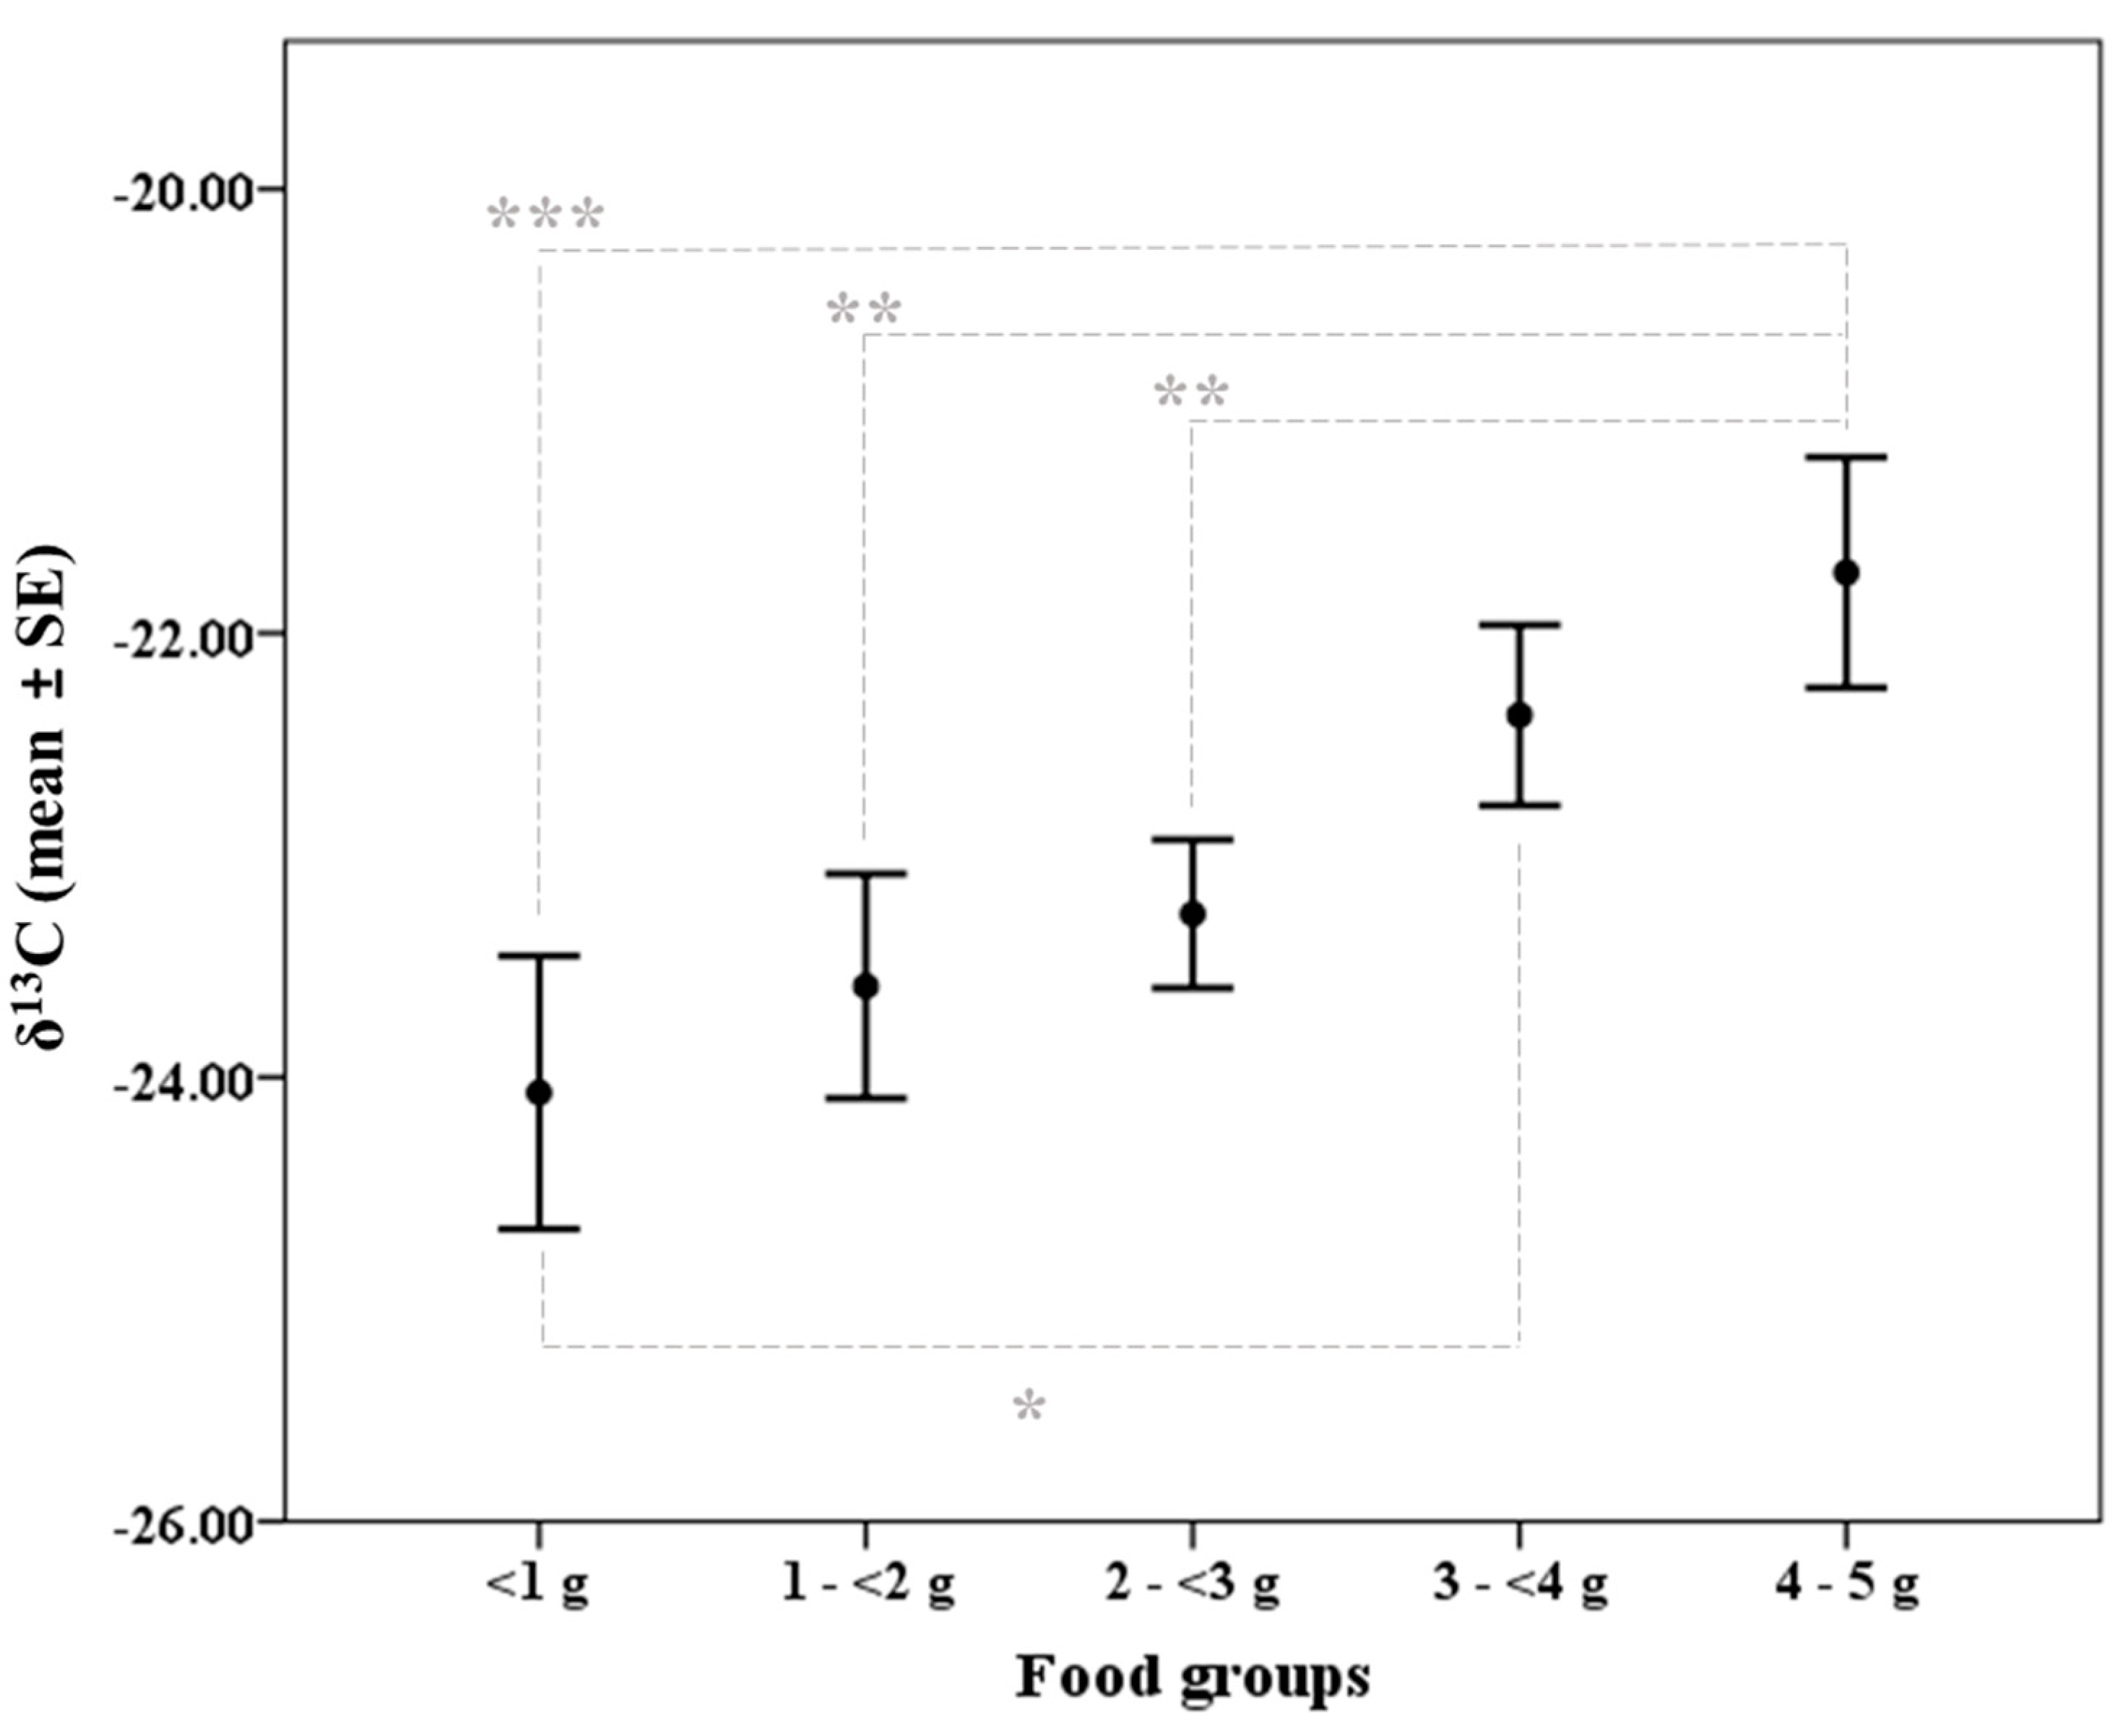
| Food group | 4 | 4.468 | 0.002 | 4 | 2.241 | 0.070 |
| Sex * Breeding condition | 1 | 0.038 | 0.846 | 1 | 4.582 | 0.035 |
| Error | 102 | 102 | ||||
| Recapture * Individual ª | ||||||
Disclaimer/Publisher’s Note: The statements, opinions and data contained in all publications are solely those of the individual author(s) and contributor(s) and not of MDPI and/or the editor(s). MDPI and/or the editor(s) disclaim responsibility for any injury to people or property resulting from any ideas, methods, instructions or products referred to in the content. |
© 2023 by the authors. Licensee MDPI, Basel, Switzerland. This article is an open access article distributed under the terms and conditions of the Creative Commons Attribution (CC BY) license (https://creativecommons.org/licenses/by/4.0/).
Share and Cite
Navarro-Castilla, Á.; Hernández, M.C.; Barja, I. An Experimental Study in Wild Wood Mice Testing Elemental and Isotope Analysis in Faeces to Determine Variations in Food Intake Amount. Animals 2023, 13, 1176. https://doi.org/10.3390/ani13071176
Navarro-Castilla Á, Hernández MC, Barja I. An Experimental Study in Wild Wood Mice Testing Elemental and Isotope Analysis in Faeces to Determine Variations in Food Intake Amount. Animals. 2023; 13(7):1176. https://doi.org/10.3390/ani13071176
Chicago/Turabian StyleNavarro-Castilla, Álvaro, M. Carmen Hernández, and Isabel Barja. 2023. "An Experimental Study in Wild Wood Mice Testing Elemental and Isotope Analysis in Faeces to Determine Variations in Food Intake Amount" Animals 13, no. 7: 1176. https://doi.org/10.3390/ani13071176