
Prediction of the Net Energy of Wheat from Chemical Analysis for Growing Ducks
 ,
,
Abstract
:Simple Summary
Abstract
1. Introduction
2. Materials and Methods
2.1. Wheat Sample Collection
2.2. Experimental Design
2.3. Experimental Diets
2.4. Management
2.5. Sample Collection and Processing
- (1)
- Feed sample
- (2)
- Excretal sample
- (3)
- Meat duck carcass
2.6. Chemical Analysis
2.7. Measurements
2.8. Statistical Analysis
3. Results
3.1. Physical and Chemical Characteristics of Wheats
3.2. Energy Concentration, NE/AME, NEm and NEp of 40 Wheat Samples
3.3. Correlation among Chemical Characteristics and AME, Prediction Equations of NE
4. Discussion
4.1. Variation of Chemical Compositions in Wheat
4.2. Determined Methods of NE, NEm and NE among Wheat
4.3. Establishment of Prediction Equations of NE from Chemical Compositions
5. Conclusions
Author Contributions
Funding
Institutional Review Board Statement
Informed Consent Statement
Data Availability Statement
Conflicts of Interest
References
- Sakomura, N.K.; Resende, K.T.; Fernandes, J.; Rabelo, C.; Neme, R. Net energy requirement models for broiler breeders, laying hens and broilers. In Proceedings of the 15th European Symposium on Poultry Nutrition, Balatonfured, Hungary, 25–29 September 2005; pp. 25–29. [Google Scholar]
- Swick, R.A.; Wu, S.B.; Zuo, J.; Rodgers, N.; Choct, M. Implications and development of a net energy system for broilers. Anim. Prod. Sci. 2013, 53, 1231–1237. [Google Scholar] [CrossRef]
- NRC. Nutrient Requirements of Swine; National Academies Press: Washington, DC, USA, 2012.
- Ball, M.; Owens, B.; McCracken, K. Chemical and physical predictors of the nutritive value of wheat in broiler diets. Asian-Australas. J. Anim. Sci. 2013, 26, 97–107. [Google Scholar] [CrossRef]
- Noblet, J.; Fortune, H.; Shi, X.S.; Dubois, S. Prediction of net energy value of feeds for growing pigs. J. Anim. Sci. 1994, 72, 344–354. [Google Scholar] [CrossRef] [PubMed]
- National Research Council. Nutrient Requirements of Poultry, 9th ed.; National Academic Press: Washington, DC, USA, 1994. [Google Scholar]
- Van Soest, P.J.; Robertson, J.B.; Lewis, B.A. Methods for dietary fiber, neutral detergent fiber, and nonstarch polysaccharides in relation to animal nutrition. J. Dairy Sci. 1991, 74, 3583–3597. [Google Scholar] [CrossRef]
- Noblet, J.; Shi, X.S.; Dubois, S. Metabolic utilization of dietary energy and nutrients for maintenance energy requirements in sows: Basis for a net energy system. Br. J. Nutr. 1993, 70, 407–419. [Google Scholar] [CrossRef]
- Fosoul, S.S.A.S.; Azarfar, A.; Gheisari, A.; Khosravinia, H. Energy utilisation of broiler chickens in response to guanidinoacetic acid supplementation in diets with various energy contents. Br. J. Nutr. 2018, 120, 131–140. [Google Scholar] [CrossRef] [PubMed] [Green Version]
- Lofgreen, G.; Garrett, W. A system for expressing net energy requirements and feed values for growing and finishing beef cattle. J. Anim. Sci. 1968, 27, 793–806. [Google Scholar] [CrossRef]
- Kim, J.C.; Simmins, P.H.; Mullan, B.P.; Pluske, J.R. The digestible energy value of wheat for pigs, with special reference to the post-weaned animal [Review]. Anim. Feed Sci. Technol. 2005, 122, 257–287. [Google Scholar] [CrossRef]
- Rosenfelder, P.; Eklund, M.; Mosenthin, R. Nutritive value of wheat and wheat by-products in pig nutrition: A review. Anim. Feed Sci. Technol. 2013, 185, 107–125. [Google Scholar] [CrossRef]
- Kim, J.C.; Simmins, P.H.; Pluske, J.R. Variation in the chemical composition of wheats grown in Western Australia as influenced by variety, growing region, season, and post-harvest storage. Crop Pasture Sci. 2003, 54, 541–550. [Google Scholar] [CrossRef]
- Jha, R.; Overend, D.; Simmins, P.; Hickling, D.; Zijlstra, R. Chemical characteristics, feed processing quality, growth performance and energy digestibility among wheat classes in pelleted diets fed to weaned pigs. Anim. Feed Sci. Technol. 2011, 170, 78–90. [Google Scholar] [CrossRef]
- Zijlstra, R.; Lange, C.D.; Patience, J. Nutritional value of wheat for growing pigs: Chemical composition and digestible energy content. Can. J. Anim. Sci. 1999, 79, 187–194. [Google Scholar] [CrossRef]
- Xiong, B.H.; Pang, Z.H.; Luo, Q.Y. Tables of feed composition and nutritive values in China. China Feed 2012, 21, 33–44. [Google Scholar]
- Barteczko, J.; Augustyn, R.; Lasek, O.; Smulikowska, S. Chemical composition and nutritional value of different wheat cultivars for broiler chickens. Cotton Outlook 2009, 18, 124–131. [Google Scholar] [CrossRef]
- Kim, J.; Mullan, B.; Simmins, P.; Pluske, J. Effect of variety, growing region and growing season on digestible energy content of wheats grown in Western Australia for weaner pigs. Anim. Sci. 2004, 78, 53–60. [Google Scholar] [CrossRef] [Green Version]
- de Lange, K.; van Milgen, J.; Noblet, J.; Dubois, S.; Birkett, S. Previous feeding level influences plateau heat production following a 24 h fast in growing pigs. Br. J. Nutr. 2006, 95, 1082–1087. [Google Scholar] [CrossRef]
- Liu, D.; Jaworski, N.W.; Zhang, G.; Li, Z.; Li, D.; Wang, F. Effect of experimental methodology on fasting heat production and the net energy content of corn and soybean meal fed to growing pigs. Arch. Anim. Nutr. 2014, 68, 281–295. [Google Scholar] [CrossRef]
- Hu, Q.; Wang, F.L.; Piao, X.S.; Ni, J.J.; Zhang, X.M.; Li, D.F. Effects of Fasting Duration and Body Weight on Fasting Heat Production in Growing Pigs. J. Anim. Vet. Adv. 2012, 11, 2333–2341. [Google Scholar]
- Labussiere, E.; Van Milgen, J.; de Lange, C.F.; Noblet, J. Maintenance energy requirements of growing pigs and calves are influenced by feeding level. J. Nutr. 2011, 141, 1855–1861. [Google Scholar] [CrossRef] [Green Version]
- Zhang, G.F.; Liu, D.W.; Wang, F.L.; Li, D.F. Estimation of the net energy requirements for maintenance in growing and finishing pigs. J. Anim. Sci. 2014, 92, 2987–2995. [Google Scholar] [CrossRef]
- Sakomura, N.K.; Longo, F.A.; Oviedo-Rondon, E.O.; Boa-Viagem, C.; Ferraudo, A. Modeling energy utilization and growth parameter description for broiler chickens. Poult. Sci. 2005, 84, 1363–1369. [Google Scholar] [CrossRef] [PubMed]
- Liu, W.; Lin, C.H.; Wu, Z.K.; Liu, G.H.; Yan, H.J.; Yang, H.M.; Cai, H.Y. Estimation of the net energy requirement for maintenance in broilers. Asian-Australas. J. Anim. Sci. 2017, 30, 849–856. [Google Scholar] [CrossRef] [Green Version]
- Yang, T.; Yu, L.; Wen, M.; Zhao, H.; Chen, X.; Liu, G.; Tian, G.; Cai, J.; Jia, G. Modeling net energy requirements of 2 to 3-week-old Cherry Valley ducks. Asian-Australas. J. Anim. Sci. 2020, 33, 1624–1632. [Google Scholar] [CrossRef] [PubMed] [Green Version]
- Wang, X.; Jia, G.; Li, X.; Wang, K.N. Determination of the Net Energy and Appropriate Substitution Ratio of Soybean Meal Yellow-feathered Broilers for Using a Substitution Method. Chin. J. Anim. Nutr. 2010, 19, 168–174. [Google Scholar]
- Noblet, J.; Shi, X. Effect of body weight on digestive utilization of energy and nutrients of ingredients and diets in pigs. Livest. Prod. Sci. 1994, 37, 323–338. [Google Scholar] [CrossRef]
- Zhao, F.; Zhang, H.; Hou, S.; Zhang, Z. Predicting metabolizable energy of normal corn from its chemical composition in adult Pekin ducks. Poult. Sci. 2008, 87, 1603–1608. [Google Scholar] [CrossRef] [PubMed]
- Wan, H.; Chen, W.; Qi, Z.; Peng, P.; Peng, J. Prediction of true metabolizable energy from chemical composition of wheat milling by-products for ducks. Poult. Sci. 2009, 88, 92–97. [Google Scholar] [CrossRef]
- Fang, Z.; Liu, Z.; Dai, J.; Qian, H.; Qi, Z.; Ma, L.; Peng, J. Effects of enzyme addition on the nutritive value of broiler diets containing hulled or dehulled Chinese double-low rapeseed meals. J. Anim. Physiol. Anim. Nutr. 2009, 93, 467–476. [Google Scholar] [CrossRef]


| Ingredients | Basis Diets | Test Diets | Nutrient Levels | Basis Diets | Test Diets |
|---|---|---|---|---|---|
| Corn | 59.97 | 43.1 | ME (MJ/kg) | 12.11 | 12.18 |
| Wheat | 0 | 20 | CP | 20.50 | 20.58 |
| Soybean meal | 35.3 | 32.17 | Ga | 0.79 | 0.81 |
| Soybean oil | 1.2 | 1.2 | P | 0.69 | 0.70 |
| Limestone | 0.7 | 0.7 | Lys | 1.03 | 0.97 |
| Dicalcicum phosphate | 1.7 | 1.7 | Met | 0.46 | 0.46 |
| Nacl | 0.33 | 0.33 | Trp | 0.24 | 0.24 |
| 50%-Choline chloride | 0.15 | 0.15 | Thr | 0.77 | 0.73 |
| Vitamin premix 1 | 0.08 | 0.08 | Cys | 0.77 | 0.76 |
| Mineral premix 2 | 0.25 | 0.25 | |||
| DL-Methionine | 0.17 | 0.17 | |||
| L-Lysine.HCL | 0.045 | 0.045 | |||
| Tryptophan | 0.02 | 0.02 | |||
| Threonine | 0.085 | 0.085 | |||
| Total | 100 | 100 |
| Characteristic | Mean | CV * | lowest | Highest |
|---|---|---|---|---|
| Chemical Composition | ||||
| Moisture | 12.02 | 7.42 | 9.93 | 13.89 |
| EE | 1.90 | 12.90 | 1.31 | 3.29 |
| CP | 14.46 | 7.56 | 10.66 | 16.16 |
| CF | 3.07 | 8.77 | 2.65 | 3.73 |
| Ash | 1.76 | 17.55 | 1.31 | 3.29 |
| NDF | 9.56 | 11.54 | 6.80 | 12.15 |
| ADF | 2.58 | 15.54 | 1.69 | 3.92 |
| Physical Characteristics | ||||
| Bulk weight g/L | 775.30 | 4.95 | 660.4 | 863 |
| Terms | Mean ± SD | CV % | Lowest | Highest |
|---|---|---|---|---|
| GE KJ/g | 16.21 ± 0.19 | 1.16 | 15.71 | 16.54 |
| AME MJ/kg | 13.15 ± 0.73 | 5.67 | 11.03 | 14.34 |
| NEm MJ/kg | 2.91 ± 0.62 | 21.92 | 2.01 | 4.14 |
| NEp MJ/kg | 5.57 ± 1.20 | 22.14 | 3.49 | 7.36 |
| NE MJ/kg | 8.15 ± 0.52 | 6.40 | 6.81 | 9.12 |
| NE/AME % | 61.93 ± 1.86 | 3.01 | 57.92 | 65.12 |
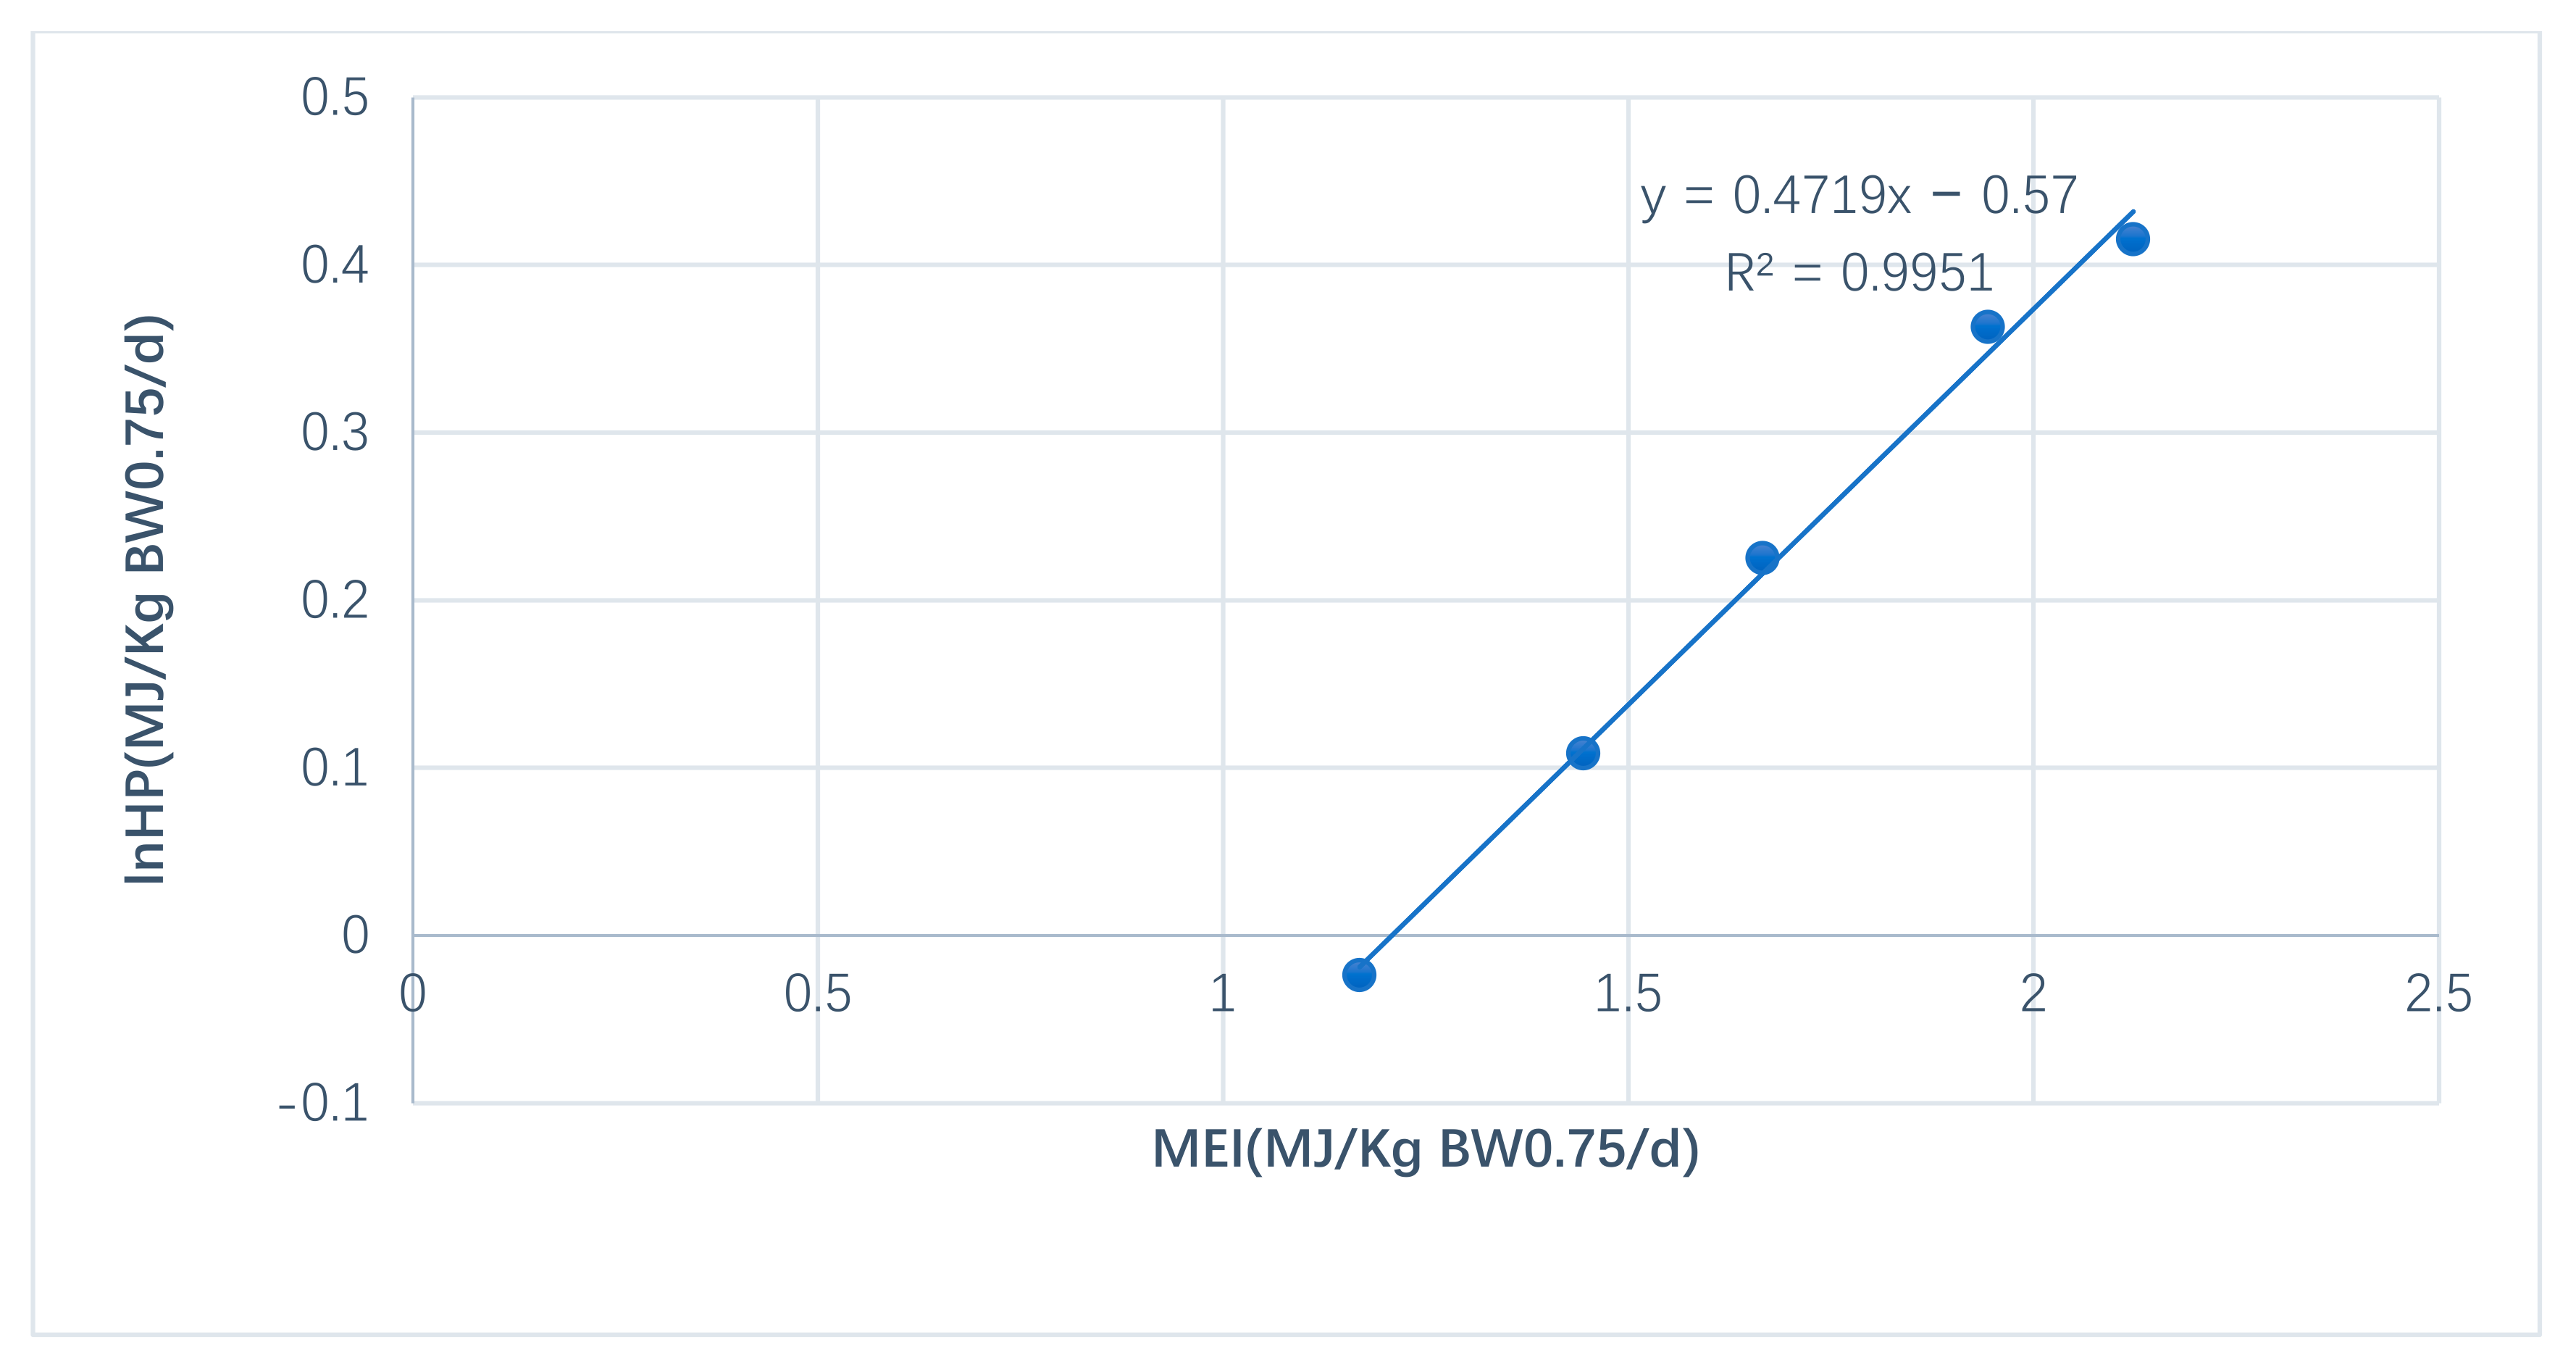
| Feeding Levels | Ad Libitum Intake | Restricted Feeding 15% | Restricted Feeding 30% | Restricted Feeding 45% | Restricted Feeding 60% |
|---|---|---|---|---|---|
| MEI (MJ/kgBW0.75d−1) | 2.10 ± 0.07 a | 1.94 ± 0.03 b | 1.67 ± 0.07 c | 1.44 ± 0.09 d | 1.17 ± 0.08 e |
| RE (MJ/kgBW0.75d−1) | 0.61 ± 0.04 a | 0.51 ± 0.03 b | 0.42 ± 0.02 c | 0.33 ± 0.01 d | 0.19 ± 0.03 e |
| HP (MJ/kgBW0.75d−1) | 1.51 ± 0.09 a | 1.43 ± 0.05 b | 1.25 ± 0.08 c | 1.11 ± 0.09 d | 0.98 ± 0.08 e |
| NE | AME | CP | CF | NDF | ADF | EE | Ash | Bulk Weight | |
|---|---|---|---|---|---|---|---|---|---|
| NE | 1 | 0.883 ** | 0.097 | −0.398 * | −0.835 ** | −0.676 ** | 0.432 ** | −0.215 | 0.176 |
| AME | 1 | 0.090 | −0.467 ** | −0.757 ** | −0.540 ** | 0.530 ** | −0.169 | 0.199 | |
| CP | 1 | −0.025 | −0.044 | −0.178 | 0.314 * | −0.411 ** | 0.142 | ||
| CF | 1 | 0.425 ** | 0.403 ** | −0.184 | 0.502 ** | −0.575 ** | |||
| NDF | 1 | 0.569 ** | −0.349 * | 0.142 | −0.173 | ||||
| ADF | 1 | 0.063 | −0.218 | 0.063 | |||||
| EE | 1 | −0.296 | 0.085 | ||||||
| Ash | 1 | −0.677 ** | |||||||
| Bulk weight | 1 |
| Equations | R2 | RSD | p Value | |
|---|---|---|---|---|
| (1) | NE = 11.919 − 0.394 NDF | 0.698 | 0.29 | <0.001 |
| (2) | NE = 12.151 − 0.315 NDF − 0.386 ADF | 0.757 | 0.26 | <0.001 |
| (3) | NE = 0.629 AME − 0.120 | 0.780 | 0.25 | <0.001 |
| (4) | NE = 0.418 AME − 0.184 NDF + 4.408 | 0.845 | 0.21 | <0.001 |
| (5) | NE = 0.380 AME − 0.147 NDF − 0.274 ADF + 5.262 | 0.874 | 0.19 | <0.001 |
Disclaimer/Publisher’s Note: The statements, opinions and data contained in all publications are solely those of the individual author(s) and contributor(s) and not of MDPI and/or the editor(s). MDPI and/or the editor(s) disclaim responsibility for any injury to people or property resulting from any ideas, methods, instructions or products referred to in the content. |
© 2023 by the authors. Licensee MDPI, Basel, Switzerland. This article is an open access article distributed under the terms and conditions of the Creative Commons Attribution (CC BY) license (https://creativecommons.org/licenses/by/4.0/).
Share and Cite
Liang, Y.; Hou, Q.; Yu, M.; Chang, Y.; Zhao, H.; Liu, G.; Chen, X.; Tian, G.; Cai, J.; Jia, G. Prediction of the Net Energy of Wheat from Chemical Analysis for Growing Ducks. Animals 2023, 13, 1097. https://doi.org/10.3390/ani13061097
Liang Y, Hou Q, Yu M, Chang Y, Zhao H, Liu G, Chen X, Tian G, Cai J, Jia G. Prediction of the Net Energy of Wheat from Chemical Analysis for Growing Ducks. Animals. 2023; 13(6):1097. https://doi.org/10.3390/ani13061097
Chicago/Turabian StyleLiang, Yanru, Qinteng Hou, Mengchao Yu, Yaqi Chang, Hua Zhao, Guangmang Liu, Xiaoling Chen, Gang Tian, Jingyi Cai, and Gang Jia. 2023. "Prediction of the Net Energy of Wheat from Chemical Analysis for Growing Ducks" Animals 13, no. 6: 1097. https://doi.org/10.3390/ani13061097