Article

Comparative Analysis of the Potential for Germ Cell (GC) Differentiation of Bovine Peripheral Blood Derived-Mesenchymal Stem Cells (PB-MSC) and Spermatogonial Stem Cells (SSC) in Co-Culture System with Sertoli Cells (SC)

by
Moisés N. Segunda
1,2,3,
Carlos Díaz
4,
Cristian G. Torres
5,
Víctor H. Parraguez
6,
Mónica De los Reyes
1 and
Oscar A. Peralta
1,*
1
Department of Animal Production Sciences, Faculty of Veterinary and Animal Sciences, University of Chile, Santa Rosa 11735, Santiago 8820808, Chile
2
Doctorate Program of Forestry, Agriculture, and Veterinary Sciences (DCSAV), University of Chile, Santa Rosa 11315, Santiago 8820808, Chile
3
Faculdade de Medicina Veterinária, Universidade José Eduardo dos Santos, Bairro Santo António-Avenida Nuno Alvarez, Huambo 555, Angola
4
Doctorate Program in Sciences, UNED, Bravo Murillo 38, 28015 Madrid, Spain
5
Department of Clinical Sciences, Faculty of Veterinary and Animal Sciences, University of Chile, Santa Rosa 11735, Santiago 8820808, Chile
6
Department of Biological Sciences, Faculty of Veterinary and Animal Sciences, University of Chile, Santa Rosa 11735, Santiago 8820808, Chile
*
Author to whom correspondence should be addressed.
Animals 2023, 13(2), 318; https://doi.org/10.3390/ani13020318
Submission received: 25 November 2022 / Revised: 28 December 2022 / Accepted: 31 December 2022 / Published: 16 January 2023
(This article belongs to the Special Issue Recent Advances in Reproductive Biotechnologies)

Abstract

:

Simple Summary

The primary function of spermatogonial stem cells (SSC) in the testis is to produce germ cells (GC) and sperm. This function may be recreated under laboratory conditions using in vitro three-dimensional (3D) cell culture systems. This technology may be used for the treatment of men infertility and in animals for dissemination of elite genetics and conservation of endangered species; however, SSC are scarce and difficult to culture. Potentially, mesenchymal stem cells (MSC) derived from peripheral blood (PB-MSC) may also be candidates for GC production, due to their simplicity for culture and differentiation capacity. The aim of the present study was to compare the potential for production of GC of bull PB-MSC and SSC using an in vitro 3D co-culture system with Sertoli cells (SC). Samples of PB-MSC or SSC co-cultures with SC were collected on days 0, 7, 14 and 21 and analyzed for pluripotency, GC and mesenchymal gene expression. Co-culture of bull PB-MSC or SSC+SC in 3D resulted in differential expression of genes associated to pluripotency and GC differentiation. In conclusion, profiles of expression of pluripotency and GC genes indicate that SSC display a more robust GC differentiation profile compared to PB-MSC, when co-cultured in a 3D system with SC.

Abstract

Although spermatogonial stem cells (SSC) constitute primary candidates for in vitro germ cell (GC) derivation, they are scarce and difficult to maintain in an undifferentiated state. Alternatively, mesenchymal stem cells (MSC) are also candidates for GC derivation due to their simplicity for culture and multipotential for transdifferentiation. The aim of the present study was to compare the GC differentiation potentials of bull peripheral blood-derived MSC (PB-MSC) and SSC using an in vitro 3D co-culture system with Sertoli cells (SC). Samples of PB-MSC or SSC co-cultures with SC were collected on days 0, 7, 14 and 21 and analyzed for pluripotency, GC and mesenchymal marker expression. Co-culture of PB-MSC+SC resulted in down-regulation of NANOG and up-regulation of OCT4 at day 7. In comparison, co-culture of SSC+SC resulted in consistent expression of NANOG, OCT4 and SOX2 at day 14. During co-culture, SSC+SC increased the expression of DAZL, PIWIL2, FRAGILIS and STELLA and activated the expression of STRA8, whereas co-culture of PB-MSC+SC only increased the expression of DAZL and PIWIL2. Thus, co-culture of bull PB-MSC+SC and SSC+SC in 3D SACS results in differential expression of pluripotency and GC markers, where bull SSC display a more robust GC differentiation profile compared to PB-MSC.

1. Introduction

Mesenchymal stem cells (MSC) represent a novel source of multipotent progenitor cells capable of differentiating into germ layer-derived cell lineages through the process of transdifferentiation [1]. MSC display as a fundamental characteristic in culture, the ability to differentiate towards mesodermal lineages including osteocytes, chondrocytes and adipocytes [2,3]. In addition, it has been reported that MSC can differentiate under in vitro conditions into cell lineages derived from endodermal and ectodermal germ layers, including hepatocytes and neurons, respectively [4,5,6]. These features suggest that the in vitro differentiation potential of MSC may be greater than initially reported.
MSC are widely distributed and can be isolated from various animal tissue sources including adipose tissue, bone marrow, umbilical cord, placenta and peripheral blood [3,7,8]. Although MSC from different tissue sources share similar biological characteristics, peripheral blood-derived MSC (PB-MSC) possess some collection advantages since they can be obtained with minimal invasion compared with bone marrow-derived MSC (BM-MSC) and adipose tissue-derived MSC (AT-MSC), which require invasive and painful procedures [9]. Moreover, a continuous source of PB-MSC may be obtained from males and females compared to umbilical cord (UC-MSC) or placenta (PL-MSC), which can only be collected after gestation. Despite these advantages, the reduced proportion of PB-MSC in the steady-state blood may create some challenges in terms of the yield of cells collected [9,10].
Spermatogonial stem cells (SSC) can be differentiated into meiotic germ cells (GC) in vitro, which have suggested the potential use of SSC for the treatment of male human infertility, especially in azoospermic or oligospermic men [11]. GC derivation from SSC may also have potential application in animal reproduction, as an alternative method for dissemination of elite genetics and conservation of endangered species [12]. Despite its potential applications, bovine SSC are scarce in the testicular tissue and are difficult to identify and maintain in an undifferentiated state under in vitro conditions [13]. As an alternative, MSC hold the promise as a stem cell donor for GC differentiation and transplantation. Some of the potential features of MSC for GC derivation include their abundant tissue sources, simplicity for isolation and culture, ease of in vitro expansion, presence of specific markers, potential for transdifferentiation towards GC, immune evasive potential, and migratory and colonization capacity [14,15]. Using different protocols, our group and others have reported that MSC can acquire the phenotype of early GC in culture, when exposed to factors such as retinoic acid (RA), bone morphogenetic protein 4 (BMP4) and transforming growth factor β1 (transforming growth factor β1; TGF-β1) [1,16]. Recently, the potential of MSC to reach early GC states has also been evaluated through the overexpression of GC genes DAZL, STRA8 and BOULE [17]. Furthermore, an alternative differentiation strategy has consisted of co-culturing MSC with Sertoli cells (SC), which has resulted in increased expression of GC markers including DAZL and PIWIL2 [18,19,20]. These studies have generated promising results on the potential of bovine MSC for differentiation into GC and, in addition with other features, suggest that MSC may be adequate candidates for derivation of GC.
Germinal differentiation and spermatogenesis in vivo depend on the surrounding microenvironment and interaction with other testicular cell types including SC [21]. These cells regulate the cycle of GC by secreting factors necessary for their viability, proliferation and differentiation, including BMP4, TGF-β1 and AR [18]. In addition, SC form tight junctions that structure the blood–testis barrier, which acts as a filter that selects the plasmatic compounds useful for spermatogenesis and prevents the diffusion of self-antigens from the interior of the seminiferous tubule into the blood [11,18]. This barrier also influences the chemical composition of the fluid in the lumen, which contains high levels of androgens, estrogens, potassium, inositol, glutamic and aspartic acid, essential for the proliferation and differentiation of GC [22,23,24]. Thus, the proliferation and differentiation of SSC in vivo are influenced by the junctions and the spatial arrangement of SC. Moreover, various studies have emphasized the importance of cell interaction in differentiation systems [11,25,26]. This interaction allows an organized structure and function and the participation of cell-specific adhesion molecules, their association with the extracellular matrix, the cytoskeleton and the metabolic state, which together respond to the stimuli in the extracellular medium [11].
Since SSC represent the standard for differentiation towards GC and spermatogenesis, the differentiation potential of PB-MSC may be compared with SSC in order to better understand their potential of GC differentiation. The expression patterns of differentiation biomarkers in PB-MSC and SSC would allow us to understand the possible mechanisms that control and limit their GC differentiation capacity under in vitro conditions. Thus, the aim of the present study was to compare the differentiation potentials of bull PB-MSC and SSC into GC using an in vitro 3D co-culture system with SC.

2. Materials and Methods

2.1. Ethics

All experimental procedures were previously approved by the Institutional Committee for Care and Use of Animals (CICUA) at the University of Chile (certificate 19266-VET-UCH) and the Biosafety Committee of the Faculty of Veterinary and Animal Sciences from the University of Chile (certificate 140).

2.2. Experimental Design

PB-MSC were collected and polled from three Angus beef bulls (age 1–3 years) belonging to the Faculty of Veterinary and Animal Sciences from the University of Chile. Each pool represented a biological replicate and analyses, and experiments were performed thrice. Pooling tissue samples was performed in an effort to reduce individual biological variation. SC and SSC were isolated from adult bull testis (n = 10) derived from a local abattoir. All cell types were characterized accordingly to the gene expression of specific markers for MSC (+CD73, +CD105, -CD34 and -CD45), SSC (+UCHL1 and +CD90) and SC (+WT1 and +RA) using quantitative PCR (QPCR). Cells were also characterized for the protein expression of markers for MSC (CD73), SSC (UCHL1) and SC (WT1) using immunofluorescence. PB-MSC and SSC (2.5 ×10⁴ cells/cm2) were co-cultured with SC (2.5 ×10⁴ cells/cm2) in 3D soft agar co-culture system (SACS). PB-MSC and SSC were considered target cells and SC were used as effector cells. Experimental controls corresponded to PB-MSC, SSC and SC (2.5 ×10⁴ cells/cm2) and were cultured separately. Samples from each co-culture and single culture were collected on days 0, 7, 14 and 21. GC differentiation of PB-MSC and SSC was determined by quantifying the gene expression of the pluripotency markers OCT4, NANOG and SOX2; GC genes FRAGILIS, STELLA, DAZL, PIWIL2, and STRA8 by Q-PCR; and OCT4, NANOG, DAZL, PIWIL2 and STRA8 by immunofluorescence

2.3. Isolation, Purification, and Characterization of Bull PB-MSC

Blood samples (25 mL per animal) were collected from the coccygeal vein of 1- to 3-year-old bulls using vacutainer tubes containing heparin. Blood samples were kept at 4 °C and transported to the laboratory within 1 h after collection. PB-MSC were isolated according to the previously reported protocol [7]. Briefly, blood samples were diluted 1:1 in phosphate buffered saline (PBS; pH: 7.4) and layered onto 20 mL of 1.076 mM Percoll solution (Biochrom AG, Berlin, Germany). Subsequently, the samples were centrifuged at 1600× g for 20 min. The mononuclear cell interface was recovered, subsequently washed in PBS and resuspended in MSC culture medium containing low glucose DME-F12 (Dulbecco’s Modified Eagle F12) medium, supplemented with 10% fetal bovine serum (FBS), 100 μg/mL of amphotericin B, 100 μg/mL of streptomycin, and 100 IU/mL of penicillin (Gibco, Life Technologies, Carlsbad, CA, USA). The cells obtained from each 25 mL of blood were cultured in T25 culture bottles (Corning, Toronto, Canada) in MSC culture medium and incubated in an atmosphere of humidified air with 5% CO2 and 38 °C. Non-adherent cells were discarded after 48 h by changing the culture medium. Isolated cell colonies were maintained in MSC medium until reaching ~75% confluency. Cells were then detached with 0.5% trypsin-EDTA (Invitrogen, BRL, Burlington, Canada) for subculture and used in subsequent experiments. The expression of MSC cell surface markers, both mesenchymal (+CD73 and +CD105) and hematopoietic (-CD34 and -CD45), were evaluated by Q-PCR, and CD73 by immunofluorescence, to characterize the cell phenotype established by the International Society for Cell Therapy (ISCT; [2]).

2.4. Isolation, Purification, and Characterization of Bull SC

SC were isolated from adult bull testicular tissue by sequential enzymatic digestion according to a modified protocol [19]. Testicular tissue was mechanically dissociated using scissors and forceps. Subsequently, an enzymatic digestion of the tissue was performed in DME-F12 medium with L-glutamine supplemented with 2 mg/mL of collagenase type I (Sigma-Aldrich, St Louis, MI, USA) and 2 mg/mL of DNase I (Sigma Aldrich) for 45 min. The digestion reaction was blocked by adding SC culture medium composed of DME-F12 supplemented with 10% FBS, 100 IU/mL penicillin, 100 μg/mL streptomycin and 100 μg/mL of amphotericin B. Then, the cell suspension was centrifuged at 500× g for 10 min at 4 °C and the pellet was filtered through a 100 μm mesh (Corning, Canada, USA). Cells were aliquoted and seeded in T25 bottles with SC culture medium. SC cultures were subsequently incubated at 38 °C in a humidified atmosphere with 5% CO2. After one hour, the supernatant containing GC was removed and the cells adherent to the plastic were washed twice with PBS and subsequently cultured in fresh medium. To obtain SC cultures with a ratio of 80–90%, the cultures were hypotonically treated after 48 h, using 20 mM Tris-HCl (pH 7.4) for 2.5 min to lyse residual GC. Subsequently, the plates were washed twice with PBS, and, after changing the medium, the cells were cultivated in an atmosphere with 5% CO2 at 38 °C. When adherent cells reached 80% to 90% confluency, they were detached using 0.5% trypsin-EDTA and transferred to new plates for expansion and removal of residual GC. During cultivation, non-adherent GC were removed by repeated washing. The morphological features of SC were examined and photographed using phase contrast microscopy. A testicular extract (TE) sample was used as a positive control and was prepared by mechanical maceration of testicular tissue pieces in lysis buffer (Zymo Research, Irvine, CA, USA) for RNA extraction. The expression of SC markers WT1 and AR was evaluated by Q-PCR and WT1 by immunofluorescence.

2.5. Isolation, Purification, and Characterization of Bull SSC

SSC were isolated from adult testicular tissue by a modified adhesion separation protocol previously described [27]. After testicular decapsulation, the tissue was mechanically dissociated by a two-step mechanical and enzymatic digestion. First, the testes were sectioned into small pieces and incubated in the enzyme solution that included DME-F12 supplemented with 0.5 mg/mL collagenase type I (Sigma-Aldrich), 0.5 mg/mL trypsin-EDTA (Invitrogen, BRL, Canada) and 0.5 mg/mL DNase I (Sigma Aldrich) for approximately 45 min with shaking and pipetting at 38 °C. The digested testicular tissues were washed in DMEM, and, after precipitation, the supernatant containing interstitial cells from the seminiferous tubules was discarded. The remaining tissue was digested during the second stage of enzymatic digestion until separation of its constituent cells. The cell suspension was two-step filtrated through 100-µm and 40-µm filters, and then the cell suspension was cultured twice for 24 h in SC culture medium. Separation of SSC (non-adherent cells) from SC (adherent cells) was performed by differential plate method during 24 h of incubation. For this, the obtained testicular cells were transferred to new culture bottles and cultured overnight in SC culture medium at 38 °C in 5% CO2. After this step, the floating cells were collected and centrifuged at 1800× g for 5 min and were characterized by expression of specific biomarkers including UCHL1 and CD90 [28] using Q-PCR and UCHL1 using immunofluorescence techniques.

2.6. Co-Culture of PB-MSC or SSC with SC in 3D SACS

The PB-MSC or SSC co-culture with SC was based on the 3D SACS culture system according to the previously modified protocol [29]. The 3D SACS consisted of 2 phases: (1) the gel phase or soft top layer with 0.35% (w/v) agarose, and (2) the solid phase or bottom layer with 0.5% (w/v) agarose. For this, 0.7% (w/v) agarose and 1% (w/v) agarose were dissolved in distilled water, and an equal volume of culture medium was added to these solutions to obtain a concentration of 0.35% and 0.5%. To establish the solid bottom layer (800 μL final volume), 2 h before cell culture, 400 μL of 1% agarose solution was mixed with 400 μL of SC culture medium and transferred into a 12-well plate. The plates were refrigerated at 4 °C until the agarose in this layer solidified. To establish the upper layer (final volume of 200 μL), 2.5 ×10⁴ cells/cm2 of MSC or SSC were mixed with 2.5 × 10⁴ cells/cm2 SC in 100 μL of DME-F12 supplemented with 10% FBS, and mixed with 100 μL of 0.7% agarose at 38 °C. The prepared cell suspension was then pipetted onto the solid layer. All plates were kept at 38 °C and 5% CO2 for 3 weeks, and culture media were replaced every 3 days. Cells were collected by adding 1 mL of PBS to each well and centrifuging each cell suspension at 2000× g for 5 min. Cell pellets were fixed in lysis buffer or 4% paraformaldehyde for Q-PCR or immunofluorescence analyses, respectively.

2.7. Q-PCR Analysis

The quantification of the mRNA levels of the housekeeping genes GAPDH and β-ACTIN, pluripotency genes OCT4 and NANOG, GC markers FRAGILIS, PIWIL2 and STELLA, SSC markers UCHL1 and CD90 and male GC markers DAZL and STRA8, was determined using Q-PCR (Table 1). Total RNA was isolated from cells using a Quick-RNA MiniPrep kit (Zymo Research) following the manufacturer’s instructions. Total RNA was quantified using a Qubit 3.0 (Invitrogen, Fluorometer, CA, USA). Genomic DNA digestion was performed using DNase I from the Quick-RNA MiniPrep kit (Zymo Research) following the manufacturer’s instructions. The cDNA was synthesized and amplified using an Affinity Script Q-PCR cDNA Synthesis Kit (Agilent Technologies, Santa Clara, CA, USA), using a Step One thermocycler (Applied Biosystems, Foster City, CA, USA). The PCR reaction was performed using a Brilliant SYBR Green QPCR Master Mix kit (Agilent Technologies) and an Eco Real-Time PCR System thermocycler (Illumina, San Diego, CA, USA). Each reaction tube consists of 5 μL Sybr Green, 1 μL forward primer, 1 μL reverse primer, 2 μL nuclease-free H2O and 5 ng cDNA. The cDNA amplification was extended for 40 cycles, and relative expression analysis was performed using the ΔΔCt (Ct: threshold value) method normalized with both GAPDH and β-ACTIN housekeeping genes [30].

2.8. Immunofluorescence Analysis

Protein expression of Sertoli cell (WT1), SSC (UCHL1), pluripotency (OCT4 and NANOG), MSC (CD73) and male GC (DAZL, STRA8, STELLA and PIWIL2) markers were immunodetected at day 14 in co-cultures and single cultures. Culture samples were fixed with 4% PFA at 4 °C for 20 min. Subsequently, the samples were washed and blocked with 3% bovine serum albumin (BSA) diluted in PBS (pH: 7.4) for 45 min. Markers were immunodetected using rabbit polyclonal anti-WT1 (Cat. # ab89901, Abcam, Boston, MA, USA), mouse polyclonal anti-OCT4 (Cat. # sc5279, Santa Cruz, Dallas, TX, USA), mouse polyclonal anti-NANOG (Cat. # sc293121, Santa Cruz), mouse monoclonal anti-UCHL1, (Ct.# 480012, Thermo-Fisher, Waltham, MA, USA), rabbit polyclonal anti-STRA8 (Cat. # ab49602, Abcam), rabbit monoclonal anti-CD73 (Cat. # ab137595, Abcam), rabbit monoclonal anti-PIWIL2 (Ct.# ab85084, Abcam) and rabbit polyclonal anti-DAZL (Cat. # ab34139, Abcam), mouse polyclonal anti-STELLA (Cat. # ab19878, Abcam), diluted in 3% BSA diluted in PBS (pH: 7.4) (Wt1 1:200; OCT4, NANOG, STRA8, CD73, PIWIL2 and DAZL 1:50, UCHL1 and STELLA 1:100). Incubation with primary antibodies was performed overnight at 4 °C. The next day, samples were washed once with PBS and twice with 3% BSA diluted in PBS (pH: 7.4) and incubated in secondary IgG anti-mouse antibody conjugated with Alexa-fluor 488 (CT.# A11001, Thermo-Fisher) or IgG anti-rabbit antibody conjugated with FITC (Ct.# ab97050, Abcam) diluted in PBS with BSA 3% (1:500) for 1 h. Next, the samples were washed again twice in PBS with 3% BSA (pH: 7.4) and once with distilled water and subsequently mounted in DAPI Fluoroshield medium (Cat. # ab104139, Abcam). Once the protocol was finished, the samples were stored at 4 °C and protected from light. The samples were photographed using an epifluorescence microscope (Olympus, Tokyo, Japan) and a spectral confocal microscope (Nikon, Tokyo, Japan) connected to a digital camera.

2.9. Statistical Analysis

The data obtained represented the mean and the standard deviation. The statistical model considered the relative expression of the biomarkers as dependent variables. The independent variables were the days of culture and the type of treatment. A significance value of p < 0.05 was used. Significance of the statistical model was analyzed by one-way ANOVA. The differences between means for culture days and treatments were determined using Tukey’s post-test. Infostat 2020 software (Cordoba, Argentina) was used in all statistical analyses.

3. Results

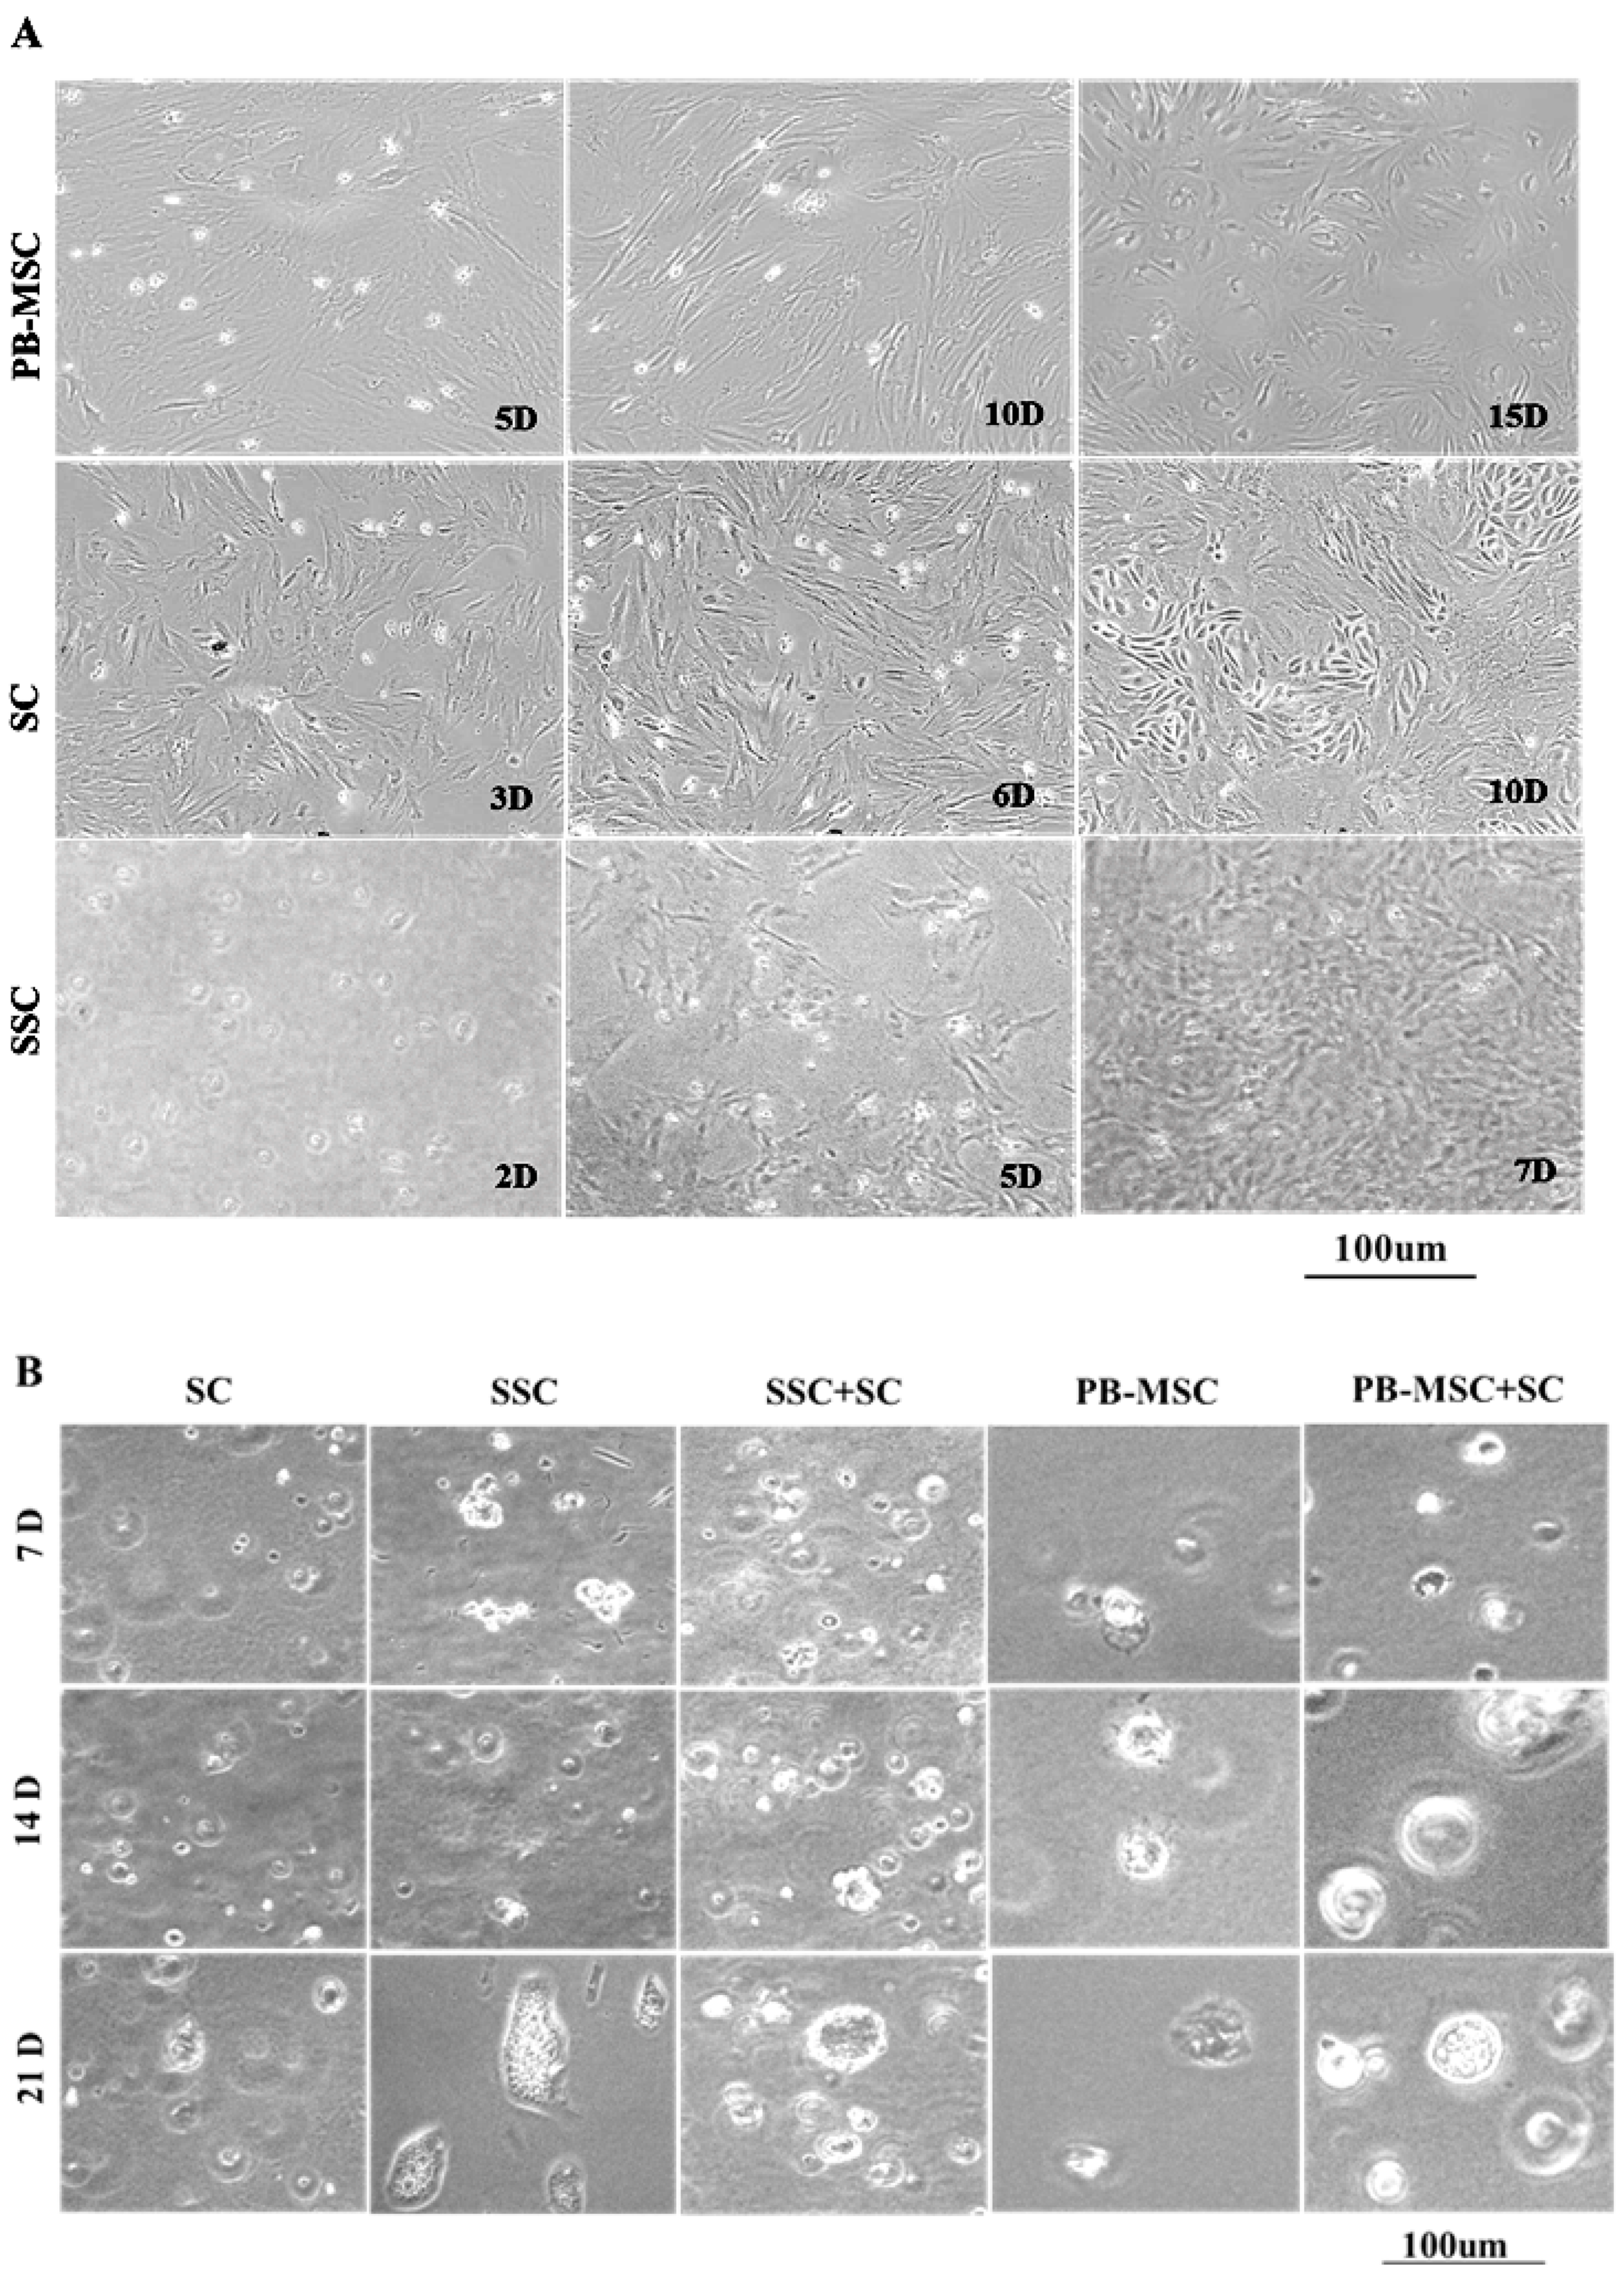
3.1. Morphology of Bull PB-MSC, SC and SSC

PB-MSC displayed a diverse morphology that ranged from circular and fibroblastoid at 5 days (5D) of culture to elongated and heterogeneous as they reached confluence at 10 days (10D) after seeding (Figure 1A). Subsequently, subpopulations of circular cells with large nuclei, triangular or circular shape were observed at 15 days (15D) of culture. After removing GC from cultures, bull SC formed a monolayer of large fibroblastoid cells with heterogenous morphology (3D). Similarly, after 1–3 passages (6D), bull SC displayed triangular or circular subpopulations, and distinct cell clusters were observed as cells became more confluent (10D). Non-adherent SSC with a circular morphology were kept in suspension for 2 days (2D), and then a population of adherent cells with an irregular and cuboidal morphology appeared and formed colonies at day 5 of culture (5D); these cells proliferated quickly until day 7, and then they detached and floated (7D).

3.2. Morphology of PB-MSC or SSC Co-Cultured with SC in SACS 3D for 21 Days

During culture, SC acquired a circular morphology and retained this morphology until day 21 when they formed confluent colonies (Figure 1B). In general, all adherent cell types, both PB-MSC and SC, changed their morphology and formed round cell colonies. Moreover, SSC were able to remain in culture forming large colonies until day 21 of culture. In co-cultures of SSC+SC and PB-MSC+SC, cells changed their elongated fibroblastoid appearance to a circular or cuboidal morphology that remained until day 21 of culture.

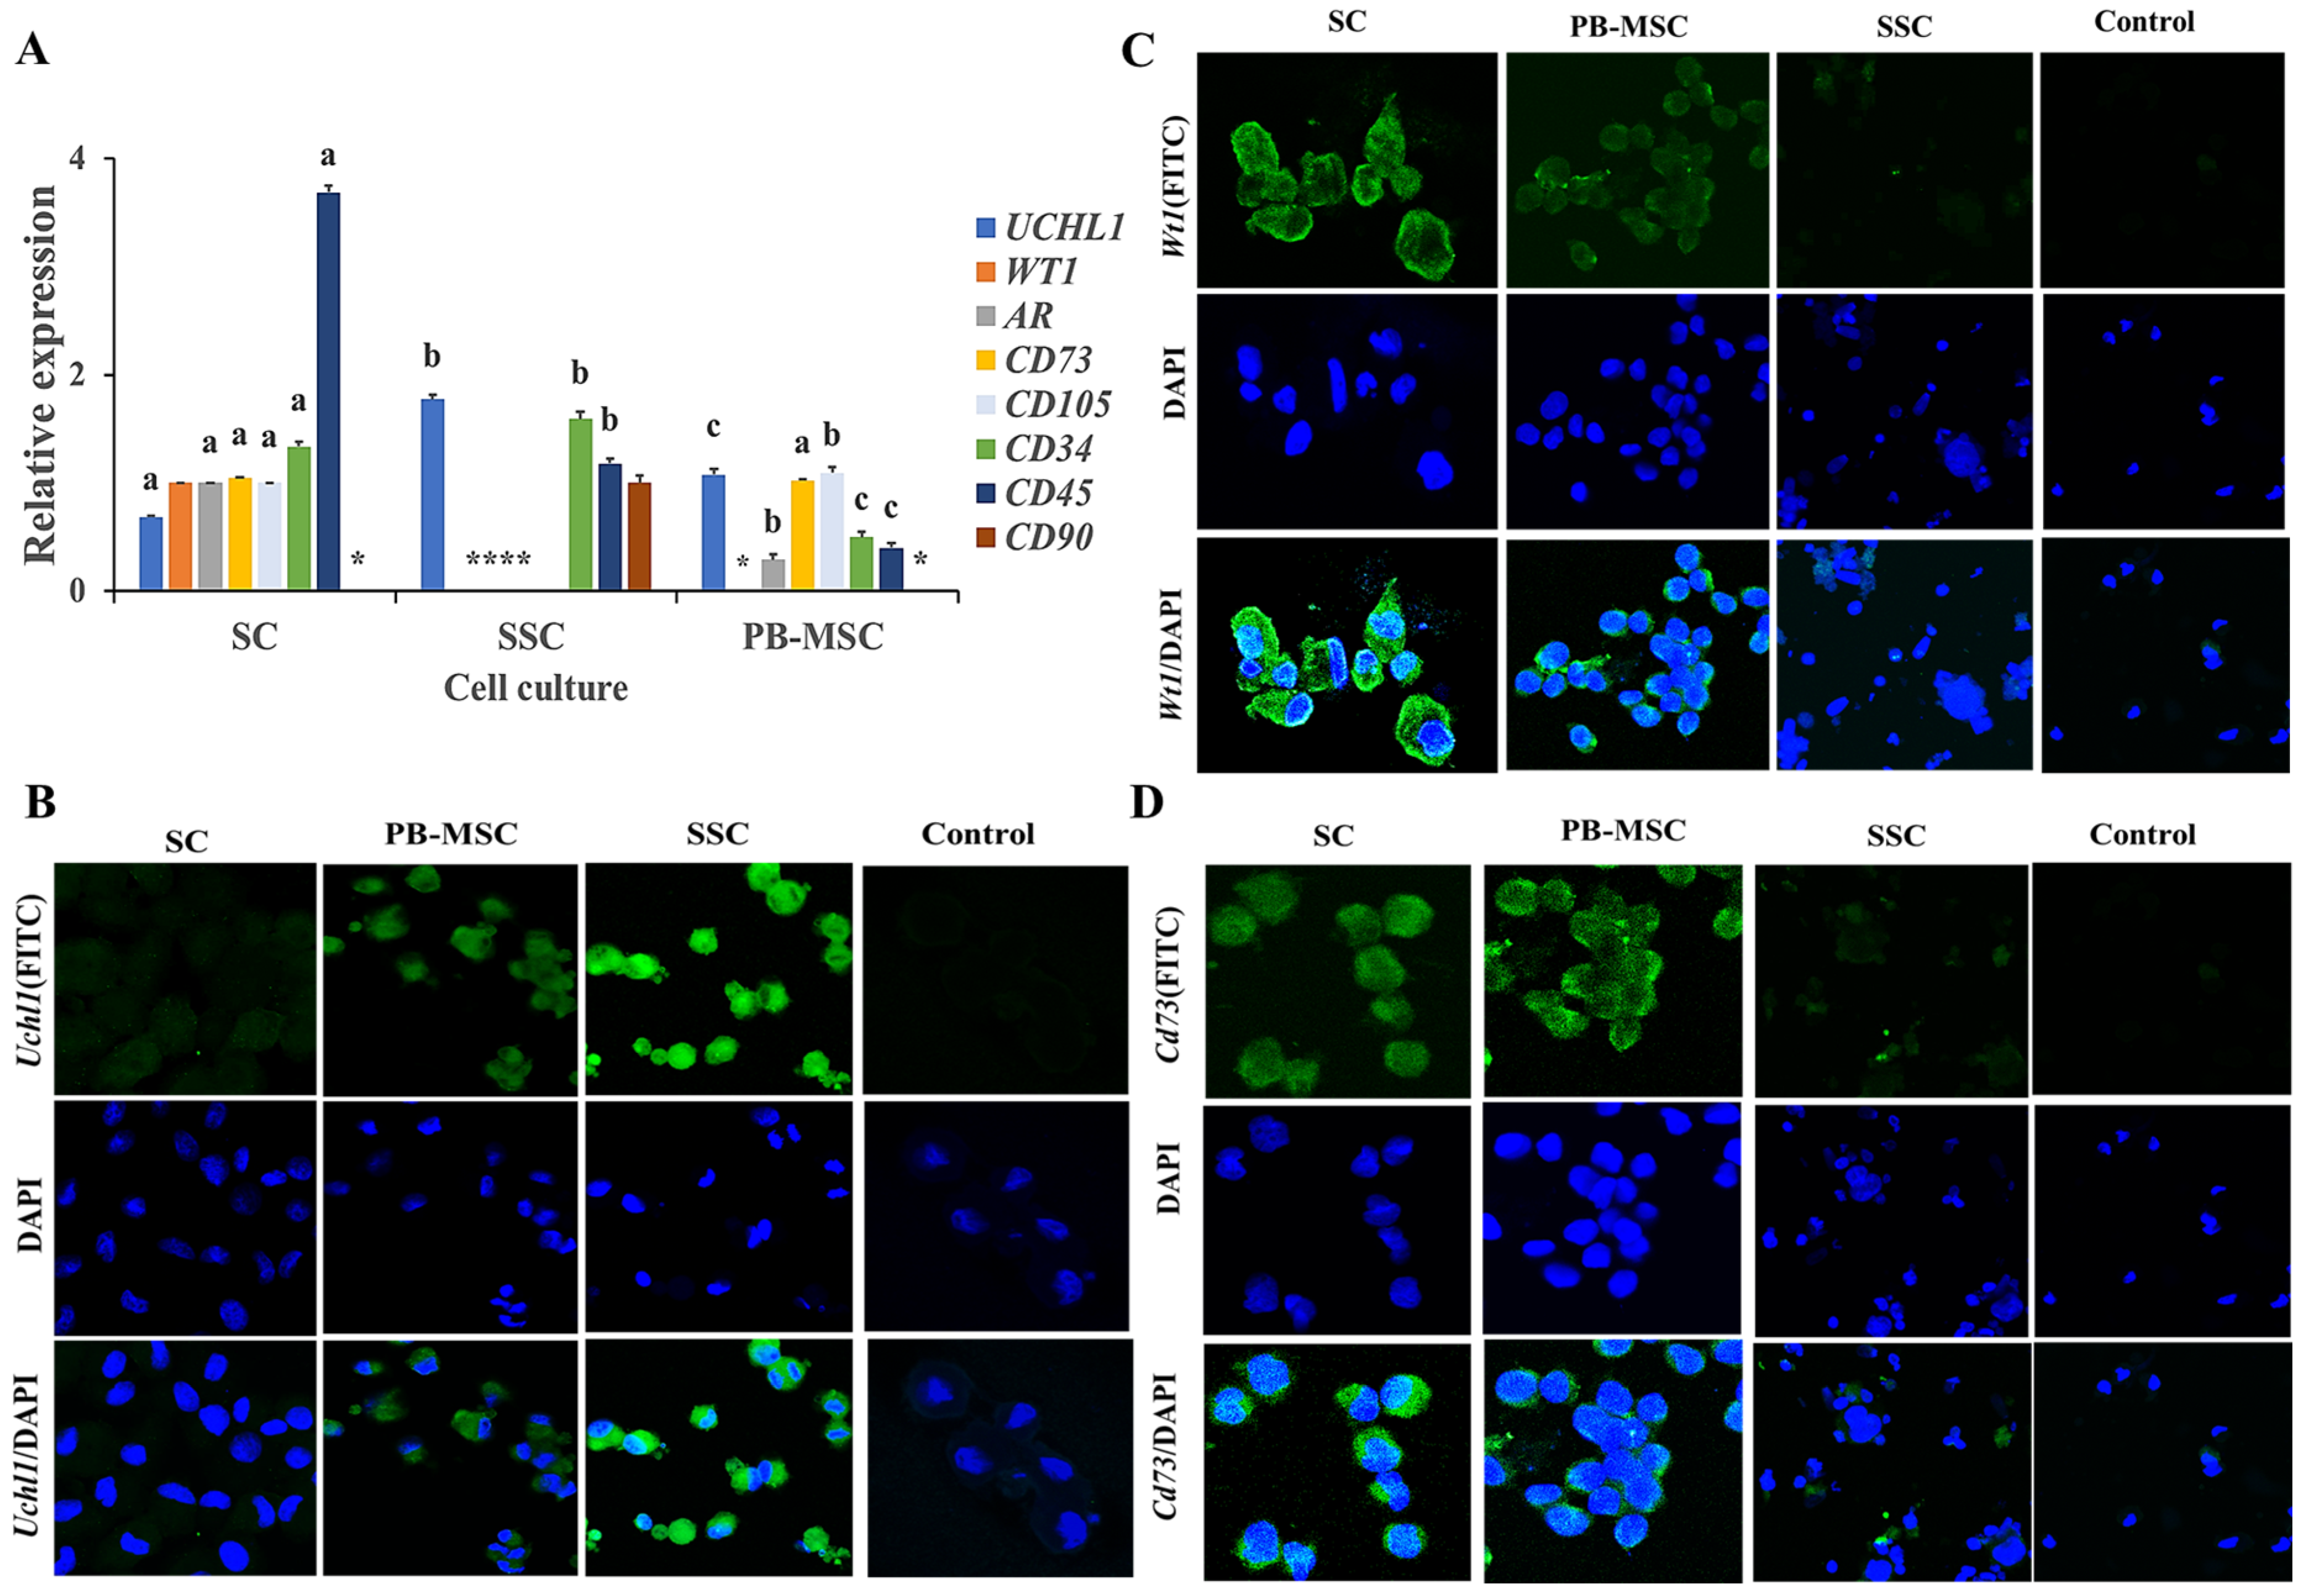
3.3. Expression of MSC, SC and SSC Markers in Single Cultures

The gene expression of the specific markers of SC, SSC and PB-MSC was determined in all cell types with the aim to determine the purity of the primary cell cultures (Figure 2). Gene expression levels of UCHL1 were higher (p < 0.05) in SSC (1.8 ± 0.014-fold SC) compared to PB-MSC (1.1 ± 0.04-fold SC). Gene expression of WT1 was detected in SC and was absent in PB-MSC and SSC. Levels of mRNA of AR were higher (p < 0.05) in SC compared to PB-MSC (0.3 ± 0.02-fold SC) and were not detected in SSC. Gene expression levels of CD73 were not different (p > 0.05) between SC and PB-MSC (1.0 ± 0.03-fold SC) and were not detected in SSC. Levels of mRNA of CD105 were higher (p < 0.05) in PB-MSC (1.17 ± 0.05-fold SC) compared to SC and were not detected in SSC. Gene expression levels of CD34 were higher (p < 0.05) in SSC (1.60 ± 0.04-fold SC) compared to SC and PB-MSC (0.6 ± 0.05-fold SC). Relative gene expression of CD45 was higher (p < 0.05) in SC (3.5 ± 0.03-fold SSC) compared to PB-MSC (0.4 ± 0.04-fold SSC). In comparison, gene expression of CD90 was only detected in SSC (1.0 ± 0.15). Additionally, a more intense cytoplasmic immunofluorescence pattern of UCHL1 was detected in SSC compared to PB-MSC (Figure 2B). Moreover, UCHL1 was not immunodetected in SC. The immunofluorescence associated to WT1 was observed in SC, was less intense in PB-MSC and was not observed in SSC (Figure 2C). Moreover, immunofluorescence associated to CD73 was detected in PB-MSC, with less immunofluorescence intensity in SC, and was not observed in SSC (Figure 2D).

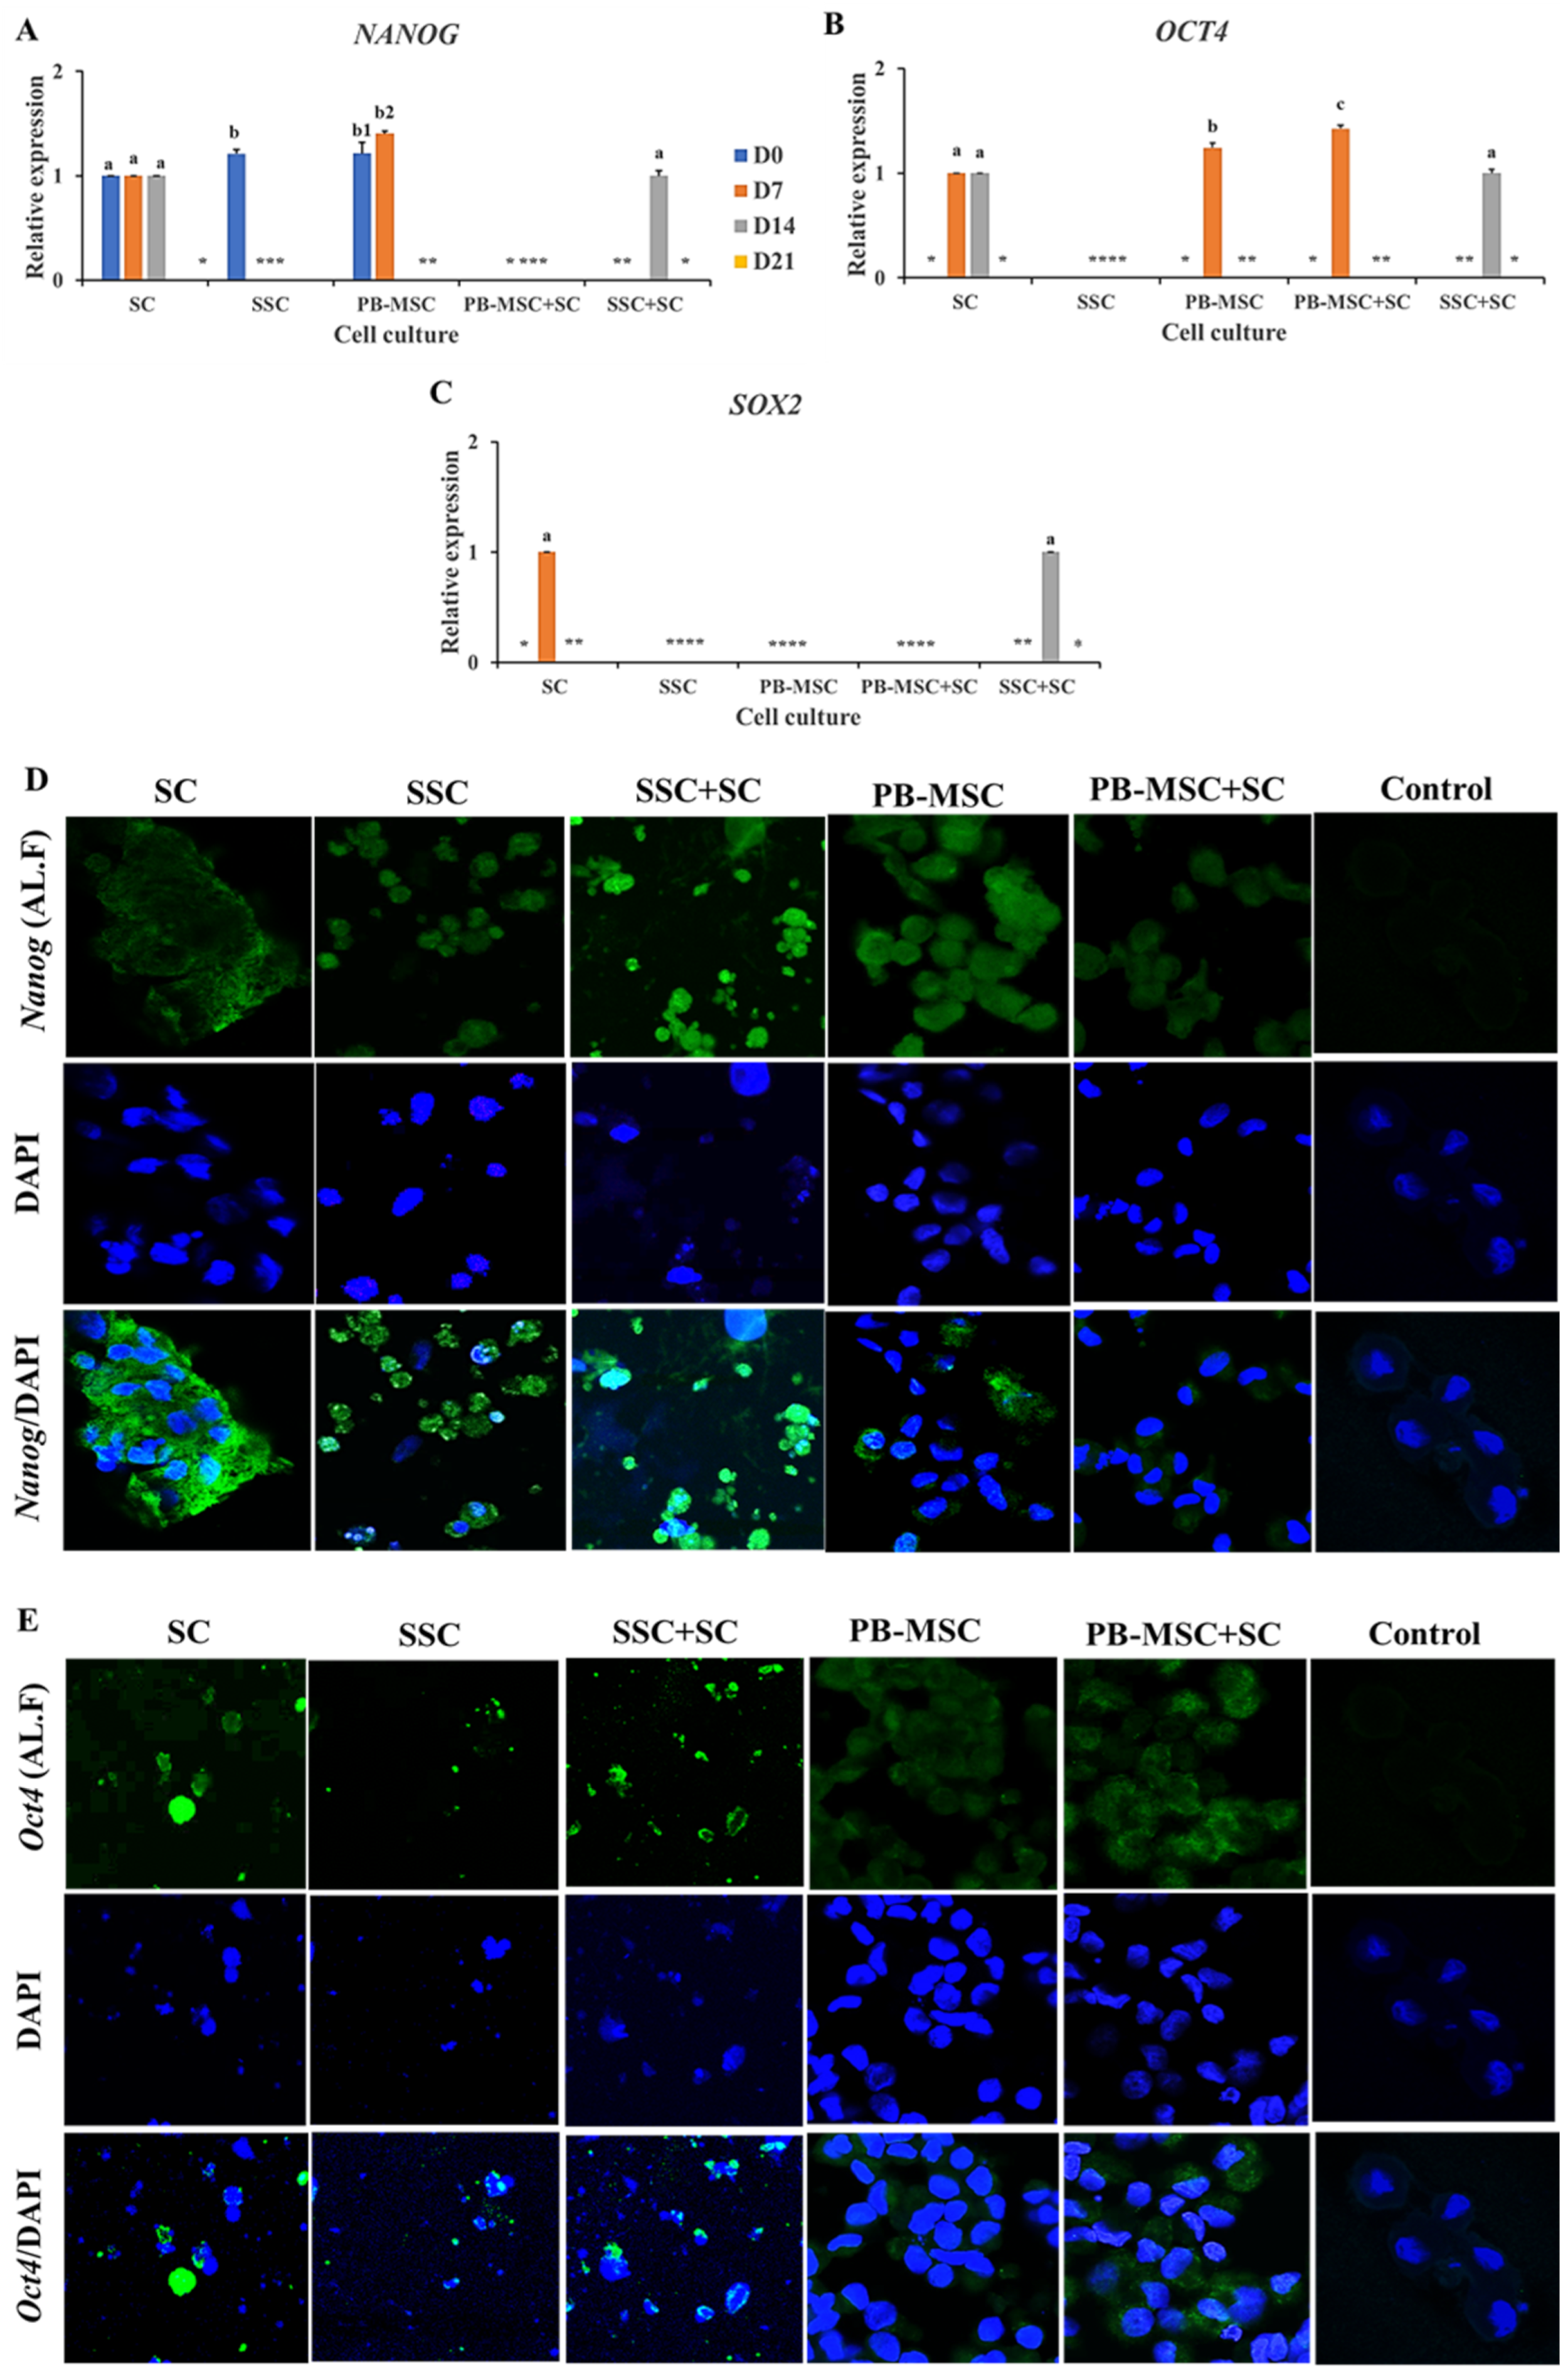
3.4. Expression of Pluripotency Markers in PB-MSC or SSC Co-Cultured with SC for 21 Days in 3D SACS

Gene expression levels of NANOG were similar (p > 0.05) in SSC+SC co-culture (1.0 ± 0.03-fold SC) compared to SC single culture on day 14. In comparison, gene expression of NANOG were not detected in any days of PB-MSC+SC co-culture, in spite of the fact that mRNA levels of NANOG were detected in single cultures of SC and PB-MSC at days 0 and 7 (Figure 3A, Table 2). Accordingly, intense immunofluorescence associated to NANOG was observed in SSC+SC co-culture and SC single culture at day 14 (Figure 3D). Co-culture of PB-MSC+SC up-regulated (1.4 ± 0.03-fold SC; p < 0.05) OCT4 gene expression on day 7 (Figure 3B, Table 2) compared to SC and PB-MSC (1.2 ± 0.05-fold SC) single cultures. Levels of OCT4 gene expression were similar (p > 0.05) in co-culture of SSC+SC (1.0 ± 0.03-fold SC) and single culture of SC on day 14. OCT4 gene expression was not detected on SSC. Immunofluorescence associated to Oct4 was mainly observed in SSC+SC and MSC+SC co-cultures with a cytoplasmatic and nuclear pattern at day 14 (Figure 3E). SOX2 gene expression was detected in SC on day 7 and on day 14 in co-cultures of SSC+SC; however, SOX2 gene expression was not detected in other cell cultures (Figure 3C, Table 2).

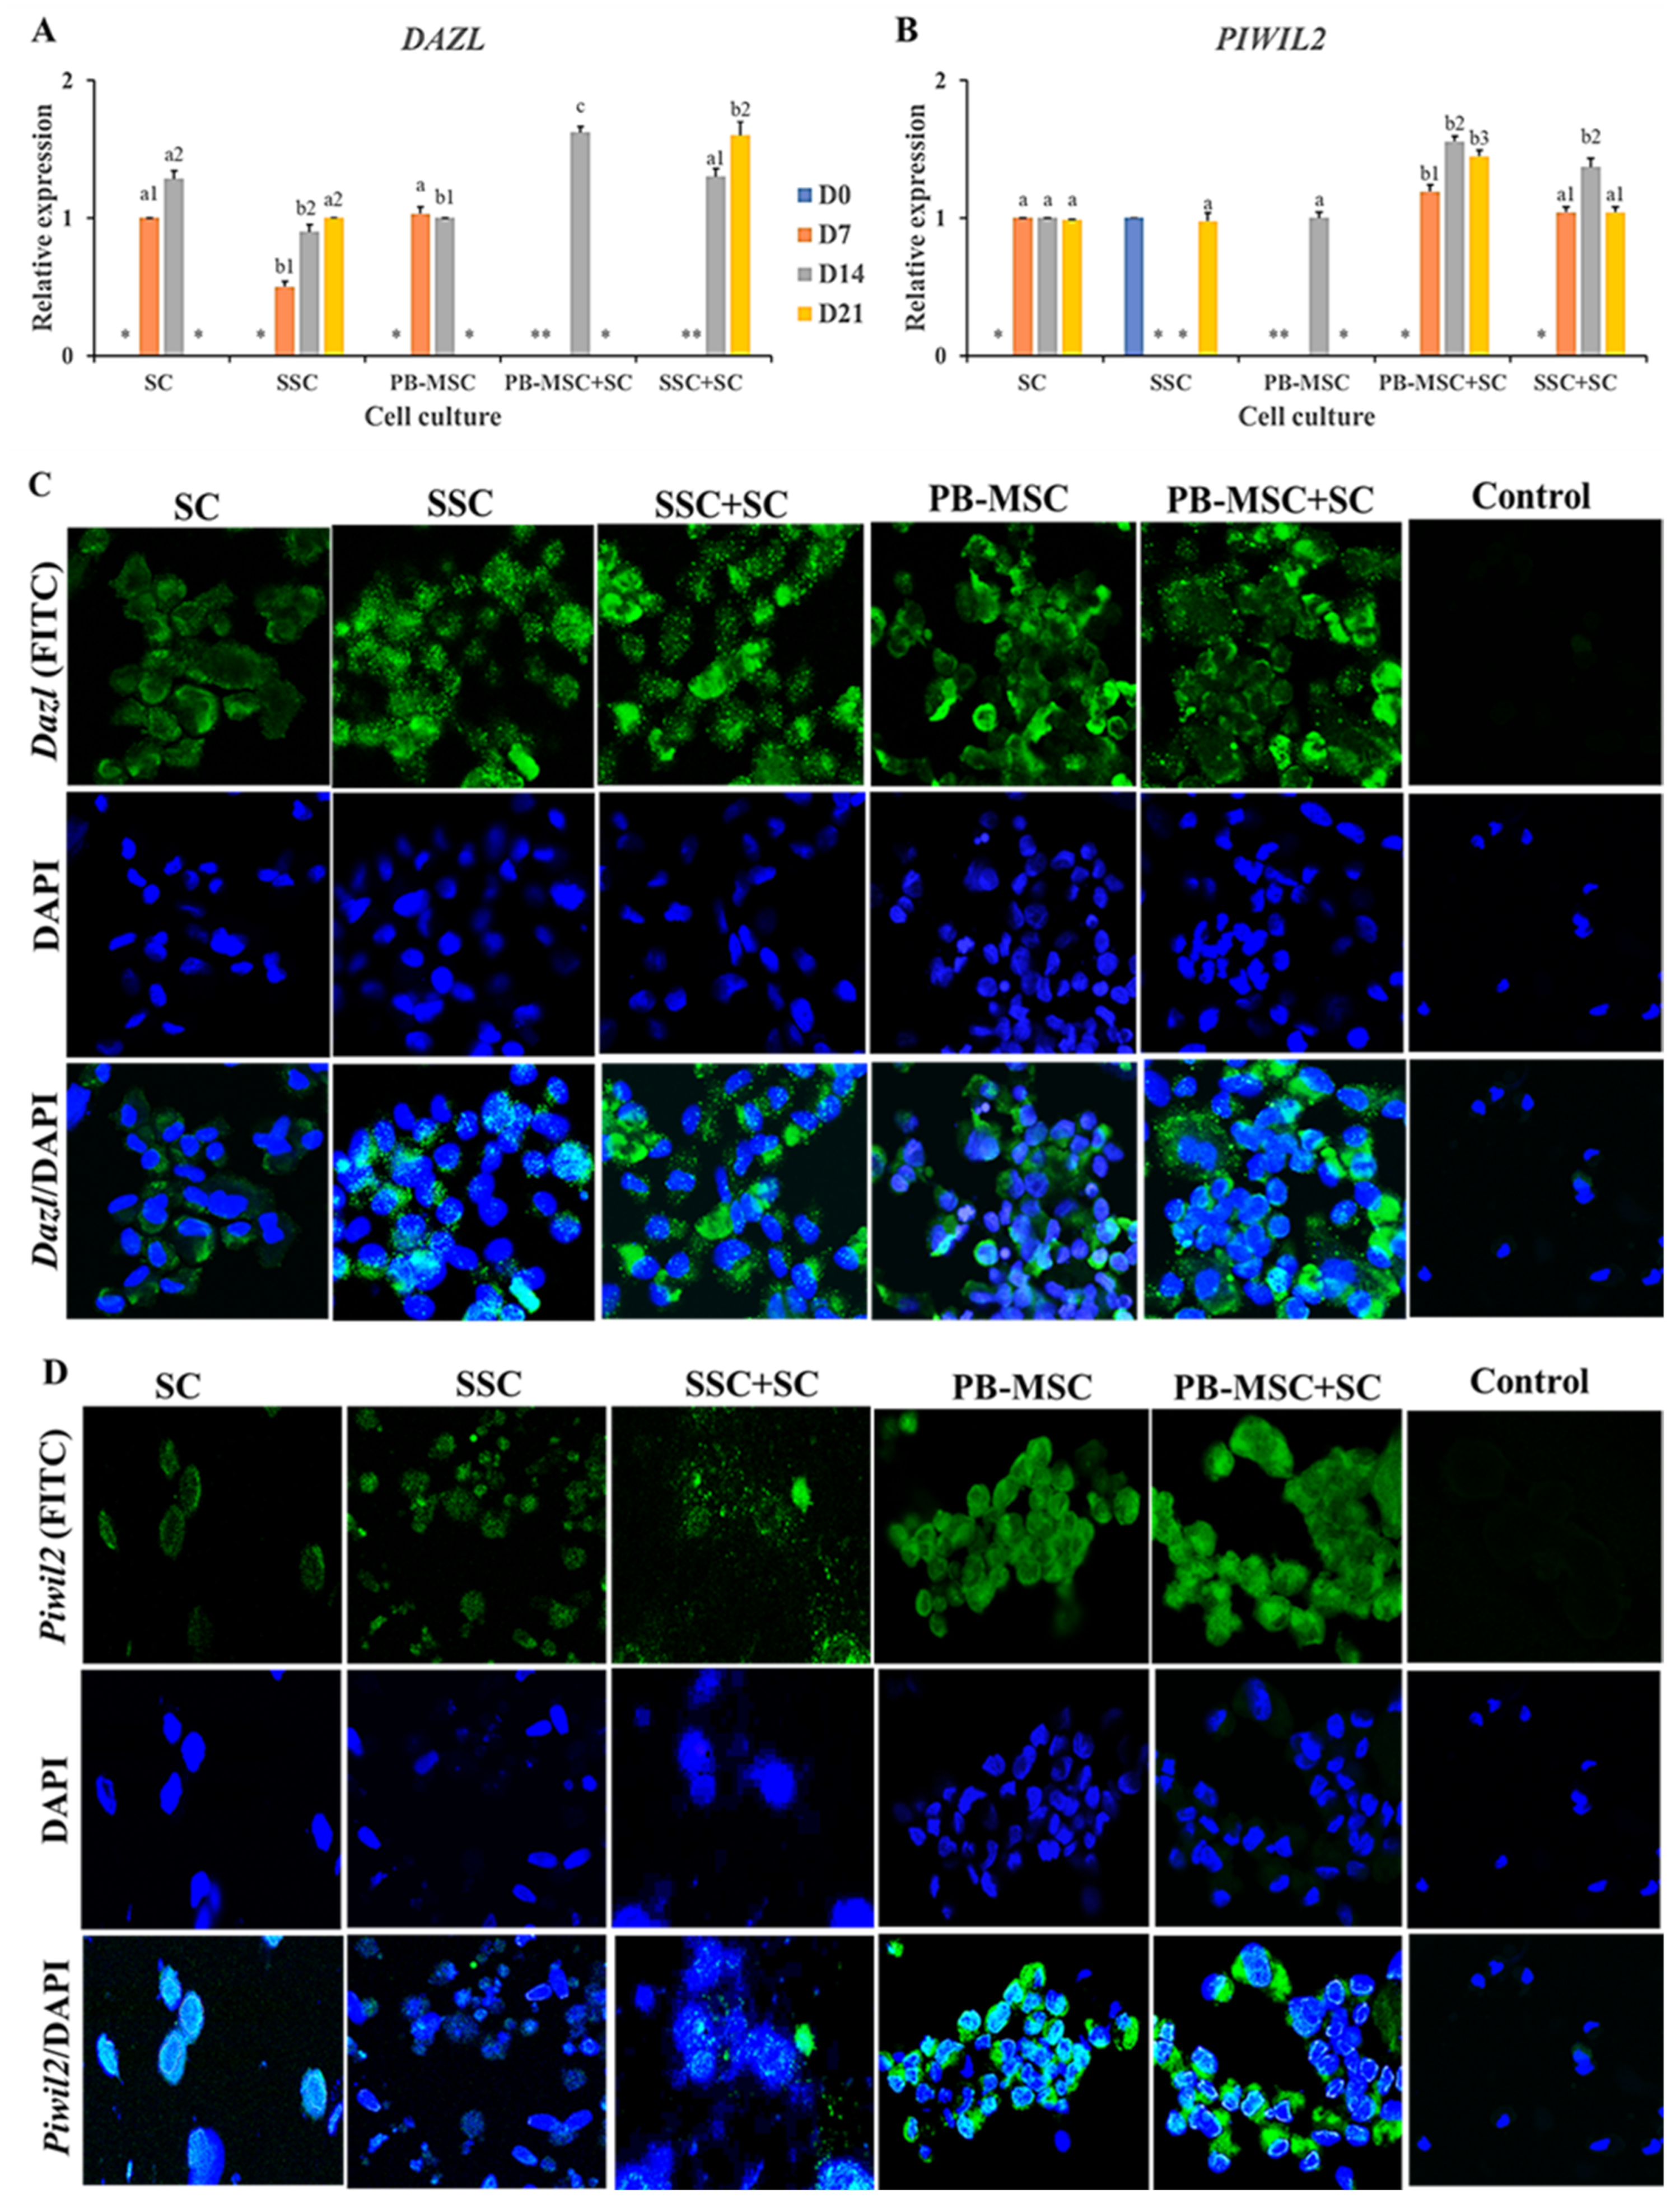
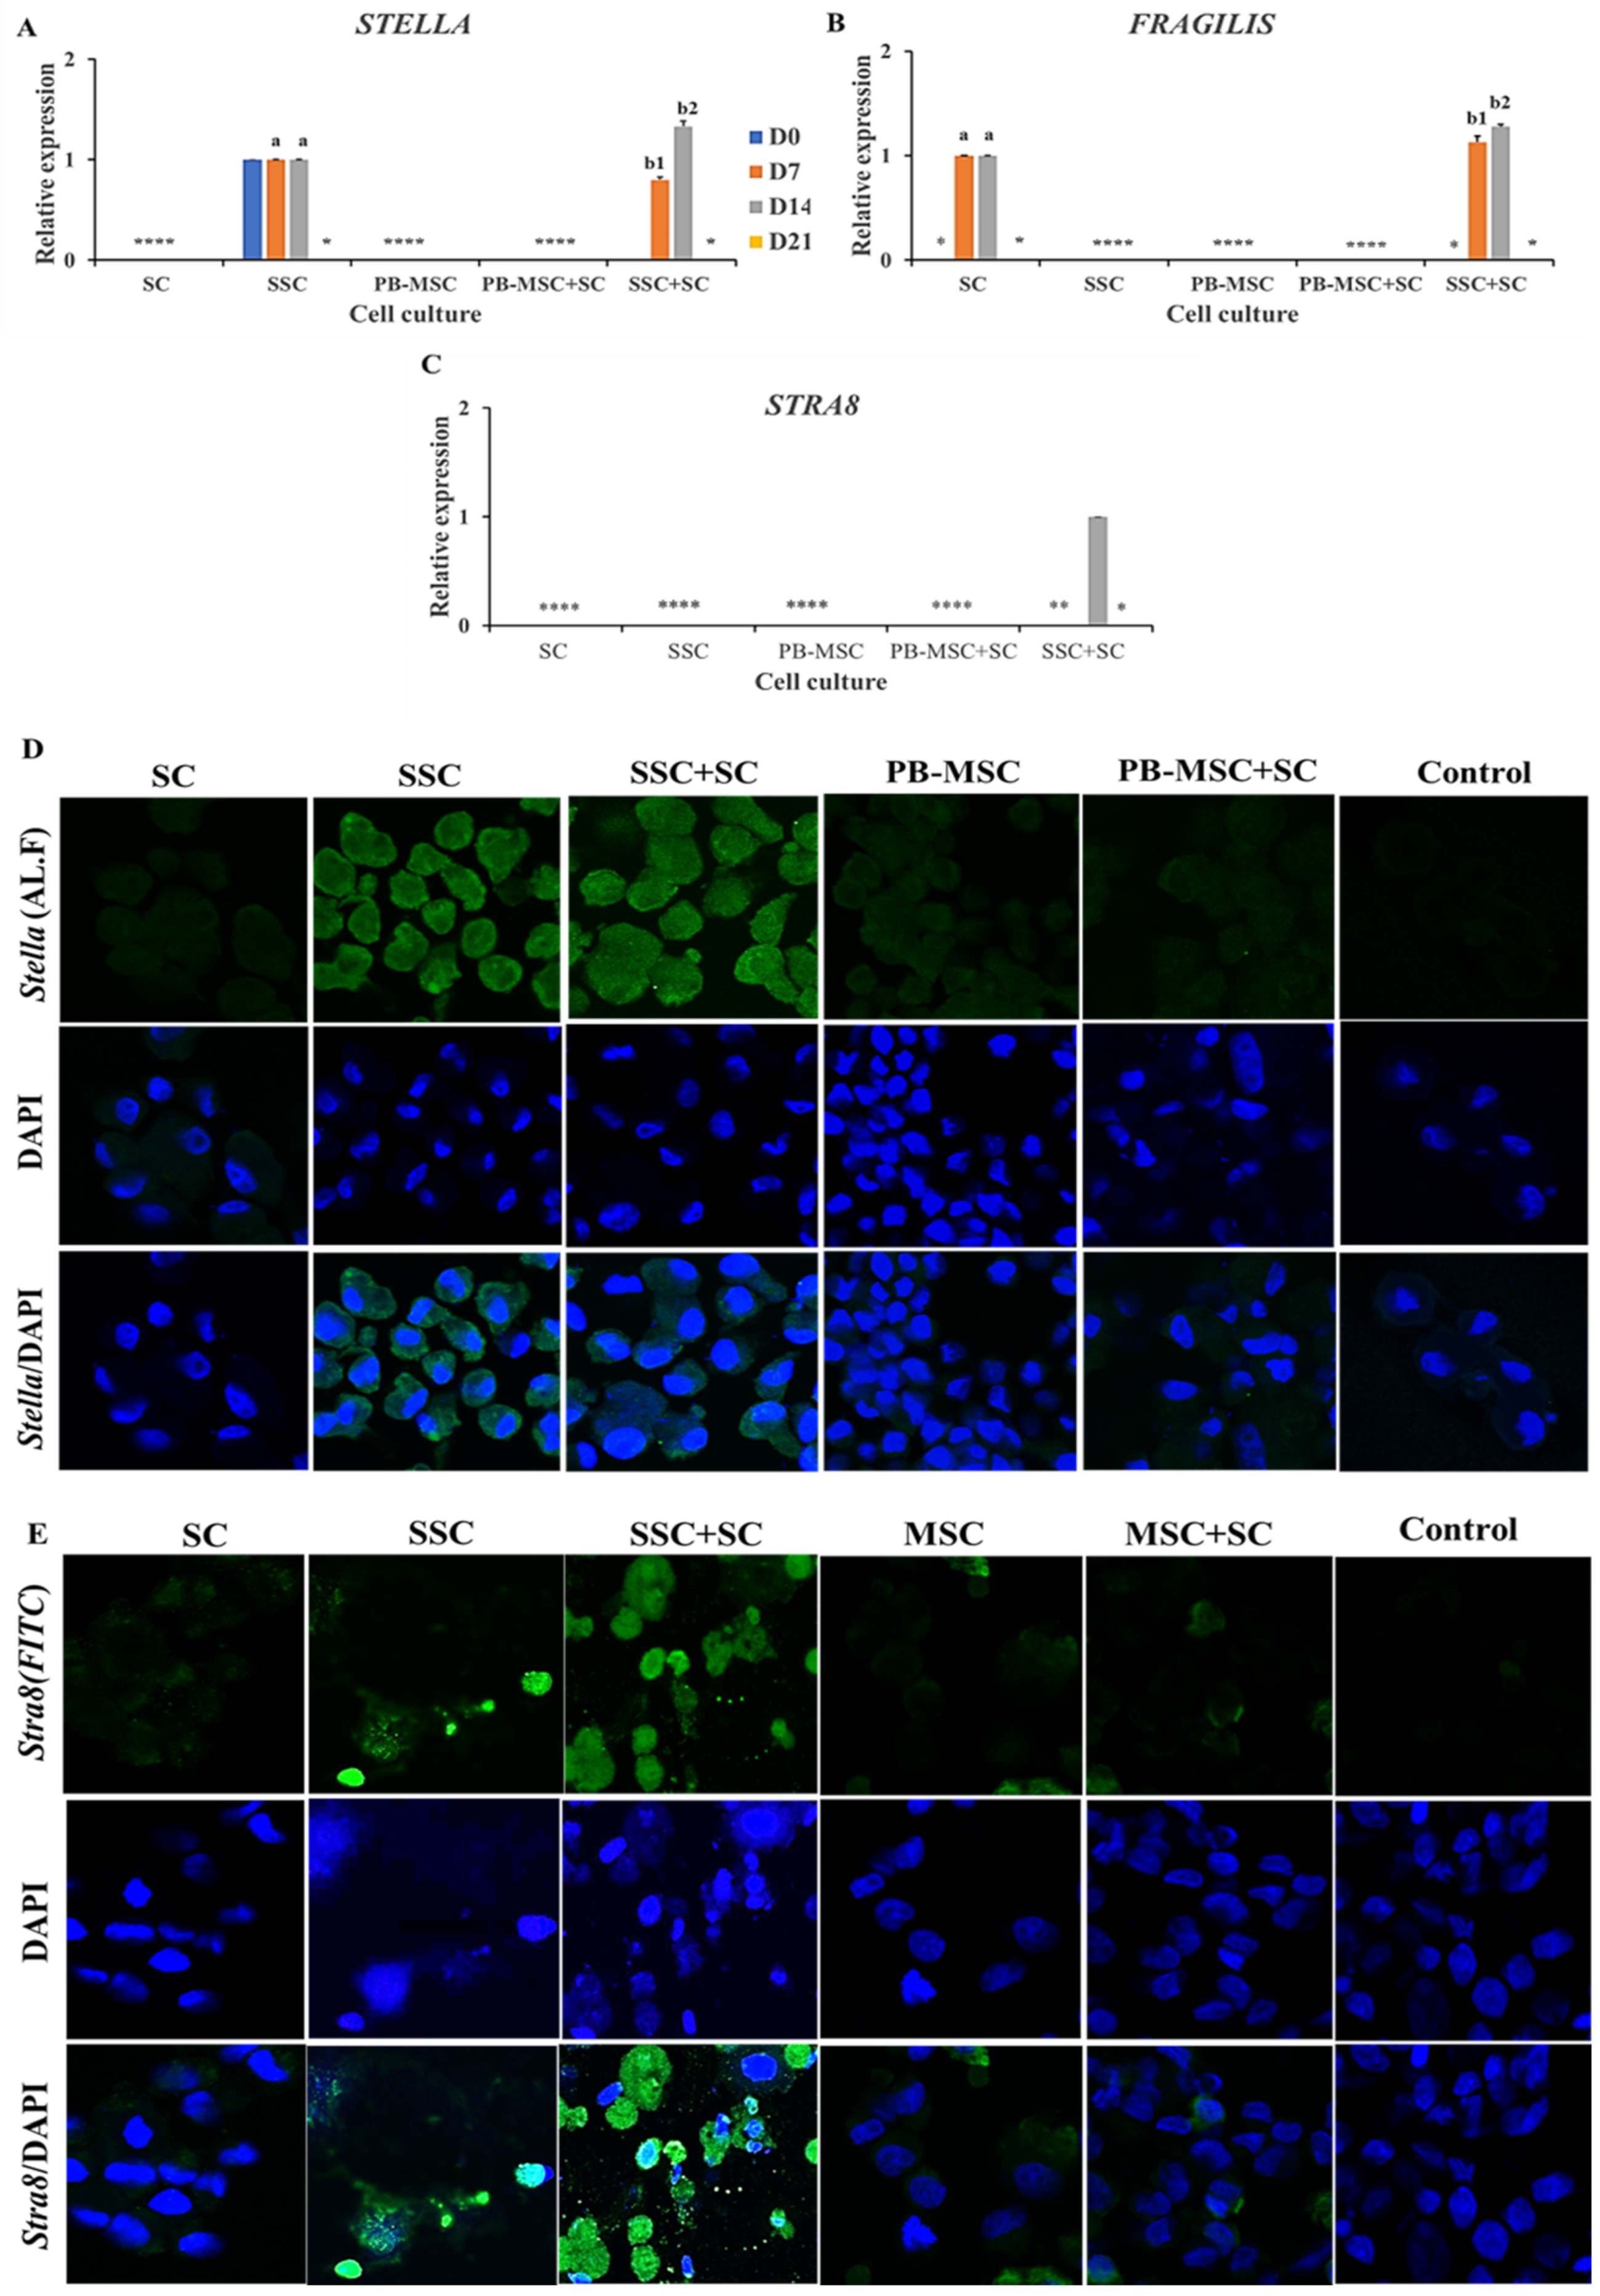
3.5. Expression of GC Markers in PB-MSC or SSC Co-Cultured with SC for 21 Days in 3D SACS

Co-culture of PB-MSC+SC in 3D SACS up-regulated (p < 0.05) gene expression of DAZL (1.6 ± 0.04-fold MSC) compared to SC and PB-MSC single cultures on day 14 (Figure 4A, Table 2). SSC+SC co-cultures increased (p < 0.05) DAZL gene expression on day 21 (1.6 ± 0.13-fold SSC) compared to SSC (0.9 ± 0.05-fold MSC). DAZL gene expression was not detected in SC single cultures. Accordingly, immunofluorescence associated to DAZL was intense in PB-MSC+SC and SSC+SC co-cultures; however, DAZL was also immunodetected in SC, SSC and PB-MSC single cultures at day 14 (Figure 4C). Levels of mRNA of PIWIL2 were higher (p < 0.05) in PB-MSC+SC (1.6 ± 0.05-fold SC) and SSC+SC (1.4 ± 0.04-fold SC) co-cultures in days 7, 14 and 21 compared with SC, SSC and PB-MSC (1.0 ± 0.03-fold SC) (Figure 4B, Table 2). In accordance with mRNA levels, immunofluorescence associated to PIWIL2 was more intense in cocultures of PB-MSC+SC and SSC+SC compared to single cultures at day 14 (Figure 4D).
Higher (p < 0.05) mRNA levels of STELLA were detected on day 14 in co-cultures of SSC+SC (1.3 ± 0.04-fold SSC) compared to SSC (Figure 5A, Table 2). STELLA gene expression increased (p < 0.05) in SSC+SC co-culture from day 7 to 14 day (0.8 ± 0.03-fold SC to 1.3 ± 0.04-fold SSC). Immunoreactivity for STELLA was detected in SSC and co-cultures of SSC+SC at day 14 of the experimental period (Figure 5D). Levels of FRAGILIS gene expression were higher (p < 0.05) in SSC+SC co-cultures (1.3 ± 0.03; 1.1 ± 0.05-fold SC) compared to SC on days 7 and 14 (Figure 5B, Table 2). Moreover, FRAGILIS gene expression increased (p < 0.05) in SSC+SC co-culture from day 7 to 14 day (1.1 ± 0.05-fold SC to 1.3 ± 0.03-fold SC). STRA8 gene expression was only detected in SSC+SC co-culture on day 14 (Figure 5B, Table 2). Additionally, immunofluorescence associated to STRA8 was observed in SSC and SSC+SC co-cultures at day 14 with a cytoplasmatic and nuclear pattern (Figure 5E). Gene expressions of SCP3 and VASA were not detected in either PB-MSC or SSC single cultures or co-cultures with SC.

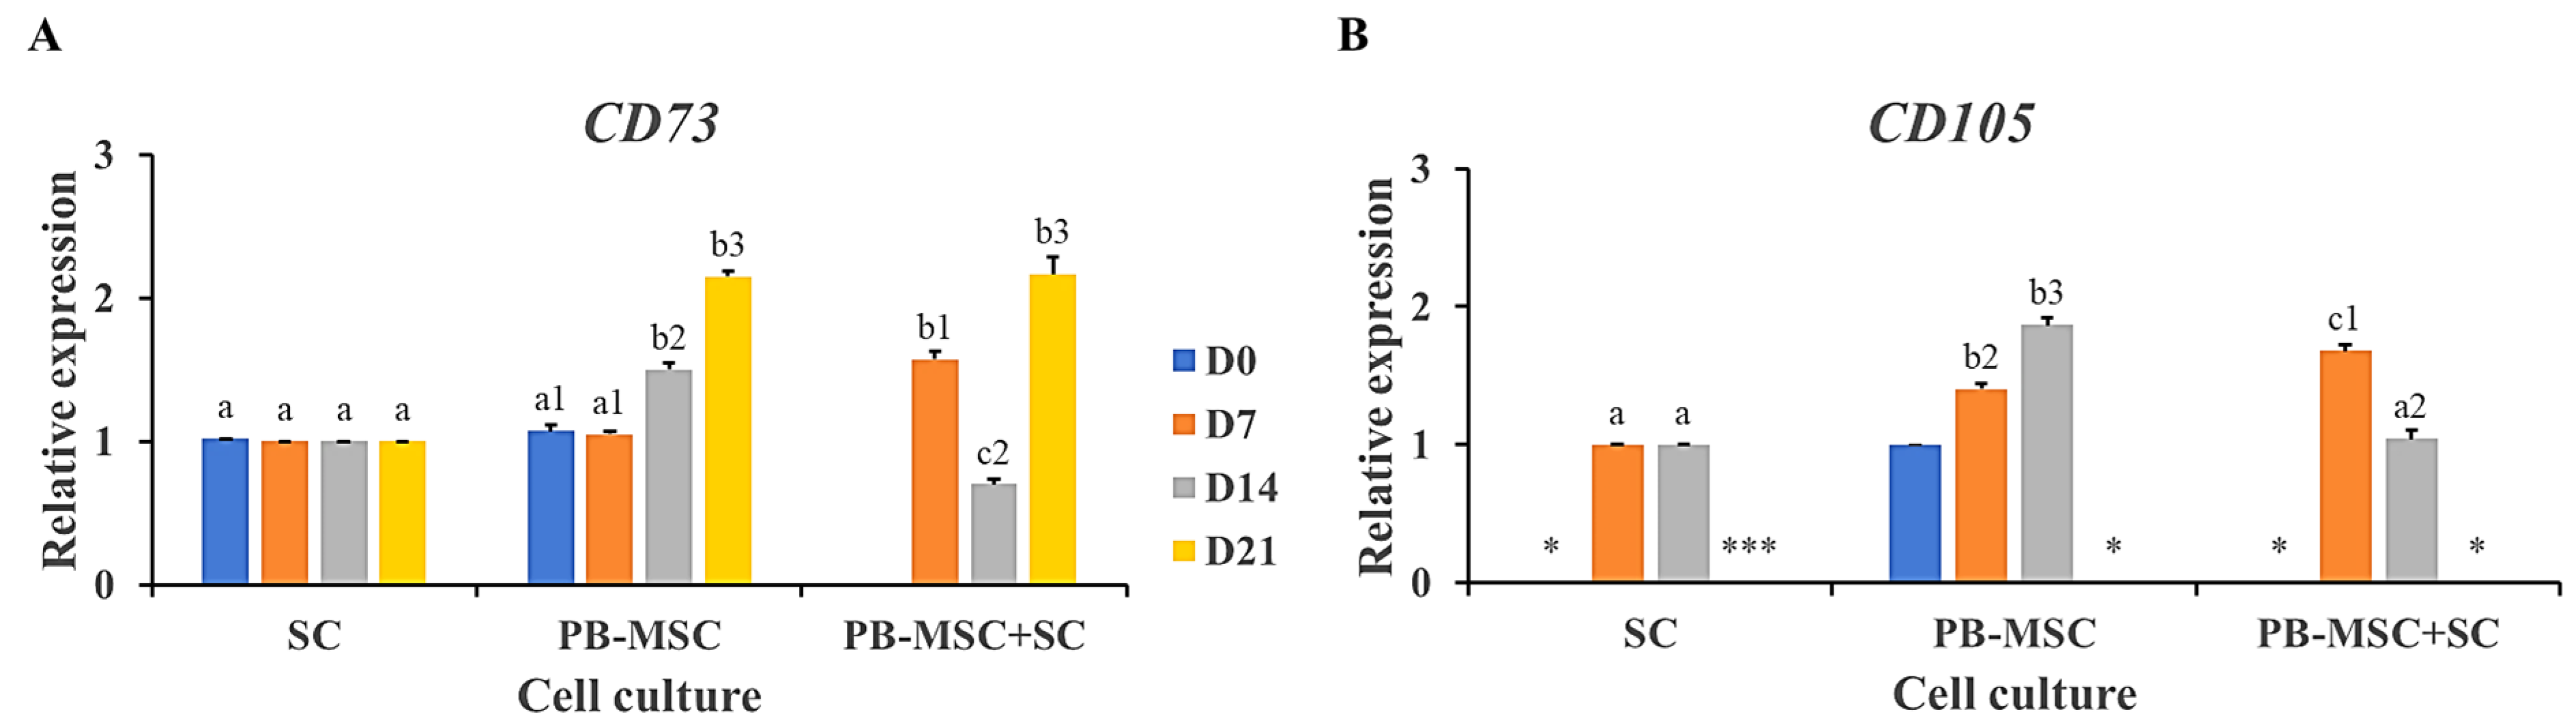
3.6. Gene Expression of MSC Markers in PB-MSC Co-Cultured with SC in 3D SACS for 21 Days

The mesenchymal cell-specific profile was evaluated in PB-MSC and SC single cultures and PB-MSC+SC co-cultures in 3D SACS during a 21-day experimental period. PB-MSC+SC co-cultures down-regulated (p < 0.05) gene expression of CD73 and CD105 (0.7 ± 0.02-fold SC, 1.0 ± 0.03-fold SC) on day 14 compared to PB-MSC and SC single cultures (1.5 ± 0.04-fold SC, 1.9 ± 0.04-fold SC) (Figure 6A,B, Table 2). In comparison, CD73 gene expression increased (p < 0.05) in PB-MSC+SC co-cultures at day 7 (1.6 ± 0.04) and 21 (2.1 ± 0.02) of culture, compared to single cultures. CD105 mRNA levels increased (p < 0.05) in PB-MSC+SC co-cultures at day 7 (1.9 ± 0.05-fold MSC), whereas CD105 gene expression was not detected in PB-MSC+SC co-cultures at day 21.

4. Discussion

In the present study, we compared the potential for GC differentiation of bull PB-MSC and SSC in 3D SACS co-culture systems with SC during a 21-day culture period. Previous studies have reported difficulties in the isolation of PB-MSC due to limited availability in the circulating blood, diverse marker expression profiles and presence of hematopoietic cell precursors in the isolates [10]. In our study we used conventional Percoll separation for selection and standard culture system for expansion of bull PB-MSC, which resulted in obtention of adequate yields of PB-MSC for subsequent differentiation experiments. Furthermore, bull PB-MSC shared characteristics of bovine fetal BM-MSC and AT-MSC including fibroblastic morphology, high levels of expression of MSC markers CD73 and CD105, and low levels of expression of hematopoietic molecules CD45 and CD34 [4,16,19]. Despite that previous studies on human [9,31] and ovine [32] cells have detected high levels of expression of CD90 in PB-MSC, one of the few previous analyses on bovine PB-MSC (7) did not analyze the expression of CD90. The role of CD90 in MSC biology is not clear; however, previous studies have indicated that reduction of CD90 expression resulted in increased potential for osteogenic and adipogenic differentiation of MSC, which suggests that CD90 may constitute an obstacle for MSC differentiation [33]. Overall, our analyses and previous data suggest that bull PB-MSC may display a different profile of CD90 expression compared to other species, and we can also speculate that the lack of CD90 expression may facilitate differentiation of bull PB-MSC. Despite the trilineage (osteogenic, adipogenic and chondrogenic) differentiation capacity of human PB-MSC have been previously reported [34], further studies are required to explore the mesodermal differentiation potential of bull PB-MSC. Nevertheless, PB-MSC represent an interesting source of MSC with various comparative advantages to other sources including availability of donors from different ages and sexes, avoidance of ethical concerns, minimally invasive collection procedures, and collection of adequate yields of MSC with specific profiles.
Cultures of SC used in this study were isolated from abattoir-derived testis and expanded as previously reported [19]. These SC populations expressed high mRNA levels of WT1 and AR and displayed intense immunofluorescence associated to WT1. These results correspond to a previous study reporting a positivity of around 90% to WT1 using FACS analysis [19]. Both WT1 and AR markers have been previously identified as specific for SC in murine and human models [26,35]. WT1 is related to the development of the gonad and acts as a transcription factor that regulates the inductive signal of the mesenchymal towards the coelomic epithelium of the mesonephros controlling the growth of the gonadal ridges that give rise to SC [36]. AR functions as a nuclear receptor and as a ligand-dependent transcription factor, which regulates the expression of a wide variety of genes involved in the development of puberty and male fertility [36]. Although SC populations used in the present study were isolated from testis by non-specific methods including enzymatic digestion and plastic adherence, these results indicate that homogeneous cultures of bull SC were obtained and used for subsequent differentiation experiments.
Bull SSC were isolated by two-step enzymatic digestion, sequential filtration and were separated by differential adhesion following a previously reported protocol [27]. The SSC population isolated through these methods expressed high mRNA levels of UCHL1 and CD90 and were immunopositive for UCHL1. Despite the lack of specific markers reported for SSC in domestic animals [37], UCHL1 has been found to be consistently and specifically expressed in bull SSC [37,38,39]. UCHL1 is related to the events of self-renewal and colocalization of SSC and is expressed in vivo in SSC located in the basement membrane of the seminiferous tubules, but not in differentiated GC [40,41]. UCHL1 is expressed in male premeiotic GC and shows no affinity for somatic cells, making it an optimal marker for spermatogonia in domestic bull testes [37]. Moreover, CD90 positive cells have been shown to exhibit cardinal properties of SSC, including proliferation, differentiation and colony formation in human and mouse models [31,42]. Our results indicate that SSC isolated from bull testes by enzymatic digestion, sequential filtration and differential adhesion display a consistent and homogeneous marker expression profile during subculturing. Furthermore, previous reports have indicated that putative SSC derived from domestic animals can be easily isolated and cultured; however, they suffer a gradual decline in proliferation during subculture, and, over time, spontaneous differentiation and apoptosis dominate cellular events, with the ultimate detention of SSC proliferation [37,43]. In this context, expansion of SSC under in vitro conditions could only be maintained for a short time, no more than 60 days, as a consequence of spontaneous differentiation to unspecific cell lineage [28,38,44,45]. In our study, however, primary cultures of SSC were kept in culture for intervals not exceeding 30 days, and, during this time, SSC maintained proliferation and were adherent with irregular and cuboidal morphology. Moreover, these bull SSC were able to respond to co-cultures with SC suggesting the absence of spontaneous differentiation.
In vitro co-cultures of PB-MSC+SC and SSC+SC in 3D SACS were established to recreate the testicular microenvironment and cell interactions with the aim to induce comparable patterns of differentiation in both bull PB-MSC and SSC into male GC. Cultures on 3D SACS can mimic tissue or organ-like characteristics and replicate the cellular environment in a more efficient manner compared to 2D cell cultures. As a result, 3D SACS may allow induced expression of the GC-specific profile of markers in a closer manner to those observed in vivo [29]. In the present study, 3D SACS induced formation of round and dense colonies in co-cultures of SSC+SC and MSC+SC from day 14 to 21, compared to more flat colonies in their single cultures of SC, PB-MSC and SSC. Similar changes in cell morphology have been reported in a co-culture of human SSC+SC for 14 days using 1% gelatin plates [46,47]. Formation of these round colonies may be the consequence of the 3D spatial distribution of cells and may also be associated to a tubular structure formation of seminiferous tubules with tight junctions. This structure may provide a better environment for interaction by cell–cell contact and for the paracrine secretion of SC.
Despite co-culture of PB-MSC with SC resulting in down-regulation of NANOG during the 21-day culture period, this co-culture induced up-regulation of OCT4 at day 7. In comparison, co-culture of SSC with SC resulted in consistent expression of NANOG, OCT4 and SOX2 at day 14. NANOG, OCT4 and SOX2 are transcription factors that regulate common genes that promote pluripotency and self-renewal downstream, while inhibiting differentiation processes [48]. NANOG expression is promoted by OCT4 and SOX2 expression [49,50], and together these three factors regulate a network of genes involved in the control of factors associated to chromatin remodeling, cell cycle and signal suppression [51]. These genes are expressed in both pluripotent GC and other early GC [51,52]. Consequently, its high expression indicates a state of undifferentiation in pluripotent cells and its down-regulation would occur during cell differentiation [46,52]. Thus, our results indicate that co-culture with SC in 3D SACS may induce different patterns of pluripotency marker expression representing different states of pluripotency in bull PB-MSC or SSC. While converse expression of NANOG and OCT4 in PB-MSC+SC may indicate a partial induction of the differentiation process, consistent expression of NANOG, OCT4 and SOX2 in the SSC+SC co-cultures at day 14 may suggest the establishment of an undifferentiated or pluripotency state.
During co-culture in 3D SACS, SSC+SC increased the expression levels of DAZL, PIWIL2, FRAGILIS and STELLA, and activated the expression of STRA8. In comparison, co-culture of PB-MSC+SC only increased the expression levels of DAZL and PIWIL2. The results indicate that SSC+SC co-culture display a more robust GC differentiation profile characterized by the expression of more GC genes, compared with MSC+SC co-cultured under the same conditions. It is important to highlight that SSC are unipotent stem cells predetermined to sperm differentiation [53]. In comparison, PB-MSC are multipotent cells initially predetermined to differentiation into mesodermal lineages [2,3,54]. DAZL is essential for mammalian spermatogenesis and is involved in proliferation, development, maturation and functional maintenance of male GC [55]. The marker PIWIL2 is expressed exclusively in GC, where it has a role in SSC self-renewal and spermatogenesis [56,57]. In the mouse, PIWIL2 null mutants have been shown to have incomplete spermatogenesis and cannot produce spermatozoa [56]. Whereas FRAGILIS, a member of the interferon-induced family of transmembrane protein genes [58], is expressed in the genital crest at day 9.5 dais (days after intercourse) and then in the fetal gonad at day 13.5 [59]. The expression of STELLA is positive in the primordial GC during their migration to the dorsal mesentery at 8.5 dais, maintaining its expression up to 15.5 dais [58]. Bull PB-MSC displayed a more restricted GC profile compared to SSC, which suggests that co-culture with SC in 3D SACS represents a suitable culture system to compare GC differentiation of both PB-MSC and SSC. In addition, as indicated above, the more restricted GC profile of PB-MSC may be associated to its multipotentiality toward mesenchymal lineages including osteogenic, adipogenic and chondrogenic, compared to the unipotentiality of SSC toward GC and sperm. Previous studies have reported bovine AT-MSC and BM-MSC co-cultured with SC in a 2D system up-regulate DAZL and PIWIL2 expression [19]. Moreover, exposure of bovine AT-MSC to BMP4 or RA for 14 days have also resulted in up-regulation of PIWIL2 expression [16,17]. Overall, these results indicate that bovine MSC collected from different tissue sources may display a similar response after stimulation with different GC differentiation strategies, suggesting the presence of similar potential of MSC for GC differentiation but also the limited capacity of these culture systems to further induce advancement in the differentiation process.
Co-culture of PB-MSC+SC in 3D SACS for 21 days results in down-regulation of CD73 and CD105 gene expression at day 14. Similarly, our previous studies have reported down-regulation of CD73 and CD105 in AT-MSC and BM-MSC co-cultured with SC in 2D system at day 14 [19]. CD73 is considered a marker of MSC, is co-expressed with integrin β2 molecules and is involved in mechanisms of cell adhesion [54]. CD105 is a receptor for the growth factors TGFβ1 and TGFβ3 and modulates its signaling by regulating the composition of different components of the extracellular matrix, including fibronectin and collagen [52,60]. Our results also showed that CD73 and CD105 were also expressed in bull SC, therefore they would not be selective for the PB-MSC population. Up-regulation expression of CD73 mRNA on day 21 in PB-MSC+SC co-culture may be associated with the increased expression in single cultures of PB-MSC at the same day. However, down-regulation of CD73 and CD105 expression levels in the MSC+SC co-cultures on day 14 suggests that MSC would be losing the mesenchymal phenotype as an effect of SC interaction and progressing in the GC differentiation process.

5. Conclusions

Bull PB-MSC display some of the pre-defined requirements for human MSC, including adherence to plastic dishes under standard culture conditions, high expression of CD73 and CD105 and low expression of CD45 and CD34. Co-culture of bull PB-MSC+SC and SSC+SC in 3D SACS results in differential expression of pluripotency and GC markers. Bull SSC display a more robust GC differentiation profile compared to PB-MSC, which may be associated to their unipotency toward sperm differentiation. Based on the patterns of expression of pluripotency and GC markers detected in SSC+SC and MSC+SC co-cultures, we can conclude that day 14 constitutes the period when SSC and MSC co-cultured with SC partially reached a stage of early GC.

Author Contributions

Conceptualization, M.N.S., M.DR., C.G.T., V.H.P. and O.A.P.; Methodology, M.N.S., C.D., C.G.T. and O.A.P.; Software, M.N.S.; Validation, C.D., M.D.l.R., C.G.T., V.H.P. and O.A.P.; Formal Analysis, M.N.S. and O.A.P.; Investigation, M.N.S., C.G.T., V.H.P. and O.A.P.; Resources, M.D.l.R., C.G.T., V.H.P. and O.A.P.; Data Curation, M.N.S., C.G.T., V.H.P. and O.A.P.; Writing—Original Draft Preparation, M.N.S., M.D.l.R., C.G.T., V.H.P. and O.A.P.; Writing—Review and Editing, M.DR., C.G.T., V.H.P. and O.A.P.; Visualization, M.D.l.R., C.G.T., V.H.P. and O.A.P.; Supervision, M.D.l.R., C.G.T., V.H.P. and O.A.P.; Project Administration, C.G.T., V.H.P. and O.A.P.; Funding Acquisition, C.G.T., V.H.P. and O.A.P. All authors have read and agreed to the published version of the manuscript.

Funding

This study was supported by grant 1191114 from the National Research and Development Agency of Chile (ANID) from the Ministry of Education, Government of Chile. Moises Segunda scholarship was granted by the Chilean Agency for International Cooperation and Development ANID 21210138, and the Veterinary Medicine Faculty/University José Eduardo dos Santos (FMV/UJES/Angola).

Institutional Review Board Statement

All experimental procedures have been approved and were performed in accordance with guidelines and regulations of the Bioethical Committees of the Faculty of Veterinary and Animal Sciences at University of Chile.

Informed Consent Statement

Not applicable.

Data Availability Statement

The data presented in this study are available on request from the corresponding author.

Conflicts of Interest

The authors declare no conflict of interest.

References

  1. Wei, X.; Peng, G.; Zheng, S.; Wu, X. Differentiation of umbilical cord mesenchymal stem cells into steroidogenic cells in comparison to bone marrow mesenchymal stem cells. Cell Prolif. 2012, 45, 101–110. [Google Scholar] [CrossRef] [PubMed]
  2. Dominici, M.L.B.K.; Le Blanc, K.; Mueller, I.; Slaper-Cortenbach, I.; Marini, F.C.; Krause, D.S.; Horwitz, E.M. Minimal criteria for defining multipotent mesenchymal stromal cells. The International Society for Cellular Therapy position statement. Cytotherapy 2006, 8, 315–317. [Google Scholar] [CrossRef] [PubMed]
  3. Li, S.; Huang, K.J.; Wu, J.C.; Hu, M.S.; Sanyal, M.; Hu, M.; Logaker, H.; Lorenz, H.P. Peripheral blood-derived mesenchymal stem cells: Candidate cells responsible for healing critical-sized calvarial bone defects. Stem Cells Transl. Med. 2015, 4, 359–368. [Google Scholar] [CrossRef] [PubMed] [Green Version]
  4. Dueñas, F.; Becerra, V.; Cortes, Y.; Vidal, S.; Sáenz, L.; Palomino, J.; Peralta, O.A. Hepatogenic and neurogenic differentiation of bone marrow mesenchymal stem cells from abattoir-derived bovine fetuses. BMC Vet. Res. 2014, 10, 154. [Google Scholar] [CrossRef] [Green Version]
  5. Kohyama, J.; Abe, H.; Shimazaki, T.; Koizumi, A.; Okano, H.; Hata, J.; Gojo, S. Brain from bone: Efficient “meta-differentiation” of marrow stroma-derived mature osteoblasts to neurons with Noggin or a demethylating agent. Differentiation 2001, 68, 235–244. [Google Scholar] [CrossRef]
  6. Oliveira, É.M.D. Diferenciação de Células-Tronco em Hepatócitos e Desenvolvimento de Modelo Pré-Clínico de Fibrose Hepática para Ensaios de Terapia Celular. Ph.D. Thesis, Universidade de São Paulo, Sao Paulo, Brazil, 2013. [Google Scholar] [CrossRef]
  7. Calle, A.; Gutiérrez-Reinoso, M.Á.; Re, M.; Blanco, J.; De La Fuente, J.; Monguió-Tortajada, M.; Ramírez, M.Á. Bovine peripheral blood MSC chemotax towards inflammation and embryo implantation stimuli. J. Cell. Physiol. 2021, 236, 1054–1067. [Google Scholar] [CrossRef]
  8. Vater, C.; Kasten, P.; Stiehler, M. Culture media for the differentiation of mesenchymal stromal cells. Acta Biometer. 2011, 7, 463–477. [Google Scholar] [CrossRef]
  9. Lin, W.; Xu, L.; Lin, S.; Shi, L.; Wang, B.; Pan, Q.; Li, G. Characterization of multipotent stem cells from human peripheral blood using an improved protocol. J. Orthop. Translat. 2019, 19, 18–28. [Google Scholar] [CrossRef]
  10. He, Q.; Wan, C.; Li, G. Concise review: Multipotent mesenchymal stromal cells in blood. Stem Cells 2007, 25, 69–77. [Google Scholar] [CrossRef]
  11. Gholami, K.; Pourmand, G.; Koruji, M.; Sadighigilani, M.; Navid, S.; Izadyar, F.; Abbasi, M. Efficiency of colony formation and differentiation of human spermatogenic cells in two different culture systems. Reprod. Biol. 2018, 18, 397–403. [Google Scholar] [CrossRef]
  12. Savvulidi, F.; Ptacek, M.; Vargova, K.S.; Stadnik, L. Manipulation of spermatogonial stem cells in livestock species. J. Anim. Sci. Biotechnol. 2019, 10, 46. [Google Scholar] [CrossRef]
  13. Aponte, P.M.; De Rooij, D.G. Biomanipulation of bovine spermatogonial stem cells. Anim. Reprod. 2018, 5, 16–22. [Google Scholar]
  14. Han, Y.; Li, X.; Zhang, Y.; Han, Y.; Chang, F.; Ding, J. Mesenchymal stem cells for regenerative medicine. Cells 2019, 8, 886. [Google Scholar] [CrossRef] [Green Version]
  15. Vellasamy, S.; Sandrasaigaran, P.; Vidyadaran, S.; George, E.; Ramasamy, R. Isolation and characterization of mesenchymal stem cells derived from human placenta tissue. Stem Cells 2012, 4, 53. [Google Scholar] [CrossRef]
  16. Cortez, J.; Bahamonde, J.; De Los Reyes, M.; Palomino, J.; Torres, C.G.; Peralta, O.A. In vitro differentiation of bovine bone marrow-derived mesenchymal stem cells into male germ cells by exposure to exogenous bioactive factors. Reprod. Domest. Anim. 2018, 53, 700–709. [Google Scholar] [CrossRef]
  17. Cordero, P.; Guerrero-Moncayo, A.; De Los Reyes, M.; Varas-Godoy, M.; Cortez, J.; Torres, C.G.; Peralta, O.A. Overexpression of DAZL, STRA8, and BOULE genes and treatment with BMP4 or retinoic acid modulate the expression of MSC overexpressing germ cell genes. Front. Vet. Sci. 2021, 8, 667547. [Google Scholar] [CrossRef]
  18. Ruwanpura, S.M.; Mclachlan, R.I.; Meachem, S.J. Hormonal regulation of male germ cell development. J. Endocrinol. 2010, 205, 117–131. [Google Scholar] [CrossRef]
  19. Segunda, M.N.; Bahamonde, J.; Muñoz, I.; Sepulveda, S.; Cortez, J.; De Los Reyes, M.; Peralta, O.A. Sertoli cell-mediated differentiation of bovine fetal mesenchymal stem cells into germ cell lineage using an in vitro coculture system. Theriogenology 2019, 130, 8–18. [Google Scholar] [CrossRef]
  20. Xie, L.; Lin, L.; Tang, Q.; Li, W.; Huang, T.; Huo, X.; Ma, L. Sertoli cell-mediated differentiation of male germ cell-like cells from human umbilical cord Wharton’s jelly-derived mesenchymal stem cells in an in vitro coculture system. Eur. J. Med. Res. 2015, 20, 9. [Google Scholar] [CrossRef] [Green Version]
  21. Rossi, P.; Dolci, S. Paracrine mechanisms involved in the control of early stages of mammalian spermatogenesis. Front. Endocrinol. 2013, 4, 181. [Google Scholar] [CrossRef]
  22. Huleihel, M.; Nourashrafeddin, S.; Plant, T.M. Application of three-dimensional culture systems to study mammalian spermatogenesis, with an emphasis on the rhesus monkey (Macaca mulatta). Asian J. Androl. 2015, 17, 972. [Google Scholar] [CrossRef] [PubMed]
  23. Lie, P.P.; Cheng, C.Y.; Mruk, D.D. Signaling pathways regulating the blood—Testis barrier. Int. J. Biochem. Cell Biol. 2013, 45, 621–625. [Google Scholar] [CrossRef] [Green Version]
  24. Monteiro, C.D.; Bicudo, S.D.; Toma, H.S. O papel das células de Sertoli na espermatogênese. Pubvet 2010, 855, 1–17. [Google Scholar]
  25. Jabari, A.; Gilani, M.A.S.; Koruji, M.; Gholami, K.; Mohsenzadeh, M.; Khadivi, F.; Movassagh, S.A. Three-dimensional coculture of human spermatogonial stem cells with Sertoli cells in soft agar culture system supplemented by growth factors and Laminin. Acta Histochem. 2020, 122, 151572. [Google Scholar] [CrossRef] [PubMed]
  26. Wang, X.; Song, W.; Kawazoe, N.; Chen, G. The osteogenic differentiation of mesenchymal stem cells by controlled cell–cell interaction on micropatterned surfaces. J. Biomed. Mater. Res. 2013, 101, 3388–3395. [Google Scholar] [CrossRef]
  27. Hamidabadi, H.G.; Bojnordi, M.N. Coculture of mouse spermatogonial stem cells with sertoli cell as a feeder layer, stimulates the proliferation and spermatogonial stemness profile. Middle East Fertil. Soc. J. 2018, 23, 107–111. [Google Scholar] [CrossRef]
  28. Zheng, Y.; Tian, X.; Zhang, Y.; Qin, J.; An, J.; Zeng, W. In vitro propagation of male germline stem cells from piglets. J. Assist. Reprod. Genet. 2013, 30, 945–952. [Google Scholar] [CrossRef] [Green Version]
  29. Stukenborg, J.B.; Wistuba, J.; Luetjens, C.M.; Elhija, M.A.; Huleihel, M.; Lunenfeld, E.; Gromoll, J.; Nieschlag, E.; Schlatt, S. Coculture of spermatogonia with somatic cells in a novel three-dimensional soft-agar-culture-system. J. Androl. 2008, 29, 312–329. [Google Scholar] [CrossRef]
  30. Schefe, J.H.; Lehmann, K.E.; Buschmann, I.R.; Unger, T.; Funke-Kaiser, H. Quantitative real-time RT-PCR data analysis: Current concepts and the novel “gene expression’s C T difference” formula. J. Mol. Med. 2006, 84, 901–910. [Google Scholar] [CrossRef]
  31. Li, N.; Ma, W.; Shen, Q.; Zhang, M.; Du, Z.; Wu, C.; Hua, J. Reconstitution of male germline cell specification from mouse embryonic stem cells using defined factors in vitro. Cell Death Differ. 2019, 26, 2115–2124. [Google Scholar] [CrossRef]
  32. Lyahyai, J.; Mediano, D.R.; Ranera, B.; Sanz, A.; Remacha, A.R.; Bolea, R.; Zaragoza, P.; Rodellar, C.; Martín-Burriel, I. Isolation and characterization of ovine mesenchymal stem cells derived from peripheral blood. BMC Vet. Res. 2012, 8, 169. [Google Scholar] [CrossRef]
  33. Moraes, D.A.; Sibov, T.T.; Pavon, L.F.; Alvim, P.Q.; Bonadio, R.S.; Da Silva, J.R.; Pic-Taylor, A.; Toledo, O.A.; Marti, L.C.; Azevedo, R.B.; et al. A reduction in CD90 (THY-1) expression results in increased differentiation of mesenchymal stromal cells. Stem Cell Res. Ther. 2016, 7, 97. [Google Scholar] [CrossRef] [Green Version]
  34. Xu, L.; Li, G. Circulating mesenchymal stem cells and their clinical implications. implications. J. Orthop. Translat. 2014, 2, 1–7. [Google Scholar] [CrossRef] [Green Version]
  35. Chen, M.; Zhang, L.; Cui, X.; Lin, X.; Li, Y.; Wang, Y.; Gao, F. Wt1 directs the lineage specification of sertoli and granulosa cells by repressing Sf1 expression. Development 2017, 144, 44–53. [Google Scholar] [CrossRef] [Green Version]
  36. Piprek, R.P.; Kloc, M.; Kubiak, J.Z. Early development of the gonads: Origin and differentiation of the somatic cells of the genital ridges. In Molecular Mechanisms of Cell Differentiation in Gonad Development; Springer: Cham, Switzerland, 2016; pp. 1–22. [Google Scholar] [CrossRef]
  37. Zheng, Y.; Zhang, Y.; Qu, R.; He, Y.; Tian, X.; Zeng, W. Spermatogonial stem cells from domestic animals: Progress and prospects. Reproduction 2014, 147, R65–R74. [Google Scholar] [CrossRef] [Green Version]
  38. Fujihara, M.; Kim, S.M.; Minami, N.; Yamada, M.; Imai, H. Characterization and in vitro culture of male germ cells from developing bovine testis. J. Reprod. Dev. 2011, 57, 355–364. [Google Scholar] [CrossRef] [Green Version]
  39. Herrid, M.; Davey, R.J.; Hill, J.R. Characterization of germ cells from pre-pubertal bull calves in preparation for germ cell transplantation. Cell Tissue Res. 2007, 330, 321–329. [Google Scholar] [CrossRef]
  40. Luo, J.; Megee, S.; Dobrinski, I. Asymmetric distribution of UCH-L1 in spermatogonia is associated with maintenance and differentiation of spermatogonial stem cells. J. Cell. Physiol. 2009, 220, 460–468. [Google Scholar] [CrossRef] [Green Version]
  41. Ram, K.; Kannan, T.; Basha, S.; Geetha Ramesh, G.R.; William, B. In-vitro culture morphology of Spermatogonial stem cells (SSCs) in mice. Int. J. Livest. 2017, 7, 52–59. [Google Scholar] [CrossRef]
  42. Zhao, Y.; Ye, S.; Liang, D.; Wang, P.; Fu, J.; Ma, Q.; Wang, Y. In vitro modeling of human germ cell development using pluripotent stem cells. Stem Cell Rep. 2018, 10, 509–523. [Google Scholar] [CrossRef]
  43. Nazm Bojnordi, M.; Ghasemi, H.; Narimanpour, Z. An Efficient In Vitro Culture System to Amplify Spermatogonia Stem Cell Markers. Res. Mol. Med. 2020, 8, 10–20. [Google Scholar] [CrossRef]
  44. Aponte, P.M.; Soda, T.; Van De Kant, H.J.G.; De Rooij, D.G. Basic features of bovine spermatogonial culture and effects of glial cell line-derived neurotrophic factor. Theriogenology 2006, 65, 1828–1847. [Google Scholar] [CrossRef] [PubMed]
  45. Luo, J.; Megee, S.; Rathi, R.; Dobrinski, I. Protein gene product 9.5 is a spermatogonia-specific marker in the pig testis: Application to enrichment and culture of porcine spermatogonia. Mol. Reprod. Dev. 2006, 12, 1531–1540. [Google Scholar] [CrossRef] [PubMed]
  46. Browne, S.; Jha, A.K.; Ameri, K.; Marcus, S.G.; Yeghiazarians, Y.; Healy, K.E. TGF-β1/CD105 signaling controls vascular network formation within growth factor sequestering hyaluronic acid hydrogels. PLoS ONE 2018, 13, e0194679. [Google Scholar] [CrossRef] [PubMed] [Green Version]
  47. Mohammadzadeh, E.; Mirzapour, T.; Nowroozi, M.R.; Nazarian, H.; Piryaei, A.; Alipour, F.; Ghaffari Novin, M. Differentiation of spermatogonial stem cells by soft agar three-dimensional culture system. Artif. Cells Nanomed. Biotechnol. 2019, 47, 1772–1781. [Google Scholar] [CrossRef]
  48. Boyer, L.A.; Lee, T.I.; Cole, M.F.; Johnstone, S.E.; Levine, S.S.; Zucker, J.P.; Young, R.A. Core transcriptional regulatory circuitry in human embryonic stem cells. Cell 2005, 122, 947–956. [Google Scholar] [CrossRef] [Green Version]
  49. Silva, J.; Nichols, J.; Theunissen, T.W.; Guo, G.; Van Oosten, A.L.; Barrandon, O.; Smith, A. Nanog is the gateway to the pluripotent ground state. Cell 2009, 138, 722–737. [Google Scholar] [CrossRef] [Green Version]
  50. Takahashi, K.; Yamanaka, S. Induction of pluripotent stem cells from mouse embryonic and adult fibroblast cultures by defined factors. Cell 2006, 126, 663–676. [Google Scholar] [CrossRef] [Green Version]
  51. Arooj, M.; Rashid, F.A.; Gul, A. Role of epigenetic modifications in stem cell regulatory regions (Oct4, Sox2 and Nanog) and cancer. IOSR J. Pharm. Biol. Sci. 2013, 5, 76–81. [Google Scholar] [CrossRef]
  52. Niwa, H.; Miyazaki, J.I.; Smith, A.G. Quantitative expression of Oct-3/4 defines differentiation, dedifferentiation or self-renewal of ES cells. Nat. Genet. 2000, 24, 372–376. [Google Scholar] [CrossRef]
  53. Sahare, M.G.; Imai, H. Recent advances of in vitro culture systems for spermatogonial stem cells in mammals. Reprod. Med. Biol. 2018, 17, 134–142. [Google Scholar] [CrossRef] [Green Version]
  54. Pham, H.; Tonai, R.; Wu, M.; Birtolo, C.; Chen, M. CD73, CD90, CD105 and Cadherin-11 RT-PCR screening for mesenchymal stem cells from cryopreserved human cord tissue. Int. J. Stem Cell 2018, 11, 26–38. [Google Scholar] [CrossRef] [Green Version]
  55. Zhang, Y.L.; Li, P.Z.; Pang, J.; Wan, Y.J.; Zhang, G.M.; Fan, Y.X.; Wang, F. Induction of goat bone marrow mesenchymal stem cells into putative male germ cells using mRNA for STRA8, BOULE and DAZL. Cytotechnology 2019, 71, 563–572. [Google Scholar] [CrossRef]
  56. Lee, J.H.; Engel, W.; Nayernia, K. Stem cell protein Piwil2 modulates expression of murine spermatogonial stem cell expressed genes. Mol. Reprod. Dev. 2006, 73, 173–179. [Google Scholar] [CrossRef]
  57. Saiti, D.; Lacham-Kaplan, O. Mouse Germ Cell Development in-vivo and in-vitro. Biomarker 2007, 2, 117727190700200024. [Google Scholar] [CrossRef]
  58. Saitou, M.; Barton, S.C.; Surani, M.A.A. Molecular programme for the specification of germ cell fate in mice. Nature 2002, 418, 2002. [Google Scholar] [CrossRef]
  59. Tanaka, S.S.; Matsui, Y. Developmentally regulated expression of mil-1 and mil-2, mouse interferon-induced transmembrane protein like genes, during formation and differentiation of primordial germ cells. Mech. Dev. 2002, 119 (Suppl. 1), S261–S267. [Google Scholar] [CrossRef]
  60. Nagano, M.; Ryu, B.Y.; Brinster, C.J.; Avarbock, M.R.; Brinster, R.L. Maintenance of mouse male germ line stem cells in vitro. Biol. Reprod. 2003, 68, 2207–2214. [Google Scholar] [CrossRef]
Figure 1. Phase contrast microscopy of single cultures and co-cultures in 3D SACS of bull PB-MSC, SC and SSC. (A) PB-MSC presented circular and fibroblastoid morphology at 5D of culture, elongated and heterogeneous morphology at 10D, and circular cells with large nuclei, triangular or circular shape at 15D. Bull SC formed a monolayer of large fibroblastoid cells with heterogenous morphology after removing GC from cultures at 3D of culture, and displayed triangular or circular subpopulations after 1–3 passages at 6D. Finally, distinct SC clusters were observed as cells became more confluent at 10D. Non-adherent SSC with a circular morphology were kept in suspension for 2D, and a population of SSC adherent with an irregular and cuboidal morphology appeared and formed colonies at 5D of culture. SSC proliferated quickly, and then they detached and floated at 7D. (B) In 3D SACS, SSC formed large colonies on day 21, PB-MSC and SC lost the elongated fibroblastoid appearance to a circular or cuboidal shape. During culture in 3D SACS, round colonies that increased in size and number could be observed in the SSC+SC and PB-MSC+SC co-cultures.
Animals 13 00318 g001
Figure 2. Expression of cell specific markers in single cultures of bull PB-MSC, SSC with SC. (A) Gene expression levels of SC markers WT1 and RA were higher (p < 0.05) in SC and WT1 and were not detected in SSC or MSC. Gene expression of SSC gene marker UCHL1 was higher (p < 0.05) in SSC. CD90 gene expression was only expressed in SSC. Levels of MSC CD73 gene marker were similar (p > 0.05) between SC and MSC and were not detected in SSC. CD105 gene marker had higher expression (p < 0.05) in MSC compared to SC. CD45 gene marker had higher expression (p < 0.05) in SC comparing with SSC and MSC, whereas CD34 gene had higher expression (p < 0.05) in SSC compared to SC and MSC. (B) Immunofluorescence associated to UCHL1 was observed in SSC. (C) Intense, Wt1 immunofluorescence was observed in SC. (D) Immunofluorescence associated to CD73 was observed in MSC. (*) Indicate gene expression was not detected for a single marker. Different superscripts (a, b, c) indicate differences (p < 0.05) for the same marker between cell types.
Animals 13 00318 g002
Figure 3. Expression of pluripotency markers NANOG, OCT4 and SOX2 in single cultures and co-cultures of PB-MSC and SSC with SC in 3D SACS for 21 days. (A) Expression levels of NANOG were similar (p > 0.05) in SSC+SC co-culture compared to SC single culture on day 14. (B) Co-culture of PB-MSC+SC up-regulated OCT4 gene expression on day 7 compared to SC and PB-MSC single cultures. (C) SOX2 gene expression was detected in SC on day 7 and on day 14 in co-cultures of SSC+SC. (D) More intense immunofluorescence associated to NANOG was observed in SSC+SC co-cultures at day 14. (E) Similarly, more intense immunofluorescence associated to OCT4 was observed in SSC+SC co-cultures at day 14. (*) Indicate gene expression was not detected in a single sampling day. Different superscripts (a, b, c) indicate significant differences (p < 0.05) for the same marker between cell types and (1,2) for the same marker between culture days.
Animals 13 00318 g003
Figure 4. Expression of GC markers DAZL and PIWIL2 in single cultures and co-cultures of bull PB-MSC, SSC with SC in 3D SACS for 21 days. (A) MSC+SC co-culture up-regulated (p < 0.05) DAZL gene expression on day 14, while SSC+SC co-culture up-regulated (p < 0.05) DAZL gene expression on day 21. (B) PIWIL2 relative expression was higher (p < 0.05) in MSC+SC and SSC+SC co-cultures at day 14. At day 21 the relative expression of PIWIL2 was higher (p < 0.05) in MSC+SC co-culture. (C) Intense immunofluorescence associated to DAZL was observed in SSC and PB-MSC single cultures and SSC+SC and MSC+SC co-cultures at day 14. (D) PIWIL2 was immunodetected in PB-MSC+SC and SSC+SC co-cultures at day 14. (*) Indicate gene expression was not detected in a single sampling day. Different superscripts (a, b, c) indicate differences (p < 0.05) for the same marker between cell types and (1,2) for the same marker between culture days.
Animals 13 00318 g004
Figure 5. Expression of GC markers STELLA, FRAGILIS and STRA8 in single cultures and co-cultures of bull PB-MSC, SSC with SC in 3D SACS for 21 days. (AC) Higher expression of STELLA was detected on days 7 and 14 in co-cultures of SSC+SC compared to SSC. (B) Expression levels of FRAGILIS expression were higher (p < 0.05) in SSC+SC co-cultures compared to SC on days 7 and 14. (C) STRA8 gene expression was only detected in SSC+SC co-culture on day 14. (D) Immunofluorescence associated to STELLA was observed in SSC and SSC+SC co-culture at day 14. (E) STRA8 immunofluorescence was observed in SSC+SC co-culture at day 14. (*) Indicate gene expression was not detected in a single sampling day. Different superscripts (a, b) indicate differences (p < 0.05) for the same marker between cell types and (1,2) for the same marker between culture days.
Animals 13 00318 g005
Figure 6. Expression of MSC markers CD73 and CD105 in single cultures and co-cultures of bull PB-MSC with SC in 3D SACS for 21 days. (A) MSC+SC co-culture down-regulated (p < 0.05) CD73 gene expression on day 14. (B) CD105 gene expression was down-regulated (p < 0.05) in the PB-MSC+SC on day 14 compared to PB-MSC. CD105 gene expression was not detected in any culture at day 21. (*) Indicate gene expression was not detected in a single sampling day. Different superscripts (a, b, c) indicate differences (p < 0.05) for the same marker between cell types and (1,2,3) for the same marker between days of culture.
Animals 13 00318 g006
Table 1. Sequence of primers used for Q-PCR analysis.
GeneNucleotide Sequence (5′-3′)Access Number
ForwardReverse
Housekeeping genes
β-ACTINACGCACCACTGGCATTGTCATTCCAAGGCGACGTAGCAGAGNM_173979.3
GAPDHCCTTCATTGACCTTCACTACATGGTCTATGGAAGATGGTGATGGCCTTTCCATTGNM_001034034.2
Mesenchymal stem cell genes
CD73TGGTCCAGGCCTATGCTTTTGGGGATGCTGCTGTTGAGAAGAANM_174129.3
CD105CGGACAGTGACCGTGAAGTTGTGTTGTGGTTGGCCTCGATTANM_00107639.1
Hematopoietic cell genes
CD34CATGCCGTCTTAACCCATCTCGGTCTACAGAGGTGGTGGTNM_174009.1
CD45CCACGGGTATTCAGCAAGTTCCCAGATCATCCTCCAGAAANM_001206523
Sertoli cell genes
WT1CGTGCGTACCATGTAGGGAACTCGTGCTTGAAGGAGTGGTXM_015474834.2
ARCAGATGGCAGTCATTCAGCTTGGTGAGCTGGTAGAAGXM_001244127
Spermatogonial stem cell genes
UCHL1AGAAGCAGCATCTCGGTTCCCGTGGTTGAGGGTAAGTGCTNM_001046172.2
CD90ACTCATACCGCTCCCGAACCACATGTGTATGTCCCCTCGTCCTTNM_001034765
Germ cell genes
DAZLTCCAAGTTCACCAGTTCAGGCGT CTG TAT GCT TCT GTC CACNM_001081725.1
STRA8TGTGCCCAGGTGTTCATCTCGGGGACTGTCACCTCATTGGXM_015463130
PIWIL2TCGTATTGATGATGTGGATTGGGGGAGCAGCAGGATTTCACXM_617223.3
FRAGILISATCTGCAGCGAGACCTCTGTCCGATGGACATGATGATGAGXM_002697323
STELLATGCAAGTTGCCACTCAACTCTCTTACCCCTCTCCGCCTATNM_00111110
SCP3CTAGAATTGTTCAGAGCCAGAGGTTCAAGTTCTTTCTTCAAAGNM_001040588.2
VASATGCTACTCCTGGAAGACTGACGGTCTGCTGAACATCTCTANM_001007819.1
Pluripotency genes
OCT4GAAAGAGAAAGCGGACGAGGTGAAAGGAGACCCAGCAGNM_174580.2
NANOGTAAGCACAGGGGGCAAAAGTATGGCTAAAAGGGGTGGAGGNM_001025344.1
SOX2CCCGTGGTTACCTCTTCTTCCCGCTCTGCTAGTGCTGGGACNM_001105463.2
Table 2. Gene expression pattern of mesenchymal, pluripotency, GC and male GC genes in bull co-cultures of PB-MSC and SSC with SC in 3D SACS at day 14 compared to single cultures of MSC, SC and SSC.
GenePB-MSC+SCSSC+SC
CD73↓ (Q-PCR)-
CD105↓ (Q-PCR)-
DAZL↑ (Q-PCR) *(IF)↑(Q-PCR) *(IF)
STRA8x (Q-PCR)+ (Q-PCR) *(IF)
PIWIL2↑ (Q-PCR) *(IF)↑ (Q-PCR) *(IF)
FRAGILISx (Q-PCR)< (Q-PCR)
STELLAx (Q-PCR)< (Q-PCR) *(IF)
OCT4x (Q-PCR) *(IF)→ (Q-PCR) *(IF)
NANOGx (Q-PCR)→ (Q-PCR) *(IF)
SOX2x (Q-PCR)+ (Q-PCR)
SCP3x (Q-PCR)x (Q-PCR)
VASAx (Q-PCR)x (Q-PCR)
Abbreviations: +, Activated expression; →, No change in expression; ↑, Increased expression; ↓, Decreased expression; x, No expression detected; - Not evaluated; *, Immunodetected; Q-PCR, Quantitative PCR; IF, Immunofluorescence.
Disclaimer/Publisher’s Note: The statements, opinions and data contained in all publications are solely those of the individual author(s) and contributor(s) and not of MDPI and/or the editor(s). MDPI and/or the editor(s) disclaim responsibility for any injury to people or property resulting from any ideas, methods, instructions or products referred to in the content.

