Article

Effects of Dietary Supplementation with Honeybee Pollen and Its Supercritical Fluid Extract on Immune Response and Fillet’s Quality of Farmed Gilthead Seabream (Sparus aurata)

by
Rosaria Arena
1,
Adja Cristina Lira de Medeiros
2,
Giulia Secci
2,
Simone Mancini
3,
Simona Manuguerra
1,
Fulvia Bovera
4,
Andrea Santulli
1,5,
Giuliana Parisi
2,*,
Concetta Maria Messina
1,† and
Giovanni Piccolo
4,†
1
Laboratory of Marine Biochemistry and Ecotoxicology, Department of Earth and Sea Sciences-DiSTeM, University of Palermo, Via Barlotta 4, 91100 Trapani, Italy
2
Department of Agriculture, Food, Environment and Forestry-DAGRI, University of Firenze, Via Delle Cascine 5, 50144 Firenze, Italy
3
Department of Veterinary Sciences, University of Pisa, Viale Delle Piagge 2, 56124 Pisa, Italy
4
Department of Veterinary Medicine and Animal Production, University of Napoli Federico II, Via Delpino 1, 80137 Napoli, Italy
5
Institute of Marine Biology, University Consortium of the Province of Trapani, Via Barlotta 4, 91100 Trapani, Italy
*
Author to whom correspondence should be addressed.
These authors contributed equally to this work.
Animals 2022, 12(6), 675; https://doi.org/10.3390/ani12060675
Submission received: 28 December 2021 / Revised: 16 February 2022 / Accepted: 4 March 2022 / Published: 8 March 2022

Abstract

:

Simple Summary

In aquaculture, the aspect of nutrition is essential for fish health, quality of the products and side effects on economic profitability. In recent years, the interest on natural compounds, as fish health promoters, is exponentially increasing and this is going to support the development of new and balanced commercial diets for aquaculture. Honeybee pollen (HBP) is a good source of bioactive compounds that have demonstrated to have significant beneficial effects on immunity responses in farmed species. The aim of this study was to investigate the effects of HBP and its extract on some parameters related to the immune response and quality, in farmed gilthead seabream (Sparus aurata). Isoenergetic and isoproteic diets were formulated as follows: a control diet (CTR); two diets containing 5% (P5) and 10% (P10) of HBP inclusion; two diets containing HBP extract, obtained by supercritical fluid extraction (SFE) (HBP_SFE), at 0.5% (E0.5) and at 1% (E1). The results demonstrated that the diet E1 improved both fish health-related parameters while not impairing fillets quality, suggesting that this level of supplementation could be suitable for gilthead seabream inflammatory responses.

Abstract

The awareness of the correlation between administered diet, fish health and products’ quality has led to the increase in the research for innovative and functional feed ingredients. Herein, a plant-derived product rich in bioactive compounds, such as honeybee pollen (HBP), was included as raw (HBP) and as Supercritical Fluid Extracted (SFE) pollen (HBP_SFE) in the diet for gilthead seabream (Sparus aurata). The experiment was carried out on 90 fish with an average body weight of 294.7 ± 12.8 g, divided into five groups, according to the administration of five diets for 30 days: control diet (CTR); two diets containing HBP at 5% (P5) and at 10% (P10) level of inclusion; two diets containing HBP_SFE, at 0.5% (E0.5) and at 1% (E1) level of inclusion. Their effects were evaluated on 60 specimens (336.2 ± 11.4 g average final body weight) considering the fish growth, the expression of some hepatic genes involved in the inflammatory response (il-1β, il-6 and il-8) through quantitative real-time PCR, and physico-chemical characterization (namely color, texture, water holding capacity, fatty acid profile and lipid peroxidation) of the fish fillets monitored at the beginning (day 0) and after 110 days of storage at −20 °C. The results obtained showed that the treatment with diet E1 determined the up-regulation of il-1β, il-6, and il-8 (p < 0.05); however, this supplementation did not significantly contribute to limiting the oxidative stress. Nevertheless, no detrimental effect on color and the other physical characteristics was observed. These results suggest that a low level of HBP_SFE could be potentially utilized in aquaculture as an immunostimulant more than an antioxidant, but further investigation is necessary.

1. Introduction

It is well known that in aquaculture, an optimal nutritional status is essential for fish welfare, quality and economic production [1], and for these reasons the interest in new and balanced commercial diets has grown significantly in recent years [1,2]. Supplementation with natural compounds has proved to be a useful tool to improve health production in the aquaculture industry [3] by minimizing the risk and side effects of synthetic products [4] and obtaining safe products intended for human consumption [5]. In particular, special emphasis has been given to bioactive molecules, plant or medicinal herb derived-products which could improve health status, innate and adaptive immune responses as well as increase the disease resistance in various fish species [6,7,8]. Furthermore, while acting as anti-stress and anti-infection agents, the use of some plant products in fish diets can promote other positive effects, such as improving growth, weight gain, appetite stimulation, and the early maturation of cultured species [8,9].
Dietary intervention with natural extracts, essential oils, and plant by-products was studied even to enhance meat quality and stability during storage, according to the consumer’s demand for “natural animal feeding”. A valuable example was recently proposed by Santos and colleagues [10], who found out that an essential oil blend, administrated to rainbow trout, asserted specific protection against lipid and protein oxidation of fish fillets stored at –10 °C for 6 months [10]. Besides, gilthead sea bream (Sparus aurata) shelf life was increased by supplementing the diet with thymol due to the reduction of spoilage and lipid oxidation damages [11].
Among others, honeybee pollen (HBP) is a plant-derived product considered an important functional food for human consumption due to its potential source of energy. In fact, HBP is defined as the “only perfectly complete food” [12], as it contains amino acids, antioxidants, minerals, vitamins and lipids [8,13,14,15], which promote health. In addition, HBP has a high antioxidant capacity [8,12,15], due to the presence of phenolic compounds [8,15,16] that are able to inactivate free radicals or to prevent their production [17], being useful in the prevention of oxidative-stress related diseases [12]. Recently, the beneficial effect of dietary supplementation with bee pollen was observed in the immune response of zebrafish [18], and also in the quality of rainbow trout fillet [19].
It has been observed that zebrafish fed with a bee pollen-added diet showed changes in the expression of immunity-related genes with improvement in the immune response [18], and characteristics of fillet [19]. Other studies tested bee pollen in animal diets also demonstrating biological effects and nutritional functions positive for growth performance [19,20,21,22,23], immunity [8,22,23,24], intestinal function [23,25,26], reproductive traits [20,22] and/or meat fish color and quality [19,23]. However, negative effects of dietary HBP were highlighted in meagre (Argyrosomus regius) [15], probably because pollen can be a source of various anti-nutritional compounds and indigestible fractions. These components could be possibly eliminated using supercritical fluid extraction (SFE) [13].
Supercritical fluids are highly compressed fluids that combine the properties of gases and liquids; they possess better transport properties than liquids by diffusing more easily through solid materials, which accelerate the extraction yields. Carbon dioxide (CO2) is one of the most commonly used solvents, which has a critical temperature and pressure of 31.3 °C and 72.9 atm, respectively. Once extraction is complete and the system decompressed, the CO2, being a gas at room temperature, is removed and a solvent-free extract is obtained [27]. For this reason, this method is considered a green technique, as it uses less toxic organic solvents when compared to traditional extraction methods [8,27,28]. Moreover, SFE allows obtaining bioactive compounds with a high content of polyphenols and antioxidant activity offering greater selectivity [8,29].
Therefore, the aim of the present study was to evaluate the effect of the inclusion of raw HBP and Supercritical Fluid Extract (SFE) of pollen (HBP_SFE) on the immune response and quality parameters of gilthead seabream (Sparus aurata). Among the immune-related parameters, we focused on the expression of some hepatic genes involved in the inflammatory response, such as il-1β, il-6 and il-8. As quality parameters, in fillets, both sensorial, nutritional and antioxidant parameters were considered, to evaluate the effects of the inclusion of the HBP on the final product characteristics. The fillet antioxidant capacity (via ABTS and DPPH) and the oxidative status (by measuring conjugated dienes and malondialdehyde equivalents) were also analyzed to complete the assessment of the primary and secondary oxidation products, respectively, related to the final product safety and security.

2. Materials and Methods

2.1. Ethical Statement and Experimental Diets

The trial was authorized by the Ministry of Health (authorization No. 651/2017-PR, issued based on Directive 2010/63/EU) and was approved by the Ethics Committee of the Federico II University of Naples (Italy). The experimental procedures of gilthead seabream were carried out at the Department of Veterinary Medicine and Animal Production—University of Naples Federico II (Naples, Italy). The results presented in this article are part of a wider series of studies on the use of HBP in fish species whose results have been already published. In particular, part of the materials and methods and the preliminary results of this trial have been reported in Messina et al. [8]. The diets were formulated to meet nutrient requirements of gilthead seabream [30,31]. Their ingredients and chemical composition have been already reported in Messina et al. [8]. Briefly, the control diet contained soybean meal (240.0 g/kg), fish meal (210.0 g/kg), corn gluten meal (190.0 g/kg), fish oil (160.0 g/kg), gelatinized starch (100.0 g/kg), wheat gluten (80.0 g/kg), mineral mix (10.0 g/kg), and vitamins mix (10.0 g/kg).
To evaluate the influence of HBP in gilthead seabream performance, the diets were isoenergetic (21.5 MJ/kg on average) and isoproteic (39.3% crude protein on average) and formulated as follows: control diet (CTR), without HBP and HBP_SFE; two diets in which HBP was included at 5% (P5) and at 10% (P10); two diets in which HBP_SFE was included at 0.5% (E0.5) and at 1% (E1). The two pollen and extract inclusion levels were chosen based on previous research and in order to have the same total polyphenol content both in P5 and P10 diets and in E0.5 and E1 diets, according to the HBP extraction yield and the extract phenol content as determined by Messina et al. [8]. The chemical composition of the experimental diets is reported in Table 1. All the diets were prepared at the laboratories of the Department of Veterinary Medicine and Animal Production, University of Naples Federico II (Naples, Italy). The HBP was finely chopped, mixed with 10 mL of water to create a paste, then mixed in fish oil and incorporated into the mixture. The HBP_SFE was provided by the Laboratory of Marine Biochemistry and Ecotoxicology, University of Palermo (Italy), under the procedure previously detailed [8]. For E0.5 and E1 diets, the extract was dissolved initially in 10 mL of fish oil, and then incorporated into the mixture. Before the final mixing, all ingredients were ground through a 0.5 mm sieve, then water was added, and the mixture was pelleted through a 3 mm dye, using a meat-grinder (Bosch mod. MFW68660, Stuttgart, Germany). The diets were dried in a ventilated oven at a temperature of 40 °C for 24 h. This temperature was chosen as it is like the temperature maintained in the hive (34.6 °C on average) to preserve the pollen quality. The feeds were stored at 4 °C until use.

2.2. Fish Rearing and Sampling

The gilthead seabream specimens (n = 90; 294.7 ± 12.8 g initial body weight), normally fed, were obtained from a local farm and randomly allocated to 15 fiberglass tanks with a capacity of 220 L (6 fish per tank, 3 tanks per diet). The fish were kept for 15 days under the experimental conditions, for adaptation to the new conditions. The tanks were equipped with a biological filter, mechanical sand filter and UV ray system for water sterilization. Furthermore, water quality parameters were: temperature 22 ± 0.5 °C, salinity 33 ± 2.0 g/L, dissolved oxygen 6.5 ± 1.1 mg/L, pH 7.9 ± 0.5, total ammonia nitrogen < 0.3 mg/L, nitrite < 0.01 mg/L, and nitrate < 38 mg/L and a dark:light cycle of 12:12 h. After 30 days, a total of 12 gilthead seabream per dietary treatment (336.2 ± 11.4 g average final body weight) were sampled after a 24-h fast, anesthetized by MS-222 (tricaine methane sulfonate) (250 mg/L) and dissected in cold conditions. Biopsies were collected from the liver (approximately 300 mg), immediately preserved under PUREzol Reagent (Bio-Rad, Hercules, CA, USA) at −80 °C, and subsequently analyzed at the Laboratory of Marine Biochemistry and Ecotoxicology, University of Palermo (Palermo, Italy). The fillets (n = 120) were preserved and covered by ice and sent, in polystyrene containers, to the Animal Science Section of the Department of Agriculture, Food, Environment and Forestry (DAGRI) of the University of Florence (Florence, Italy), for the analyses scheduled.

2.3. Gene Expression and Quantitative Real Time Determination

The total RNA was extracted from the liver by 1 mL PUREzol Reagent (Bio-Rad, Hercules, CA, USA) [32], and the concentration was assessed by spectrophotometer at 260 nm. The absorbance ratios A260/A280 and A260/A230 were used as indicators of RNA purity. Then, 1 µg of RNA was reverse transcribed for each sample, in a volume of 20 µL, by the 5X iScript Reaction Mix Kit (Bio-Rad, Hercules, CA, USA) according to manufacturer’s instructions. The amplification was performed in a total volume of 20 µL, containing 0.4 µmol/L of each primer, 1:10 (v/v) cDNA, 1X IQ SYBR Green Supermix (Bio-Rad, Hercules, CA, USA) and nuclease-free water. Conditions for real-time PCRs were optimized in a gradient cycler (C1000 Touch Thermal Cycler, Bio-Rad, Hercules, CA, USA) using the following run protocol: an initial activation step at 95 °C for 3 min, followed by 39 cycles of 95 °C for 10 s and 60 °C for 30 s, with a single fluorescence measurement. The melting curve program was achieved at 65–95 °C, with a heating rate of 0.5 °C/cycle and continuous fluorescence measurement. All reactions were performed in triplicate. The relative quantification of interleukin 1 beta (il-1β), interleukin 6 (il-6), interleukin 8 (il-8) gene expression was evaluated after normalization with the reference genes. Data processing and statistical analysis were performed using CFX Manager Software (Bio-Rad, Hercules, CA, USA). The primers are shown in Table 2. The relative expression of all genes was calculated by the 2−ΔΔCT method [33], using S. aurata 18S and ef1α as the endogenous reference.

2.4. Fish Sampling and Processing

Analyses of gilthead seabream fillets fed with the experimental diets were carried out at two times: at the beginning of the storage (day 0) and after 110 days of storage at −20 °C (day 110). At day 0, all the fish were weighed, gutted and filleted. The right fillets were allotted to the analyses at day 0, while the left fillets were immediately frozen at −20 °C and then stored until day 110. Irrespective of sampling time, all the fillets were subdued to the analyses of physical and chemical parameters hereafter described.

2.5. Analyses of Physical Parameters

The fillet pH, color, texture, and water holding capacity (WHC) were analyzed. Fillet pH and color values were measured on triplicate positions (cranial, medial, and caudal) through a pH-meter SevenGo SG2™ (Mettler-Toledo, Schwerzenbach, Switzerland) and a Minolta CR-200 Chroma Meter (Konica Minolta, Chiyoda, Japan), respectively. The color parameters were recorded as L* (lightness), a* (redness index) and b* (yellowness index) values following the CIELab system [34]. Texture was assessed as the maximum shear force value obtained utilizing the Warner-Bratzler shear blade (width of 7 cm) by a Zwick Roell® 109 texturometer (Zwick Roell, Ulm, Germany), equipped with a 1 kN load cell, setting the crosshead speed at 30 mm/min. Afterwards, fillets were skinned, homogenized, and utilized to determine WHC and chemical composition. The water retention capacity of the fillets at days 0 and 110 was determined by calculating, as a percentage, the loss of water after centrifugation following the method of Eide et al. [35] as modified by Hultmann and Rustad [36].

2.6. Analyses of Chemical Parameters

2.6.1. Moisture, Total Lipids, and Fatty Acid Composition of Fillets

The moisture of minced flesh was determined in accordance with AOAC method [37]. The total lipids were obtained according to Folch et al. [38] method, then they were gravimetrically quantified. The fatty acids (FAs) were determined in the lipid extract after trans-esterification to methyl esters (FAME), using a base-catalyzed trans-esterification [39]. The FA composition was determined by gas chromatography (GC) using a Varian GC 430 gas chromatograph (Varian Inc., Palo Alto, CA, USA), equipped with a flame ionization detector (FID) and a Supelco Omegawax™ 320 m capillary column (Supelco, Bellefonte, PA, USA). The GC conditions were recovered from Secci et al. [40]. Chromatograms were recorded with the Galaxie Chromatography Data System 1.9.302.952 (Varian Inc., Palo Alto, CA, USA). FAs were identified by comparing the FAME retention time with those of the Supelco 37 component FAME mix standard (Supelco, Bellefonte, PA, USA) and quantified through calibration curves, using tricosanoic acid (C23:0) (Supelco, Bellefonte, PA, USA) as internal standard.

2.6.2. Fatty Acid Composition of HBP and HBP_SFE

FAME was determined from the total lipid content [38] according to the method described by Lepage and Roy [41] and analyzed using the conditions described by Messina et al. [42], employing a Perkin Elmer (Waltham, MA, USA) Clarus 580 instrument, equipped using a silica capillary column (30 m × 0.32 mm, df 0.25 μm; Omegawax 320, Supelco, Bellefonte, PA, USA). Individual FAMEs were identified by comparison of known standards (mix of polyunsaturated fatty acids (PUFA) 1, PUFA 2 and PUFA 3 mixed oil; Supelco, Bellefonte, PA, USA). The FA composition of HBP and HBP_SFE is shown in Table S1. Briefly, the predominant class of FAs in both samples was the PUFA, representing more than 60% of the total FAs. The α-linolenic acid (C18:3n-3, 42.86 ± 1.20% in HBP and 43.53 ± 0.48% in HBP_SFE) was the main PUFA present in both samples. SFA was the second FA class in order of abundance (about 27%) and its main component was the palmitic acid (C16:0, 24.82 ± 0.06% in HBP and 24.51 ± 0.20% in HBP_SFE). MUFA content was the lowest in both samples, accounting less than 12% of the total FAs.

2.6.3. Fillet Oxidative Status

Primary and secondary oxidation products were measured as conjugated dienes (CD) and thiobarbituric acid reactive substances (TBARS), respectively, according to the spectrophotometric methods [43,44]. The results were expressed as mmol hydroperoxides (mmol Hp/100 g fillet) and malondialdehyde equivalents (mg MDA-eq./kg fillet) for CD and TBARS, respectively.

2.6.4. Antioxidant Capacity

The antioxidant capacity of the gilthead seabream fillets was determined by ABTS [2,2-azino-bis acid (3-ethylbenzothiazole n-6-sulphonic acid)] and DPPH (2,2-diphenyl-1-picrylhydrazyl) assays. Samples (3 g) were extracted with 10 mL of ethanol and the ethanol extracted samples were analyzed for ABTS reducing activity assay according to Re et al. [45] and for DPPH scavenging activity according to Blois [46] method modified by Mancini et al. [47]. Results were expressed as mmol eq Trolox/kg.

2.7. Statistical Analysis

The data related to the gene expression were analyzed by a one-way ANOVA where the experimental treatment (diets: CTR, P5, P10, E0.5, E1) was the fixed effect. The data of fillets quality parameters were processed by a two-way ANOVA, using the PROC GLM of SAS [48] following the model:
Yij = μ + τi + βj + γij + ϵijk
where μ is the overall mean response, τi is the effect due to the i-th Treatment (T: CTR, P5, P10, E0.5, and E1), βj is the effect due to the j-th level of storage time (S, two levels: day 0, and day 110), γij is the effect due to any interaction between the T and S, ϵ is the error.
The differences between the treatment means were identified using Tukey’s test at p < 0.05 [48].

3. Results

The main growth performance of the fish (Table S2) did not show significant differences among groups, even if the diet with greater inclusion of raw pollen (P10) resulted in tendentially worsened performance.

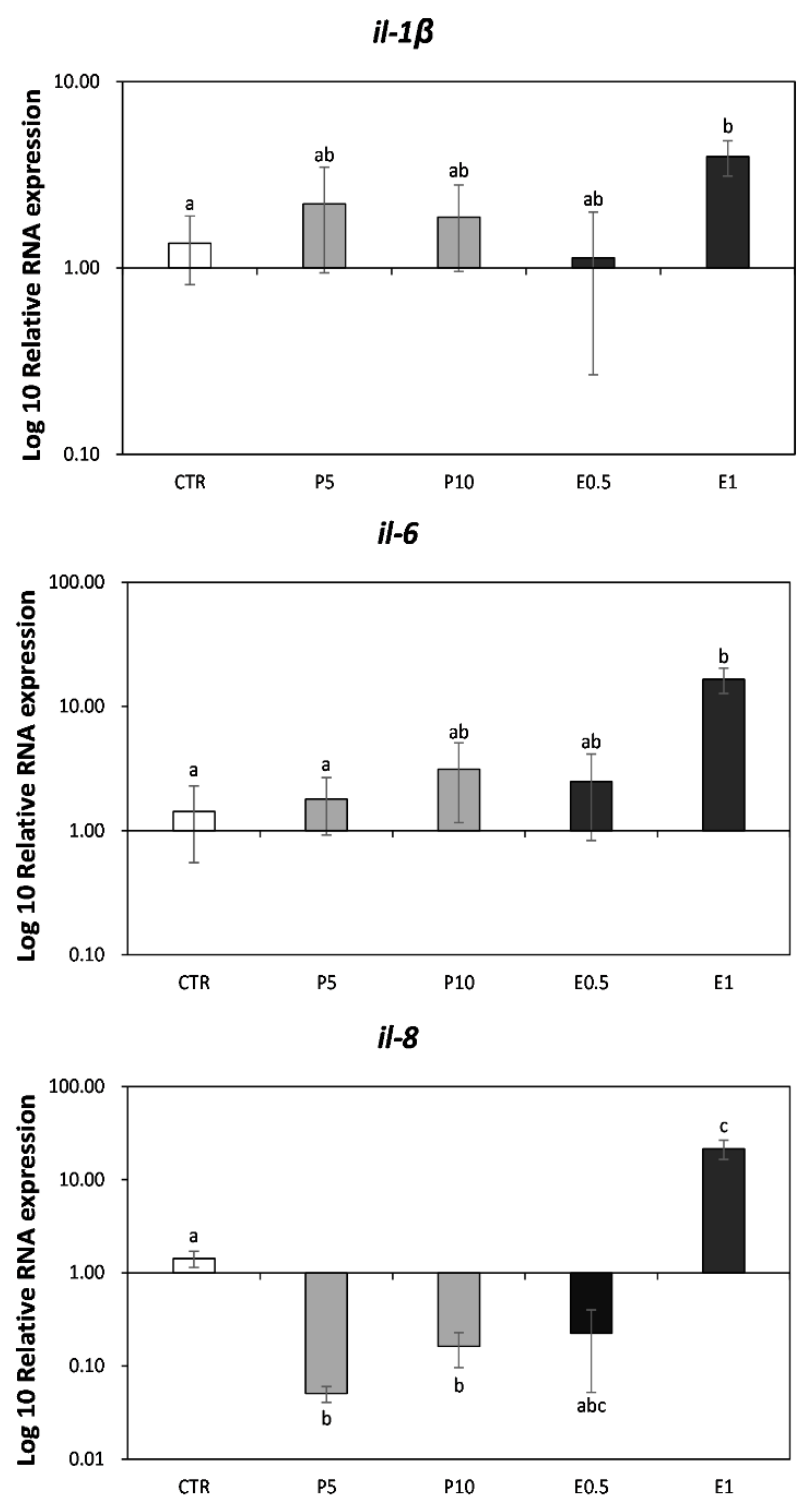
3.1. Gene Expression on Seabream Liver

The expression of some markers related to immunity was analyzed in seabream liver fed the different diets for one month (Figure 1). In specimens fed E1 diet, the relative expression of il-1β, il-6 and il-8 genes was significantly up-regulated compared to CTR (p < 0.05) fish, while fish fed P5 and P10 showed a down-regulation of il-8 gene compared to the CTR ones (p < 0.05).

3.2. Fillet Physical Parameters

The physical characteristics of the fillets (Table 3) were not significantly (p > 0.05) affected by the diet treatments, but they were significantly (p < 0.05) affected by the frozen storage. Regarding fillet weight, it was not influenced by either diet or freezing, ranging from 67.12 g (E0.5) to 74.91 g (CTR).
According to Minolta color measurements, the L*, a* and b* values were not affected (p > 0.05) by the diets. Instead, the frozen storage affected (p < 0.05) the fillet color by increasing the lightness (L*; p < 0.0001) and yellowness index (b*; p = 0.0072) and decreasing the redness one (a*; p < 0.0001).
At day 0, the fillet pH was slightly lower (p = 0.0003) than the one recorded at the end of the storage period.
Concerning the WHC, it was pronouncedly higher (p < 0.0001) in day 0 fillets compared with the fillets analyzed at day 110.
Despite the shear force not resulting in a statistical difference (p = 0.36) among the experimental groups, the p-value (0.064) revealed that the shear force tended to increase, after a period of 110 days of frozen storage.

3.3. Fillet Chemical Parameters

3.3.1. Chemical and Fatty Acid Composition

Table 4 shows the results of the chemical composition and FA profile of the gilthead seabream fillets. The moisture of the fillets did not differ between the dietary groups (p = 0.788) whilst it was deeply reduced (p < 0.0001) by the storage. Even the total lipid content was not affected (p = 0.841) by the HBP inclusion in the diets but was reduced (p = 0.0026) after the storage period.
Oleic (C18:1n-9), linoleic (C18:2n-6, LA) and palmitic (C16:0) acids were the major FAs in all the groups, representing on average 32.31%, 22.04% and 12.41% in the dietary treatments, respectively. Overall, monounsaturated fatty acids (MUFAs) were abundantly present in all the dietary treatments (from 42.13 to 42.66%) and were not affected by the diets (p = 0.396). The second most abundant FA group was the n-6 PUFA, ranging from 23.75 to 24.12%, which was also not affected by the diets (p = 0.722). While saturated fatty acids (SFA) and n-3 PUFAs were not affected by the diets (p = 0.399), they were after the storage period of 110 days that increased the SFA content and decreased the n-3 PUFA (p = 0.002) one. The α-linolenic (C18:3n-3, ALA) and the eicosenoic (C20:1n-9) acids were affected both by the diets and by the frozen storage. At the beginning of the storage, the E1 fillets presented the highest value of ALA, while the highest values of C20:1n-9 were found in both the P5 and E1 fillets. The incidences of DHA (C22:6n-3) and EPA (C20:5n-3) were not affected (p > 0.05) by the diets nor by the storage period.

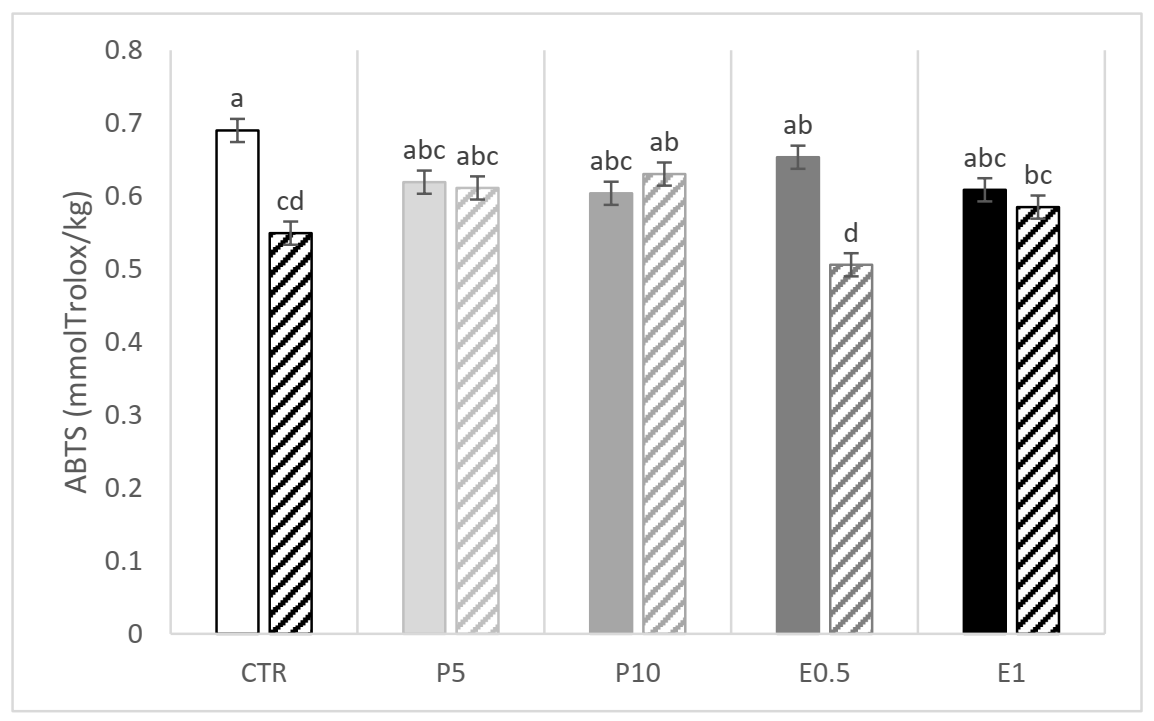
3.3.2. Fillet Oxidative Status

The results of fillet lipid oxidation (Table 5) revealed that the diets and the storage did not significantly affect (p = 0.628 and p = 0.322, respectively) the CD content of the fillets. Instead, the degree of lipid oxidation, in terms of TBARS, was not affected by the dietary treatments (p = 0.409) whilst it was deeply affected (p < 0.0001) by the storage, with values increased after 110 days of storage.
A significant interaction between the dietary treatment and the storage emerged for ABTS and DPPH (Figure 2 and Figure 3, respectively). The E0.5 fillets at day 110 presented the lowest values of ABTS while the E1 fillets presented the highest and the lowest values of DPPH at day 0 and 110, respectively. The CTR fillets were affected in terms of DPPH value (Figure 3). Of note, in the five groups of fillets coming from differently fed gilthead seabream, the storage period at low temperatures (−20 °C) resulted in a decrease in the values of both parameters (ABTS and DPPH) compared to the values obtained for day 0.

4. Discussion

The quantity of pollen ingested by the fish in this trial calculated from the feed ingestion (see Supplementary Material) was 0.9 g/kg of average body weight per day and 0.43 g/kg of average body weight per day for P10 and P5 diet, respectively. Growth performance of the fish did not show significant differences among groups, even if the diet with greater inclusion of raw HBP resulted in tendentially worsened performance. This seemed to confirm what was already observed by Panettieri et al. [15] where raw HBP-containing diets were offered to meagre juveniles impairing growth performance indexes and nutrient digestibility as the level of HBP in the diet increased. The authors also found alterations of medium intestine histology, immunohistochemistry, blood biochemical parameters and hepatic biomolecular markers, following the same trend. The authors attributed these negative effects to the ultrastructure of the bee pollen grains walls that makes the bioactive substances unavailable and can irritate the intestine of carnivorous fish [13]. These unfavorable events can be overcome by extraction procedures that make the bioactive components available to the fish while at the same time discarding the outermost layer composed of neutral lipids, hydrocarbons, terpenoids and carotenoid pigments and reinforced inside by exine, a matrix of complex carbohydrate, sporopollenin that greatly resists to monogastric digestion [8].
Bioactive compounds by HBE, such as essential amino acids, fatty acids, vitamins and flavonoids, improve immune response [49]. It has been shown that peony flower extract could increase physiological, anti-aging and antioxidant activity by improving immune response in fish [50,51]. Although immunostimulatory properties have been proposed for bee pollen in several species, the effect of dietary supplementation with HBP_SFE on immune response and fillet quality has not been previously described. In a recent study, Ren et al. [23] observed that peony pollen diet supplement significantly promoted the growth performance, improved intestinal health and digestive enzymes activity of common carp (Cyprinus carpio). Furthermore, they suggested that the use of peony pollen could improve the fish health status by increasing highly unsaturated fatty acids (HUFA) content, improving intestinal health, elevating immune responses and antioxidant capacity of common carp organs [23]. In the present study, the inclusion of bee pollen in the S. aurata diet affected the levels of some markers related to the immunity of fish and some quality parameters of fillets. Among immune-related gene expression, il-1β, il-6 and il-8 were selected because they are related to inflammatory processes. In teleost, il-1β is probably the most widely studied of the known cytokines, and has been characterized in a number of fish species [52]. The il-1β has been found to be regulated in response to various stimuli and the biological activity of recombinant il-1β (ril-1β) has been studied in several fish species indicating that fish il-1β is involved in the regulation of immune relevant genes, lymphocyte activation, migration of leucocytes, phagocytosis and bactericidal activities [53,54,55]. The important pleiotropic cytokine il-6 plays an essential role in mediating innate and adaptive immune responses [56]. The first il-6 sequence identified in teleost was reported in fugu (Takifugu rubripes) [57] and further characterized in other fish species such as flounder (Paralichthys olivaceus) [58] and gilthead seabream (Sparus aurata) [59]. The il-8 is a well-recognized pro-inflammatory chemokine that attracts neutrophils and other leukocytes, promoting their recruitment to sites of inflammation [60]. In fish fed both diets supplemented with P5 or P10, results showed some inhibitory effects in the immune system, such as the downregulation in the il-8 expression from the liver. The decrement of il-8 expression could be understood as a decrease in the immune response that could entail susceptibilities to pathogens. In fact, il-8 downregulation observed in the present study may partially be attributed to the inhibiting effects of pollen on the phosphorylation of inhibitor kappa B protein and mitogen-activated protein kinases [61,62]. Our previous paper attested a decrease of serum peroxidase and lysozyme activities, suggesting that the inclusion of 5% or 10% of bee pollen in the diet of seabream may impair the defense capacity [8].
In addition, a diet supplemented with the highest concentration of bee pollen extract (E1) induced the up-regulation in all the studied genes in the liver, i.e., il-1β, il-6, and il-8. These results indicate that the pollen extract activated the seabream immune system, according to previous studies in which the immunostimulant efficacy of plants, certain parts of the same, or even their extracts used in feeding tests on fish has been demonstrated [63,64,65,66,67]. Messina et al. [8] demonstrated that diets supplemented with SFE bee pollen extract had a stimulating effect on fish serum immunity compared with the inclusion of raw pollen in agreement with our results.
As consumers are increasingly interested in food products associated with animal welfare and concerned with general quality, many studies are working with a multidisciplinary approach to evaluate the effects of new additives that fit these new market demands. For fish fillets or meat in general, one of the most perceivable characteristics is the color, hence, an essential parameter to be analyzed [3,68,69].
The results of L* (lightness), a* (redness index) and b* (yellowness index) of fillets were similar to those presented by Ünal Şengör et al. [70], that evaluated color of commercial gilthead seabream during cold storage. Whereas no information available about the possible effects of HBP on fish fillet quality and its relationship with the immune response, in a study using a natural compound (Flammulina velutipes extract) in catfish diets, it was observed that the experimental diets prevented lipid oxidation and improved color stability during frozen storage [69].
The pH and WHC values of the fish fillets at day 0 were unaffected by the dietary intervention, according to Álvarez et al. [71]. On the contrary, storage time showed a significant effect on those parameters. The pH increase after the storage period is associated with the accumulation of components from the nitrogen compounds degradation [72,73]. Concerning the WHC, the decreased value can be attributable both to the muscle mechanical damage by the ice crystal formation during freezing and to the protein denaturation and lipid oxidation as well [40,74,75,76,77], in line with other studies [36,76,77,78]. Texture instead, expressed as shear force, was not affected nor by treatment or frozen storage in gilthead seabream fillets and the results obtained were similar to Cai et al. [79] results.
Moisture and total lipids of the fish fillets were unaffected by the dietary intervention; however, storage time significantly decreased water content, as herein found. This effect on water content can be explained because of the damages to the cells caused by ice crystals formed during freezing. Thus, the free water is readily separated from the matrix after thawing, resulting in a great loss of water [80]. As suggested by Sathivel [81], the effect of moisture loss during frozen storage can be attenuated if some type of protection is used. For instance, different coatings, such as chitosan, egg albumin or soy protein concentrate effectively preserved fish fillets from water loss [81], while the dietary intervention with HBP did not represent a valid approach.
The total lipid content, unaffected by the diet, was significantly decreased (p < 0.05) after 110 days of storage at −20 °C, as previously observed in other fish species [69,77,82,83,84,85].
Regarding the fatty acid composition of HBP and HBP_SFE, among the predominant fatty acids in pollen extract, PUFA was the most abundant. Xu et al. [14] highlighted that extracted bee pollen oil has high nutritional quality and is, therefore, an excellent functional oil. It is known that PUFAs are critical components of cell and organelle membranes (mainly as sn-2 phospholipids), as suggested by the close link between organelle evolution in eukaryotes and the emergence of polyunsaturated fatty acids [86]. In addition, PUFAs also regulate the expression of certain genes, including those coding for fatty-acid synthase, nitric-oxide synthase, sodium-channel proteins and cholesterol-7-a-hydroxylase and thereby they affect processes including fatty-acid biosynthesis, cancer induction and cholesterol regulation [87]. In this way, they have an impact on cellular biochemical activities, transport processes and cell-stimulus responses, are implicated in physiological processes including lipid metabolism and targeting, immune responses and cold adaptation, and are involved in pathological conditions such as carcinogenesis and cardiovascular disease [86,87,88]. Nevertheless, the quantity of HPB and SFE added to the diet was not able to determine the significant modification of the fillet’s fatty acid profile. Nor EPA or DHA, two fatty acids having a very important structural and functional roles in fish metabolism [89], were significantly modified by the treatment. However, the content of C18:3n-3, the fatty acid precursor of EPA and DHA, found higher in the E1 group compared to the other diets, could deserve further investigations to better understand the interaction between HBP and the expression of genes involved in lipid metabolism. Indeed, peony pollen administrated for 6 weeks to common carp might regulate fish lipid metabolism and fatty acids profile [23]. Concerning lipid stability, the frozen storage slightly increased the relative abundance of myristic (C14:0), palmitic (C16:0) and palmitoleic (C16:1n-7) acids. In addition, the frozen storage also affected the levels of α-linolenic (C18:3n-3), docosapentaenoic (C22:5n-3, DPA), linoleic (C18:2n-6, LA) and 9-eicosenoic (C20:1n-9) acids by slightly decreasing them. These moderated changes agreed with data from lipid peroxidation, especially those of TBARS content. This trend was also confirmed by DPPH values for all the groups, with a minor effect of the diets. Otherwise, despite not differing significantly, the fillets of the groups that received diets with high concentrations of HBP (P10 and E1) apparently were less affected by oxidative stress, compared to the control group, as far as concerns the secondary oxidation products. This trend was also associated with ABTS values, as P10, E1 and P5 showed lower decreasing values than CTR and E0.5. Herein, the present result did not support previous evidence regarding the beneficial effects on the overall antioxidant capacity and malondialdehyde content of the intestine of common carp fed with 30 g/kg of peony pollen [23]. Indeed, the antioxidant capacity expressed in E1, P10 and P5 was not sufficient to overdue the lipid oxidation caused by the storage.

5. Conclusions

Considering all the data obtained in this trial and the growing attention towards animal welfare, we can conclude that the pollen supercritical fluid extract added to the diet for seabream at 1% seemed a promising option due to the positive effect on hepatic expression of inflammatory genes. The research carried out demonstrated that the intrinsic bioactivity of the honeybee pollen was properly extracted by the supercritical fluid technique and exerted its bioactivity in vivo, thanks to some beneficial effects on fish gilthead seabream health. Contrarily, no specific protection of HBP against lipid peroxidation was shown during 110 days of frozen storage. For this reason, further studies are highly suggested to verify if higher pollen inclusion levels, a mix of HBP and SFE, or longer feeding trials than the present one could positively affect the fatty acid profile and mitigation of fillet oxidative damages. The present study suggests the need for a multidisciplinary approach in the research aimed at discovering natural compounds able to modulate fish welfare and fillet quality.

Supplementary Materials

The following are available online at https://www.mdpi.com/article/10.3390/ani12060675/s1, Table S1: Fatty acid profile (%) of honeybee pollen (HBP) and supercritical fluid extract (SFE) of HBP (HBP_SFE). Table S2: Growth performance indexes of gilthead se bream fed on diets added with 5% or 10% of raw HBP (diets P5 and P10) and 0.5% or 1% of HBP-SFE (diets E05 and E1).

Author Contributions

Conceptualization, G.P. (Giuliana Parisi), C.M.M. and G.P. (Giovanni Piccolo); methodology, G.P. (Giuliana Parisi), C.M.M. and G.S.; formal analysis, A.C.L.d.M., S.M. (Simone Mancini), G.S., R.A. and S.M. (Simona Manuguerra); data curation, G.P. (Giuliana Parisi) and C.M.M.; writing—original draft preparation, A.C.L.d.M., S.M. (Simone Mancini), R.A., S.M. (Simona Manuguerra) and G.S; writing—review and editing, C.M.M., G.P. (Giuliana Parisi), G.P. (Giovanni Piccolo), F.B. and A.S.; supervision, G.P. (Giuliana Parisi) and C.M.M. All authors have read and agreed to the published version of the manuscript.

Funding

This research received no external funding.

Institutional Review Board Statement

The trial was authorized by the Ministry of Health (authorization No. 651/2017-PR, issued based on Directive 2010/63/EU) and was approved by the Ethics Committee of the Federico II University of Napoli. The experimental procedures of gilthead seabream were carried out at the Department of Veterinary Medicine and Animal Production-University of Napoli Federico II (Napoli, Italy), according to the guidelines of the Declaration of Helsinki.

Acknowledgments

Authors would like to thank Antonio Bonelli, technician at DAGRI (University of Florence, Italy), for his valuable support in chemical analyses. R.A. is supported by the project “From waste to profit” funded by PON RI FSE-FESR (2014/2020) Action IV.5 “Green deal”, to the University of Palermo (Italy). S.M. (Simona Manuguerra) is a student in Biochemistry and Molecular Biology at the Department of Biotechnology, Chemistry, and Pharmacy, University of Siena (Italy).

Conflicts of Interest

The authors declare no conflict of interest.

References

  1. Craig, S.; Kuhn, D.; Schwarz, M. Understanding Fish Nutrition, Feeds, and Feeding. Va. Coop. Extention 2017, 1–6. Available online: https://fisheries.tamu.edu/files/2019/01/FST-269.pdf (accessed on 24 December 2021).
  2. Hua, K.; Cobcroft, J.M.; Cole, A.; Condon, K.; Jerry, D.R.; Mangott, A.; Praeger, C.; Vucko, M.J.; Zeng, C.; Zenger, K.; et al. The Future of Aquatic Protein: Implications for Protein Sources in Aquaculture Diets. One Earth 2019, 1, 316–329. [Google Scholar] [CrossRef] [Green Version]
  3. Pulido-Rodriguez, L.F.; Cardinaletti, G.; Secci, G.; Randazzo, B.; Bruni, L.; Cerri, R.; Olivotto, I.; Tibaldi, E.; Parisi, G. Appetite Regulation, Growth Performances and Fish Quality Are Modulated by Alternative Dietary Protein Ingredients in Gilthead Sea Bream (Sparus aurata) Culture. Animals 2021, 11, 1919. [Google Scholar] [CrossRef] [PubMed]
  4. de la Cruz-Cervantes, J.A.; Benavides-González, F.; Sánchez-Martínez, J.G.; Vázquez-Sauceda, M.d.L.L.; Ruiz-Uribe, A.J. Propolis in Aquaculture: A Review of Its Potential. Rev. Fish. Sci. Aquac. 2018, 26, 337–349. [Google Scholar] [CrossRef]
  5. Ushakova, N.A.; Pravdin, V.G.; Kravtsova, L.Z.; Ponomarev, S.V.; Gridina, T.S.; Ponomareva, E.N.; Rudoy, D.V.; Chikindas, M.L. Complex Bioactive Supplements for Aquaculture—Evolutionary Development of Probiotic Concepts. Probiotics Antimicrob. Proteins 2021, 13, 1696–1708. [Google Scholar] [CrossRef] [PubMed]
  6. Reverter, M.; Bontemps, N.; Lecchini, D.; Banaigs, B.; Sasal, P. Use of Plant Extracts in Fish Aquaculture as an Alternative to Chemotherapy: Current Status and Future Perspectives. Aquaculture 2014, 433, 50–61. [Google Scholar] [CrossRef]
  7. Bulfon, C.; Volpatti, D.; Galeotti, M. Current Research on the Use of Plant-Derived Products in Farmed Fish. Aquac. Res. 2015, 46, 513–551. [Google Scholar] [CrossRef]
  8. Messina, C.M.; Panettieri, V.; Arena, R.; Renda, G.; Espinosa Ruiz, C.; Morghese, M.; Piccolo, G.; Santulli, A.; Bovera, F. The Inclusion of a Supercritical Fluid Extract, Obtained From Honey Bee Pollen, in the Diet of Gilthead Sea Bream (Sparus aurata), Improves Fish Immune Response by Enhancing Anti-Oxidant, and Anti-Bacterial Activities. Front. Vet. Sci. 2020, 7, 95. [Google Scholar] [CrossRef] [Green Version]
  9. Harikrishnan, R.; Balasundaram, C.; Heo, M.S. Impact of Plant Products on Innate and Adaptive Immune System of Cultured Finfish and Shellfish. Aquaculture 2011, 317, 1–15. [Google Scholar] [CrossRef]
  10. Santos, H.M.C.; Méndez, L.; Secci, G.; Parisi, G.; Martelli, R.; Medina, I. Pathway-Oriented Action of Dietary Essential Oils to Prevent Muscle Protein Oxidation and Texture Deterioration of Farmed Rainbow Trout. Animal 2019, 13, 2080–2091. [Google Scholar] [CrossRef]
  11. Hernández, A.; García García, B.; Jordán, M.J.; Hernández, M.D. Study of the Dose of Thyme Essential Oil in Feed to Prolong the Shelf Life of Gilthead Seabream (Sparus aurata). Aquac. Nutr. 2015, 21, 740–749. [Google Scholar] [CrossRef]
  12. Pascoal, A.; Rodrigues, S.; Teixeira, A.; Feás, X.; Estevinho, L.M. Biological Activities of Commercial Bee Pollens: Antimicrobial, Antimutagenic, Antioxidant and Anti-Inflammatory. Food Chem. Toxicol. 2014, 63, 233–239. [Google Scholar] [CrossRef]
  13. Ares, A.M.; Valverde, S.; Bernal, J.L.; Nozal, M.J.; Bernal, J. Extraction and Determination of Bioactive Compounds from Bee Pollen. J. Pharm. Biomed. Anal. 2018, 147, 110–124. [Google Scholar] [CrossRef]
  14. Xu, X.; Sun, L.; Dong, J.; Zhang, H. Breaking the Cells of Rape Bee Pollen and Consecutive Extraction of Functional Oil with Supercritical Carbon Dioxide. Innov. Food Sci. Emerg. Technol. 2009, 10, 42–46. [Google Scholar] [CrossRef]
  15. Panettieri, V.; Chatzifotis, S.; Messina, C.M.; Olivotto, I.; Manuguerra, S.; Randazzo, B.; Ariano, A.; Bovera, F.; Santulli, A.; Severino, L.; et al. Honey Bee Pollen in Meagre (Argyrosomus regius) Juvenile Diets: Effects on Growth, Diet Digestibility, Intestinal Traits, and Biochemical Markers Related to Health and Stress. Animals 2020, 10, 231. [Google Scholar] [CrossRef] [Green Version]
  16. Morais, M.; Moreira, L.; Feás, X.; Estevinho, L.M. Honeybee-Collected Pollen from Five Portuguese Natural Parks: Palynological Origin, Phenolic Content, Antioxidant Properties and Antimicrobial Activity. Food Chem. Toxicol. 2011, 49, 1096–1101. [Google Scholar] [CrossRef] [Green Version]
  17. Mistry, J.; Kennedy, J.F. Antioxidants in Food: Practical Applications. Carbohydr. Polym. 2003, 52, 88. [Google Scholar] [CrossRef]
  18. di Chiacchio, I.M.; Paiva, I.M.; de Abreu, D.J.M.; Carvalho, E.E.N.; Martínez, P.J.; Carvalho, S.M.; Mulero, V.; Murgas, L.D.S. Bee Pollen as a Dietary Supplement for Fish: Effect on the Reproductive Performance of Zebrafish and the Immunological Response of Their Offspring. Fish Shellfish. Immunol. 2021, 119, 300–307. [Google Scholar] [CrossRef]
  19. Sánchez, E.G.T.; Fuenmayor, C.A.; Vásquez Mejía, S.M.; Díaz-Moreno, C.; Suárez Mahecha, H. Effect of Bee Pollen Extract as a Source of Natural Carotenoids on the Growth Performance and Pigmentation of Rainbow Trout (Oncorhynchus mykiss). Aquaculture 2020, 514, 734490. [Google Scholar] [CrossRef]
  20. Attia, Y.A.; Al-Hanoun, A.; Tag El-Din, A.E.; Bovera, F.; Shewika, Y.E. Effect of Bee Pollen Levels on Productive, Reproductive and Blood Traits of NZW Rabbits. J. Anim. Physiol. Anim. Nutr. 2011, 95, 294–303. [Google Scholar] [CrossRef]
  21. Abbass, A.A.; El-Asely, A.M.; Kandiel, M.M.M. Effects of Dietary Propolis and Pollen on Growth Performance, Fecundity and Some Hematological Parameters of Oreochromis niloticus. Turk. J. Fish. Aquat. Sci. 2012, 12, 917–924. [Google Scholar] [CrossRef]
  22. El-Asely, A.M.; Abbass, A.A.; Austin, B. Honey Bee Pollen Improves Growth, Immunity and Protection of Nile Tilapia (Oreochromis niloticus) against Infection with Aeromonas hydrophila. Fish Shellfish. Immunol. 2014, 40, 500–506. [Google Scholar] [CrossRef]
  23. Ren, H.; Huang, Y.; Lin, L. Effects of Dietary Supplementation with Peony Pollen on Growth, Intestinal Function, Fillet Quality and Fatty Acids Profiles of Common Carp. Aquac. Nutr. 2021, 27, 908–917. [Google Scholar] [CrossRef]
  24. Cuesta, A.; Rodríguez, A.; Esteban, M.Á.; Meseguer, J. In Vivo Effects of Propolis, a Honeybee Product, on Gilthead Seabream Innate Immune Responses. Fish Shellfish. Immunol. 2005, 18, 71–80. [Google Scholar] [CrossRef]
  25. Prakatur, I.; Miskulin, M.; Pavic, M.; Marjanovic, K.; Blazicevic, V.; Miskulin, I.; Domacinovic, M. Intestinal Morphology in Broiler Chickens Supplemented with Propolis and Bee Pollen. Animals 2019, 9, 301. [Google Scholar] [CrossRef] [Green Version]
  26. Picoli, F.; Lopes, D.L.d.A.; Zampar, A.; Serafini, S.; Freccia, A.; Veronezi, L.O.; Kowalski, M.W.; Ghizzo, J.B.; Emerenciano, M.G.C. Dietary Bee Pollen Affects Hepatic–Intestinal Histomorphometry of Nile Tilapia Fingerlings. Aquac. Res. 2019, 50, 3295–3304. [Google Scholar] [CrossRef]
  27. Herrero, M.; Cifuentes, A.; Ibañez, E. Sub-and Supercritical Fluid Extraction of Functional Ingredients from Different Natural Sources: Plants, Food-by-Products, Algae and Microalgae: A Review. Food Chem. 2006, 98, 136–148. [Google Scholar] [CrossRef] [Green Version]
  28. Messina, C.M.; Troia, A.; Arena, R.; Manuguerra, S.; Ioannou, T.; Curcuraci, E.; Renda, G.; Hellio, C.; Santulli, A. Species-Specific Antioxidant Power and Bioactive Properties of the Extracts Obtained from Wild Mediterranean Calendula spp. (Asteraceae). Appl. Sci. 2019, 9, 4627. [Google Scholar] [CrossRef] [Green Version]
  29. Castro-Vargas, H.I.; Rodríguez-Varela, L.I.; Ferreira, S.R.S.; Parada-Alfonso, F. Extraction of Phenolic Fraction from Guava Seeds (Psidium guajava L.) Using Supercritical Carbon Dioxide and Co-Solvents. J. Supercrit. Fluids 2010, 51, 319–324. [Google Scholar] [CrossRef]
  30. Gómez-Requeni, P.; Mingarro, M.; Calduch-Giner, J.A.; Médale, F.; Martin, S.A.M.; Houlihan, D.F.; Kaushik, S.; Pérez-Sánchez, J. Protein Growth Performance, Amino Acid Utilisation and Somatotropic Axis Responsiveness to Fish Meal Replacement by Plant Protein Sources in Gilthead Sea Bream (Sparus aurata). Aquaculture 2004, 232, 493–510. [Google Scholar] [CrossRef]
  31. Peres, H.; Oliva-Teles, A. The Optimum Dietary Essential Amino Acid Profile for Gilthead Seabream (Sparus aurata) Juveniles. Aquaculture 2009, 296, 81–86. [Google Scholar] [CrossRef]
  32. Chomczynski, P. A Reagent for the Single-Step Simultaneous Isolation of RNA, DNA and Proteins from Cell and Tissue Samples. BioTechniques 1993, 15, 532–537. [Google Scholar] [PubMed]
  33. Livak, K.J.; Schmittgen, T.D. Analysis of Relative Gene Expression Data Using Real-Time Quantitative PCR and the 2-ΔΔCT Method. Methods 2001, 25, 402–408. [Google Scholar] [CrossRef] [PubMed]
  34. CIE. Colorimetry, 3rd ed.; Commission Internationale de l’Eclairage, CIE Central Bureau: Vienna, Austria, 2004. [Google Scholar]
  35. Eide, O.; Børresen, T.; Strøm, T. Minced Fish Production from Capelin (Mallotus villosus). A New Method for Gutting, Skinning and Removal of Fat from Small Fatty Fish Species. J. Food Sci. 1982, 47, 347–349. [Google Scholar] [CrossRef]
  36. Hultmann, L.; Rustad, T. Textural Changes during Iced Storage of Salmon (Salmo salar) and Cod (Gadus morhua). J. Aquat. Food Prod. Technol. 2002, 11, 105–123. [Google Scholar] [CrossRef]
  37. AOAC. Official Methods of Analysis of AOAC International, 19th ed.; Latimer, G.W., Jr., Ed.; AOAC: Washington, DC, USA, 2012. [Google Scholar]
  38. Folch, J.; Lees, M.; Sloane, G.H. A Simple Method for the Isolation and Purification of Total Lipids from Animal Tissues. J. Biol. Chem. 1957, 226, 497–509. [Google Scholar] [CrossRef]
  39. Morrison, W.R.; Smith, L.M. Preparation of Fatty Acid Methyl Esters and Dimethylacetals From Lipids. J. Lipid Res. 1964, 5, 600–608. [Google Scholar] [CrossRef]
  40. Secci, G.; Mancini, S.; Iaconisi, V.; Gasco, L.; Basto, A.; Parisi, G. Can the Inclusion of Black Soldier Fly (Hermetia illucens) in Diet Affect the Flesh Quality/Nutritional Traits of Rainbow Trout (Oncorhynchus mykiss) after Freezing and Cooking? Int. J. Food Sci. Nutr. 2019, 70, 161–171. [Google Scholar] [CrossRef]
  41. Lepage, G.; Roy, C.C. Improved Recovery of Fatty Acid through Direct Transesterification without Prior Extraction or Purification. J. Lipid Res. 1984, 25, 1391–1396. [Google Scholar] [CrossRef]
  42. Messina, C.M.; Renda, G.; La Barbera, L.; Santulli, A. By-Products of Farmed European Sea Bass (Dicentrarchus labrax L.) as a Potential Source of n-3 PUFA. Biologia 2013, 68, 288–293. [Google Scholar] [CrossRef] [Green Version]
  43. Srinivasan, S.; Xiong, Y.L.; Decker, E.A. Inhibition of Protein and Lipid Oxidation in Beef Heart Surimi-like Material by Antioxidants and Combinations of pH, NaCl, and Buffer Type in the Washing Media. J. Agric. Food Chem. 1996, 44, 119–125. [Google Scholar] [CrossRef]
  44. Vyncke, W. Direct Determination of the Thiobarbituric Acid Value in Trichloracetic Acid Extracts of Fish as a Measure of Oxidative Rancidity. Fette Seifen Anstrichm. 1970, 72, 1084–1087. [Google Scholar] [CrossRef]
  45. Re, R.; Pellegrini, N.; Proteggente, A.; Pannala, A.; Yang, M.; Rice-Evans, C. Antioxidant Activity Applying an Improved ABTS Radical Cation Decoloration Assay. Radic. Biol. Med. 1999, 26, 1231–1237. [Google Scholar] [CrossRef]
  46. Blois, M.S. Antioxidant Determinations by the Use of a Stable Free Radical. Nature 1958, 181, 1199–1200. [Google Scholar] [CrossRef]
  47. Mancini, S.; Preziuso, G.; Dal Bosco, A.; Roscini, V.; Szendro, Z.; Fratini, F.; Paci, G. Effect of Turmeric Powder (Curcuma longa L.) and Ascorbic Acid on Physical Characteristics and Oxidative Status of Fresh and Stored Rabbit Burgers. Meat Sci. 2015, 110, 93–100. [Google Scholar] [CrossRef]
  48. SAS. SAS/STAT 9.3 User’s Guide; SAS Institute Inc.: Cary, NC, USA, 2011. [Google Scholar]
  49. Abdelnour, S.A.; Abd El-Hack, M.E.; Alagawany, M.; Farag, M.R.; Elnesr, S.S. Beneficial Impacts of Bee Pollen in Animal Production, Reproduction and Health. J. Anim. Physiol. Anim. Nutr. 2019, 103, 477–484. [Google Scholar] [CrossRef]
  50. Liu, J.; Li, N.; Wang, C. Study on Extraction and Antioxidant Activity of Flavonoids from Peony Pollen. Food Res. Dev. 2012, 33, 39–44. [Google Scholar]
  51. Yuan, Y.; Wang, C.; Rao, H. Research Progress of Flavonoid in Peony Flowers. J. Qilu Univ. Technol. 2013, 4, 31–34. [Google Scholar]
  52. Lepetsos, P.; Papavassiliou, A.G. ROS/Oxidative Stress Signaling in Osteoarthritis. Biochim. Biophys. Acta-Mol. Basis Dis. 2016, 1862, 576–591. [Google Scholar] [CrossRef]
  53. Buonocore, F.; Forlenza, M.; Randelli, E.; Benedetti, S.; Bossù, P.; Meloni, S.; Secombes, C.J.; Mazzini, M.; Scapigliati, G. Biological Activity of Sea Bass (Dicentrarchus labrax L.) Recombinant Interleukin-1β. Mar. Biotechnol. 2005, 7, 609–617. [Google Scholar] [CrossRef]
  54. Hong, S.; Peddie, S.; Campos-Pérez, J.J.; Zou, J.; Secombes, C.J. The Effect of Intraperitoneally Administered Recombinant IL-1β on Immune Parameters and Resistance to Aeromonas salmonicida in the Rainbow Trout (Oncorhynchus mykiss). Dev. Comp. Immunol. 2003, 27, 801–812. [Google Scholar] [CrossRef]
  55. Secombes, C.J.; Wang, T.; Hong, S.; Peddie, S.; Crampe, M.; Laing, K.J.; Cunningham, C.; Zou, J. Cytokines and Innate Immunity of Fish. Dev. Comp. Immunol. 2001, 25, 713–723. [Google Scholar] [CrossRef]
  56. Fu, X.; Ding, Z.; Fan, J.; Wang, H.; Zhou, F.; Cui, L.; Boxiang, C.; Wang, W.; Liu, H. Characterization, Promoter Analysis and Expression of the Interleukin-6 Gene in Blunt Snout Bream, Megalobrama amblycephala. Fish Physiol. Biochem. 2016, 42, 1527–1540. [Google Scholar] [CrossRef] [PubMed]
  57. Bird, S.; Zou, J.; Savan, R.; Kono, T.; Sakai, M.; Woo, J.; Secombes, C. Characterisation and Expression Analysis of an Interleukin 6 Homologue in the Japanese Pufferfish, Fugu rubripes. Dev. Comp. Immunol. 2005, 29, 775–789. [Google Scholar] [CrossRef]
  58. Nam, B.H.; Byon, J.Y.; Kim, Y.O.; Park, E.M.; Cho, Y.C.; Cheong, J.H. Molecular Cloning and Characterisation of the Flounder (Paralichthys olivaceus) Interleukin-6 Gene. Fish Shellfish. Immunol. 2007, 23, 231–236. [Google Scholar] [CrossRef]
  59. Castellana, B.; Iliev, D.B.; Sepulcre, M.P.; MacKenzie, S.; Goetz, F.W.; Mulero, V.; Planas, J.V. Molecular Characterization of Interleukin-6 in the Gilthead Seabream (Sparus aurata). Mol. Immunol. 2008, 45, 3363–3370. [Google Scholar] [CrossRef]
  60. Wang, T.T.; Song, X.H.; Bao, G.M.; Zhao, L.X.; Yu, X.; Zhao, J. Molecular Characterization, Expression Analysis, and Biological Effects of Interleukin-8 in Grass Carp Ctenopharyngodon idellus. Fish Shellfish. Immunol. 2013, 35, 1421–1432. [Google Scholar] [CrossRef]
  61. Muangnoi, C.; Chingsuwanrote, P.; Praengamthanachoti, P.; Svasti, S.; Tuntipopipat, S. Moringa oleifera Pod Inhibits Inflammatory Mediator Production by Lipopolysaccharide-Stimulated RAW 264.7 Murine Macrophage Cell Lines. Inflammation 2012, 35, 445–455. [Google Scholar] [CrossRef]
  62. Praengam, K.; Muangnoi, C.; Dawilai, S.; Awatchanawong, M.; Tuntipopipat, S. Digested Moringa oleifera Boiled Pod Exhibits Anti-Inflammatory Activity in CACO-2 Cells. J. Herbs Spices Med. Plants 2015, 21, 148–160. [Google Scholar] [CrossRef]
  63. Christybapita, D.; Divyagnaneswari, M.; Dinakaran Michael, R. Oral Administration of Eclipta alba Leaf Aqueous Extract Enhances the Non-Specific Immune Responses and Disease Resistance of Oreochromis mossambicus. Fish Shellfish. Immunol. 2007, 23, 840–852. [Google Scholar] [CrossRef]
  64. Chu, W.H. Adjuvant Effect of Propolis on Immunisation by Inactivated Aeromonas hydrophila in Carp (Carassius auratus Gibelio). Fish Shellfish. Immunol. 2006, 21, 113–117. [Google Scholar] [CrossRef]
  65. Mansour, A.T.; Miao, L.; Espinosa, C.; García-Beltrán, J.M.; Ceballos Francisco, D.C.; Esteban, M.Á. Effects of Dietary Inclusion of Moringa oleifera Leaves on Growth and Some Systemic and Mucosal Immune Parameters of Seabream. Fish Physiol. Biochem. 2018, 44, 1223–1240. [Google Scholar] [CrossRef]
  66. Yin, G.; Ardó, L.; Thompson, K.D.; Adams, A.; Jeney, Z.; Jeney, G. Chinese Herbs (Astragalus radix and Ganoderma lucidum) Enhance Immune Response of Carp, Cyprinus carpio, and Protection against Aeromonas hydrophila. Fish Shellfish. Immunol. 2009, 26, 140–145. [Google Scholar] [CrossRef]
  67. Zhang, G.; Gong, S.; Yu, D.; Yuan, H. Propolis and Herba epimedii Extracts Enhance the Non-Specific Immune Response and Disease Resistance of Chinese Sucker, Myxocyprinus asiaticus. Fish Shellfish. Immunol. 2009, 26, 467–472. [Google Scholar] [CrossRef]
  68. Bruni, L.; Randazzo, B.; Cardinaletti, G.; Zarantoniello, M.; Mina, F.; Secci, G.; Tulli, F.; Olivotto, I.; Parisi, G. Dietary Inclusion of Full-Fat Hermetia illucens Prepupae Meal in Practical Diets for Rainbow Trout (Oncorhynchus mykiss): Lipid Metabolism and Fillet Quality Investigations. Aquaculture 2020, 529, 735678. [Google Scholar] [CrossRef]
  69. Ha, N.C.; Hiep, L.T.B.; van Toan, L.; Nho, L.T.H.; Tuyet, N.T.N.; le Ngoc, N.T. Ergothioneine Accumulated in the Catfish Muscle by Supplementation of Flammulina velutipes Extract Prevents Lipid Oxidation, Improves Color Stability, and Limits Soft Structure of the Fillet during Frozen Storage. J. Food Processing Preserv. 2021, 45, e15340. [Google Scholar] [CrossRef]
  70. Ünal Şengör, G.F.; Balaban, M.O.; Topaloğlu, B.; Ayvaz, Z.; Ceylan, Z.; Doğruyol, H. Color Assessment by Different Techniques of Gilthead Seabream (Sparus aurata) during Cold Storage. Food Sci. Technol. 2018, 39, 696–703. [Google Scholar] [CrossRef] [Green Version]
  71. Álvarez, A.; Fontanillas, R.; Hernández-Contreras, A.; Hernández, M.D. Partial Replacement of Fish Oil with Vegetal Oils in Commercial Diets: The Effect on the Quality of Gilthead Seabream (Sparus aurata). Anim. Feed. Sci. Technol. 2020, 265, 114504. [Google Scholar] [CrossRef]
  72. Ayala, M.D.; Abdel, I.; Santaella, M.; Martínez, C.; Periago, M.J.; Gil, F.; Blanco, A.; Albors, O.L. Muscle Tissue Structural Changes and Texture Development in Sea Bream, Sparus aurata L., during Post-Mortem Storage. LWT-Food Sci. Technol. 2010, 43, 465–475. [Google Scholar] [CrossRef]
  73. Hematyar, N.; Mraz, J.; Stejskal, V.; Sampels, S.; Linhartová, Z.; Prokesova, M.; Vacha, F.; Krizek, M.; Dadakova, E.; Søndergård Møller, H.; et al. Comparison of Quality Changes in Eurasian Perch (Perca fluviatilis L.) Fillets Originated from Two Different Rearing Systems during Frozen and Refrigerated Storage. Foods 2021, 10, 1405. [Google Scholar] [CrossRef]
  74. Burgaard, M.G.; Jørgensen, B.M. Effect of Temperature on Quality-Related Changes in Cod (Gadus morhua) during Short- and Long-Term Frozen Storage. J. Aquat. Food Prod. Technol. 2010, 19, 249–263. [Google Scholar] [CrossRef]
  75. Makri, M. Biochemical and Textural Properties of Frozen Stored −22 °C Gilthead Seabream Sparus aurata Fillets. Afr. J. Biotechnol. 2009, 8, 1287–1299. [Google Scholar] [CrossRef]
  76. Sáez, M.I.; Suárez, M.D.; Cárdenas, S.; Martínez, T.F. Freezing and Freezing-Thawing Cycles on Textural and Biochemical Changes of Meagre (Argyrosomus regius, L.) Fillets during Further Cold Storage. Int. J. Food Prop. 2015, 18, 1635–1647. [Google Scholar] [CrossRef] [Green Version]
  77. Kumar, G.P.; Reddy, G.V.S.; Dhanapal, K.; Babu, P.H. Effect of Frozen Storage on the Quality and Shelflife of Mrigal (Cirrhinus mrigala). J. Entomol. Zool. Stud. 2021, 9, 1071–1076. [Google Scholar]
  78. Caballero, M.J.; Betancor, M.; Escrig, J.C.; Montero, D.; Espinosa de los Monteros, A.; Castro, P.; Ginés, R.; Izquierdo, M. Post Mortem Changes Produced in the Muscle of Sea Bream (Sparus aurata) during Ice Storage. Aquaculture 2009, 291, 210–216. [Google Scholar] [CrossRef]
  79. Cai, L.; Nian, L.; Zhao, G.; Zhang, Y.; Sha, L.; Li, J. Effect of Herring Antifreeze Protein Combined with Chitosan Magnetic Nanoparticles on Quality Attributes in Red Sea Bream (Pagrosomus major). Food Bioprocess Technol. 2019, 12, 409–421. [Google Scholar] [CrossRef]
  80. Nian, L.; Cao, A.; Cai, L.; Ji, H.; Liu, S. Effect of Vacuum Impregnation of Red Sea Bream (Pagrosomus major) with Herring AFP Combined with CS@Fe3O4 Nanoparticles during Freeze-Thaw Cycles. Food Chem. 2019, 291, 139–148. [Google Scholar] [CrossRef]
  81. Sathivel, S. Chitosan and Protein Coatings Affect Yield, Moisture Loss, and Lipid Oxidation of Pink Salmon (Oncorhynchus gorbuscha) Fillets During Frozen Storage. J. Food Sci. 2005, 70, e455–e459. [Google Scholar] [CrossRef]
  82. Gandotra, R. Change In Proximate Composition And Microbial Count By Low Temperaturepreservation In Fish Muscle Of Labeo rohita (HamBuch). IOSR J. Pharm. Biol. Sci. 2012, 2, 13–17. [Google Scholar] [CrossRef]
  83. Arannilewa, S.T.; Salawu, S.O.; Sorungbe, A.A.; Ola-Salawu, B.B. Effect of Frozen Period on the Chemical, Microbiological and Sensory Quality of Frozen Tilapia Fish (Sarotherodun galiaenus). Afr. J. Biotechnol. 2005, 4, 852–855. [Google Scholar] [CrossRef]
  84. Hassanin, S.I.A.; El-Daly, E.-S.A. Effect of Propolis and Garlic on Nile Tilapia Oreochromis niloticus Fillets during Frozen Storage. J. Arab. Aquac. Soc. 2013, 8, 237–248. [Google Scholar]
  85. Obemeata, O.; Christopher, N. Organoleptic Assessment and Proximate Analysis of Stored Tilapia guineensis. Annu. Rev. Res. Biol. 2012, 2, 46–52. [Google Scholar]
  86. Gill, I.; Valivety, R. Polyunsaturated Fatty Acids, Part 1: Occurrence, Biological Activities and Applications. Trends Biotechnol. 1997, 15, 401–409. [Google Scholar] [CrossRef]
  87. Dave, D.; Routray, W. Current Scenario of Canadian Fishery and Corresponding Underutilized Species and Fishery Byproducts: A Potential Source of Omega-3 Fatty Acids. J. Clean. Prod. 2018, 180, 617–641. [Google Scholar] [CrossRef]
  88. Bordoni, A.; Di Nunzio, M.; Danesi, F.; Biagi, P.L. Polyunsaturated Fatty Acids: From Diet to Binding to Ppars and Other Nuclear Receptors. Genes Nutr. 2006, 1, 95–106. [Google Scholar] [CrossRef] [Green Version]
  89. Carvalho, M.; Montero, D.; Torrecillas, S.; Castro, P.; Zamorano, M.J.; Izquierdo, M. Hepatic Biochemical, Morphological and Molecular Effects of Feeding Microalgae and Poultry Oils to Gilthead Sea Bream (Sparus aurata). Aquaculture 2021, 532, 736073. [Google Scholar] [CrossRef]
Figure 1. Relative expression of genes related to the immune system analyzed on liver of gilthead seabream. CTR: control diet (without HBP and HBP_SFE); P5 and P10: diets including 5% or 10% of honeybee pollen (HBP), respectively; E0.5 and E1: diets including 0.5% or 1% supercritical fluid extract (SFE) from HBP (HBP_SFE), respectively. Values are the mean ± SEM (n = 9). Statistical differences (p < 0.05) between groups are indicated by the different letters (a, b, c).
Animals 12 00675 g001
Figure 2. ABTS values (mmol eq. Trolox/kg fillet) of fillets from fish fed the CTR: control diet without HBP and HBP_SFE (white bars); P5 (light grey bars) and P10 (grey bars): diets including 5% or 10% of honeybee pollen (HBP), respectively; E0.5 (dark grey bars) and E1 (dark bars): diets including 0.5% or 1% of supercritical fluid extract (SFE) of HBP (HBP_SFE), respectively. Full colored bars are for samples analyzed at day 0, while crossed bars are for samples analyzed at day 110. The letters a, b, c, d indicate statistically different means according to the significant T × S interaction (p < 0.05).
Animals 12 00675 g002
Figure 3. DPPH value of fillets from fish fed the CTR: control diet without HBP and HBP_SFE (white bars); P5 (light grey bars) and P10 (grey bars): diets including 5% or 10% of honeybee pollen (HBP), respectively; E0.5 (dark grey bars) and E1 (dark bars): diets including 0.5% or 1% of supercritical fluid extract (SFE) of HBP (HBP_SFE), respectively. Full colored bars are for samples analyzed at day 0, while crossed bars are for samples analyzed at day 110. The letters a, b, c, d, e indicate statistically different means according to the significant T × S interaction (p < 0.05).
Animals 12 00675 g003
Table 1. Chemical composition (% as feed) of the experimental diets provided to gilthead seabream.
CTRP5P10E0.5E1
Dry matter88.9488.1987.6388.4388.62
Ash5.504.994.354.714.51
Crude protein39.7839.9238.2638.9139.46
Ether extract17.8517.2517.1517.7517.15
Crude fiber7.177.548.637.377.62
CTR: control diet (without HBP and HBP_SFE); P5 and P10: diets including 5% or 10% of honeybee pollen (HBP), respectively; E0.5 and E1: diets including 0.5% or 1% supercritical fluid extract (SFE) of HBP (HBP_SFE), respectively.
Table 2. Gilthead seabream primer sequences utilized for the real-time PCR.
GeneAccession NumberF/R Primer Sequence (5′–3′)
il1-βAJ277166F-GGGCTGAACAACAGCACTCTC
R-TTAACACTCTCCACCCTCCA
il-6AM749958F-AGGCAGGAGTTTGAAGCTGA
R-ATGCTGAAGTTGGTGGAAGG
il-8AM765841F-GCCACTCTGAAGAGGACAGG
R-TTTGGTTGTCTTTGGTCGAA
ef1αAF184170F-CTTCAACGCTCAGGTCATCAT
R-GCACAGCGAAACGACCAAGGGGA
18SAM490061F-CTTCAACGCTCAGGTCATCAT
R-AGTTGGCACCGTTTATGGTC
Table 3. Physical characteristics of fillets from gilthead seabream fed the different dietary treatments analyzed before (day 0) and after 110 days of frozen storage.
Treatment, TStorage, Sp-ValueRMSE
CTRP5P10E0.5E10110TS
Weight, g74.9172.4567.4267.1271.5671.7069.680.8350.68819.347
L*53.1154.1053.8753.8854.4748.6559.130.725<0.00012.391
a*−1.75−1.73−1.51−1.89−1.84−0.48−3.010.790<0.00010.764
b*0.200.78−0.06−0.29−0.66−0.530.520.1720.00721.450
pH6.066.066.146.116.066.046.140.1630.00030.098
Shear force, N43.1241.3349.1840.5744.1240.9446.390.3600.06411.127
WHC, %73.3177.9376.1778.4378.4886.8766.850.608<0.00019.165
CTR: control diet (without HBP and HBP_SFE); P5 and P10: diets including 5% or 10% of honeybee pollen (HBP), respectively; E0.5 and E1: diets including 0.5% or 1% of supercritical fluid extract (SFE) of HBP (HBP_SFE), respectively. WHC: water holding capacity. ns: not significant (p > 0.05); the interaction T × S is not reported because not significant (p > 0.05). RMSE: Root Mean Square Error.
Table 4. Moisture, total lipids (g/100 g of fillet) and fatty acid profile (g FA/100 g FAME) of fillets from gilthead seabream fed the different dietary treatments, analyzed before (day 0) and after 110 days of frozen storage.
Treatment, TStorage, Sp-ValueRMSE
CTRP5P10E0.5E10110TS
Moisture61.3560.1763.0562.6161.2767.5855.810.788<0.00016.100
Total lipids9.319.798.758.819.1610.118.220.8410.0032.26
Fatty acids
C14:02.182.192.182.212.162.102.270.878<0.00010.11
C16:012.4312.4812.2512.5212.3512.0712.740.461<0.00010.41
C16:1n-73.563.533.533.603.493.463.620.5870.00030.16
C18:03.103.103.153.033.153.093.120.2450.4220.15
C18:1n-932.4132.1432.3432.5632.1032.3532.280.1440.6040.50
C18:1n-72.692.692.662.712.682.692.680.2120.5350.06
C18:2n-622.0122.0222.1721.9122.0722.1021.980.8720.0070.01
C18:3n-33.86 ab3.90 ab3.84 b3.85 b3.99 a3.933.840.0260.0080.12
C20:1n-91.55 ab1.62 a1.47 b1.53 ab1.61 a1.591.520.0010.0040.08
C20:5n-32.392.352.432.382.472.442.360.1850.1830.13
C22:5n-31.231.241.271.201.231.291.180.373<0.00010.08
C22:6n-35.585.425.705.435.595.645.450.5740.1040.46
Σ SFA18.5618.6418.4618.5918.5318.1318.980.869<0.00010.47
Σ MUFA42.4242.3642.1342.6642.2142.3742.340.3960.8910.67
Σ n-6PUFA23.8623.9324.1223.8123.8624.0823.750.7220.4050.58
Σ n-3PUFA14.4114.2914.5414.2014.6414.6814.160.3990.0020.61
CTR: control diet (without HBP and HBP_SFE); P5 and P10: diets including 5% or 10% of honeybee pollen (HBP), respectively; E0.5 and E1: diets including 0.5% or 1% of supercritical fluid extract (SFE) of HBP (HBP_SFE), respectively. SFA: saturated fatty acids; MUFA: monounsaturated fatty acids; PUFA: polyunsaturated fatty acids. ns: not significant (p > 0.05); a, b: means with different superscript letters are significantly different (p < 0.05) among diets; the interaction T × S is not reported because not significant (p > 0.05). RMSE: Root Mean Square Error. The following FAs, found below 1% of the total FAME, were utilized for calculating the Ʃ classes of FAs but they are not listed: C12:0, C13:0, C14:1n-5, C15:0, C16:1n-9, C16:2n-4, C16:3n-4, C17:0, C17:1, C18:2n-4, C18:3n-4, C18:4n-1, C18:4n-3, C20:0, C20:1n-11, C20:1n-7, C20:2n-6, C20:3n-3, C20:3n-6, C20:4n-3, C21:5n-3, C22:0, C22:1n-7, C22:1n-9, C22:1n-11, C22:2n-6, C22:4n-6, C22:5n-6, C24:0.
Table 5. Conjugated dienes (CD, mmol Hp/100 g fillet), and TBARS content (mg MDA-eq./kg fillet) determined on fillets from gilthead seabream fed the different dietary treatments analyzed before (day 0) and after 110 days of frozen storage.
Treatment, TStorage, Sp-ValueRMSE
CTRP5P10E0.5E10110TS
CD0.2620.2740.2630.2370.2300.2430.2630.6280.3220.079
TBARS0.8630.9790.7620.9130.8580.6271.1230.409<0.00010.271
CTR: control diet (without HBP and HBP_SFE); P5 and P10: diets including 5% or 10% of honeybee pollen (HBP), respectively; E0.5 and E1: diets including 0.5% or 1% of supercritical fluid extract (SFE) of HBP (HBP_SFE), respectively. ns: not significant (p > 0.05); the interaction T × S is not reported because not significant (p > 0.05). RMSE: Root Mean Square Error.
Publisher’s Note: MDPI stays neutral with regard to jurisdictional claims in published maps and institutional affiliations.

