
Cheese and Butter as a Source of Health-Promoting Fatty Acids in the Human Diet

Department of Commodity Science and Food Analysis, The Faculty of Food Science, University of Warmia and Mazury in Olsztyn, 10-719 Olsztyn, Poland
Animals 2022, 12(23), 3424; https://doi.org/10.3390/ani12233424
Submission received: 19 October 2022
/
Revised: 22 November 2022
/
Accepted: 2 December 2022
/
Published: 5 December 2022
(This article belongs to the Special Issue Nutritional Quality Assessment in Milk and Dairy Products)
Abstract
:Simple Summary
Cheese and butter are dairy products that are very popular among consumers. Technological progress has led to a multitude of cheese types available on the market, varying in texture and flavor. Cheeses are an important source of a wide variety of biologically active substances, among which specific fatty acids are of utmost importance. Butter is the oldest animal fat known to man and occupies an important place among the fat products on the market. Butter is a product with high nutritional value and health-promoting properties, as well as great flavor and aroma values. The quality of milk fat is determined, primarily, by the composition of its fatty acids, the properties of which depend on the length of the carbon chain and the presence of unsaturated bonds. The fatty acid composition of cheese and butter varies according to milk origin (e.g., species and breed), rearing conditions (e.g., feeding), and, in the case of cheese, it also depends on cheese-making technology. This work presents the fatty acid composition, including the contents of CLA and trans C18:1 and C18:2 isomers, in fat extracted from cheeses and butters available on the Polish market and the comparison of their lipid quality indices.
Abstract
The assessment of fatty acid composition, including the content of conjugated linoleic acid cis9trans11 C18:2 (CLA) and trans C18:1 and C18:2 isomers in fat extracted from selected high-fat dairy products commonly available to consumers in retail sale on the Polish market, and a comparison of their indicators as to the quality of lipids was the aim of the study. The experimental materials were hard cheeses, white-mold cheeses, blue-veined cheeses, and butters. The conducted study demonstrated that various contents of groups of fatty acids and the values of lipid quality indices were found in the tested products. Butters turned out to be richer sources of short-chain, branched-chain, and odd-chain fatty acids. The fat extracted from butters and white-mold cheeses had a significantly higher (p < 0.05) content of n-3 fatty acids. Lower values of the n-6/n-3 ratio were determined in the fat extracted from butters and white-mold cheeses. The highest values of the thrombogenicity index (TI) were found in fat extracted from hard cheeses. Significantly lower values (p < 0.05) of the atherogenicity index (AI) and values of the H/H ratio were found in fat from mold cheeses. Fat from butters and white-mold cheeses had a significantly higher (p < 0.05) content of CLA and total content of trans C18:1.
1. Introduction
Milk and dairy products are an important dietary source of essential nutrients, such as protein, vitamins, minerals, and fat, including various fatty acids (FAs) [1,2]. Milk fat consists of more than 400 different fatty acids and is the most complex fat of all fats found in the human diet [3,4]. The quantitative composition of fatty acids in cow’s milk changes under the influence of multiple factors, including the feeding system of the animals, breed of the cows, lactation period, individual characteristics and health status of cows, and others [5,6]. Out of these factors, the most significant effect is ascribed to the feeding system [7,8,9,10,11,12]. In the human diet, milk and dairy products are important sources of saturated fatty acids (SFA), including the C12:0, C14:0, and C16:0 acids. These products also contain other fatty acids that have a beneficial effect on our health, including butyric acid (C4:0), branched fatty acids (BCFA), odd fatty acids (OCFA), oleic acid (cis9 C18:1), and the conjugated linoleic fatty acid cis9trans11 C18:2 (CLA) [13]. Milk fat is also the richest dietary source of natural trans fatty acid isomers, mainly vaccenic acid (trans11 C18:1, VA), which has opposite beneficial properties compared to artificial trans fatty acids in partially hydrogenated oils [14,15]. This acid, constituting over 50% of all trans isomers of C18:1 acid in milk fat, has been shown to exhibit anticarcinogenic and antiatherosclerosis effects [16].
Cheese and butter are dairy products that are very popular among consumers [17]. Cheese is defined as the fresh or matured product obtained from the coagulation of milk. There are many types of cheese on the market today. These cheeses differ, among other things, in texture and flavor. The cheese types can be classified according to the milk used (cow, sheep, goat, buffalo), their manufacture (rennet, sour milk cheese), consistency (extra-hard, hard, semi-hard, semi-soft, soft, fresh cheese), fat content (double cream, cream, full fat, three-quarters fat, half fat, quarter fat cheese), fermentation type (lactic acid, lactic and propionic acid, butyric acid), and surface (hard, soft, with smear, molds) [13]. Additionally, cheeses differ in flavor as well as some bioactive components formed during different stages of ripening when the main ingredients, i.e., lactose, protein, and fat, are broken down by fermentation, proteolysis, and lipolysis [18,19,20]. Cheeses are an important source of a wide range of biologically active substances, among which certain fatty acids are of particular importance. Mold cheeses belong to a specific group of ripened rennet cheeses which, when ripened in suitable conditions, develop exquisite flavors, aroma, and texture resulting from the presence of selected microbiological bacteria and production methods [21,22,23,24]. They fall into the category of rennet cheeses made from milk and rennet. Depending on the method of production adopted, they are divided into white-mold cheeses, such as Camembert and Brie, and blue-green-veined cheeses, such as Roquefort. The first are produced with white mold cultures of Penicillium camemberti or Penicillium candidum and feature a soft texture, creamy color, no holes, melting in the mouth, and a mild aroma, as well as a mushroom, slightly spicy, bitter-sour taste. In turn, strains of the species Penicillium roqueforti, Penicillium gorgonzola, or Penicillium glaucum are used to make the blue-veined cheeses characterized by mold growth throughout the bulk of the cheese, which has a semi-soft consistency. After a few weeks of ripening, these cheeses acquire a mild, slightly sour mushroom aftertaste. As they ripen, their taste and aroma become sharper, and their consistency turns more crumbly. In Poland, mold cheeses are less popular than hard cheeses. They can be eaten as elements of sandwiches, they can be used as ingredients in salads and casseroles, or they can also be consumed as a snack [25]. Mold cheeses have a high energy value, and due to their high-fat content (from 24% to 32%), they also are a great source of calcium [26]. Butter is the oldest animal fat known to man and occupies an important place among the fat products on the market. It is a high-fat product manufactured exclusively from cow’s milk as a result of the so-called churning of specially prepared sour or sweet cream. Both cream and cream intended for the production of butter should contain at least 25–35% fat [27]. Butter is a product with high nutritional value and health-promoting properties, as well as great flavor and aroma values. It is a high-fat product containing at least 80% but not more than 90% fat. Butter is a readily purchased product and its greatest advantages, according to consumers, include its taste, its health-promoting properties, and the fact that it is a natural product [28]. The quality of milk fat is determined, primarily, by the composition of its fatty acids, the properties of which depend on the length of the carbon chain and the presence of unsaturated bonds. The fatty acid composition of cheese and butter varies according to milk origin (e.g., species and breed), rearing conditions (e.g., feeding), and, in the case of cheese, it also depends on cheese-making technology (e.g., coagulation process, the addition of salt, ripening period) [19]. The fatty acids of the cheese fat are necessary for the appropriate sensory properties of the cheese and for the development of its flavor during ripening [24].
The composition of fatty acids in dairy products, including hard cheeses made from the milk of various ruminants, has been the subject of many studies [29,30,31,32,33,34,35,36,37,38], whereas other reports have focused on the assessment of the fatty acid profile in blue cheeses [36,38,39,40] and butter [36,41,42,43,44]. A rich assortment of butter and cheese available on the Polish market is largely attributed to the high intake and popularity of those products among Polish consumers. Taking into account the fact that the composition of these products may change as a result of changes in the quality of the raw material or various parameters used in technological processes, the constant monitoring of their quality is of great importance from a nutritional point of view. Therefore given that the fatty acid profile of milk and dairy products is an important factor affecting their nutritional value, the aim of this study was to determine the composition of fatty acids, with special emphasis on the concentrations of conjugated linoleic acid cis9trans11 C18:2 (CLA), trans C18:1 and C18:2 isomers, and the lipid quality indices in selected cheeses (hard and mold) and butters commonly available to consumers in retail sale on the Polish market.
2. Materials and Methods
2.1. Samples
The research materials were 40 samples of different dairy products with high fat content, including 10 samples of hard cheeses with contents of fat ranging from 26% to 28% (Gouda, Edamski, Podlaski, Królewski, Salami, Włoszczowski, Edam, Sokół, Złoty Mazur), 10 samples of white-mold cheeses containing from 24% to 32% of fat (Brie Mlekovita, Brie Turek, Brie Valbon, Brie Hochland, Brie President, Camembert Mlekovita, Camembert Turek, Camembert Valbon, Camembert President, Camembert Hochland), 10 samples of blue-veined cheeses with the fat content of 29% to 32% (NaTurek GrandBlue, Lazur Blękitny, Lazur Srebrny, Valbon Blue, Rokpol, Carrefour Classic, Mlekovita La Polle Polish Bleu, Turek Blue, Bakoma Regnum Blue, Pilos Blue), and 10 samples of butter with 82% fat (Ekstra Polmlek, Ekstra OSM w Kole, Ekstra łowickie, Ekstra ze Sztrzałkowa, Mazurskie, Polskie, Ekstra Piątnica, Ekstra Mazurski Smak, Ekstra Pilos, Wiejskie). All of the analyzed products were made from cow’s milk, produced by various manufacturers in Poland, and were available on the Polish market from June to July. Each sample was analyzed in duplicate.
2.2. Methods
2.2.1. Lipid Extraction
Folch’s method was used to extract the fat from the analyzed cheeses [45]. Fat from butter was separated by melting at 40 °C, decantation, and filtering through anhydrous sodium sulfate.
2.2.2. Preparation of Fatty Acid Methyl Esters
Fatty acids were converted into the corresponding fatty acid methyl esters (FAME) according to the IDF standard method (ISO 15884:2002) [46].
2.2.3. Analysis of Fatty Acid Composition by GC Method
The methyl esters obtained in the process were then analyzed by gas chromatography (GC). Chromatographic separation was performed using a Hewlett-Packard 6890 gas chromatograph (Műnster, Germany) with a flame-ionization detector (FID) and a capillary column with a length of 100 m and an internal diameter of 0.25 mm (Chrompack, Middelburg, The Netherlands). The liquid phase was CP Sil 88 and the film thickness was 0.20 μm. The conditions of separation were as follows: carrier gas: helium, 1.5 mL/min flow rate; column temperature: 60 °C, 5 °C/min increase to 180 °C; detector temperature: 250 °C; injector temperature: 225 °C. The sample injection volume was 0.4 μL (split: 50:1). The identification of fatty acid methyl esters was carried out by comparing their retention times with the retention time of the fatty acid methyl esters of the reference milk fat (BCR Reference Materials) with the CRM 164 symbol (Aldrich, Taufkirchen, Germany) and for the C18:1 and C18:2 positional trans isomers, the methyl ester standards of these isomers (Sigma-Aldrich, Germany and Supelco, Bellefonte, PA, USA) were used. Amounts of fatty acids, CLA contents, and trans C18:1 and C18:2 isomers were calculated in mg/g of fat with respect to the introduced standard (methyl ester of C21:0 acid).
2.2.4. The Lipid Quality Indices
The lipid quality indices Index of Atherogenicity (AI) and Index of Thrombogenicity (TI) were calculated according to the fatty acid composition using the following formulae [47,48]:
AI = (C12:0 + (4 × C14:0) + C16:0)/(Σn-3 PUFA + Σn-6 PUFA + Σ MUFA)
TI = (C14:0 + C16:0 + C18:0)/((0.5 × C18:1) + (0.5 × other MUFA) + (0.5 × Σn-6 PUFA) + (3 × Σn-3 PUFA) + Σn-3 PUFA/Σn-6PUFA)
The hypocholesterolemic/hypercholesterolemic ratio (H/H) was calculated according to Ivanova and Hadzhinikolova (2015) [49]:
H/H = (C18:1n-9 + C18:2n-6 + C18:3n-3)/(C12:0 + C14:0 + C16:0)
2.2.5. Statistical Analysis
The statistical analyses were performed using the Statistica version 13.1 program (Statsoft, Cracow, Poland) [50]. All statistically significant differences were calculated at p < 0.05. Due to the data being defined as having a normal distribution (the Shapiro–Wilk test was performed), to determine the differences between mean values, Duncan’s test was used.
3. Results and Discussion
3.1. Fatty Acid Composition and Lipid Quality Indices in the Fat from the Analyzed Products
The fatty acid compositions of the fats extracted from the analyzed products are presented in Table 1 and the sum of fatty acids and lipid quality indices are presented in Table 2. In milk fat, saturated fatty acids (SFAs) are the predominant class of fatty acids (FA) [51]. They are unique, as they comprise a wide and complex variety of SFAs, including short-chain fatty acids (SCFAs), odd-chain fatty acids (OCFAs), and branched-chain fatty acids (BCFAs) [3,4]. In the fat from the analyzed products, the content of saturated fatty acids (SFAs) varied (Table 2), being significantly (p < 0.05) lower in hard cheeses (on average, 356.44 mg/g of fat ± 40.29) compared to the other analyzed dairy products (Table 2). The highest content of these acids (on average, 502.78 mg/g of fat ± 17.34) was found in the fat extracted from the analyzed butter samples, which had a significantly (p < 0.05) higher content of branched-chain fatty acids (BCFAs), odd-chain fatty acids (OCFAs), and short-chain fatty acids (SCFAs) (Table 2). The conducted research showed that in fat extracted from white-mold and blue-veined cheeses, the MUFA content was at a similar level (Table 1). A significantly higher (p < 0.05) content of these acids was in the fat from the analyzed butters (on average 225.16 mg/g of fat ± 5.95) and was significantly lower in the fat from the analyzed hard cheeses (on average, 146.21 mg/g of fat ± 23.66) (Table 2). Oleic acid (cis9 C18:1) was the main MUFA acid present in the fat extracted from all the analyzed products (Table 1). This acid exhibits anti-cancer, anti-inflammatory, and anti-atherogenic properties [41]. The fat extracted from butter contained significantly higher (p < 0.05) amounts of PUFAs (on average, 24.89 mg/g of fat ± 1.61) compared to the other analyzed products (Table 2). The lowest PUFA contents were found in the fat extracted from hard cheeses (on average, 16.07 mg/g of fat ± 2.92). The fat extracted from butters and white-mold cheeses had significantly higher (p < 0.05) contents of n-3 acids and a lower n-6/n-3 ratio compared to the fat from hard cheeses and blue-veined cheeses (Table 2). The fat extracted from butter had the highest content of n-6 PUFAs (on average, 13.06 mg/g of fat ± 0.89). The content of these acids in the fat extracted from white-mold and blue-veined cheeses was significantly lower (on average, 10.70 ± 1.08 and 10.64 mg/g of fat ± 1.18, respectively). The lowest n-6 PUFA contents were determined in the fat extracted from hard cheeses (on average, 9.14 mg/g of fat ± 1.91).
Consuming dairy products that contain high levels of saturated fatty acids is often associated with the development of many diseases. However, given that food is composed of a number of different fatty acids, each of which may affect lipoprotein metabolism in a different way and carry the risk of developing many diseases, it indicates that the relationship between SFA and the occurrence of these diseases may be less obvious than expected [52,53,54]. The short-chain fatty acids (SCFA) present in milk fat are important in promoting human health. Among other things, butyric acid has been shown to be anti-inflammatory and to prevent the progression of colorectal and mammary cancer [55,56]. In turn, branched-chain fatty acids (BCFA) have been demonstrated to elicit anti-carcinogenic effects [57,58]. Research carried out in 2019 showed that the average content of SCFAs in the fat from commercial cheeses purchased from May to June was 62.04 mg/g of fat, and of SFAs, 404.96 mg/g of fat. In the fat extracted from the butter samples, these contents were 100.24 mg/g of fat and 505.78 mg/g of fat, respectively [36]. The average MUFA content in these cheeses was 179.90 mg/g of fat and it reached 222.00 mg/g of fat in the fat extracted from the butter samples. The average content of PUFAs in the fat extracted from these products was at a similar level [36]. Dietary n-3 PUFAs can be helpful for heart disease prevention and immune response improvement. Linolenic acid (C18:3) has been shown to exhibit anti-carcinogenic and anti-atherogenic properties [59,60,61], whereas n-6 PUFAs are said to improve sensitivity to insulin and thus reduce the incidence of type 2 diabetes [62]. The proportions of the individual groups of fatty acids in food products are of particular importance from a nutritional point of view. Excessive amounts of n-6 polyunsaturated fatty acids (PUFA) and a very high n-6/n-3 ratio in a diet promotes the pathogenesis of many diseases, whereas increased levels of n-3 PUFA (a low n-6/n-3 ratio) exert suppressive effects [47,63,64,65].
In the presented study, the value of the atherogenicity index (AI) determined for hard cheeses was 3.40 ± 0.43 and was significantly higher (p < 0.05) compared to the butters (3.09 ± 0.15) and white-mold and blue-veined cheeses (2.69 ± 0.18 and 2.72 ± 0.04, respectively). The thrombogenicity index (TI) value was the highest in hard cheeses, i.e., 4.02 ± 0.42 (Table 2). A significantly (p < 0.05) lower value was found in the analyzed mold cheeses and butters. The white-mold and blue-veined cheeses were characterized by similar values of H/H (0.26) (Table 2). A significantly higher H/H ratio was found in the analyzed hard cheeses and butters (0.43 and 0.46, respectively). In the fat extracted from cheeses bought on the Polish market from May to June 2019, the AI was 3.19 and the TI was 3.80. In the fat extracted from butter, the values of these indicators were 3.12 and 3.63, respectively [36]. In the Camembert cheeses analyzed by Adamska et al. [39], the AI ranged from 2.81 to 3.32 and TI ranged from 3.09 to 3.77. In the Brie cheeses, the AI ranged from 2.80 to 3.31 and TI ranged from 3.15 to 3.69. The AI in summer butters analyzed by Blaško et al. [66] was 2.19. In winter butters, it was 2.72. As reported by Ulbrichta and Southgate [47], the AI and TI are better indicators of the atherogenic and thrombogenic potential of a diet than the PUFA/SFA ratio. These indicators take into account the various effects that individual fatty acids can have on human health. The AI and TI indices indicate the likelihood of an increase in the incidence of pathogenic events such as atherosclerosis and/or thrombus formation. The TI value shows the tendency of blood clots to form in the blood vessels. In contrast, the AI value indicates a relationship between the sum of the major saturated fatty acids (SFA) and the sum of the major classes of unsaturated fatty acids (UFA). A low AI value indicates that milk and dairy products could provide protection against coronary heart disease. The higher the AI, the more atherogenic components in the diet.
According to Wang et al. [67], the H/H ratio is related to the functional activity of fatty acids in the metabolism of lipoproteins for the transport of cholesterol in the plasma and to the risk of developing cardiovascular diseases. Higher values of this ratio are desirable. The H/H ratio determined for the fat extracted from hard cheeses and butters bought on the Polish market from May to June 2019 was 0.45 [36].
3.2. The Contents of cis9trans11 C18:2 (CLA) and trans C18:1 and C18:2 Fatty Acids in the Fat from the Analyzed Products
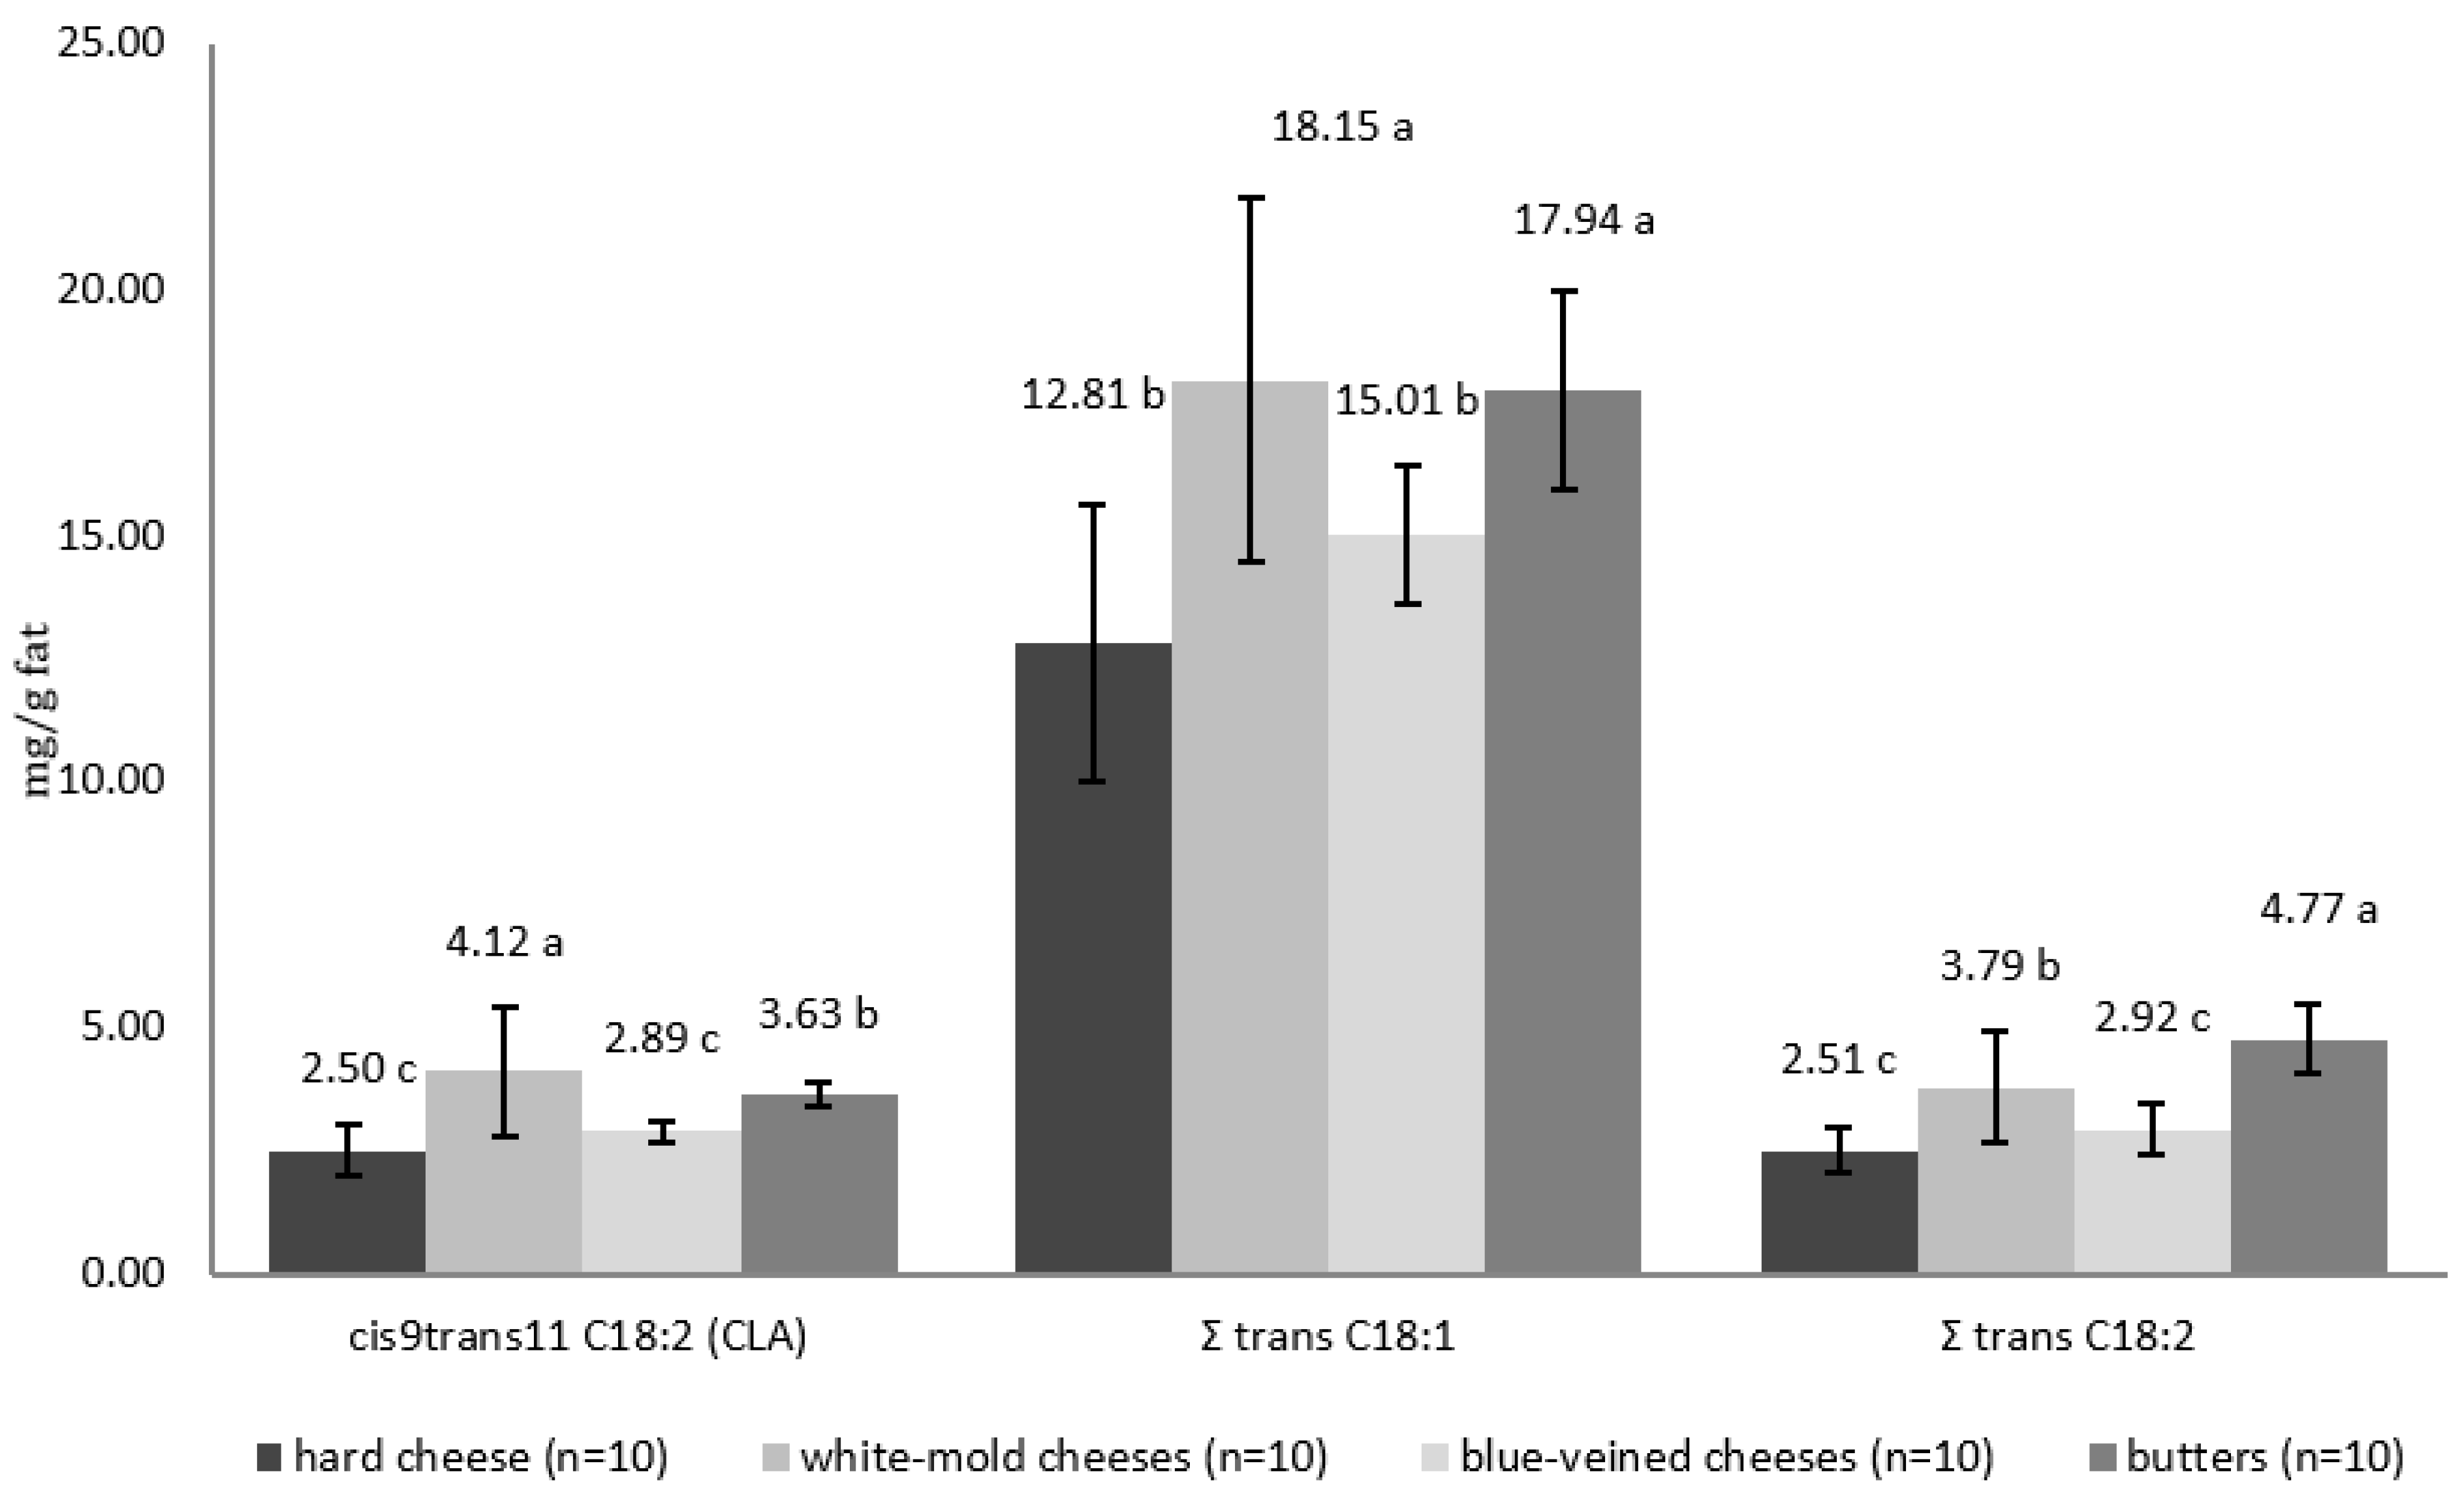
The contents of cis9trans11 C18:2 (CLA) and the trans isomers of C18:1 and C18:2 acids in the fat extracted from hard cheeses, blue cheeses, and butter are shown in Figure 1. The acid cis9trans11 C18:2 (CLA) is the main isomer of CLA in food. In milk and dairy products, it accounts for over 80–90% of the total CLA content. [3,68,69]. The analyzed products had different amounts of this acid. Conjugated linoleic acid cis9trans11 C18:2 (CLA) has a number of health-promoting properties, including anti-carcinogenic, antiatherosclerotic, antioxidant, and anti-inflammatory effects [70,71,72,73,74,75,76]. Its content in milk fat ranges from 2.3 to 6.0 mg/g of fat [77,78] and may be affected by many factors such as the animal feeding regime, breed, and age, as well as the lactation period [79,80,81,82,83,84]. The content of CLA in dairy products (cheeses and fermented drinks) is influenced by the conditions of technological processes, the additives used, the activity of the starter cultures added, and the ripening time [85,86,87].
The conducted research showed that the fat extracted from white-mold cheeses had the highest mean CLA content (4.12 mg/g of fat ± 1.31) (Figure 1). In the fat from butter, the mean content was 3.63 mg/g of fat ± 0.25, whereas significantly (p < 0.05) lower contents were determined in the fat from the blue-veined cheeses and hard cheeses, i.e., 2.89 mg/g ± 0.23 fat and 2.50 mg/g of fat ± 0.52, respectively. According to Seçkin et al. [88], the CLA content ranged from 1.50 mg/g of fat to 3.63 mg/g of fat in Turkish processed cheeses, and from 2.85 mg/g to 4.67 mg/g of fat in butter. The mean content of CLA in the fat extracted from cheeses bought on the Polish market from May to June 2019 was 3.44 mg/g of fat, and in the fat extracted from butter, it was 3.63 mg/g of fat [36]. In the mold-type cheeses studied by Lin et al. [89], the CLA content was 4.75 mg/g of fat in Brie cheese and 4.87 mg/g of fat and 7.96 mg/g of fat in blue cheeses. In white-mold cheeses (seven Camembert-type cheeses and three Brie-type cheeses) tested by Białek and Tokarz [90], the CLA content ranged from 1.74 mg/g of fat to 3.07 mg/g of fat, and in the blue-veined ones, it ranged from 1.66 mg/g of fat to 2.39 mg/g of fat. The average content of CLA in the Gorgonzola-type cheeses analyzed by Prandini et al. [35] was 5.16 mg/g of fat, whereas, in the Brie cheese studied by Nunez and Torres [91], it was 3.8 mg/g of fat.
The average total content of trans isomers of C18:1 acid was the highest in the fat extracted from white-mold cheeses (18.15 mg/g of fat). A similar content of these isomers was found in the fat extracted from butter (17.94 mg/g of fat) (Figure 1), while it was significantly (p < 0.05) lower in the fat extracted from the blue-veined cheeses and hard cheeses. Monounsaturated fatty acids with 18 carbon atoms are the most important natural trans fatty acids (TFA) in the human diet. The major trans C18:1 isomer in milk fat, i.e., trans11 acid (vaccenic acid, VA), has been reported to exert anti-tumor and antiatherosclerotic effects [92]. The highest content of trans C18:2 isomers was found in the fat extracted from butter (4.77 mg/g of fat). The white-mold and blue-veined cheeses had significantly (p < 0.05) lower contents of these isomers (Figure 1).
4. Conclusions
The presented research provided basic knowledge on the content of the fatty acids and lipid quality indices of dairy products. It demonstrated that the fat extracted from the analyzed cheeses and butters had various contents of fatty acid groups, conjugated linoleic acid cis9trans11 C18:2, and trans C18:1 and C18:2 isomers, as well as various values of the lipid quality indices. This information is important for consumers who plan to follow a healthy and rational diet, as they are increasingly more aware of the impact of consumed products on their health and therefore want to choose products with high sensory values, high quality, and appropriate health-promoting potential.
Funding
This research received no external funding.
Institutional Review Board Statement
Not applicable.
Informed Consent Statement
Not applicable.
Data Availability Statement
Data is contained within the article.
Acknowledgments
I would like to thank Bogumiła Kowalska for helping with the analytical part of this study.
Conflicts of Interest
The author declares no conflict of interest.
References
- Pfeuffer, M.; Watzl, B. Nutrition and health aspects of milk and dairy products and their ingredients. Ernahr. Umschau Sci. Res. 2017, 65, 22–33. [Google Scholar]
- Górska-Warsewicz, H.; Rejman, K.; Laskowski, W.; Czeczotko, M. Milk and Dairy Products and Their Nutritional Contribution to the Average Polish Diet. Nutrients 2019, 11, 1771. [Google Scholar] [CrossRef] [PubMed] [Green Version]
- Jensen, R.G. The Composition of Bovine Milk Lipids: January 1995 to December 2000. J. Dairy Sci. 2002, 85, 295–350. [Google Scholar] [CrossRef] [PubMed]
- Månsson, H.L. Fatty acids in bovine milk fat. Food Nutr. Res. 2008, 52, 1821. [Google Scholar] [CrossRef] [PubMed] [Green Version]
- Hanuš, O.; Krížová, L.; Samková, E.; Špička, J.; Kučera, J.; Klimešová, M.; Roubal, P.; Jedelská, R. The effect of cattle bread, season and type of diet on the fatty acid profile of raw milk. Arch. Anim. Breed. 2016, 59, 373–380. [Google Scholar] [CrossRef] [Green Version]
- Sanjayaranj, I.; Lopez-Villalobos, N.; Blair, H.T.; Janssen, P.W.M.; Holroyd, S.E.; MacGibbon, A.K.H. Effect of Breed on the Fatty Acid Composition of Milk from Dairy Cows Milked Once and Twice a Day in Different Stages of Lactation. Dairy 2022, 3, 608–621. [Google Scholar] [CrossRef]
- Clarke, H.J.; Griffin, C.; Rai, D.K.; O’Callaghan, T.F.; O’Sullivan, M.G.; Kerry, J.P.; Kilcawley, K.N. Dietary compounds influencing the sensorial, volatile and phytochemical properties of bovine milk. Molecules 2019, 25, 26. [Google Scholar] [CrossRef] [Green Version]
- Capuano, E.; Gravink, R.; Boerrigter-Eenling, R.; van Ruth, S.M. Fatty acid and triglycerides profiling of retail organic, conventional and pasture milk: Implications for health and authenticity. Int. Dairy J. 2015, 42, 58–63. [Google Scholar] [CrossRef]
- Bär, C.; Sutter, M.; Kopp, C.; Neuhaus, P.; Portmann, R.; Egger, L.; Reidy, B.; Bisig, W. Impact of herbage proportion, animal breed, lactation stage and season on the fatty acid and protein composition of milk. Int. Dairy J. 2020, 109, 104785. [Google Scholar] [CrossRef]
- Magan, J.B.; O’Callaghan, T.F.; Kelly, A.L.; McCarthy, N.A. Compositional and functional properties of milk and dairy products derived from cows fed pasture or concentrate-based diets. Compr. Rev. Food Sci. Food Saf. 2021, 20, 2769–2800. [Google Scholar] [CrossRef]
- Liu, S.; Zhang, R.; Kang, R.; Meng, J.; Ao, C. Milk fatty acids profiles and milk production from dairy cows fed different forage quality diets. Anim. Nutr. 2016, 2, 329–333. [Google Scholar] [CrossRef]
- Frelich, J.; Šlachta, M.; Hanuš, O.; Špička, J.; Samková, E.; Węglarz, A.; Zapletal, P. Seasonal variation in fatty acid composition of cow milk in relation to the feeding system. Anim. Sci. Pap. Rep. 2012, 30, 219–229. [Google Scholar]
- Prado, L.A.; Schmidely, P.; Nozière, P.; Ferlay, A. Milk saturated fatty acids, odd- and branched-chain fatty acids and isomers of C18:1, C18:2, and C18:3 n-3 according to their duodenal flows in dairy cows: A meta-analysis approach. J. Dairy Sci. 2019, 102, 3053–3070. [Google Scholar] [CrossRef] [Green Version]
- Pipoyan, D.; Stepanyan, S.; Stepanyan, S.; Beglaryan, M.; Costantini, L.; Molinari, R.; Merendino, N. The Effect of Trans Fatty Acids on Human Health: Regulation and Consumption Patterns. Foods 2021, 10, 2452. [Google Scholar] [CrossRef]
- Oteng, A.B.; Kersten, S. Mechanisms of Action of trans Fatty Acids. Adv. Nutr. 2020, 11, 697–708. [Google Scholar] [CrossRef] [Green Version]
- Shingfield, K.J.; Chilliard, Y.; Toivonen, P.; Kairenius, P.; Givens, D.I. Trans fatty acids and bioactive lipids in ruminant milk. Adv. Exp. Med. Biol. 2008, 606, 3–65. [Google Scholar] [CrossRef]
- Piekut, M. Production and consumption of cheese in Poland. Dairy Rev. 2012, 7, 36–38. [Google Scholar]
- Walther, B.; Schmid, A.; Sieber, R.; Wehrmüller, K. Cheese in nutrition and health. Dairy Sci. Technol. 2008, 88, 389–405. [Google Scholar] [CrossRef] [Green Version]
- Zheng, X.; Shi, X.; Wang, B. A Review on the General Cheese Processing Technology, Flavor Biochemical Pathways and the Influence of Yeasts in Cheese. Front. Microbiol. 2021, 12, 703284. [Google Scholar] [CrossRef]
- Czechowska-Liszka, M. Jakość serów podpuszczkowych dojrzewających dostępnych w handlu detalicznym na terenie Krakowa. Zesz. Nauk. UEK 2007, 743, 135–147. [Google Scholar]
- Calzada, J.; del Olmo, A.; Picon, A.; Nuῆez, M. Effect of high-pressure-processing on lipolysis and volatile compounds of Brie cheese during ripening and refrigerated storage. Int. Dairy J. 2014, 39, 232–239. [Google Scholar] [CrossRef]
- Galli, B.D.; José Guilherme Prado Martin, J.G.; Moreira da Silva, P.P.; Porto, E.; Fillet Spoto, M.H. Sensory quality of Camembert-type cheese: Relationship between starter cultures and ripening molds. Int. J. Food Microbiol. 2016, 234, 71–75. [Google Scholar] [CrossRef] [PubMed]
- Diezhandino, I.; Fernández, D.; Sacristán, N.; Combarros-Fuertes, P.; Prieto, B.; Fresno, J.M. Rheological, textural, colour and sensory characteristics of a Spanish blue cheese. LWT Food Sci. Technol. 2016, 65, 1118–1125. [Google Scholar] [CrossRef]
- McSweeney, P.L.H.; Sousa, M.J. Biochemical pathways for the production of flavour compounds in cheeses during ripening: A review. Lait 2000, 80, 293–324. [Google Scholar] [CrossRef]
- Bajek, E. Biała, szlachetna pleśń z charakterem. Forum Mlecz. Handel 2011, 2, 54–57. [Google Scholar]
- Dolganova, S.G.; Budaeva, A.B.; Khundanova, T.L.; Gomboeva, O.A.; Tsybikzhapov, A.D. Safety and quality assessment of cheeses with mold. IOP Conf. Ser. Earth Environ. Sci. 2020, 548, 082025. [Google Scholar] [CrossRef]
- PN-A-86155:1995; Mleko i Przetwory Mleczne. Masło. Polish Committee for Standardization: Warsaw, Poland, 1995.
- Chwastowska-Siwiecka, I.; Baryczka, M.J.; Mroziński, Ł. Analiza preferencji konsumenckich przy wyborze i zakupie masła. Przegl. Hod. 2019, 3, 26–31. [Google Scholar]
- Aguilar, C.; Toro-Mujica, P.; Vargas-Bello-Perez, E.; Vera, R.; Ugalde, C.; Rodriguez, S.; Briones, I. A comparative study of the fatty acid profiles in commercial sheep cheeses. Grasas Aceites 2014, 65, e048. [Google Scholar] [CrossRef] [Green Version]
- Milewski, S.; Ząbek, K.; Antoszkiewicz, Z.; Tański, Z.; Błażejek, J. Walory prozdrowotne serów z mleka owczego i koziego wytwarzanych w gospodarstwach Warmii i Mazur. Przegl. Hodow. 2016, 2, 20–22. [Google Scholar]
- Kawęcka, A.; Radkowska, I.; Sikora, J. Concentrations of selected bioactive components in traditional cheeses made from goat’s, cow’s and sheep’s milk. J. Elem. 2020, 25, 431–442. [Google Scholar] [CrossRef]
- Talpur, F.N.; Bhanger, M.I.; Memon, N.N. Fatty acid composition with emphasis on conjugated linoleic acid (CLA) and cholesterol content of Pakistani dairy products. Pol. J. Food Nutr. Sci. 2008, 58, 313–320. [Google Scholar]
- Donmez, M.; Seckin, A.K.; Sagdic, O.; Simsek, B. Chemical characteristics, fatty acid compositions, conjugated linoleic acid contents and cholesterol levels of same traditional Turkish cheeses. Int. J. Food Sci. Nutr. 2005, 56, 157–163. [Google Scholar] [CrossRef]
- Rutkowska, J.; Sadowska, A.; Tabaszewska, M.; Stołyhwo, A. Fatty acid composition of hard cheeses from north, eastern and central region of Poland. Bromat. Chem. Toksykol. 2009, 42, 263–269. [Google Scholar]
- Prandini, A.; SigoLo, S.; Piva, G. A comparative study of fatty acid composition and CLA concentration in commercial cheeses. J. Food Compos. Anal. 2011, 24, 55–61. [Google Scholar] [CrossRef]
- Paszczyk, B.; Łuczyńska, J. Fatty acids profile, conjugated linoleic acid contents and fat quality in selected dairy products available on the Polish market. Czech J. Food Sci. 2020, 38, 109–114. [Google Scholar] [CrossRef]
- Paszczyk, B.; Łuczyńska, J. The Comparison of Fatty Acid Composition and Lipid Quality Indices in Hard Cow, Sheep, and Goat Cheeses. Foods 2020, 9, 1667. [Google Scholar] [CrossRef]
- Gürsoy, O.; Seckin, A.K.; Kinik, O.; Metin, M. Conjugated linoleic acid (CLA) content of most popular Turkish hard and soft cheeses. Milchwissenschaft 2003, 58, 622–623. [Google Scholar]
- Adamska, A.; Rasińska, E.; Rutkowska, J.; Antoniewska, A. Fatty acid profile of commercial Camembert- and Brie-type cheeses availableon the Polish market. CyTA J. Food 2017, 15, 639–645. [Google Scholar] [CrossRef] [Green Version]
- Paszczyk, B.; Borejszo, Z.; Łuczyńska, J. Conjugated linoleic acid (CLA) and trans isomers of C18:1 and C18:2 acids in mould cheeses. Pol. J. Nutr. Sci. 2012, 27, 93–101. [Google Scholar]
- Rutkowska, J.; Adamska, A. Fatty acid composition of butter originated from north-eastern region of Poland. Pol. J. Food Nutr. Sci. 2011, 61, 187–193. [Google Scholar] [CrossRef] [Green Version]
- Păduret, S. The Effect of Fat Content and Fatty Acids Composition on Color and Textural Properties of Butter. Molecules 2021, 26, 4565. [Google Scholar] [CrossRef] [PubMed]
- Beitz, D.C. Texture of butter from cows with different milk fatty acid compositions. J. Dairy Sci. 2003, 86, 3122–3127. [Google Scholar]
- Staniewski, B.; Ogrodowska, D.; Staniewska, K.; Kowalik, J. The effect of triacylglycerol and fatty acid composition on the rheological properties of butter. Int. Dairy J. 2021, 114, 104913. [Google Scholar] [CrossRef]
- Christie, W.W. (Ed.) The isolation of lipids from tissues. Recommended Procedures. Chloroform-methanol(2:1,v/v) extraction and “Folch” wash. In Lipid Analysis. Isolation, Separation, Identification and Structural Analysis of Lipids; Pergamon Press: Oxford, UK; New York, NY, USA; Toronto, ON, Canada; Tokyo, Japan; Sydney, Australia; Braunschweig, Germany, 1973; pp. 39–40. [Google Scholar]
- ISO 15884:2002 (IDF 182:2002); Milkfat: Preparation of Fatty Acid Methyl Esters. ISO: Geneva, Switzerland, 2002.
- Ulbricht, T.L.V.; Southgate, D.A.T. Coronary heart disease: Seven dietary factors. Lancet 1991, 338, 985–992. [Google Scholar] [CrossRef]
- Osmari, E.K.; Cecato, U.; Macedo, F.A.F.; Souza, N.E. Nutritional quality indices of milk fat from goats on diets supplemented with different roughages. Small Rumin. Res. 2011, 98, 128–132. [Google Scholar] [CrossRef]
- Ivanova, A.; Hadzhinikolova, L. Evaluation of nutritional quality of common carp (Cyprinus carpio L.) lipidsthrough fatty acid ratios and lipid indices. Bulg. J. Agric. Sci. 2015, 21, 180–185. [Google Scholar]
- 50. STATISTICA Version 13.1 Software, StatsSoft: Kraków, Poland.
- Miciński, J.; Zwierzchowski, G.; Kowalski, I.M.; Szarek, J.; Pierożyński, B.; Raistenskis, J. The effects of bovine milk fat on human health. Pol. Ann. Med. 2012, 19, 170–175. [Google Scholar] [CrossRef]
- Unger, A.L.; Torres-Gonzalez, M.; Kraft, J. Dairy fat consumption and the risk of metabolic syndrome: An examination of the saturated fatty acids in dairy. Nutrients 2019, 11, 2200. [Google Scholar] [CrossRef] [Green Version]
- Lordan, R.; Zabetakis, I. Invited review: The anti-inflammatory properties of dairy lipids. J. Dairy Sci. 2017, 100, 4197–4212. [Google Scholar] [CrossRef] [Green Version]
- Lordan, R.; Tsoupras, A.; Mitra, B.; Zabetakis, I. Dairy fatsand cardiovascular disease: Do we really need to be concerned? Foods 2018, 7, 29. [Google Scholar] [CrossRef] [Green Version]
- Hanuš, O.; Samková, E.; Krížová, L.; Hasoňová, L.; Kala, R. Role of fatty acids in milk fat and the influence of selected factors on their variability—A Review. Molecules 2018, 23, 1636. [Google Scholar] [CrossRef] [Green Version]
- Gómez-Cortés, P.; Juárez, M.; Angel de la Fuente, M. Milk fat acids and potential health benefits: An update vision. Trends Food Sci. Technol. 2018, 81, 1–9. [Google Scholar] [CrossRef] [Green Version]
- Wongtangtintharn, S.; Oku, H.; Iwasaki, H.; Toda, T. Effect of branched-chain fatty acids on fatty acid biosynthesis of human breast cancer cells. J. Nutr. Sci. Vitaminol. 2004, 50, 137–143. [Google Scholar] [CrossRef]
- Adamska, A.; Rutkowska, J. Odd- and branched-chain fatty acids in milk fat—Characteristic and health properties. Postep. Hig. Med. Dosw. 2014, 68, 957–966. [Google Scholar] [CrossRef]
- Farag, M.A.; Gad, M.Z. Omega-9 fatty acids: Potential roles in inflammation and cancer management. J. Gen. Engin. Biotech. 2022, 20, 48. [Google Scholar] [CrossRef]
- Williams, C.M. Dietary fatty acids and human health. Ann. Zootech. 2000, 49, 165–180. [Google Scholar] [CrossRef] [Green Version]
- Haug, A.; Hostmark, A.T.; Harstad, O.M. Bovine milk in human nutrition: A review. Lipids Health Dis. 2007, 6, 25. [Google Scholar] [CrossRef] [Green Version]
- Arnould, V.M.-R.; Soyeurt, H. Genetic variability of milk fatty acids. J. Appl. Genet. 2009, 50, 29–39. [Google Scholar] [CrossRef] [Green Version]
- Wijendran, V.; Hayes, K.C. Dietary n-6 and n-3 fatty acid balance and cardiovascular health. Annu. Rev. Nutr. 2004, 24, 597–615. [Google Scholar] [CrossRef]
- Simopoulos, A.P. The importance of the ratio of omega-6/omega-3 essential fatty acids. Biomed. Pharm. 2002, 56, 365–379. [Google Scholar] [CrossRef]
- Simopoulos, A.P. The importance of the omega-6/omega-3 fatty acid ratio in cardiovascular disease and other chronic diseases. Exp. Biol. Med. 2008, 233, 674–688. [Google Scholar] [CrossRef] [PubMed]
- Blaško, J.; Kubinec, R.; Górová, R.; Fábry, I.; Lorenz, W.; Soják, L. Fatty acid composition of summer and winter cows milk and butter. J. Food Nutr. Res. 2010, 49, 169–177. [Google Scholar]
- Wang, H.H.; Garruti, G.; Liu, M.; Portincasa, P.; Wang, D.Q.H. Cholesterol and Lipoprotein Metabolism and Atherosclerosis: Recent Advances in Reverse Cholesterol Transport. Ann. Hepatol. 2017, 16, s27–s42. [Google Scholar] [CrossRef] [PubMed]
- Lock, A.; Bauman, D. Modifying milk fat composition of dairy cows to enhance fatty acids beneficial to human health. Lipids 2006, 39, 1197–1206. [Google Scholar] [CrossRef] [PubMed]
- Dachev, M.; Bryndová, J.; Jakubek, M.; Moučka, Z.; Urban, M. The Effects of Conjugated Linoleic Acids on Cancer. Processes 2021, 9, 454. [Google Scholar] [CrossRef]
- Bhattacharya, A.; Banu, J.; Rahman, M.; Causey, J.; Fernandes, G. Biological effects of conjugated linoleic acids in health and disease. J. Nutr. Biochem. 2006, 17, 789–810. [Google Scholar] [CrossRef]
- Yang, B.; Chen, H.; Stanton, C.; Ross, R.P.; Zhang, H.; Chen, Y.Q.; Chen, W. Review of the roles of conjugated linoleic acid in health and disease. J. Funct. Foods 2015, 15, 314–325. [Google Scholar] [CrossRef]
- Aydin, R. Conjugated linoleic acid: Structure, sources and biological properties. Turk. J. Vet. Anim. Sci. 2005, 29, 189–195. [Google Scholar]
- Park, Y. Conjugated linoleic acid (CLA): Good or bad trans fat? J. Food Comp. Anal. 2009, 22, S4–S12. [Google Scholar] [CrossRef]
- Kee, J.-I.; Ganesan, P.; Kwak, H.-S. Bioactive conjugated linoleic acid (CLA) in milk. Korean J. Food Sci. Anim. Resour. 2010, 30, 879–885. [Google Scholar] [CrossRef] [Green Version]
- Wahle, K.W.J.; Heys, S.D.; Rotundo, D. Conjugated linoleic acids: Are they beneficial or detrimental to health? Prog. Lipid Res. 2004, 43, 553–587. [Google Scholar] [CrossRef]
- Koba, K.; Yanagita, T. Health benefits of conjugated linoleic acid (CLA). Obes. Res. Clin. Pract. 2014, 8, e525–e532. [Google Scholar] [CrossRef]
- Jiang, J.; Björck, L.; Fondon, R. Production of conjugated linoleic acid by dairy starter cultures. J. Appl. Microbiol. 1998, 85, 95–102. [Google Scholar] [CrossRef]
- Kelly, M.L.; Berry, J.R.; Dwyer, D.A.; Griinari, J.M.; Chouinard, P.Y.; Van Amburgh, M.E.; Bauman, D.E. Dietary fatty acid sources affect conjugated linoleic acid concentrations in milk from lactating dairy cows. J. Nutr. Sci. 1998, 128, 881–885. [Google Scholar] [CrossRef] [Green Version]
- Chilliard, Y.; Ferlay, A.; Mansbridge, R.M.; Doreau, M. Ruminant milk fat plasticity: Nutritional control of saturated, polyunsaturated, trans and conjugated fatty acids. Anim. Res. 2000, 49, 181–205. [Google Scholar] [CrossRef]
- Kelsey, J.A.; Corl, B.A.; Collier, R.J.; Bauman, D.E. The Effect of Breed, Parity, and Stage of Lactation on Conjugated Linoleic Acid (CLA) in Milk Fat from Dairy Cows. J. Dairy Sci. 2003, 86, 2588–2597. [Google Scholar] [CrossRef] [Green Version]
- Collomb, M.; Schmid, A.; Sieber, R.; Wechsler, D.; Ryhänen, E.-L. Conjugated linoleic acids in milk fat: Variation and physiological effects. Int. Dairy J. 2006, 16, 1347–1361. [Google Scholar] [CrossRef]
- Zunong, M.; Hanada, M.; Aibibula, Y.; Okamoto, M.; Tanaka, K. Variations in Conjugated Linoleic Acid Concentrations in Cows Milk, Depending on Feeding Systems in Different Seasons. Asian Australas. J. Anim. Sci. 2008, 21, 1466–1472. [Google Scholar] [CrossRef]
- Żegarska, Z.; Paszczyk, B.; Rafałowski, R.; Borejszo, Z. Annual Changes in the Content of Unsaturated Fatty Acids with 18 Carbon Atoms, Including cis9trans11 C18:2 (CLA) Acid, in Milk Fat. Pol. J. Food Nutr. Sci. 2006, 56, 409–414. [Google Scholar]
- Kuczyńska, B.; Nałęcz-Tarwacka, T.; Puppel, K.; Gołębiewski, M.; Grodzki, H.; Slósarz, J. The content of bioactive components in milk depending on cow feeding model in certified ecological farms. J. Res. Appl. Agric. Eng. 2011, 56, 7–13. [Google Scholar]
- Murtaza, M.A.; Huma, N.; Hayat, Z.; Murtaza, M.S.; Meraj, A. Cheddar cheese from cow milk with elevated conjugated linoleic acid levels. J. Food Nutr. Res. 2014, 2, 506–509. [Google Scholar] [CrossRef] [Green Version]
- Kim, J.H.; Kwon, O.J.; Choi, N.J.; Oh, S.J.; Jeong, H.Y.; Song, M.K.; Jeong, I.; Kim, Y.J. Variations in conjugated linoleic acid (CLA) content of processed cheese by lactation time, feeding regimen, and ripening. J. Agric. Food Chem. 2009, 57, 3235–3239. [Google Scholar] [CrossRef] [PubMed]
- Sieber, R.; Collomb, M.; Aeschlimann, A.; Jelen, P.; Eyer, H. Impact of microbial cultures on conjugated linoleic acid in dairy products—A review. Int. Dairy J. 2004, 14, 1–15. [Google Scholar] [CrossRef]
- Seçkin, A.K.; Gursoy, O.; Kinik, O.; Akbulut, N. Conjugated linoleic acid (CLA) concentration, fatty acid composition and cholesterol content of same Turkish dairy products. LWT Food Sci. Technol. 2005, 38, 909–915. [Google Scholar] [CrossRef]
- Lin, H.; Boylston, T.D.; Chang, M.J.; Luedecke, L.O.; Shultz, T.D. Survey of the conjugated linoleic acid contents of dairy products. J. Diary Sci. 1995, 78, 2358–2365. [Google Scholar] [CrossRef]
- Białek, A.; Tokarz, A. Źródła pokarmowe oraz efekty prozdrowotne sprzężonych dienów kwasu linolowego (CLA). Biul. Wydz. Farm. WUM 1995, 1, 1–12. [Google Scholar] [CrossRef]
- Nunes, J.C.; Torres, A.G. Conjugated linoleic acid (CLA) in cheese: Analysis, composition, and dietary intake, (w:). In Handbook on Cheese; Nova Science Publishers, Inc.: Hauppauge, NY, USA, 2013; pp. 547–558. [Google Scholar]
- Lim, J.-N.; Oh, J.-J.; Wang, T.; Lee, J.-S.; Kim, S.-H.; Kim, Y.-H.; Lee, H.-G. trans-11 18:1 vaccenic acid (TVA) has a direct anti-carcinogenic effect on MCF-7 human mammary adenocarcinoma cells. Nutrients 2014, 6, 627–636. [Google Scholar] [CrossRef]
Figure 1.
The contents of cis9trans11 C18:2 (CLA), the sum of trans C18:1 and C18:2 in the fat from the analyzed products (mg/g of fat). a,b,c—values with different letters differ significantly (p < 0.05).
Figure 1.
The contents of cis9trans11 C18:2 (CLA), the sum of trans C18:1 and C18:2 in the fat from the analyzed products (mg/g of fat). a,b,c—values with different letters differ significantly (p < 0.05).


Table 1.
Fatty acid composition in fat extracted from analyzed products (mg/g of fat).
| Fatty Acid | Hard Cheeses | White-Mold Cheeses | Blue-Veined Cheeses | Butters | ||||||||
|---|---|---|---|---|---|---|---|---|---|---|---|---|
| n | 10 | 10 | 10 | 10 | ||||||||
| Mean | ±SD | Min–Max | Mean | ±SD | Min–Max | Mean | ±SD | Min–Max | Mean | ±SD | Min–Max | |
| C4:0 | 17.55 | 3.27 | 14.66–24.56 | 19.69 | 2.52 | 15.92–23.22 | 17.44 | 1.61 | 16.18–20.47 | 33.09 | 2.21 | 30.78–38.67 |
| C6:0 | 12.72 | 2.16 | 10.45–17.35 | 13.45 | 1.26 | 11.74–15.42 | 12.51 | 1.23 | 11.82–14.88 | 22.72 | 1.48 | 20.86–26.26 |
| C8:0 | 7.75 | 1.51 | 5.63–10.86 | 8.41 | 0.67 | 7.69–9.55 | 7.91 | 0.82 | 7.39–9.48 | 14.09 | 0.93 | 12.79–15.95 |
| C10:0 | 18.82 | 3.14 | 12.97–24.75 | 19.58 | 1.54 | 18.22–22.46 | 18.82 | 1.91 | 17.51–22.46 | 32.04 | 2.55 | 31.78–36.33 |
| C10:1 | 1.89 | 0.34 | 1.41–2.58 | 2.15 | 0.14 | 1.95–2.36 | 2.01 | 0.18 | 1.89–2.36 | 3.20 | 0.27 | 2.91–3.74 |
| C12:0 | 21.81 | 4.06 | 15.63–28.58 | 23.13 | 1.85 | 21.75–26.65 | 22.30 | 2.25 | 20.66–26.57 | 36.09 | 3.17 | 31.17–41.60 |
| C12:1 | 0.49 | 0.08 | 0.36–0.63 | 0.25 | 0.04 | 0.19–0.32 | 0.20 | 0.02 | 0.17–0.22 | 0.30 | 0.04 | 0.26–0.35 |
| C13:0 iso | 0.57 | 0.09 | 0.46–0.72 | 0.51 | 0.04 | 0.45–0.56 | 0.47 | 0.05 | 0.44–0.57 | 0.95 | 0.10 | 0.80–1.10 |
| C13:0 | 0.67 | 0.10 | 0.56–0.84 | 0.62 | 0.09 | 0.54–0.79 | 0.57 | 0.05 | 0.53–0.66 | 2.02 | 0.21 | 1.68–2.31 |
| C14:0 iso | 0.74 | 0.18 | 0.51–1.17 | 0.91 | 0.13 | 0.69–1.06 | 0.77 | 0.06 | 0.71–0.86 | 1.09 | 0.15 | 0.77–1.34 |
| C14:0 | 76.27 | 8.14 | 93.87–93.43 | 79.25 | 7.11 | 71.14–92.01 | 75.08 | 7.16 | 70.21–88.78 | 107.83 | 6.19 | 103.30–123.16 |
| C15:0 iso | 1.46 | 0.33 | 1.10–2.20 | 1.87 | 0.26 | 1.49–2.14 | 1.55 | 0.12 | 1.41–1.70 | 2.24 | 0.22 | 1.92–2.55 |
| C15:0 aiso | 2.96 | 0.60 | 2.15–4.04 | 3.69 | 0.36 | 3.10–4.03 | 3.28 | 0.24 | 3.06–3.72 | 4.52 | 0.52 | 3.79–5.52 |
| C14:1 | 6.31 | 1.10 | 4.74–8.28 | 7.29 | 0.59 | 6.52–7.97 | 7.05 | 0.64 | 6.63–8.27 | 10.06 | 0.83 | 9.41–11.07 |
| C15:0 | 7.06 | 1.37 | 5.16–9.64 | 8.34 | 0.68 | 7.49–9.39 | 7.78 | 0.76 | 7.13–9.19 | 10.96 | 0.67 | 10.25–12.32 |
| C16:0 iso | 1.81 | 0.42 | 1.39–2.74 | 2.04 | 0.24 | 1.68–2.24 | 1.93 | 0.19 | 1.80–2.28 | 2.62 | 0.26 | 2.07–3.04 |
| C16:0 | 200.05 | 23.24 | 173.45–244.21 | 218.09 | 18.46 | 197.22–248.26 | 208.45 | 20.10 | 195.39–247.02 | 277.79 | 11.35 | 262.46–299.96 |
| C17:0 iso | 2.12 | 0.38 | 1.57–2.90 | 2.86 | 0.42 | 2.24–3.36 | 2.32 | 0.18 | 2.11–2.53 | 3.48 | 0.28 | 3.07–3.81 |
| C17:0 aiso | 1.05 | 0.19 | 0.81–1.45 | 1.37 | 0.24 | 1.04–1.70 | 1.22 | 0.10 | 1.15–1.41 | 3.81 | 0.47 | 3.19–4.66 |
| C16:1 | 9.65 | 2.07 | 7.30–14.51 | 13.65 | 0.96 | 12.63–15.34 | 13.34 | 1.44 | 12.19–16.04 | 15.26 | 1.41 | 13.41–17.83 |
| C17:0 | 4.31 | 0.97 | 3.67–6.01 | 0.51 | 0.23 | 0.30–0.83 | 0.35 | 0.03 | 0.33–0.40 | 6.44 | 0.59 | 5.61–7.18 |
| C17:1 | 1.42 | 0.25 | 1.08–1.95 | 1.79 | 0.14 | 1.58–1.99 | 1.67 | 0.14 | 1.57–1.93 | 2.29 | 0.46 | 1.61–2.76 |
| C18:0 | 55.60 | 6.81 | 41.73–62.28 | 70.82 | 8.00 | 55.03–76.51 | 65.84 | 5.90 | 62.18–77.19 | 76.75 | 5.83 | 69.47–85.65 |
| C18:1 trans6 − trans9 | 2.48 | 0.52 | 1.71–3.22 | 2.98 | 0.39 | 2.28–3.49 | 2.95 | 0.45 | 2.47–3.67 | 3.24 | 0.55 | 2.74–3.41 |
| C18:1 trans10 + trans11 | 7.09 | 1.63 | 5.10–10.16 | 11.16 | 2.94 | 7.73–16.19 | 8.20 | 0.59 | 7.55–9.13 | 10.20 | 0.98 | 8.64–11.89 |
| C18:1 trans 12 | 1.61 | 0.35 | 1.08–2.18 | 1.97 | 0.27 | 1.58–2.37 | 2.01 | 0.35 | 1.62–2.56 | 2.07 | 0.38 | 1.53–2.22 |
| C18:1 cis9 | 107.47 | 16.89 | 83.38–128.08 | 142.43 | 15.22 | 115.88–162.42 | 134.75 | 13.71 | 124.12–160.57 | 159.71 | 5.58 | 153.15–170.82 |
| C18:1 cis11 | 3.54 | 0.72 | 2.48–4.60 | 5.23 | 0.57 | 4.35–6.02 | 5.54 | 0.79 | 4.68–6.80 | 6.85 | 0.52 | 6.15-7.64 |
| C18:1 cis12 | 1.51 | 0.41 | 0.90–2.23 | 1.75 | 0.29 | 1.46–2.21 | 1.89 | 0.36 | 1.48–2.43 | 2.64 | 0.37 | 2.11-3.15 |
| C18:1 cis13 | 0.48 | 0.14 | 0.60–0.71 | 0.72 | 0.15 | 0.49–0.90 | 0.73 | 0.11 | 0.61–0.90 | 0.88 | 0.09 | 0.72-1.03 |
| C18:1 trans16 | 1.63 | 0.39 | 1.11–2.29 | 2.04 | 0.36 | 1.56–2.52 | 1.84 | 0.26 | 1.56–2.27 | 2.43 | 0.29 | 1.88-2.88 |
| C19:0 | 0.91 | 0.22 | 0.63–1.28 | 1.21 | 0.24 | 0.86–1.49 | 1.07 | 0.16 | 0.92–1.35 | 1.09 | 0.33 | 0.68-1.39 |
| C18:2 cis9trans13 | 1.09 | 0.26 | 0.77–1.66 | 1.31 | 0.33 | 0.95–1.86 | 1.15 | 0.18 | 0.96–1.45 | 1.57 | 0.36 | 0.78-2.12 |
| C18:2 cis9trans12 | 0.88 | 0.17 | 0.66–1.15 | 1.09 | 0.18 | 0.85–1.27 | 1.01 | 0.22 | 0.76–1.34 | 2.25 | 0.23 | 1.96-2.36 |
| C18:2 trans11cis15 | 0.54 | 0.24 | 0.33–1.04 | 1.28 | 0.58 | 0.75–2.40 | 0.65 | 0.03 | 0.63–0.72 | 0.95 | 0.23 | 0.85-1.18 |
| C18:2 cis9cis12 | 9.14 | 1.91 | 6.37–10.55 | 10.70 | 1.08 | 9.03–12.07 | 10.64 | 1.18 | 9.52–12.74 | 13.06 | 0.89 | 11.77-14.75 |
| C20:0 | 0.87 | 0.17 | 0.68–1.22 | 1.05 | 0.16 | 0.82–1.28 | 0.96 | 0.10 | 0.89–1.16 | 1.21 | 0.18 | 0.89-1.42 |
| C20:1 | 0.64 | 0.12 | 0.48–0.87 | 0.82 | 0.08 | 0.69–0.93 | 0.71 | 0.06 | 0.68–0.83 | 0.91 | 0.14 | 0.71-1.11 |
| C18:3 cis9cis12cis15 | 1.92 | 0.57 | 1.23–2.88 | 2.95 | 0.69 | 2.38–4.14 | 1.77 | 0.27 | 1.48–2.09 | 3.41 | 0.73 | 2.62-4.38 |
| C18:2 cis9trans11 (CLA) | 2.50 | 0.52 | 1.94–3.56 | 4.12 | 1.31 | 3.61–6.61 | 2.89 | 0.23 | 2.60–3.15 | 3.63 | 0.25 | 3.23-4.10 |
n—number of samples; Mean—mean value; SD—standard deviation; Min—minimum value, Max—maximum value.
Table 2.
Fatty acids content (mg/g of fat) and lipid quality indices in the fat from the analyzed products (Mean ± SD, range).
Table 2.
Fatty acids content (mg/g of fat) and lipid quality indices in the fat from the analyzed products (Mean ± SD, range).
| Fatty Acids | Hard Cheeses | White-Mold Cheeses | Blue-Veined Cheeses | Butters | |
|---|---|---|---|---|---|
| n | 10 | 10 | 10 | 10 | |
| Σ SCFA 1 | Mean | 56.84 b | 61.12 b | 56.68 b | 101.93 a |
| SD | 9.5 | 5.68 | 5.51 | 6.61 | |
| Min–Max | 46.18–78.00 | 53.97–70.65 | 53.58–67.29 | 93.12–116.90 | |
| Σ BCFA 2 | Mean | 10.70 c | 13.24 b | 11.55 b,c | 18.70 a |
| SD | 2.13 | 1.51 | 0.84 | 1.84 | |
| Min–Max | 8.00–15.20 | 10.77–15.10 | 10.78–13.07 | 15.88–22.00 | |
| Σ OCFA 3 | Mean | 12.95 b | 11.03 c | 9.80 c | 20.51 a |
| SD | 2.62 | 1.17 | 1.03 | 1.41 | |
| Min–Max | 9.43–17.47 | 9.68–12.83 | 8.88–11.68 | 18.67–21.41 | |
| Σ SFA 4 | Mean | 356.44 c | 416.62 b | 394.31 b | 502.78 a |
| SD | 40.29 | 34.56 | 37.3 | 17.34 | |
| Min–Max | 307.23–430.54 | 366.88–471.64 | 370.02–465.87 | 475.39–524.61 | |
| Σ MUFA 5 | Mean | 146.21 c | 194.24 b | 182.88 b | 225.16 a |
| SD | 23.66 | 20.32 | 18.71 | 5.95 | |
| Min–Max | 101.43–175.77 | 159.56–221.47 | 168.08–217.97 | 216.81–237.00 | |
| Σ PUFA 6 | Mean | 16.07 c | 21.57 b | 18.22 c | 24.89 a |
| SD | 2.92 | 3.38 | 1.65 | 1.61 | |
| Min–Max | 12.50–21.02 | 17.13–26.56 | 16.99–21.34 | 21.90–28.06 | |
| n-3 | Mean | 1.92 b | 2.95 a | 1.77 b | 3.41 a |
| SD | 0.57 | 0.69 | 0.27 | 0.73 | |
| Min–Max | 1.73–2.30 | 2.38–4.14 | 1.48–2.09 | 2.70–4.50 | |
| n-6 | Mean | 9.14 c | 10.70 b | 10.64 b | 13.06 a |
| SD | 1.91 | 1.08 | 1.18 | 0.89 | |
| Min–Max | 7.82–13.01 | 9.03–12.07 | 9.52–12.74 | 11.80–15.05 | |
| n-6/n-3 | Mean | 5.05 a,b | 3.76 b | 6.17 a | 4.01 b |
| SD | 1.52 | 0.74 | 1.31 | 0.93 | |
| Min–Max | 3.60–8.00 | 2.42–4.47 | 4.56–7.41 | 2.83–5.00 | |
| AI 7 | Mean | 3.40 a | 2.69 c | 2.72 c | 3.09 b |
| SD | 0.43 | 0.17 | 0.04 | 0.15 | |
| Min–Max | 3.01–4.01 | 2.44–2.95 | 2.69–2.77 | 2.86–3.32 | |
| TI 8 | Mean | 4.02 a | 3.31 b | 3.42 b | 3.57 b |
| SD | 0.42 | 0.2 | 0.02 | 0.12 | |
| Min–Max | 3.65–4.54 | 2.94–3.53 | 3.39–3.44 | 3.40–3.80 | |
| HH 9 | Mean | 0.43 a | 0.26 b | 0.26 b | 0.46 a |
| SD | 0.05 | 0.02 | 0.01 | 0.02 | |
| Min–Max | 0.37–0.50 | 0.23–0.29 | 0.24–0.27 | 0.42–0.51 | |
n—number of samples; Mean—mean value; SD—standard deviation; Min—minimum value; Max—maximum value; a,b,c—values denoted in rows by different letters differ significantly (p < 0.05); 1 Σ SCFA—sum of short-chain fatty acids (C4:0–C10:0); 2 Σ BCFA—sum of branched-chain fatty acids; 3 Σ OCFA—sum of odd-chain fatty acids; 4 Σ SFA—sum of saturated fatty acids (BCFA, OCFA, MCFA, LCFA without SCFA); 5 Σ MUFA—sum of monounsaturated fatty acids; 6 Σ PUFA—sum of polyunsaturated fatty acids; 7 AI (Index of Atherogenicity); 8 TI (Index of Thrombogenicity); 9 H/H (hypocholesterolemic/hypercholesterolemic ratio).
Publisher’s Note: MDPI stays neutral with regard to jurisdictional claims in published maps and institutional affiliations. |
© 2022 by the author. Licensee MDPI, Basel, Switzerland. This article is an open access article distributed under the terms and conditions of the Creative Commons Attribution (CC BY) license (https://creativecommons.org/licenses/by/4.0/).
Share and Cite
MDPI and ACS Style
Paszczyk, B. Cheese and Butter as a Source of Health-Promoting Fatty Acids in the Human Diet. Animals 2022, 12, 3424. https://doi.org/10.3390/ani12233424
AMA Style
Paszczyk B. Cheese and Butter as a Source of Health-Promoting Fatty Acids in the Human Diet. Animals. 2022; 12(23):3424. https://doi.org/10.3390/ani12233424
Chicago/Turabian StylePaszczyk, Beata. 2022. "Cheese and Butter as a Source of Health-Promoting Fatty Acids in the Human Diet" Animals 12, no. 23: 3424. https://doi.org/10.3390/ani12233424
Note that from the first issue of 2016, this journal uses article numbers instead of page numbers. See further details here.