
Lactose Content and Selected Quality Parameters of Sheep Milk Fermented Beverages during Storage
 ,
,  , , , , and
Abstract
:Simple Summary
Abstract
1. Introduction
2. Materials and Methods
2.1. Milk for Producing Fermented Beverages
2.2. Production of Yogurt and Kefir Samples
- -
- Natural yogurt: YO 122 inoculant from Biochem (Streptococcus salivarius subsp. thermophilus, Lactobacillus delbrueckii subsp. bulgaricus);
- -
- Probiotic yogurt: ABY inoculant from Biochem (Streptococcus salivarius subsp. thermophilus, Bifidobacterium bifidum, Lactobacillus acidophilus, Lactobacillus delbrueckii subsp. bulgaricus);
- -
- Greek yogurt: Lyofast Y 480F inoculant from Sacco (Lactobacillus delbrueckii ssp. bulgaricus, Streptococcus thermophilus).
2.3. Physical and Chemical Analysis
2.4. Sensory Examination
2.5. Statistical Analysis
3. Results
4. Discussion
5. Conclusions
Supplementary Materials
Author Contributions
Funding
Institutional Review Board Statement
Informed Consent Statement
Data Availability Statement
Conflicts of Interest
References
- Danków, R.; Pikul, J.; Wójtowski, J.; Cais-Sokolińska, D.; Teichert, J.; Bagnicka, E.; Cieślak, A.; Szumacher-Strabel, M. The effect of supplementation with gold of pleasure (Camelina sativa) cake on fatty acid profile of ewe milk and yoghurt produced from it. J. Anim. Feed Sci. 2015, 24, 193–202. [Google Scholar] [CrossRef]
- Costa, A.; Boselli, C.; De Marchi, M.; Todde, G.; Caria, M. Milkability traits across milk flow curve types in Sarda sheep. Small Rumin. Res. 2022, 206, 106584. [Google Scholar] [CrossRef]
- Pulina, G.; Milán, M.J.; Lavín, M.P.; Theodoridis, A.; Morin, E.; Capote, J.; Thomas, D.L.; Francesconi, A.H.D.; Caja, G. Invited review: Current production trends, farm structures, and economics of the dairy sheep and goat sectors. J. Dairy Sci. 2018, 101, 6715–6729. [Google Scholar] [CrossRef] [PubMed] [Green Version]
- Markiewicz-Kęszycka, M.; Czyżak-Runowska, G.; Lipińska, P.; Wójtowski, J. Fatty acid profile of milk—A review. Bull. Vet. Inst. Pulawy 2013, 57, 135–139. [Google Scholar] [CrossRef] [Green Version]
- Wendorff, W.L.; Haenlein, G.F.W. Sheep milk—Composition and nutrition, chapter 3.2. In Handbook of Milk of Non-Bovine Mammals, 2nd ed.; Park, Y.W., Haenlein, G.F.W., Wendorff, W.L., Eds.; Wiley Blackwell: New York, NJ, USA, 2017; pp. 210–221. [Google Scholar]
- Shrestha, A.; Samuelsson, L.M.; Sharma, P.; Day, L.; Cameron-Smith, D. Comparing response of sheep and cow milk on acute digestive comfort and lactose malabsorption: A randomized controlled trial in female dairy avoiders. Front. Nutr. 2021, 8, 603816. [Google Scholar] [CrossRef]
- Cais-Sokolińska, D.; Wójtowski, J.; Pikul, J. Rheological, texture and sensory properties of kefir from mare’s milk and its mixtures with goat and sheep milk. Mljekarstvo 2016, 66, 272–281. [Google Scholar] [CrossRef] [Green Version]
- Cais-Sokolińska, D.; Wójtowski, J.; Pikul, J. Lactose hydrolysis and lactase activity in fermented mixtures containing mare, cow, sheep, and goat’s milk. Int. J. Food Sci. 2016, 51, 2140–2148. [Google Scholar] [CrossRef]
- Balthazar, C.F.; Pimentel, T.C.; Ferrão, L.L.; Almada, C.N.; Santillo, A.; Mollakhalili, M.; Mortazavian, N.; Nascimento, J.S.; Silva, M.C.; Freitas, M.Q.; et al. Sheep milk: Physicochemical characteristics and relevance for functional food development. Compr. Rev. Food Sci. Food Saf. 2017, 16, 247–262. [Google Scholar] [CrossRef] [Green Version]
- Oak, S.J.; Jha, R. The effects of probiotics in lactose intolerance: A systematic review. Crit. Rev. Food Sci. Nutr. 2019, 59, 1675–1683. [Google Scholar] [CrossRef]
- EDA. Questions and Answers on Lactose Intolerance. 2017. Available online: http://eda.euromilk.org/fileadmin/user_upload/Public_Documents/Nutrition_Factsheets/2017_08_30_EDA_Lactose_intolerance_final.pdf (accessed on 1 February 2018).
- Zuba-Ciszewska, M.; Brodziak, A.; Manning, L.; Kijek, T. Lactose-free products: A study of young Polish consumers’ knowledge and purchase behaviour. Songklanakarin J. Sci. Technol. 2022, 44, 619–626. [Google Scholar]
- Cais-Sokolińska, D.; Pikul, J.; Wójtowski, J.; Danków, R.; Teichert, J.; Czyżak-Runowska, G.; Bagnicka, E. Evaluation of quality of kefir from milk obtained from goats supplemented with a diet rich in bioactive compounds. J. Sci. Food Agric. 2015, 95, 1343–1349. [Google Scholar] [CrossRef] [PubMed]
- Cais-Sokolińska, D.; Wójtowski, J.; Pikul, J.; Danków, R.; Majcher, M.; Teichert, J.; Bagnicka, E. Formation of volatile compounds in kefir made of goat and sheep milk with high polyunsaturated fatty acids content. J. Dairy Sci. 2015, 98, 6692–6705. [Google Scholar] [CrossRef] [PubMed] [Green Version]
- Wawrzyniak, J.; Kaczynski, L.K.; Cais-Sokolinska, D.; Wojtowski, J. Mathematical modelling of ethanol production as a function of temperature during lactic-alcoholic fermentation of goat’s milk after hydrolysis and transgalactosylation of lactose. Measurement 2019, 135, 287–293. [Google Scholar] [CrossRef]
- Wichrowska, D.; Wojdyła, T. Sensory and physicochemical evaluation of selected natural and ecological yogurts. Inżynieria Apar. Chemiczna. 2014, 53, 421–423. Available online: https://bibliotekanauki.pl/articles/2073081pdf (accessed on 1 January 2016). (In Polish).
- Kowalska, D.; Gruczyńska, E.; Bryś, J. Mother’s milk—First food in human life. Possibl. Hig. Epidemiol. 2015, 96, 387–398. (In Polish) [Google Scholar]
- Kołożyn-Krajewska, D. Probiotic food in terms of health safety. Żywność. Nauka. Technol. Jakość (Supl.) 2001, 4, 93–105. (In Polish) [Google Scholar]
- Zatwarnicki, P. Lactose intolerance—Causes, symptoms, diagnosis. Piel. Zdr. Publ. 2014, 3, 273–276. (In Polish) [Google Scholar]
- Huppertz, T.; Gazi, I. Lactose in dairy ingredients: Effects on processing and storage stability. J. Dairy Sci. 2016, 99, 6842–6851. [Google Scholar] [CrossRef]
- Hanh, T.; Nguyen, H.; Gathercole, J.L.; Day, L.; Dalziel, J.E. Differences in peptide generation following in vitro gastrointestinal digestion of yogurt and milk from cow, sheep and goat. Food Chem. 2020, 317, 126419. [Google Scholar] [CrossRef]
- Farag, M.A.; Jomaa, S.A.; El-Wahed, A.A.; El-Seedi, H.R. The many faces of kefir fermented dairy products: Quality characteristics, flavour chemistry, nutritional value, health benefits and safety. Nutriens 2020, 12, 346. [Google Scholar] [CrossRef] [Green Version]
- Yimaz-Ersan, L.; Ozcan, T.; Akpinar-Bayizit, A.; Sahin, S. Comparision of antioxidant capacity of cow and ewe milk kefirs. J. Dairy Sci. 2018, 101, 3788–3798. [Google Scholar] [CrossRef] [PubMed]
- Gut, A.; Wojtowski, J.; Stanisz, M.; Ślósarz, P. Dairy performance of new Polish milk sheep. Ann. Anim. Sci. 2008, 8, 411–415. [Google Scholar]
- Strzetelski, J.A.; Brzóska, F.; Kowalski, Z.M.; Osięgłowski, S. Feeding Recommendation for Ruminants and Feed Value Tables; IZ, INRA, Instytut Zootechniki: Kraków, Poland, 2014; pp. 1–392. (In Polish) [Google Scholar]
- Skrzypek, R.; Wójtowski, J.; Fahr, R.D. Hygienic quality of cow bulk tank milk depending on the method of udder preparation for milking (short communication). Arch. Fur Tierzucht. 2003, 46, 405–411. [Google Scholar] [CrossRef]
- Polish Standard PN-68/A-86122; Milk. In Research Methodology. Wydawnictwa Normalizacyjne: Warszawa, Poland, 1968. (In Polish)
- CIE 11664-4:2019; Colorimetry—Part 4: CIE 1976 L*a*b* Colour Space. ISO: Geneva, Switzerland; Commission Internationale de L’éclairage: Vienna, Austria, 2019.
- ISO:3972; Sensory Analysis—Determination of Sensitivity of Taste. ISO: Geneva, Switzerland, 1979.
- ISO:5496; Sensory Analysis—Methodology—Initiation and Training of Assessors in the Detection and Recognition of Odours. ISO: Geneva, Switzerland, 2018.
- Pandya, A.J.; Ghodke, K.M. Goat and sheep milk products other than cheeses and yoghurt. Small Rumin. Res. 2007, 68, 193–206. [Google Scholar] [CrossRef]
- Barłowska, J.; Szwajkowska, M.; Litwińczuk, Z.; Król, J. Nutritional Value and Technological Suitability of Milk from Various Animal Species Used for Dairy Production. Compr. Rev. Food Sci. Food Saf. 2011, 6, 291–302. [Google Scholar] [CrossRef]
- Montalto, M.; Curigliano, V.; Santoro, L.; Vastola, M.; Cammarota, G.; Manna, R.; Gasbarrini, A.; Gasbarrini, G. Management and treatment of lactose malabsorption. Word J. Gastroenterol. 2006, 2, 187–191. [Google Scholar] [CrossRef]
- Deng, Y.; Misselwitz, B.; Dai, N.; Fox, M. Lactose intolerance in adults: Biological mechanism and dietary management. Nutrients 2015, 7, 8020–8035. [Google Scholar] [CrossRef] [Green Version]
- Sánchez, A.F.; Muñoz, J.P.; Caballero-Villalobos, J.; Sánchez, R.A.; Garzón, A.; Sánchez de Pedro, E. Coagulation process in manchega sheep milk from Spain: A path analysis approach. J. Dairy Sci. 2021, 104, 7544–7554. [Google Scholar] [CrossRef]
- de Morais, J.L.; Garcia, E.F.; Viera, V.B.; Pontes, E.D.S.; de Araújo, M.G.G.; de Figueirêdo, R.M.F.; Moreira, I.S.; do Egido, A.S.; dos Santos, K.M.O.; Soares, J.K.B.; et al. Autochthonous adjunct culture of Limosilactobacillus mucosae CNPC007 improved the techno-functional, physicochemical and sensory properties of goat milk Greek—Style yogurt. J. Dairy Sci. 2022, 105, 1889–1899. [Google Scholar] [CrossRef]
- Bierzuńska, P.; Kaczyński, Ł.K.; Cais-Sokolińska, D.; Kulczyński, D. Texture profile of kefir and yogurt with modified configuration of proteins. Nauka Przyr. Technol. 2017, 11, 107–114. [Google Scholar]
- Gaspar, P.; Carvalho, A.L.; Vinga, S.; Dantos, H.; Neves, A.R. From physiology to systems metabolic engineering for the production of biochemical by lactic acid bacteria. Biotechnol. Adv. 2013, 31, 764–788. [Google Scholar] [CrossRef] [PubMed]
- Feldmane, J.; Semjonovs, P.; Ciproviča, I. Potential of exopolysaccharides in yoghurt production. Int. J. Food Sci. Nutr. Eng. 2013, 7, 767–770. [Google Scholar] [CrossRef]
- Górska, S.; Grycko, P.; Rybka, J.; Gamian, A. Exopolysaccharides of lactic acid bacteria: Structure and biosynthesis. Postępy Hig. Med. Dośw. 2007, 61, 805–818. (In Polish) [Google Scholar]
- Nguyen, H.T.H.; Afsar, S.; Day, L. Differences in the microstructure and rheological properties of low-fat yoghurts from goat, sheep and cow milk. Int. Food Res. J. 2018, 108, 423–429. [Google Scholar] [CrossRef] [PubMed]
- Costa, M.P.; Frasao, B.S.; Silva, A.C.O.; Freitas, M.Q.; Franco, R.M.; Conte-Junior, C.A. Cupuassu (Theobroma grandiflorum) pulp, probiotic and prebiotic: Influence on color apparent viscosity and texture of goat milk yogurts. J. Dairy Sci. 2015, 98, 5995–6003. [Google Scholar] [CrossRef] [PubMed]
- Shihata, A.; Shah, N.P. Influence of proteolytic straits of Lactobacillus delbrueckii subsp. bulgaricus to commercial ABT starter cultures on texture of yoghurt, exopolysaccharide production and survival of bacteria. Int. Dairy J. 2002, 12, 765–772. [Google Scholar] [CrossRef]
- Jakubowska, M.; Karamucki, T. Effect of storage time and temperature on the quality of natural yoghurt. Acta Sci. Pol. Zootech. 2019, 18, 29–38. [Google Scholar] [CrossRef]
- Teichert, J.; Danków, R.; Pikul, J.; Osten-Sacken, N. Properties of fermented beverages prepared from goat milk with the use of thickening starter cultures. Nauka Przyr. Technol. 2015, 9, 28. [Google Scholar] [CrossRef]
- Cais-Sokolińska, D.; Majcher, M. Relationship between CIE L*, a*, b* scale colour parameters and proximate chemical composition of permeate and concentrate milk after micro-and ultrafiltration. Apar. Badaw. I Dydakt. 2009, 14, 92–96. (In Polish) [Google Scholar]
- Marii, N.; Carfora, V.; Patriarca, D.; Veschetti, M.C.; Giacinti, G.; Giangolini, G.; Amatiste, S. Sheep milk yogurt from a short food supply chain: Study of the microbiological, chemico-physical and organoleptic parameters in relation to shelf-life. Ital. J. Food Saf. 2014, 3, 1695. [Google Scholar] [CrossRef]


| Traits | |
|---|---|
| Dry matter (%) | 15.74 ± 0.18 |
| Protein (%) | 3.87 ± 0.02 |
| Fat (%) | 5.38 ± 0.01 |
| Lactose (%) | 5.64 ± 0.01 |
| Mineral salts (%) | 0.72 ± 0.01 |
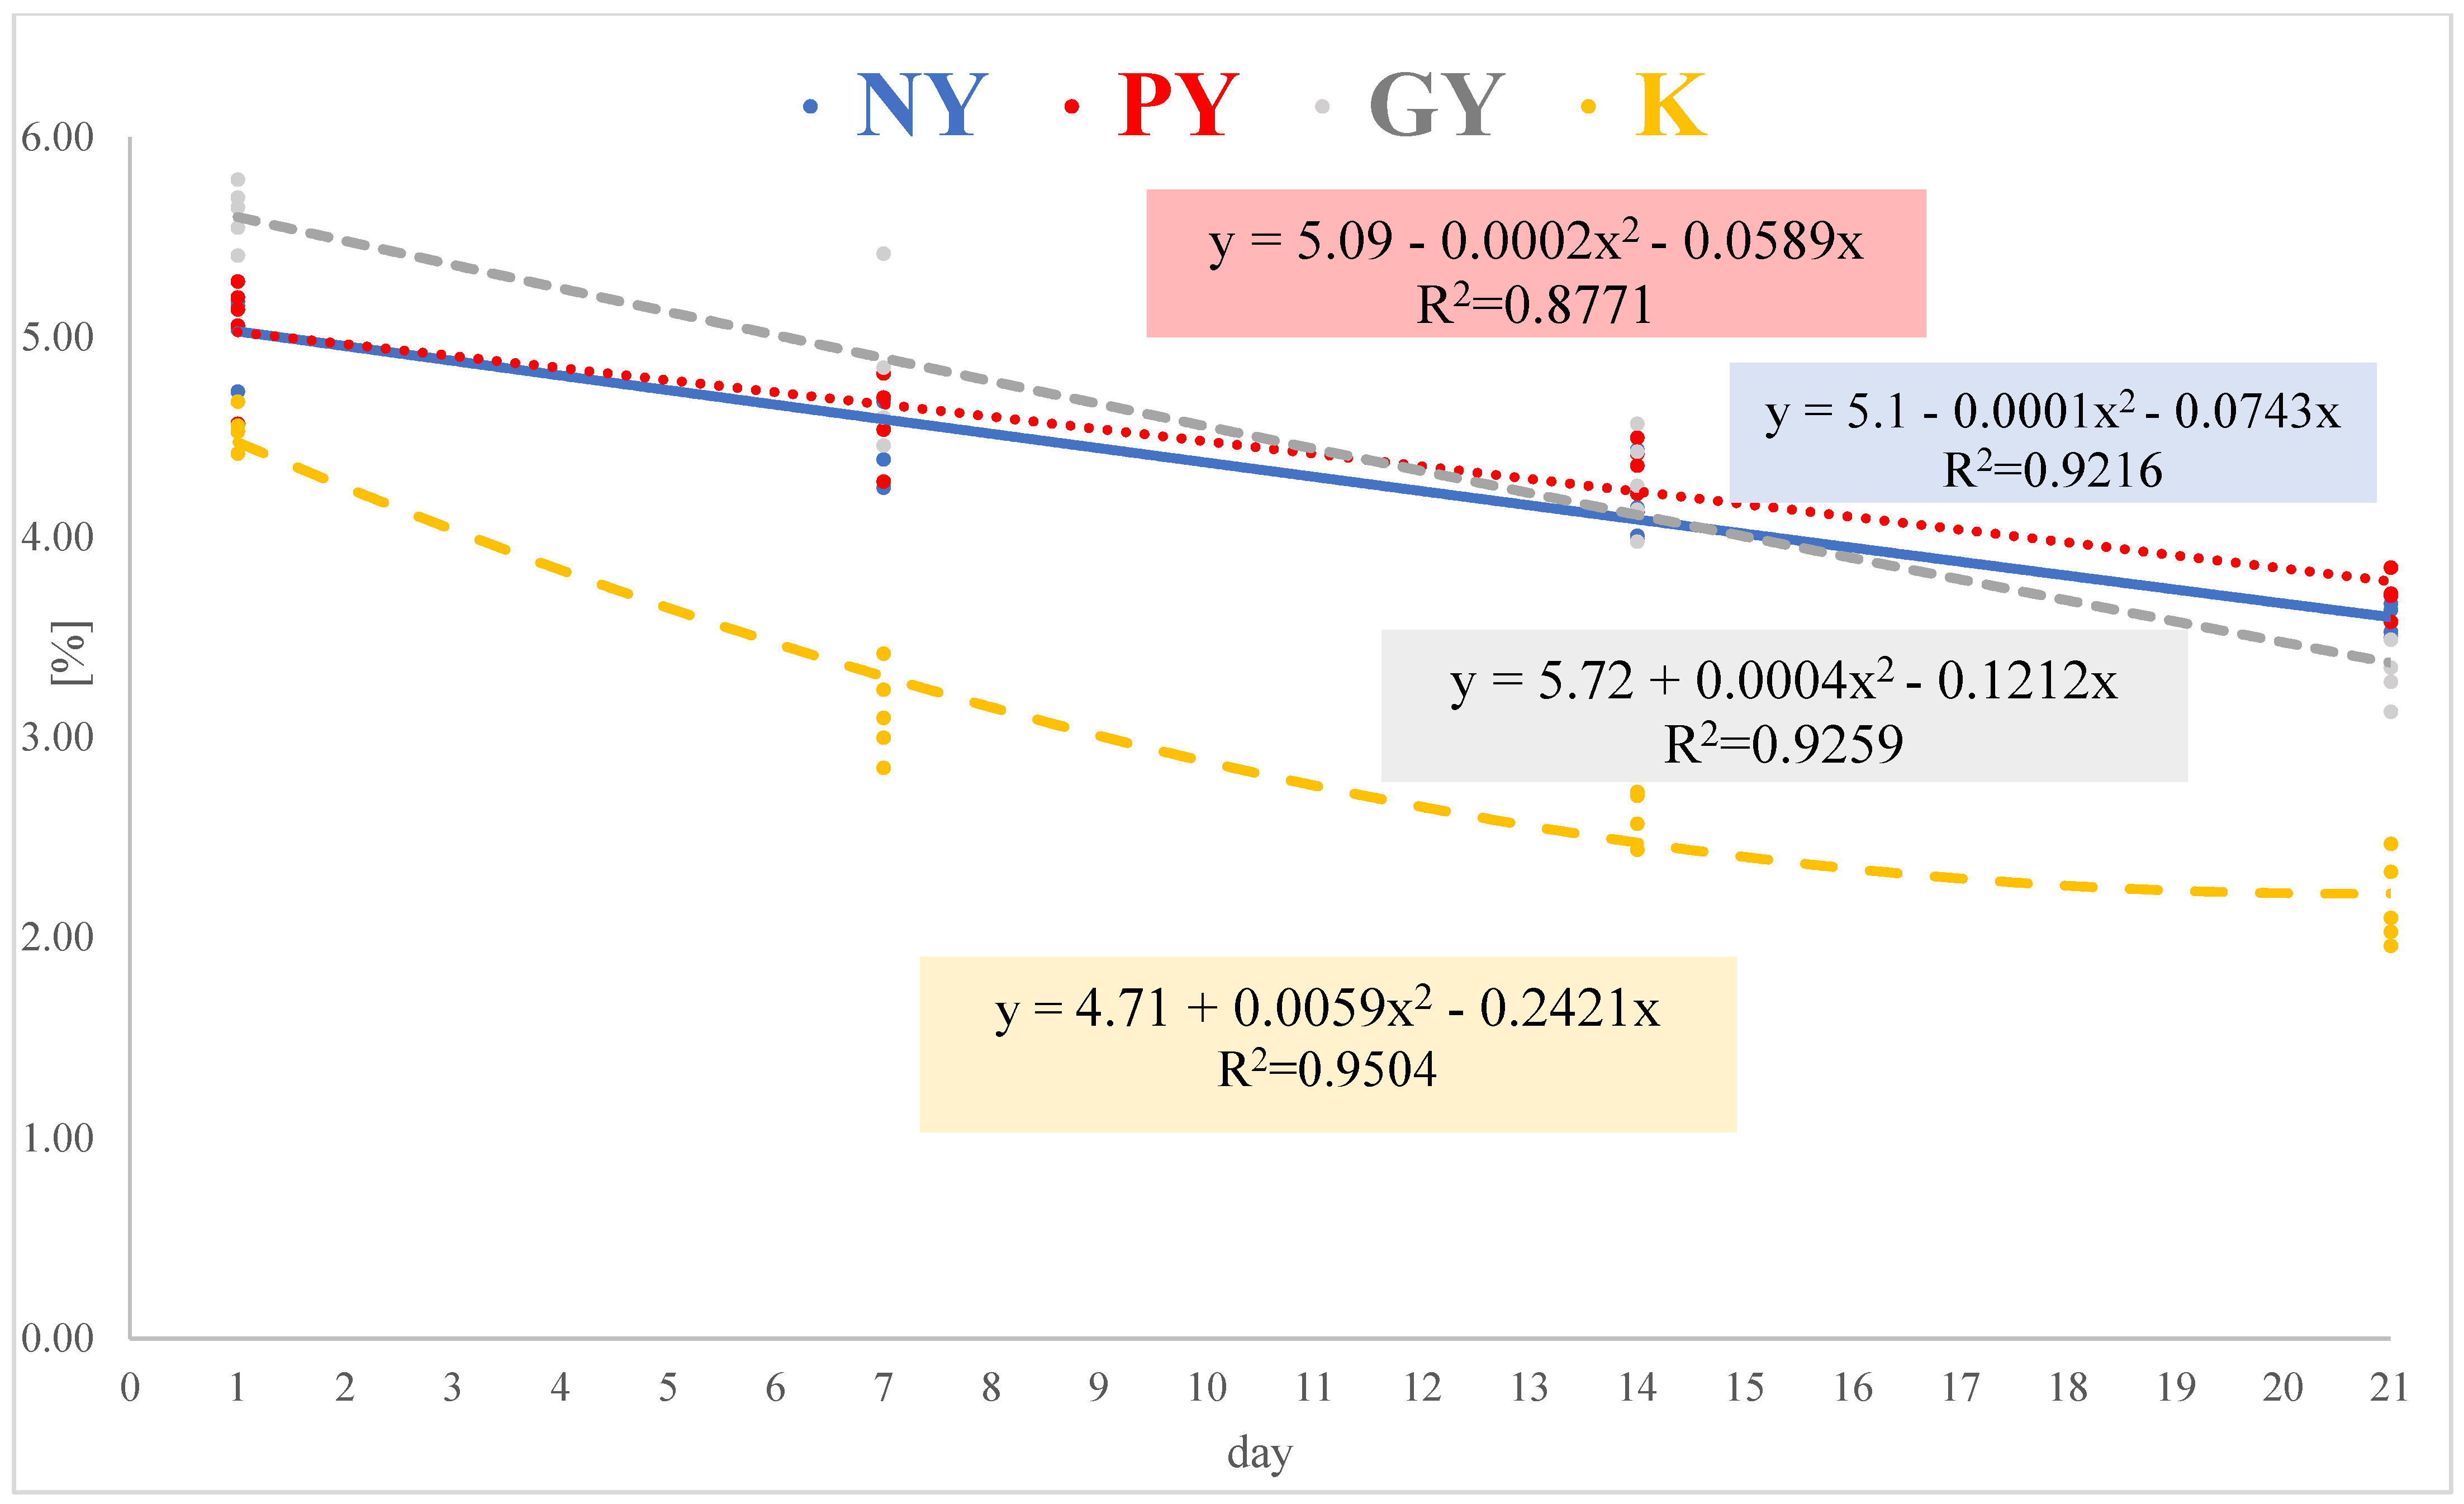
| Milk Drink | Storage Time (Days) | Se | Type of Drink | Time | Type of Drink × Time | |||
|---|---|---|---|---|---|---|---|---|
| 1 | 7 | 14 | 21 | p-Value | ||||
| NY PY GY K | 5.05 aA | 4.54 bA | 4.14 cA | 3.59 dA | 0.08 | 0.0001 | 0.0001 | 0.0001 |
| 5.05 aA | 4.60 bA | 4.29 cA | 3.76 dA | |||||
| 5.65 aB | 4.77 bA | 4.23 cA | 3.34 dB | |||||
| 4.55 aC | 3.12 bB | 2.65 cB | 2.17 dC | |||||
| Traits | Milk Drink | Storage Time (Days) | Se | Type of Drink | Time | Type of Drink × Time | |||
|---|---|---|---|---|---|---|---|---|---|
| 1 | 7 | 14 | 21 | p-Value | |||||
| pH | NY | 4.69 aA | 4.47 bA | 4.33 c | 4.36 cAB | 0.02 | 0.0001 | 0.0001 | 0.0005 |
| PY | 4.66 aA | 4.53 bA | 4.38 b | 4.48 bA | |||||
| GY | 4.38 aAB | 4.77 aB | 4.17 b | 4.23 abB | |||||
| K | 4.26 B | 4.33 C | 4.26 | 4.36 AB | |||||
| Acidity (°SH) | NY | 36.93 aA | 40.53 aA | 45.47 bA | 47.60 bA | 1.48 | 0.0001 | 0.0001 | 0.0001 |
| PY | 36.67 aA | 42.00 abA | 46.53 bAB | 48.93 bA | |||||
| GY | 40.40 aA | 45.73 bAB | 53.47 cC | 63.87 dB | |||||
| K | 47.33 aB | 48.40 aB | 49.73 aB | 52.93 bC | |||||
| Hardness (g) | NY | 135.29 | 145.33 A | 167.19 | 134.32 A | 7.12 | 0.0001 | 0.0441 | 0.9587 |
| PY | 114.53 | 134.12 A | 172.10 | 128.99 AB | |||||
| GY | 95.62 | 86.22 B | 167.56 | 102.92 AB | |||||
| K | 48.48 b | 47.55 abB | 63.60 a | 45.08 bB | |||||
| Consistency (g/s) | NY | 2964.07 | 3404.31 A | 3446.80 A | 2849.52 A | 14.77 | 0.0001 | 0.0468 | 0.8971 |
| PY | 2281.40 | 2576.18 AB | 3653.89 A | 2317.79 A | |||||
| GY | 2020.62 | 1946.75 BC | 3392.86 A | 2096.91 A | |||||
| K | 1229.04 a | 1218.43 abC | 1431.58 aB | 1112.74 bB | |||||
| Cohesion (g) | NY | −154.32 A | −135.77 A | −196.77 A | −125.85 A | 8.99 | 0.0001 | 0.0258 | 0.8951 |
| PY | −138.48 A | −144.96 B | −167.70 B | −109.57 A | |||||
| GY | −155.52 A | −65.45 C | −145.07 B | −59.61 B | |||||
| K | −22.27 C | −19.33 D | −34.86 C | −17.08 B | |||||
| Viscosity (g/s) | NY | −290.04 aA | −104.98 bA | −286.28 aA | −217.03 abA | 13.62 | 0.0001 | 0.0001 | 0.0946 |
| PY | −248.43 A | −236.01 B | −286.27 A | −180.80 A | |||||
| GY | −180.51 aAB | −96.73 abA | −174.61 abA | −59.46 bB | |||||
| K | −48.53 aB | −29.16 abC | −58.07 aB | −14.81 bB | |||||
| L* | NY | 91.60 AB | 91.25 | 91.58 | 91.24 AB | 0.04 | 0.0152 | 0.0458 | 0.0011 |
| PY | 91.52 A | 91.51 | 91.68 | 91.68 A | |||||
| GY | 91.94 B | 91.69 | 91.30 | 90.83 B | |||||
| K | 91.51 A | 91.65 | 91.56 | 91.65 A | |||||
| a* | NY | −4.99 A | −5.12 A | −5.20 AB | −5.04 A | 0.08 | 0.0001 | 0.0023 | 0.0001 |
| PY | −5.17 A | −5.05 A | −5.31 A | −5.19 A | |||||
| GY | −4.68 A | −4.80 A | −4.62 BC | −4.30 B | |||||
| K | −2.80 aB | −4.02 bB | −4.22 bC | −4.30 bB | |||||
| b* | NY | 13.27 A | 14.06 A | 13.94 AB | 13.87 | 0.20 | 0.0010 | 0.0001 | 0.0001 |
| PY | 13.99 A | 13.88 A | 14.40 A | 14.27 | |||||
| GY | 13.48 A | 14.09 A | 14.37 A | 14.04 | |||||
| K | 8.21 aB | 11.65 bB | 12.55 bB | 13.02 b | |||||
| C* | NY | 14.17 A | 14.96 A | 14.88 A | 14.76 AB | 0.21 | 0.0010 | 0.0001 | 0.0001 |
| PY | 14.92 A | 14.78 A | 15.34 A | 15.18 A | |||||
| GY | 14.27 A | 14.89 A | 15.10 A | 14.69 AB | |||||
| K | 8.68 aB | 12.32 bB | 13.24 bB | 13.72 bB | |||||
| h* | NY | 110.59 A | 109.99 A | 110.45 A | 109.95 A | 0.13 | 0.0010 | 0.0011 | 0.0490 |
| PY | 110.27 AB | 109.99 A | 110.23 A | 109.99 A | |||||
| GY | 109.15 aBC | 108.82 aB | 107.84 abB | 107.09 bB | |||||
| K | 108.84 | 108.99 B | 108.59 B | 108.27 B | |||||
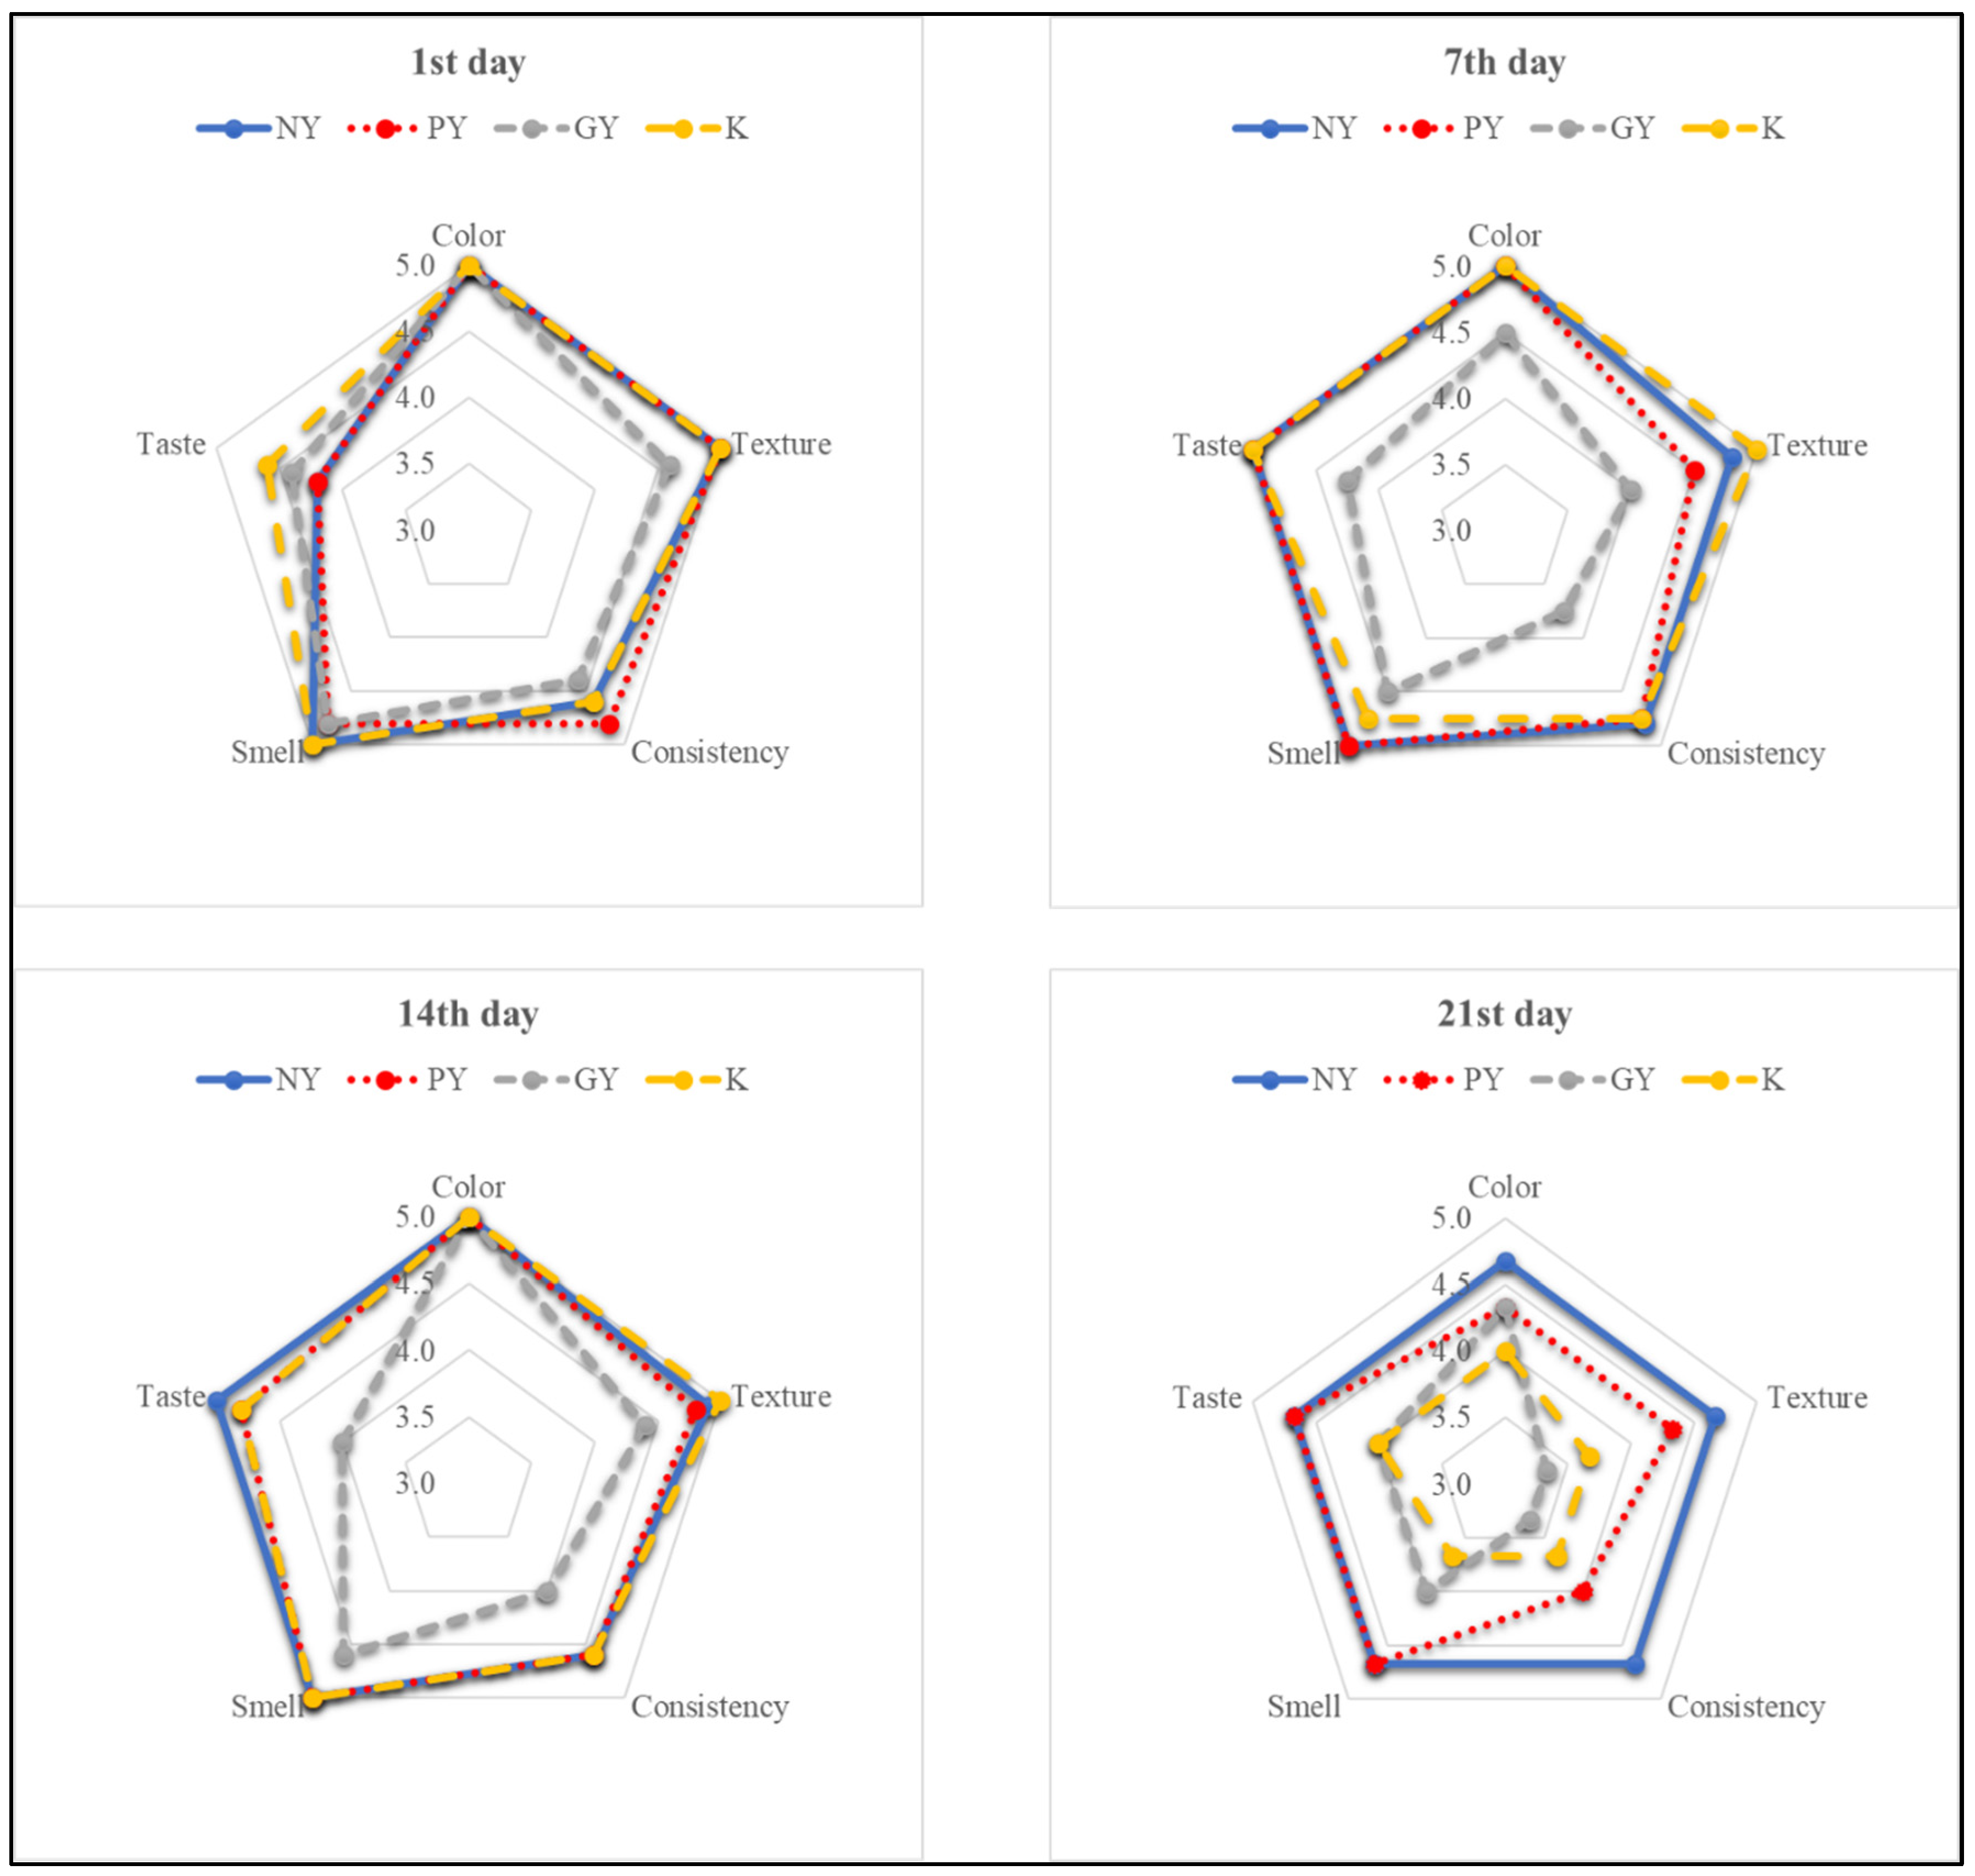
| Traits | Milk Drink | Storage Time (Days) | Se | Type of Drink | Time | Type of Drink × Time | |||
|---|---|---|---|---|---|---|---|---|---|
| 1 | 7 | 14 | 21 | p-Value | |||||
| Color | NY | 5.00 | 5.00 | 5.00 | 4.67 | 0.05 | 0.2220 | 0.0001 | 0.2473 |
| PY | 5.00 a | 5.00 a | 5.00 a | 4.33 b | |||||
| GY | 5.00 | 4.50 | 5.00 | 4.33 | |||||
| K | 5.00 a | 5.00 a | 5.00 a | 4.00 b | |||||
| Texture | NY | 5.00 | 4.80 | 4.90 | 4.67 A | 0,08 | 0.0013 | 0.0003 | 0.5392 |
| PY | 5.00 | 4.50 | 4.80 | 4.33 A | |||||
| GY | 4.60 | 4.00 | 4.40 | 3.33 B | |||||
| K | 5.00 a | 5.00 a | 5.00 a | 3.67 bB | |||||
| Consistency | NY | 4.60 | 4.80 | 4.60 | 4.67 | 0.10 | 0.0367 | 0.1343 | 0.9201 |
| PY | 4.80 | 4.75 | 4.60 | 4.00 | |||||
| GY | 4.40 | 3.75 | 4.00 | 3.33 | |||||
| K | 4.60 | 4.75 | 4.60 | 3.67 | |||||
| Smell | NY | 5.00 | 5.00 | 5.00 | 4.67 A | 0.06 | 0.0065 | 0.0001 | 0.2304 |
| PY | 4.80 | 5.00 | 5.00 | 4.67 A | |||||
| GY | 4.80 | 4.50 | 4.60 | 4.00 B | |||||
| K | 5.00 a | 4.75 a | 5.00 a | 3.67 bB | |||||
| Taste | NY | 4.20 | 5.00 | 5.00 | 4.67 | 0.09 | 0.1215 | 0.1704 | 0.6820 |
| PY | 4.20 | 5.00 | 4.80 | 4.67 | |||||
| GY | 4.40 | 4.25 | 4.00 | 4.00 | |||||
| K | 4.60 | 5.00 | 4.80 | 4.00 | |||||
| Overall assessment | NY | 4.80 | 4.90 | 5.00 | 4.67 A | 0.07 | 0.0026 | 0.0023 | 0.6573 |
| PY | 4.70 | 4.88 | 4.90 | 4.33 A | |||||
| GY | 4.50 | 4.25 | 4.30 | 3.83 B | |||||
| K | 4.80 a | 4.75 a | 4.90 a | 3.67 bB | |||||
Publisher’s Note: MDPI stays neutral with regard to jurisdictional claims in published maps and institutional affiliations. |
© 2022 by the authors. Licensee MDPI, Basel, Switzerland. This article is an open access article distributed under the terms and conditions of the Creative Commons Attribution (CC BY) license (https://creativecommons.org/licenses/by/4.0/).
Share and Cite
Czyżak-Runowska, G.; Wójtowski, J.A.; Łęska, B.; Bielińska-Nowak, S.; Pytlewski, J.; Antkowiak, I.; Stanisławski, D. Lactose Content and Selected Quality Parameters of Sheep Milk Fermented Beverages during Storage. Animals 2022, 12, 3105. https://doi.org/10.3390/ani12223105
Czyżak-Runowska G, Wójtowski JA, Łęska B, Bielińska-Nowak S, Pytlewski J, Antkowiak I, Stanisławski D. Lactose Content and Selected Quality Parameters of Sheep Milk Fermented Beverages during Storage. Animals. 2022; 12(22):3105. https://doi.org/10.3390/ani12223105
Chicago/Turabian StyleCzyżak-Runowska, Grażyna, Jacek Antoni Wójtowski, Bogusława Łęska, Sylwia Bielińska-Nowak, Jarosław Pytlewski, Ireneusz Antkowiak, and Daniel Stanisławski. 2022. "Lactose Content and Selected Quality Parameters of Sheep Milk Fermented Beverages during Storage" Animals 12, no. 22: 3105. https://doi.org/10.3390/ani12223105