

Effects of Feed Composition in Different Growth Stages on Rumen Fermentation and Microbial Diversity of Hanwoo Steers

Abstract
:Simple Summary
Abstract
1. Introduction
2. Materials and Methods
2.1. Animals, Diets, and Experimental Design
2.2. Chemical Analysis of Experimental Feed
2.3. Rumen Fermentation
2.4. Deoxyribonucleic Acids Extraction
2.5. Rumen Microbial Diversity
2.6. Statistical Analysis
3. Results and Discussion
4. Conclusions
Author Contributions
Funding
Institutional Review Board Statement
Informed Consent Statement
Data Availability Statement
Conflicts of Interest
References
- Oh, Y.G.; Nam, I.S.; Choi, C.W.; Baek, K.H.; Kim, J.H.; Kim, D.H.; Seol, Y.J.; Kim, K.H. Effects of different levels of CP intake on protein utilization and N excretion in varying growth stages of Hanwoo steers. J. Anim. Sci. Technol. 2007, 49, 369–378. [Google Scholar] [CrossRef]
- Jang, Y.S.; Yoon, D.H.; Kim, T.H.; Cheong, I.C.; Jo, J.K. Expression patterns of the differentially expressed genes during growth stages of Hanwoo (Koran Cattle). J. Anim. Sci. Technol. 2002, 44, 677–684. [Google Scholar] [CrossRef]
- Choi, C.W. Assessment of the Flow of Soluble Dietary Non-Ammonia Nitrogen Escaping Degradation in the Rumen of Dairy Cows Fed Grass Silage Based Diets. Ph.D. Thesis, University of Helsinki, Viikki, Finland, 2003. [Google Scholar]
- Wallace, R.J. Ecology of Rumen Micro-Organisms: Protein Use. Aspects of Digestive Physiology in Ruminants; Dobson, A., Dobson, M.J., Eds.; Cornell University Press: Ithaca, NY, USA, 1988; pp. 99–122. [Google Scholar]
- Wallace, R.J. Rumen proteolysis and its control. In Rumen Microbial Metabolism and Ruminant Digestion; Institut National de La Recherche Agronomiqu: Paris, France, 1991; pp. 131–150. [Google Scholar]
- Choi, C.W.; Baek, K.H.; Kang, S.W.; Lee, B.S.; Oh, Y.K.; Kim, K.H. Interpretation of protein feed degradation pattern in ruminant using an omasal digesta sampling technique. J. Anim. Sci. Technol. 2006, 48, 541–554. [Google Scholar] [CrossRef]
- Guarner, F. Enteric flora in health and disease. Digestion 2006, 73 (Suppl. 1), 5–12. [Google Scholar] [CrossRef] [PubMed]
- Malmuthuge, N.; Guan, L.L. Understanding host-microbial interactions in rumen: Searching the best opportunity for microbiota manipulation. J. Anim. Sci. Biotechnol. 2017, 8, 8. [Google Scholar] [CrossRef]
- Malmuthuge, N.; Griebel, P.J.; Guan, L.L. Taxonomic identification of commensal bacteria associated with the mucosa and digesta throughout the gastrointestinal tracts of preweaned calves. Appl. Environ. Microbiol. 2014, 80, 2021–2028. [Google Scholar] [CrossRef]
- Myer, P.R.; Freetly, H.C.; Wells, J.E.; Smith, T.P.L.; Kuehn, L.A. Analysis of the gut bacterial communities in beef cattle and their association with feed intake, growth, and efficiency. J. Anim. Sci. 2017, 95, 3215–3224. [Google Scholar] [CrossRef]
- Rosenberg, E.; Zilber-Rosenberg, I. Interaction between the microbiome and diet: The hologenome concept. J. Nutr. Food Sci. 2016, 6, 545. [Google Scholar] [CrossRef]
- Horwitz, W.; Latimer, G.; AOAC. Maryland International, 18th ed.; Official Methods of Analysis of AOAC; Association of Official Analytical Chemists: Gaithersburg, MD, USA, 2005. [Google Scholar]
- Van Soest, P.J.; Robertson, J.B.; Lewis, B.A. Methods for dietary fiber, neutral detergent fiber, and nonstarch polysaccharides in relation to animal nutrition. J. Dairy Sci. 1991, 74, 3583–3597. [Google Scholar] [CrossRef]
- Licitra, G.; Hernandez, T.M.; Van Soest, P.J. Standardization of procedures for nitrogen fractionation of ruminant feeds. Anim. Feed Sci. Technol. 1996, 57, 347–358. [Google Scholar] [CrossRef]
- NRC (National Research Council). Nutrient Requirements of Dairy Cattle, 7th rev. ed.; National Academies Press: Washington, DC, USA, 2001.
- Duffield, T.; Plaizier, J.C.; Fairfield, A.; Bagg, R.; Vessie, G.; Dick, P.; Wilson, J.; Aramini, J.; McBride, B. Comparison of techniques for measurement of rumen pH in lactating dairy cows. J. Dairy Sci. 2004, 87, 59–66. [Google Scholar] [CrossRef]
- Erwin, E.S.; Marco, G.J.; Emery, E.M. Volatile fatty acid analyses of blood and rumen fluid by gas chromatography. J. Dairy Sci. 1961, 44, 1768–1771. [Google Scholar] [CrossRef]
- Chaney, A.L.; Marbach, E.P. Modified reagents for determination of urea and ammonia. Clin. Chem. 1962, 8, 130–132. [Google Scholar] [CrossRef] [PubMed]
- Yu, Z.; Morrison, M. Improved extraction of PCR-quality community DNA from digesta and fecal samples. BioTechniques 2004, 36, 808–812. [Google Scholar] [CrossRef] [PubMed]
- Magoč, T.; Salzberg, S.L. FLASH: Fast length adjustment of short reads to improve genome assemblies. Bioinformatics. 2011, 27, 2957–2963. [Google Scholar] [CrossRef] [PubMed]
- Caporaso, J.G.; Kuczynski, J.; Stombaugh, J.; Bittinger, K.; Bushman, F.D.; Costello, E.K.; Fierer, N.; Peña, A.G.; Goodrich, J.K.; Gordon, J.I.; et al. QIIME allows analysis of high-throughput community sequencing data. Nat. Methods. 2010, 7, 335–336. [Google Scholar] [CrossRef]
- Reddy, K.E.; Kim, H.R.; Jeong, J.Y.; So, K.M.; Lee, S.; Ji, S.Y.; Kim, M.; Lee, H.J.; Lee, S.; Kim, K.H.; et al. Impact of breed on the fecal microbiome of dogs under the same dietary condition. J. Microbiol. Biotechnol. 2019, 29, 1947–1956. [Google Scholar] [CrossRef]
- Kittelmann, S.; Seedorf, H.; Walters, W.A.; Clemente, J.C.; Knight, R.; Gordon, J.I.; Janssen, P.H. Simultaneous amplicon sequencing to explore co-occurrence patterns of bacterial, archaeal and eukaryotic microorganisms in rumen microbial communities. PLoS ONE 2013, 8, e47879. [Google Scholar] [CrossRef]
- Kittelmann, S.; Janssen, P.H. Characterization of rumen ciliate community composition in domestic sheep, deer, and cattle, feeding on varying diets, by means of PCR-DGGE and clone libraries. FEMS Microbiol. Ecol. 2011, 75, 468–481. [Google Scholar] [CrossRef]
- Regensbogenova, M.; Pristas, P.; Javorsky, P.; Moon-van der Staay, S.Y.; Van Der Staay, G.W.M.; Hackstein, J.H.P.; Newbold, C.J.; McEwan, N.R.; McEwan, N.R. Assessment of ciliates in the sheep rumen by DGGE. Lett. Appl. Microbiol. 2004, 39, 144–147. [Google Scholar] [CrossRef]
- Hiltner, P.; Dehority, B.A. Effect of soluble carbohydrates on digestion of cellulose by pure cultures of rumen bacteria. Appl. Environ. Microbiol. 1983, 46, 642–648. [Google Scholar] [CrossRef]
- Stiles, D.A.; Bartley, E.E.; Meyer, R.M.; Deyoe, C.W.; Pfost, H.B. Feed processing. VII. Effect of an expansion-processed mixture of grain and urea (Starea) on rumen metabolism in cattle and on urea toxicity. J. Dairy Sci. 1970, 53, 1436–1447. [Google Scholar] [CrossRef]
- Calabrò, S.; Infascelli, F.; Bovera, F.; Moniello, G.; Piccolo, V. In vitro degradability of three forages: Fermentation kinetics and gas production of NDF and neutral detergent-soluble fraction of forages. J. Sci. Food Agric. 2002, 82, 222–229. [Google Scholar] [CrossRef]
- David, T.M.; Oh, S.J.; Lee, A.R.; Chae, J.I.; Choi, C.W.; Choi, N.J. In vitro rumen fermentation patterns of environment friendly whole crop barley, Italian ryegrass and rice straw silages. Korean J. Org. Agric. 2012, 20, 221–230. [Google Scholar]
- Park, S.H.; Baek, Y.C.; Lee, S.; Kim, B.H.; Ryu, C.H. Evaluation the Feed Value of Whole Crop Rice Silage and Comparison of Rumen Fermentation according to Its Ratio. J. Korean Soc. Grassl. Forage Sci. 2020, 40, 236–243. [Google Scholar] [CrossRef]
- Tajima, K.; Nonaka, I.; Higuchi, K.; Takusari, N.; Kurihara, M.; Takenaka, A.; Mitsumori, M.; Kajikawa, H.; Aminov, R.I. Influence of high temperature and humidity on rumen bacterial diversity in Holstein heifers. Anaerobe 2007, 13, 57–64. [Google Scholar] [CrossRef]
- Nesengani, L.T.; Wang, J.; Yang, Y.; Yang, L.; Lu, W. Unravelling vaginal microbial genetic diversity and abundance between Holstein and Fleckvieh cattle. RSC Adv. 2017, 7, 56137–56143. [Google Scholar] [CrossRef]
- de Menezes, A.B.; Lewis, E.; O’Donovan, M.; O’Neill, B.F.; Clipson, N.; Doyle, E.M. Microbiome analysis of dairy cows fed pasture or total mixed ration diets. FEMS Microbiol. Ecol. 2011, 78, 256–265. [Google Scholar] [CrossRef]
- Mao, S.Y.; Zhang, R.Y.; Wang, D.S.; Zhu, W.Y. Impact of subacute ruminal acidosis (SARA) adaptation on rumen microbiota in dairy cattle using pyrosequencing. Anaerobe 2013, 24, 12–19. [Google Scholar] [CrossRef]
- Henderson, G.; Cox, F.; Ganesh, S.; Jonker, A.; Young, W.; Global Rumen Census Collaborators; Janssen, P.H. Rumen microbial community composition varies with diet and host, but a core microbiome is found across a wide geographical range. Sci. Rep. 2015, 5, 14567. [Google Scholar] [CrossRef]
- Morotomi, M.; Nagai, F.; Sakon, H.; Tanaka, R. Paraprevotella clara gen. nov., sp. nov. and Paraprevotella xylaniphila sp. nov., members of the family ’Prevotellaceae’ isolated from human faeces. Int. J. Syst. Evol. Microbiol. 2009, 59, 1895–1900. [Google Scholar] [CrossRef] [PubMed]
- Heath, I.B.; Bauchop, T.; Skipp, R.A. Assignment of the rumen anaerobe Neocallimastix frontalis to the Spizellomycetales (Chytridiomycetes) on the basis of its polyflagellate zoospore ultrastructure. Can. J. Bot. 1983, 61, 295–307. [Google Scholar] [CrossRef]


| Items | G | EF | LF | |||
|---|---|---|---|---|---|---|
| Timothy | Concentrate | Grass Hay | Concentrate | Rice Straw | Concentrate | |
| Dry matter (DM), % | 94.3 | 91.9 | 95.6 | 96.8 | 95.3 | 96.8 |
| % DM | ||||||
| Crude protein (CP) | 7.4 | 18.8 | 7.9 | 16.8 | 6.5 | 15.9 |
| Ether extract | 1.1 | 4.8 | 1.4 | 3.5 | 0.9 | 3.4 |
| Non-fiber carbohydrate | 20.7 | 32.5 | 24.5 | 52.2 | 23.6 | 49.5 |
| Neutral detergent fiber | 66.4 | 38.9 | 65.0 | 24.7 | 66.6 | 27.5 |
| Acid detergent fiber | 43.1 | 18.3 | 39.3 | 12.4 | 50.9 | 13.4 |
| Crude ash | 9.7 | 10.3 | 6.1 | 8.6 | 8.1 | 9.2 |
| Neutral detergent insoluble CP | 5.4 | 5.2 | 4.8 | 5.8 | 5.8 | 5.5 |
| Acid detergent insoluble CP | 1.2 | 1.5 | 1.5 | 1.0 | 2.0 | 1.1 |
| Acid detergent lignin | 5.7 | 5.5 | 5.0 | 3.2 | 7.1 | 4.1 |
| Items | Primer | References |
|---|---|---|
| Bacteria | 341F 5′-CCTACGGGNGGCWGCAG-3′ 805R 5′-GACTACHVGGGTATCTAATCC-3′ | [22] |
| Archaea | 915aF 5′-AGGAATTGGCGGGGGAGCAC-3′, 386R GCGGTGTGTGCAAGGAGC-3′ | [23] |
| Fungi | MN100F 5′-TCCTACCCTTTGTGAATTTG-3′ MNGM2 5′-CTGCGTTCTTCATCGTTGCG-3′ | [23] |
| Protozoa | 841F 5′-GACTAGGGATTGGAGTGG-3′ 1302R 5′-AATTGCAAAGATCTATCCC-3′ | [24,25] |
| Items | G | EF | LF | SEM | p-Value |
|---|---|---|---|---|---|
| pH | 5.93 | 6.35 | 6.28 | 0.475 | 0.110 |
| Ammonia nitrogen, mg/dL | 23.97 | 21.83 | 19.12 | 1.866 | 0.148 |
| Total volatile fatty acid, mM | 106.96 b | 87.34 a | 70.02 a | 8.070 | 0.006 |
| Acetate, % | 61.06 | 57.68 | 57.82 | 4.532 | 0.276 |
| Propionate, % | 19.79 a | 21.19 b | 21.53 b | 1.605 | 0.019 |
| Butyrate, % | 16.82 | 16.13 | 15.46 | 1.284 | 0.537 |
| Valerate, % | 3.33 a | 5.02 b | 5.20 b | 0.425 | 0.000 |
| Acetate to propionate ratio | 3.05 b | 2.72 a | 2.69 a | 0.223 | 0.036 |
| Items | G | EF | LF |
|---|---|---|---|
| Bacteria | |||
| OTUs | 513.00 | 575.25 | 555.00 |
| Chao1 | 640.36 | 682.77 | 683.27 |
| Shannon | 6.16 | 6.30 | 6.73 |
| Gini-Simpson | 0.95 | 0.95 | 0.98 |
| Good’s Coverage | 1.00 | 1.00 | 1.00 |
| Archaea | |||
| OTUs | 63.25 | 65.00 | 69.75 |
| Chao1 | 82.65 | 86.94 | 118.49 |
| Shannon | 1.23 | 1.46 | 1.73 |
| Gini-Simpson | 0.41 | 0.49 | 0.61 |
| Good’s Coverage | 1.00 | 1.00 | 1.00 |
| Fungi | |||
| OTUs | 18.00 | 18.00 | 18.75 |
| Chao1 | 18.25 | 18.00 | 19.00 |
| Shannon | 2.47 | 2.02 | 2.37 |
| Gini-Simpson | 0.79 | 0.71 | 0.75 |
| Good’s Coverage | 1.00 | 1.00 | 1.00 |
| Protozoa | |||
| OTUs | 10.00 | 9.50 | 9.50 |
| Chao1 | 10.25 | 10.13 | 10.25 |
| Shannon | 0.37 | 0.47 | 0.34 |
| Gini-Simpson | 0.11 | 0.14 | 0.10 |
| Good’s Coverage | 1.00 | 1.00 | 1.00 |
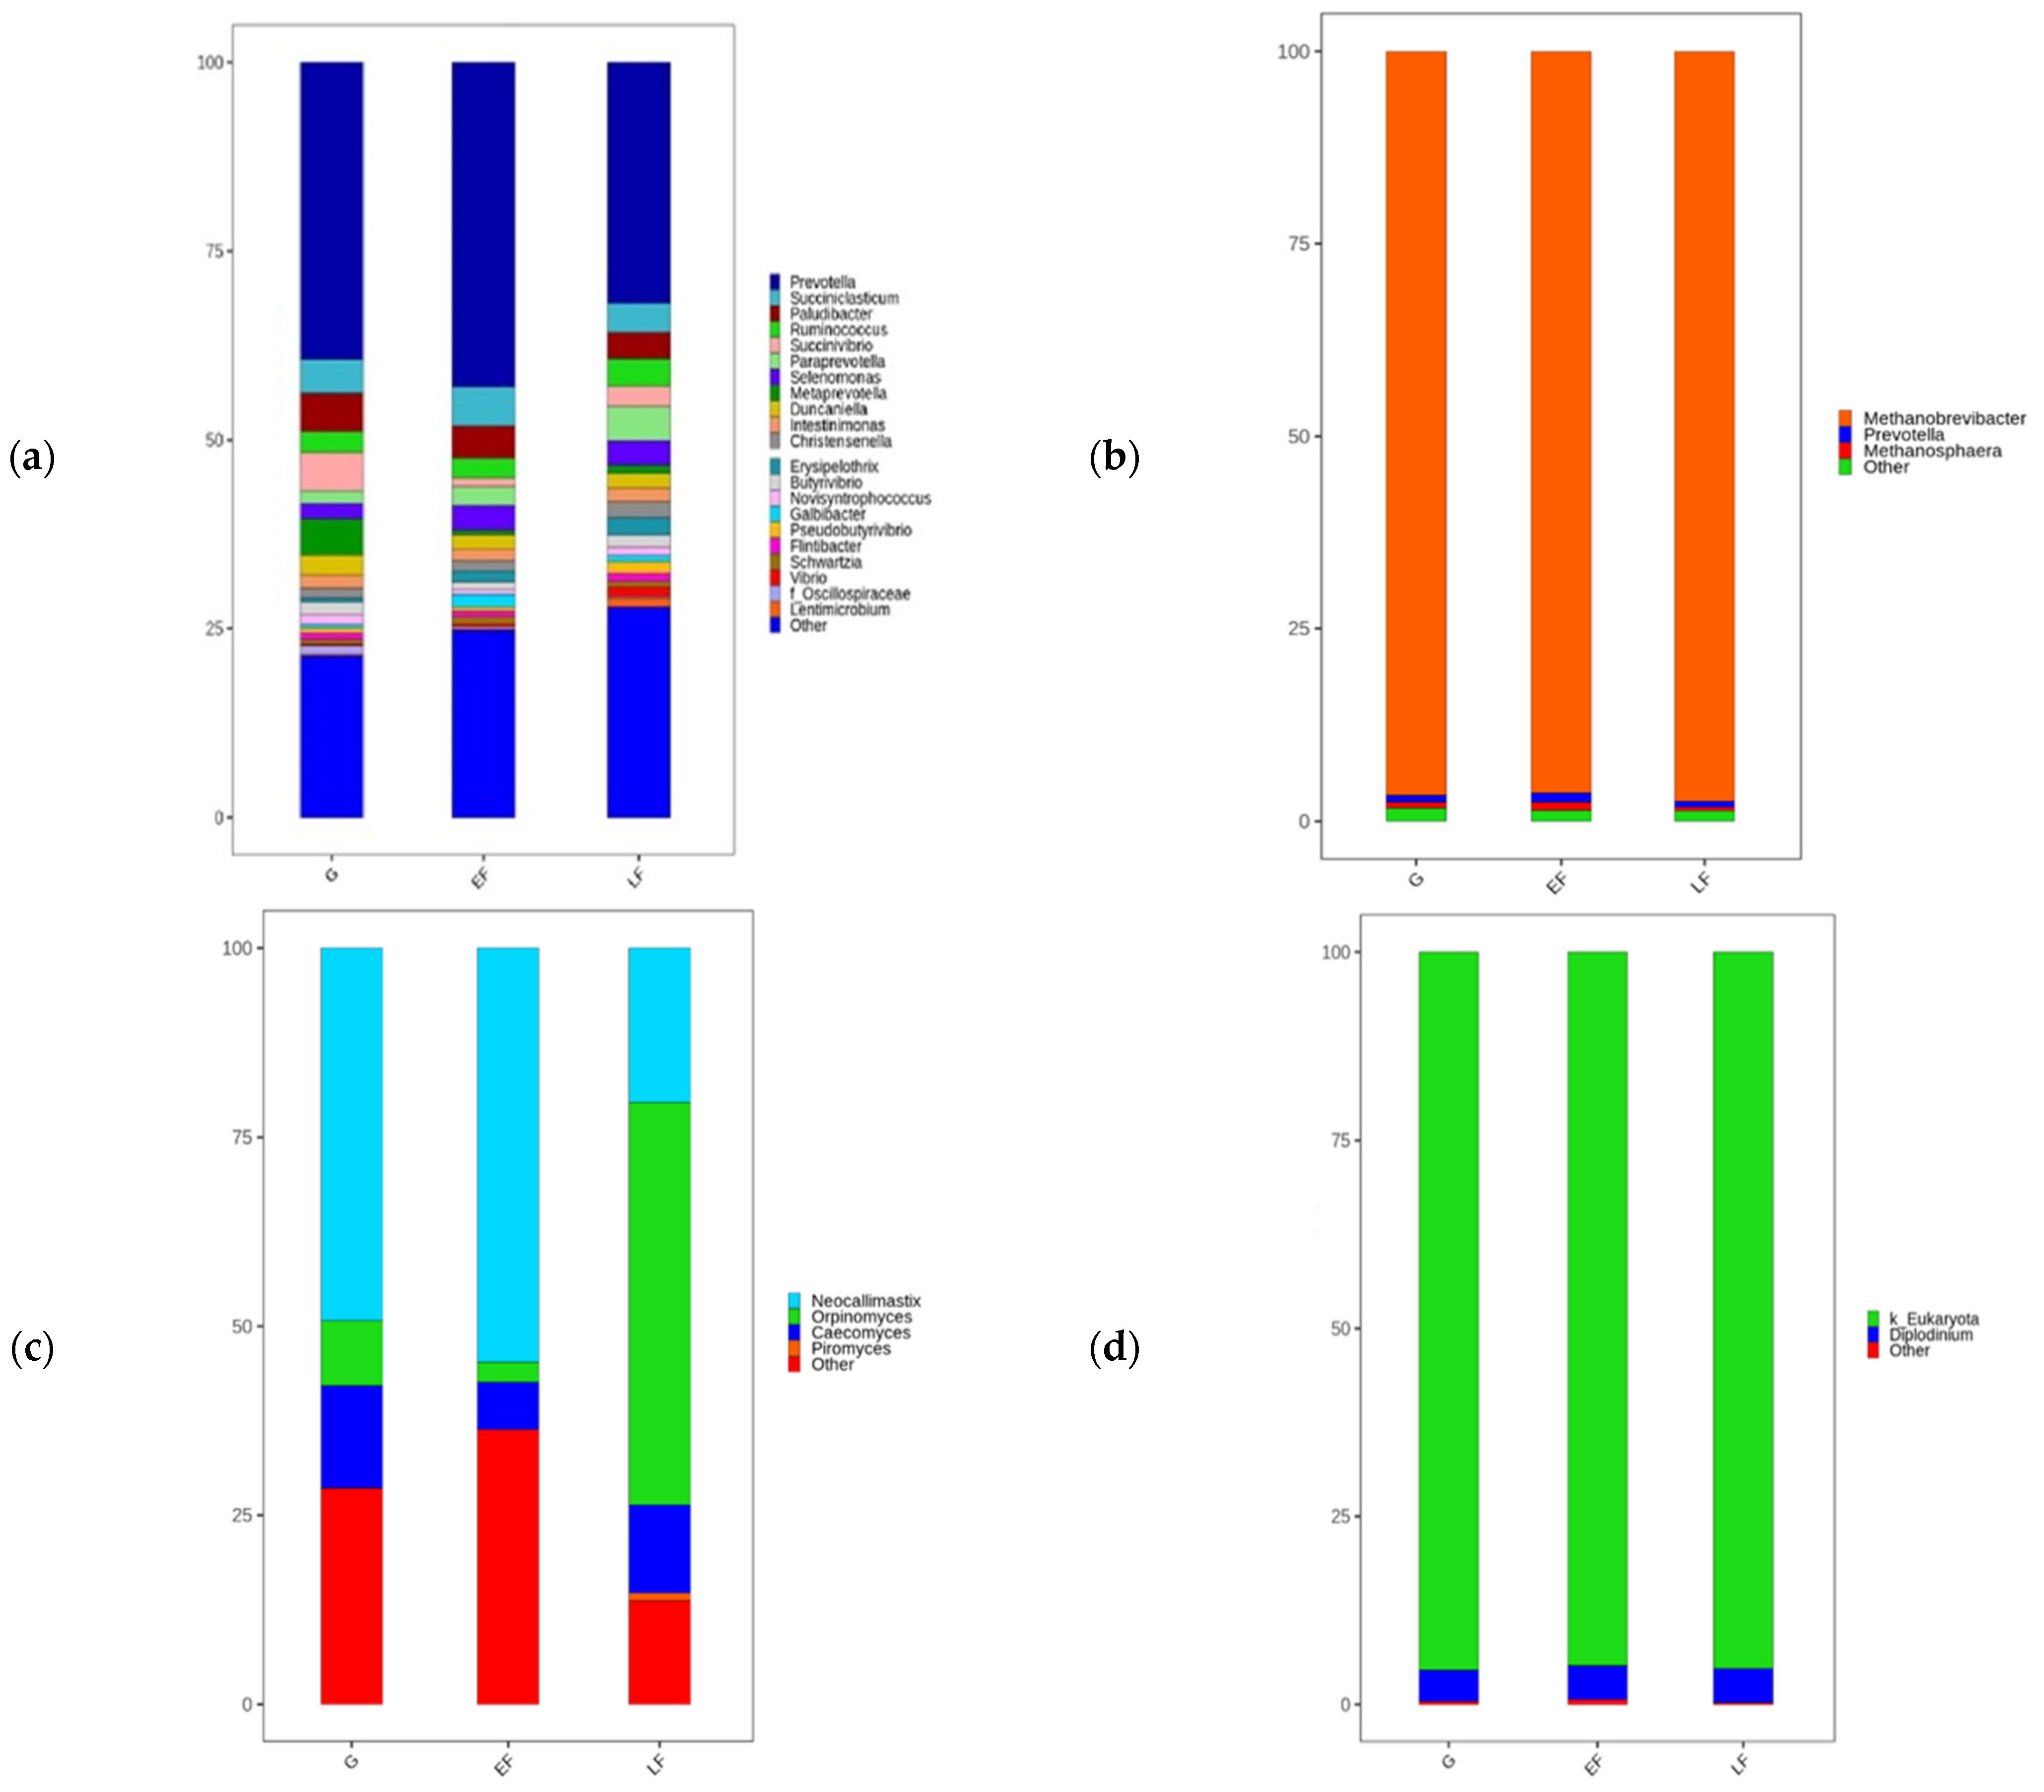
| Phylum | Family | Genus | G | EF | LF |
|---|---|---|---|---|---|
| Bacteria | |||||
| Actinobacteria | Bifidobacteriaceae | Bifidobacterium | 0.00 | 0.01 | 0.00 |
| Bacteroidetes | Bacteroidaceae | Bacteroides | 0.00 | 0.00 | 0.01 |
| Barnesiellaceae | Barnesiella | 0.00 | 0.00 | 0.00 | |
| Lentimicrobiaceae | Lentimicrobium | 0.00 | 0.00 | 0.01 | |
| Muribaculaceae | Duncaniella | 0.03 | 0.02 | 0.02 | |
| Muribaculum | 0.00 | 0.00 | 0.00 | ||
| Paludibacteraceae | Paludibacter | 0.02 | 0.03 | 0.04 | |
| Porphyromonadaceae | Porphyromonas | 0.00 | 0.00 | 0.00 | |
| Prevotellaceae | Marseilla | 0.00 | 0.00 | 0.00 | |
| Metaprevotella | 0.07 b | 0.01 a | 0.01 a | ||
| Paraprevotella | 0.02 a | 0.02 a | 0.04 b | ||
| Prevotella | 0.35 | 0.43 | 0.32 | ||
| Prevotellamassilia | 0.00 | 0.00 | 0.00 | ||
| Tannerellaceae | Parabacteroides | 0.00 | 0.00 | 0.01 | |
| Flavobacteriaceae | Capnocytophaga | 0.00 | 0.01 | 0.01 | |
| Galbibacter | 0.00 | 0.01 | 0.01 | ||
| Fibrobacteres | Fibrobacteraceae | Fibrobacter | 0.01 | 0.01 | 0.00 |
| Firmicutes | Streptococcaceae | Streptococcus | 0.00 | 0.01 | 0.01 |
| __ | Flintibacter | 0.01 | 0.01 | 0.01 | |
| __ | Intestinimonas | 0.02 | 0.01 | 0.02 | |
| Christensenellaceae | hristensenella | 0.01 a | 0.01 a | 0.02 b | |
| Clostridiaceae | Falcatimonas | 0.00 | 0.00 | 0.00 | |
| Eubacteriaceae | Eubacterium | 0.00 | 0.01 | 0.01 | |
| Gracilibacteraceae | Gracilibacter | 0.01 b | 0.00 a | 0.01 ab | |
| Lachnospiraceae | Blautia | 0.00 | 0.00 | 0.00 | |
| Butyribacter | 0.00 | 0.00 | 0.00 | ||
| Butyrivibrio | 0.02 | 0.01 | 0.02 | ||
| Enterocloster | 0.01 | 0.01 | 0.01 | ||
| Faecalicatena | 0.00 | 0.00 | 0.00 | ||
| Lachnoanaerobaculum | 0.001 | 0.00 | 0.00 | ||
| Lachnoclostridium | 0.00 | 0.00 | 0.00 | ||
| Mediterraneibacter | 0.00 | 0.00 | 0.00 | ||
| Novisyntrophococcus | 0.02 | 0.01 | 0.01 | ||
| Pseudobutyrivibrio | 0.01 | 0.01 | 0.02 | ||
| Tyzzerella | 0.00 | 0.0 | 0.0 | ||
| Oscillospiraceae | __ | 0.01 b | 0.00 a | 0.00 b | |
| Acetivibrio | 0.00 a | 0.00 ab | 0.01 b | ||
| Anaerobacterium | 0.00 | 0.01 | 0.01 | ||
| Ethanoligenens | 0.01 | 0.01 | 0.01 | ||
| Ruminococcus | 0.03 | 0.03 | 0.04 | ||
| Saccharofermentans | 0.01 | 0.01 | 0.01 | ||
| Sporobacter | 0.00 | 0.00 | 0.00 | ||
| Coprobacillaceae | Kandleria | 0.00 | 0.00 | 0.01 | |
| Erysipelotrichaceae | Erysipelothrix | 0.01 | 0.02 | 0.02 | |
| Acidaminococcaceae | Succiniclasticum | 0.04 ab | 0.06 b | 0.04 a | |
| Selenomonadaceae | Anaerovibrio | 0.01 | 0.01 | 0.01 | |
| Mitsuokella | 0.01 | 0.01 | 0.00 | ||
| Schwartzia | 0.01 | 0.01 | 0.01 | ||
| Selenomonas | 0.02 | 0.03 | 0.03 | ||
| Proteobacteria | Kiloniellaceae | Curvivirga | 0.00 | 0.01 | 0.00 |
| Rhodospirillaceae | Rhodospirillum | 0.00 | 0.00 | 0.00 | |
| Succinivibrionaceae | Succinivibrio | 0.06 | 0.01 | 0.03 | |
| Vibrionaceae | Vibrio | 0.00 | 0.01 | 0.01 | |
| Spirochaetes | Treponemataceae | Treponema | 0.00 | 0.00 | 0.00 |
| Unclassified | Unclassified | unclassified | 0.06 | 0.08 | 0.09 |
| Archaea | |||||
| Candidatus Thermoplasmatota | Methanomassiliicoccaceae | Methanomassiliicoccus | 0.00 | 0.00 | 0.00 |
| Euryarchaeota | Methanobacteriaceae | Methanobrevibacter | 0.96 | 0.95 | 0.97 |
| Methanosphaera | 0.01 a | 0.02 b | 0.01 a | ||
| Unclassified | unclassified | unclassified | 0.02 | 0.02 | 0.01 |
| Fungi | |||||
| Unassigned | other | other | 0.00 a | 0.05b | 0.00 a |
| Other | other | other | 0.06 | 0.02 | 0.02 |
| Neocallimastigomycota | Neocallimastigaceae | other | 0.23 | 0.29 | 0.14 |
| Caecomyces | 0.15 b | 0.02 a | 0.12 b | ||
| Neocallimastix | 0.51 b | 0.62 b | 0.23 a | ||
| Orpinomyces | 0.06 a | 0.01 a | 0.48 b | ||
| Piromyces | 0.00 | 0.00 | 0.01 | ||
| unclassified | 0.00 | 0.00 | 0.00 | ||
| Eukaryota | |||||
| Unclassified | unclassified | unclassified | 0.95 | 0.97 | 0.95 |
| Ciliophora | Ophryoscolecidae | Diplodinium | 0.05 | 0.02 | 0.05 |
| Isotrichidae | Isotricha | 0.00 | 0.00 | 0.00 |
Publisher’s Note: MDPI stays neutral with regard to jurisdictional claims in published maps and institutional affiliations. |
© 2022 by the authors. Licensee MDPI, Basel, Switzerland. This article is an open access article distributed under the terms and conditions of the Creative Commons Attribution (CC BY) license (https://creativecommons.org/licenses/by/4.0/).
Share and Cite
Ryu, C.H.; Bang, H.T.; Lee, S.; Kim, B.; Baek, Y.C. Effects of Feed Composition in Different Growth Stages on Rumen Fermentation and Microbial Diversity of Hanwoo Steers. Animals 2022, 12, 2606. https://doi.org/10.3390/ani12192606
Ryu CH, Bang HT, Lee S, Kim B, Baek YC. Effects of Feed Composition in Different Growth Stages on Rumen Fermentation and Microbial Diversity of Hanwoo Steers. Animals. 2022; 12(19):2606. https://doi.org/10.3390/ani12192606
Chicago/Turabian StyleRyu, Chae Hwa, Han Tae Bang, Seul Lee, Byeonghyeon Kim, and Youl Chang Baek. 2022. "Effects of Feed Composition in Different Growth Stages on Rumen Fermentation and Microbial Diversity of Hanwoo Steers" Animals 12, no. 19: 2606. https://doi.org/10.3390/ani12192606