
Animal Detection and Classification from Camera Trap Images Using Different Mainstream Object Detection Architectures

 ,
,
Abstract
:Simple Summary
Abstract
1. Introduction
2. Materials and Methods
2.1. Dataset Construction
2.2. Object Detection Network
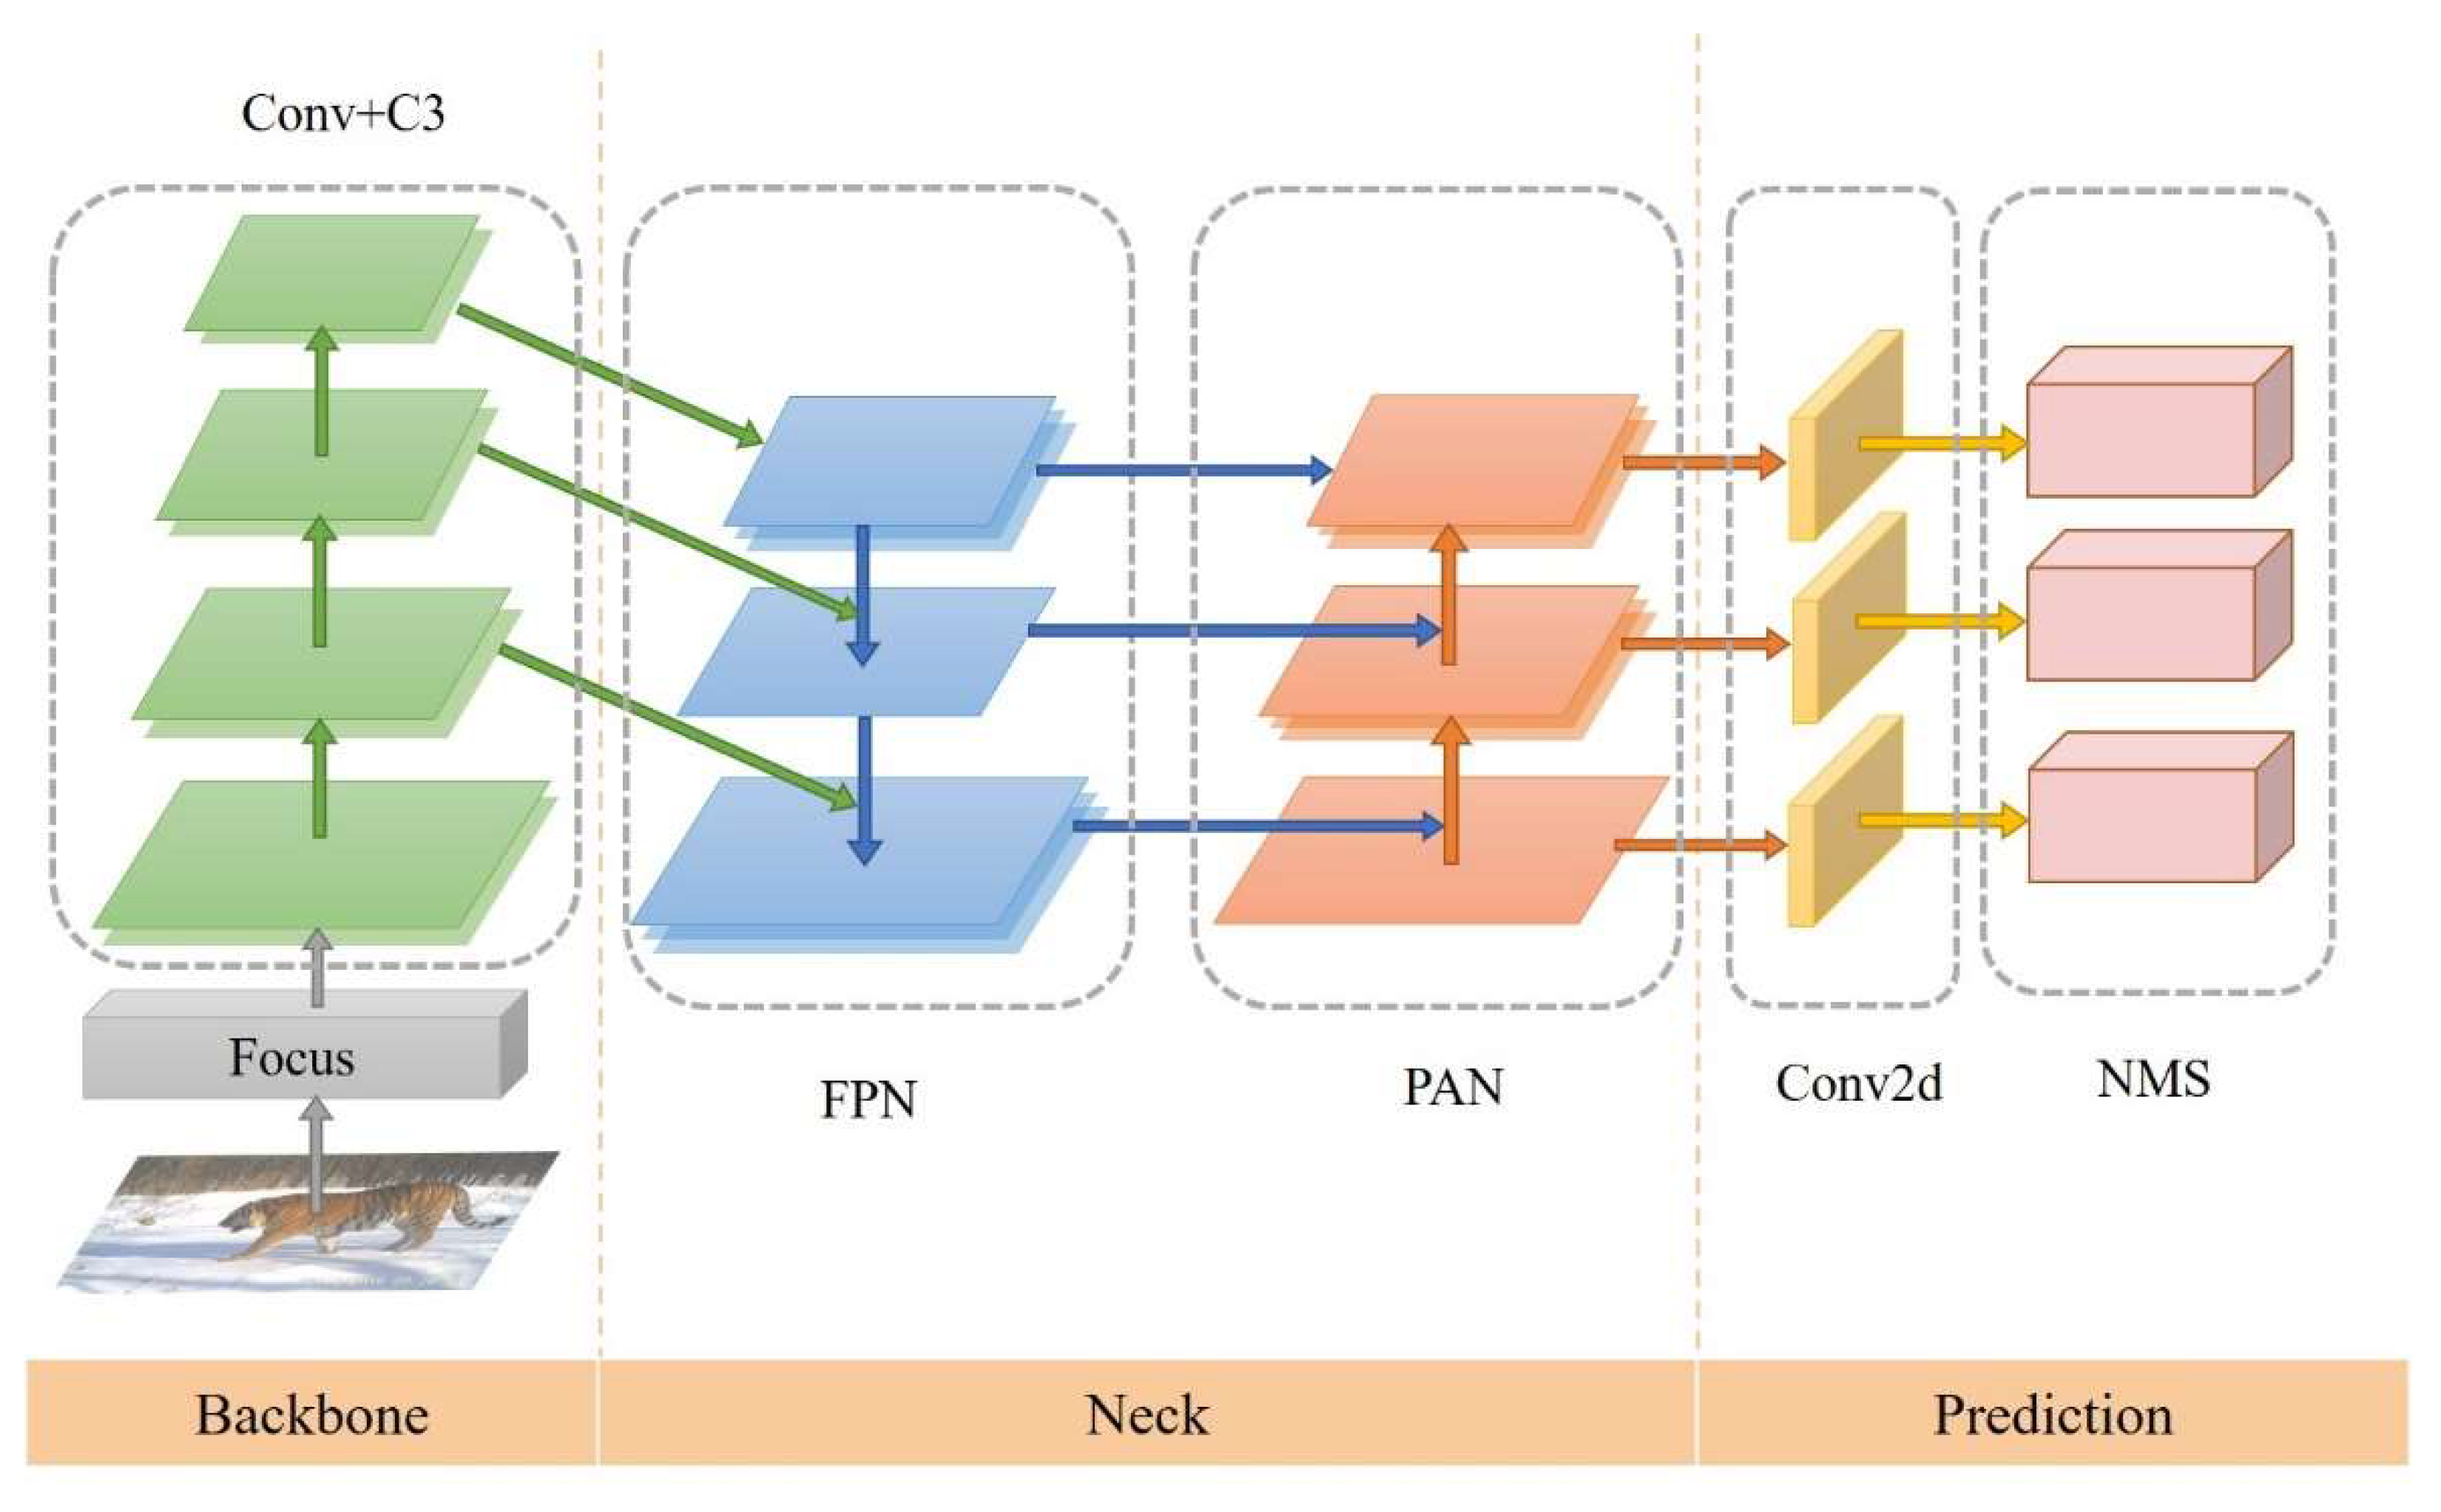
2.2.1. YOLOV5
- 1.
- Architecture Overview
- 2.
- Implementation Details
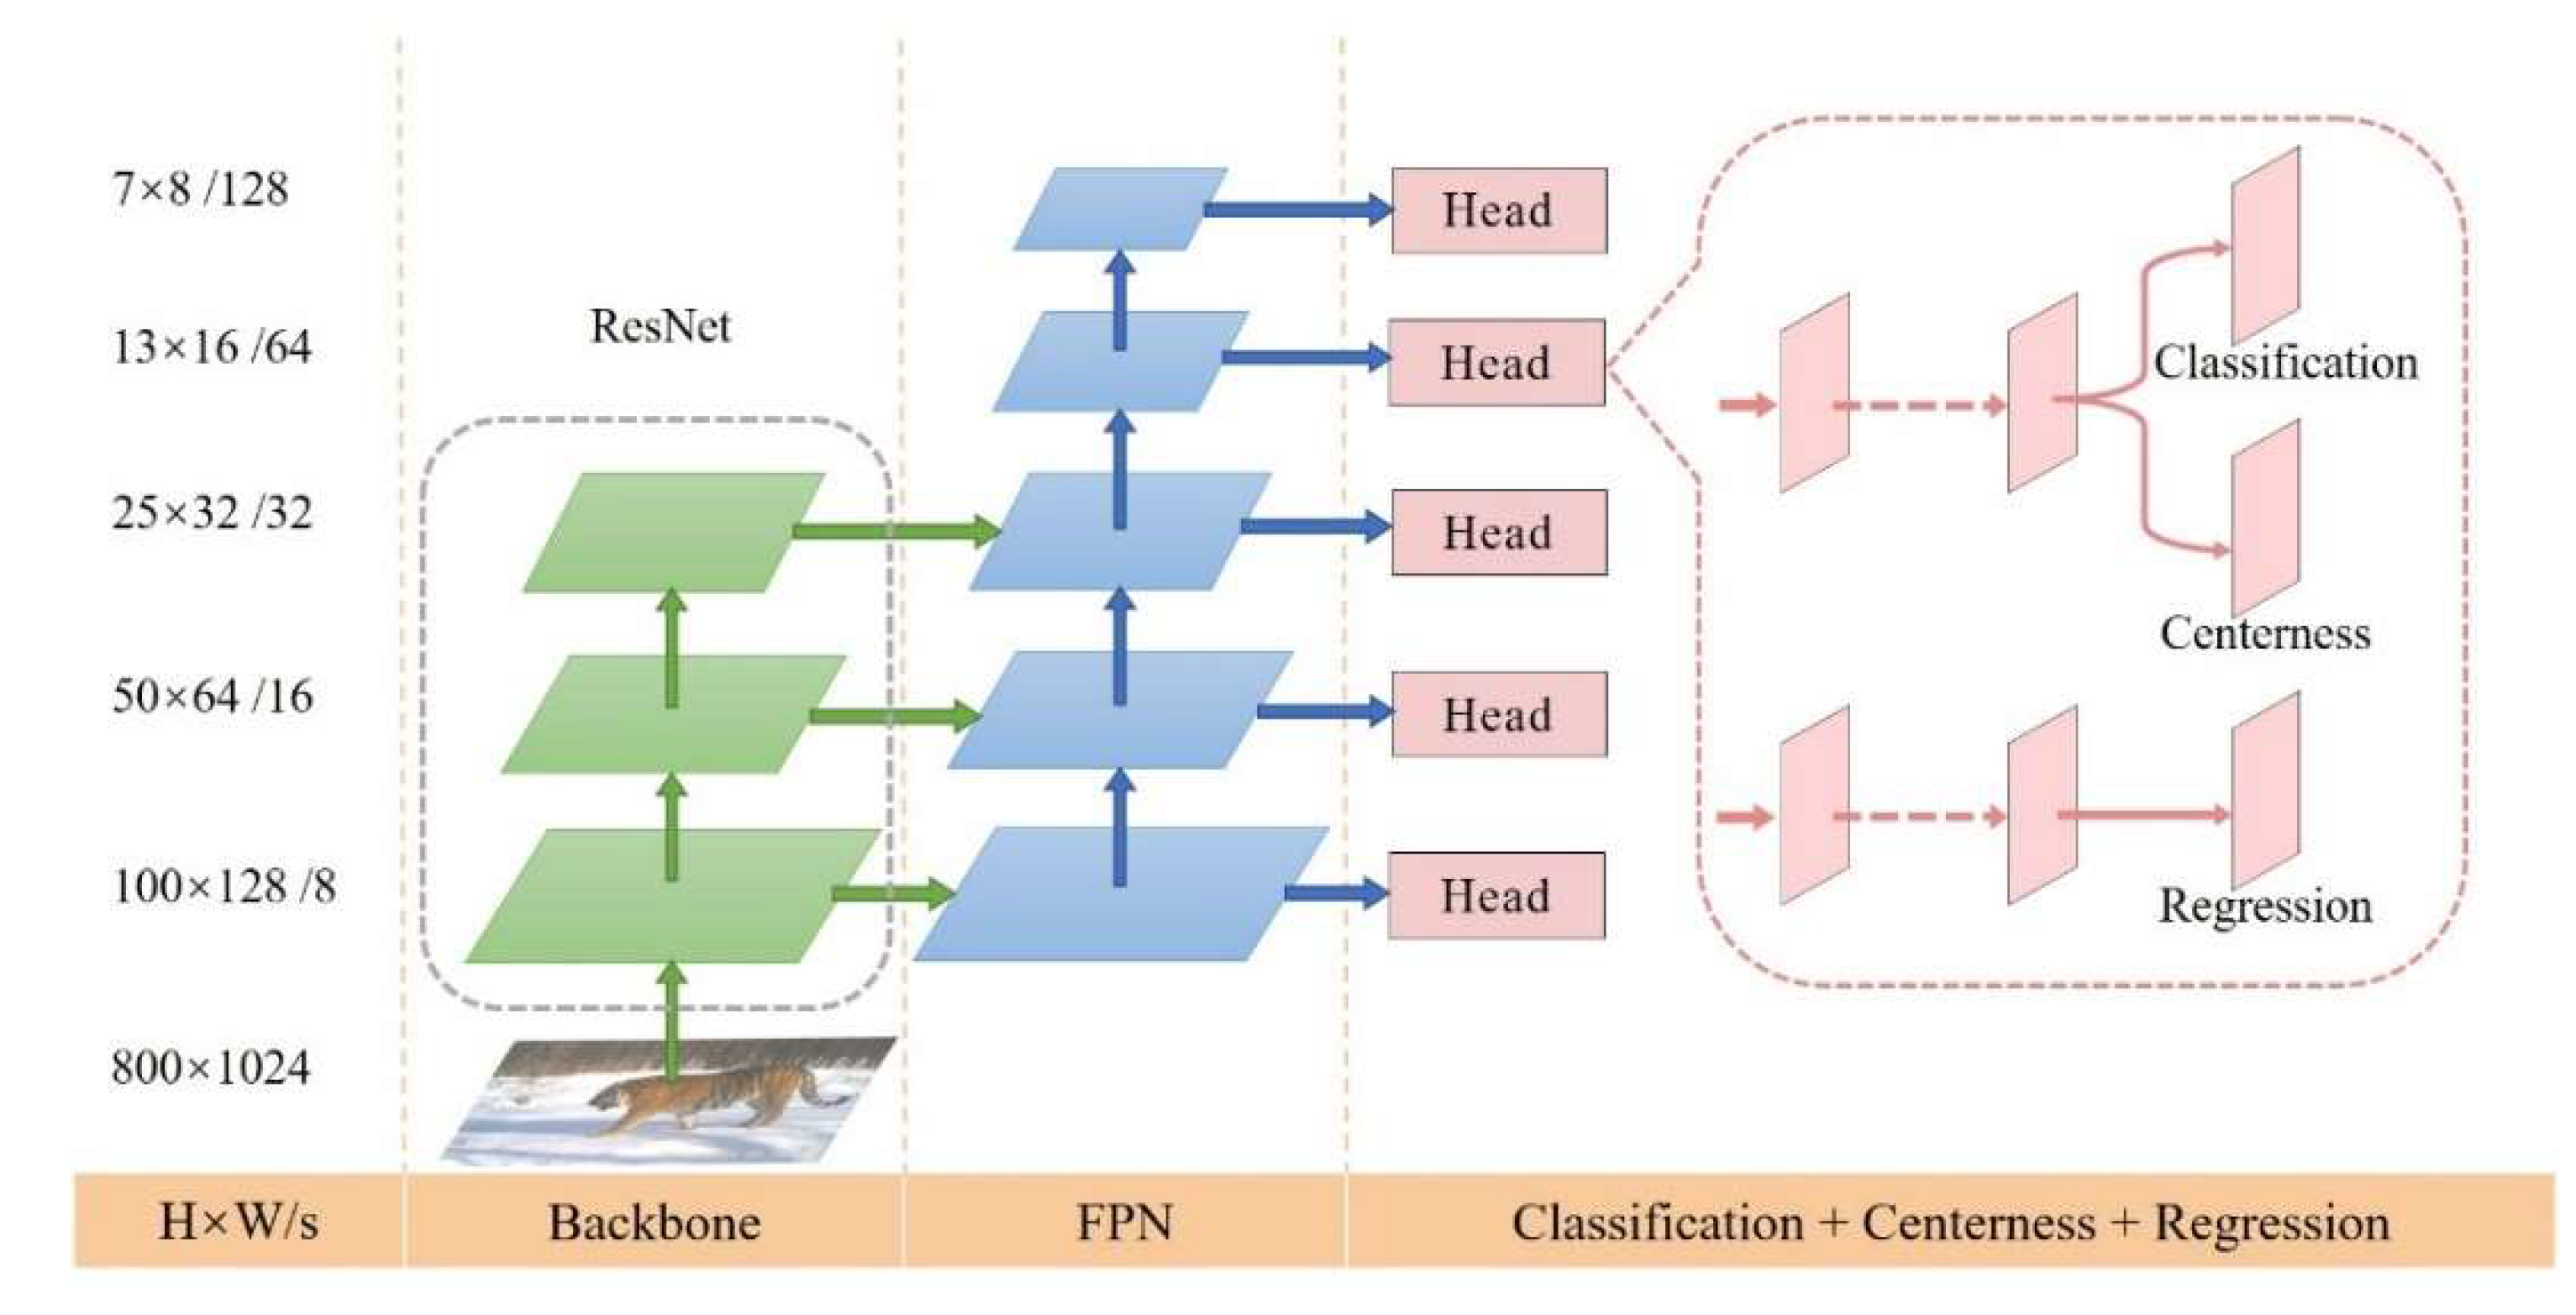
2.2.2. FCOS
- 1.
- Architecture Overview
- 2.
- Implementation Details
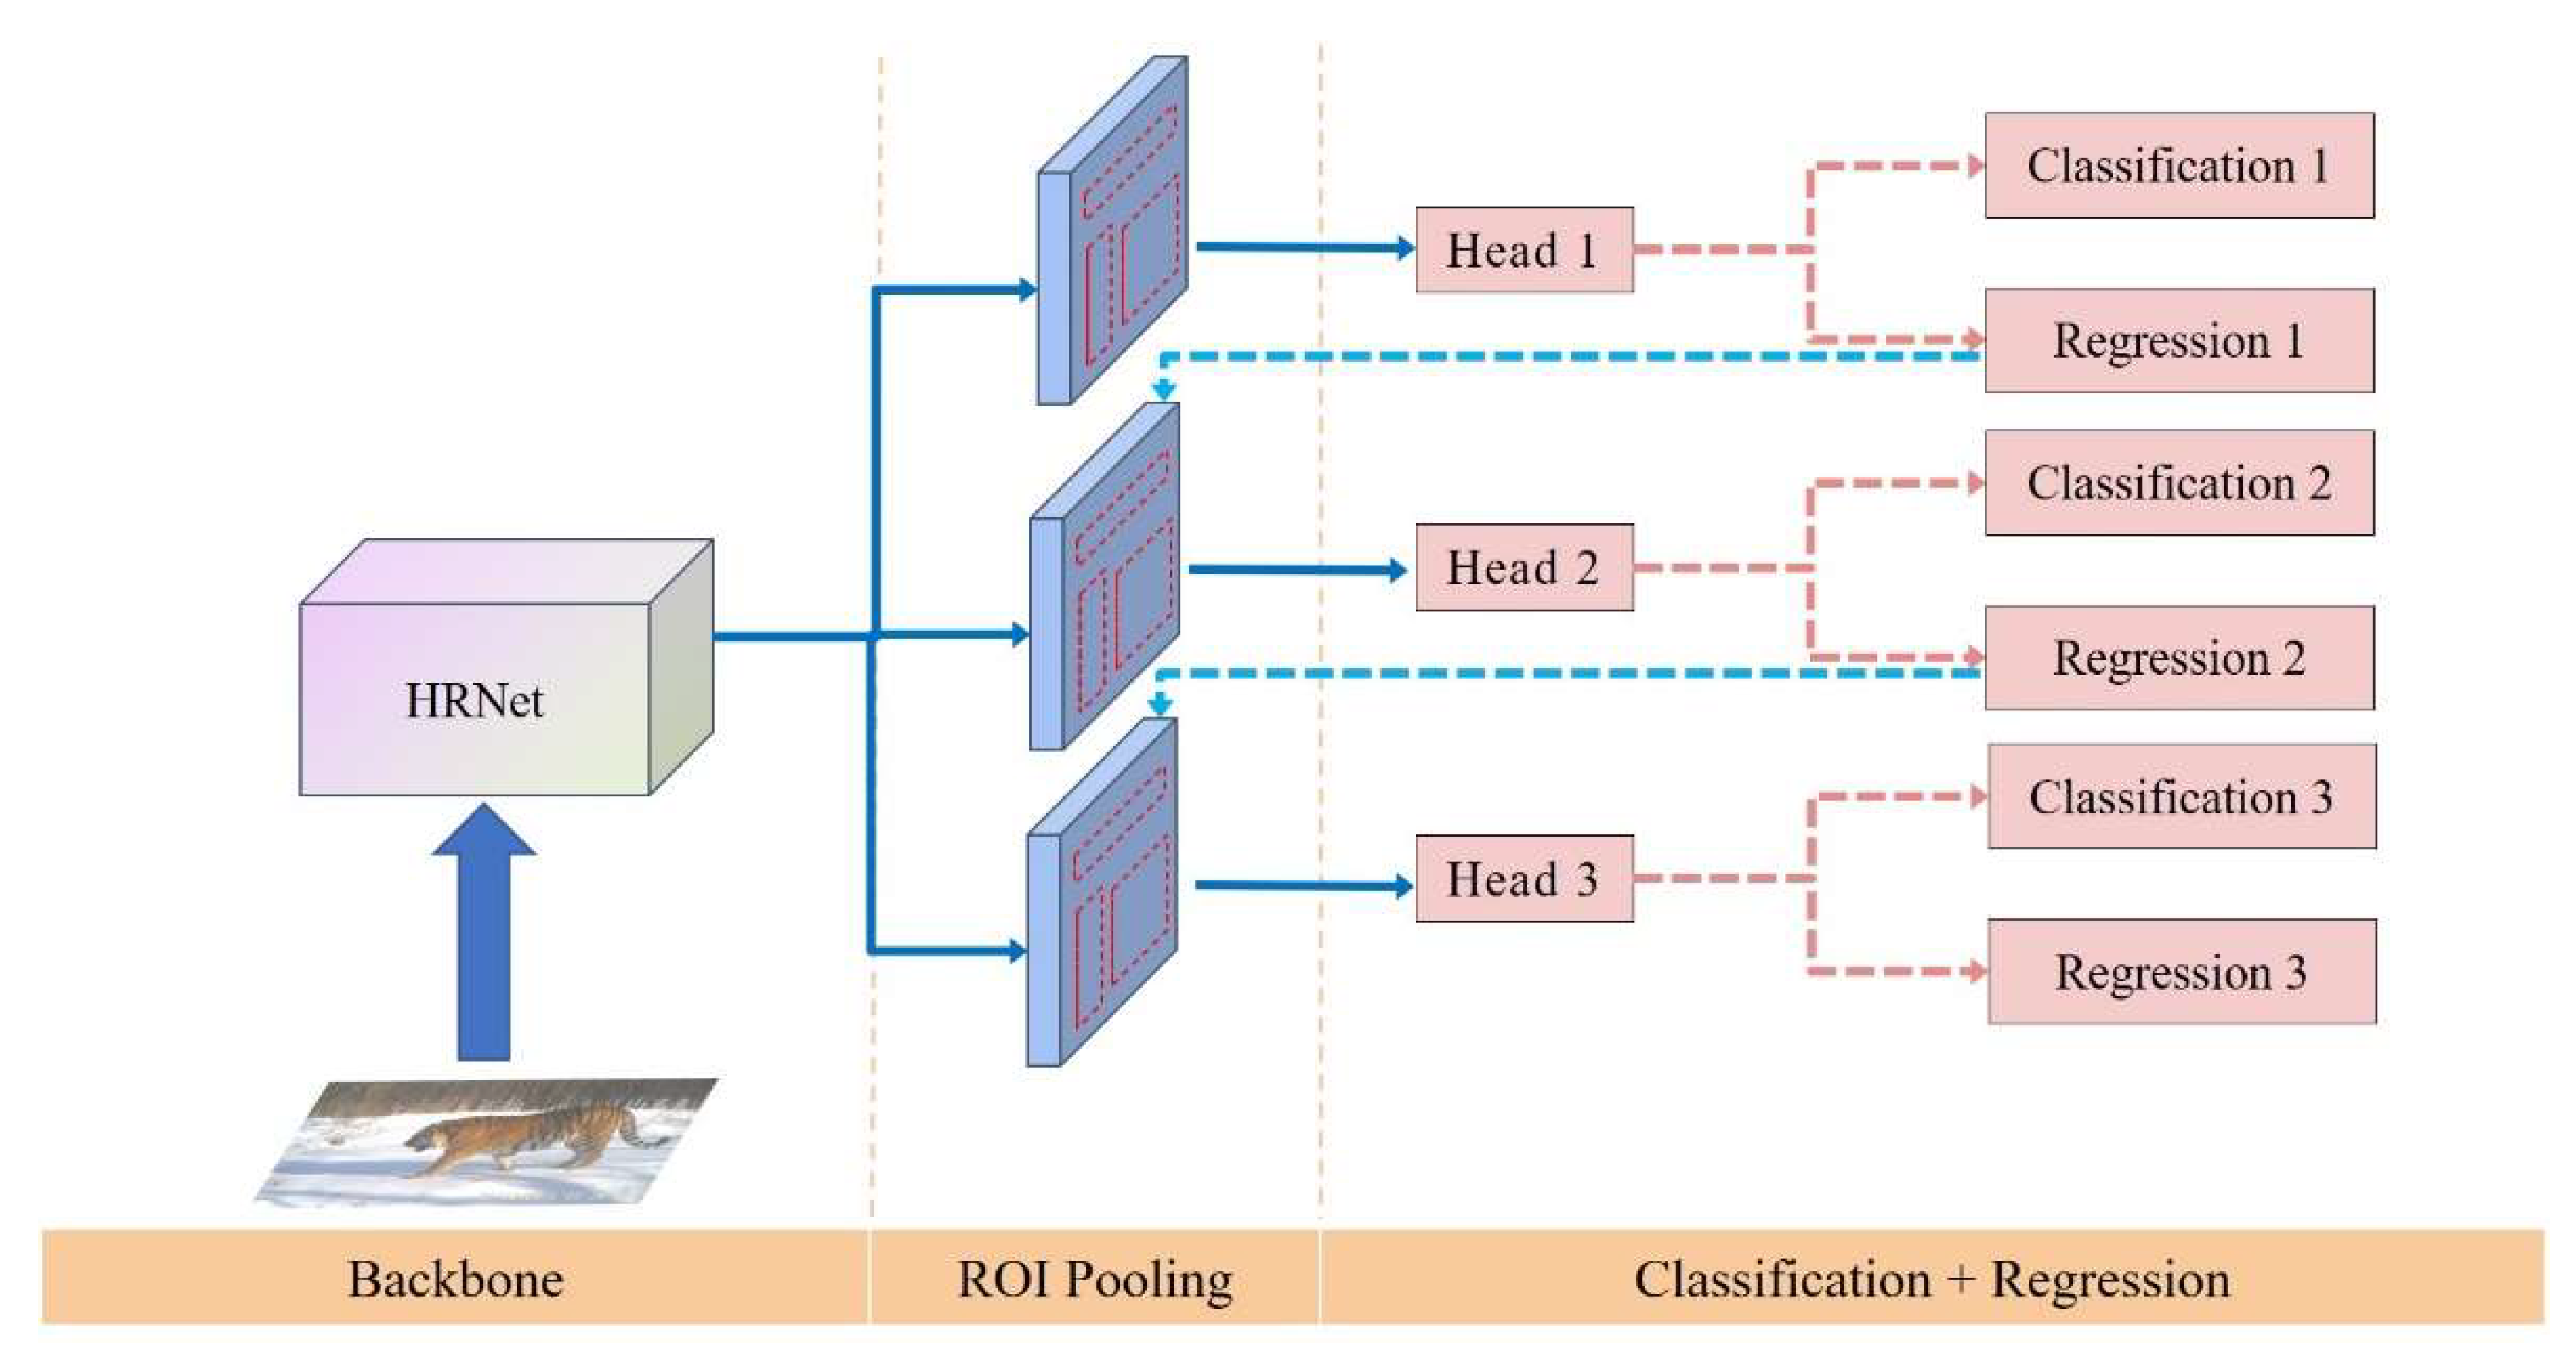
2.2.3. Cascade R-CNN
- 1.
- Architecture Overview
- 2.
- Implementation Details
2.3. Evaluation Metrics
3. Results
3.1. NTLNP Dataset
3.2. Experimental Results
3.2.1. Model Performance
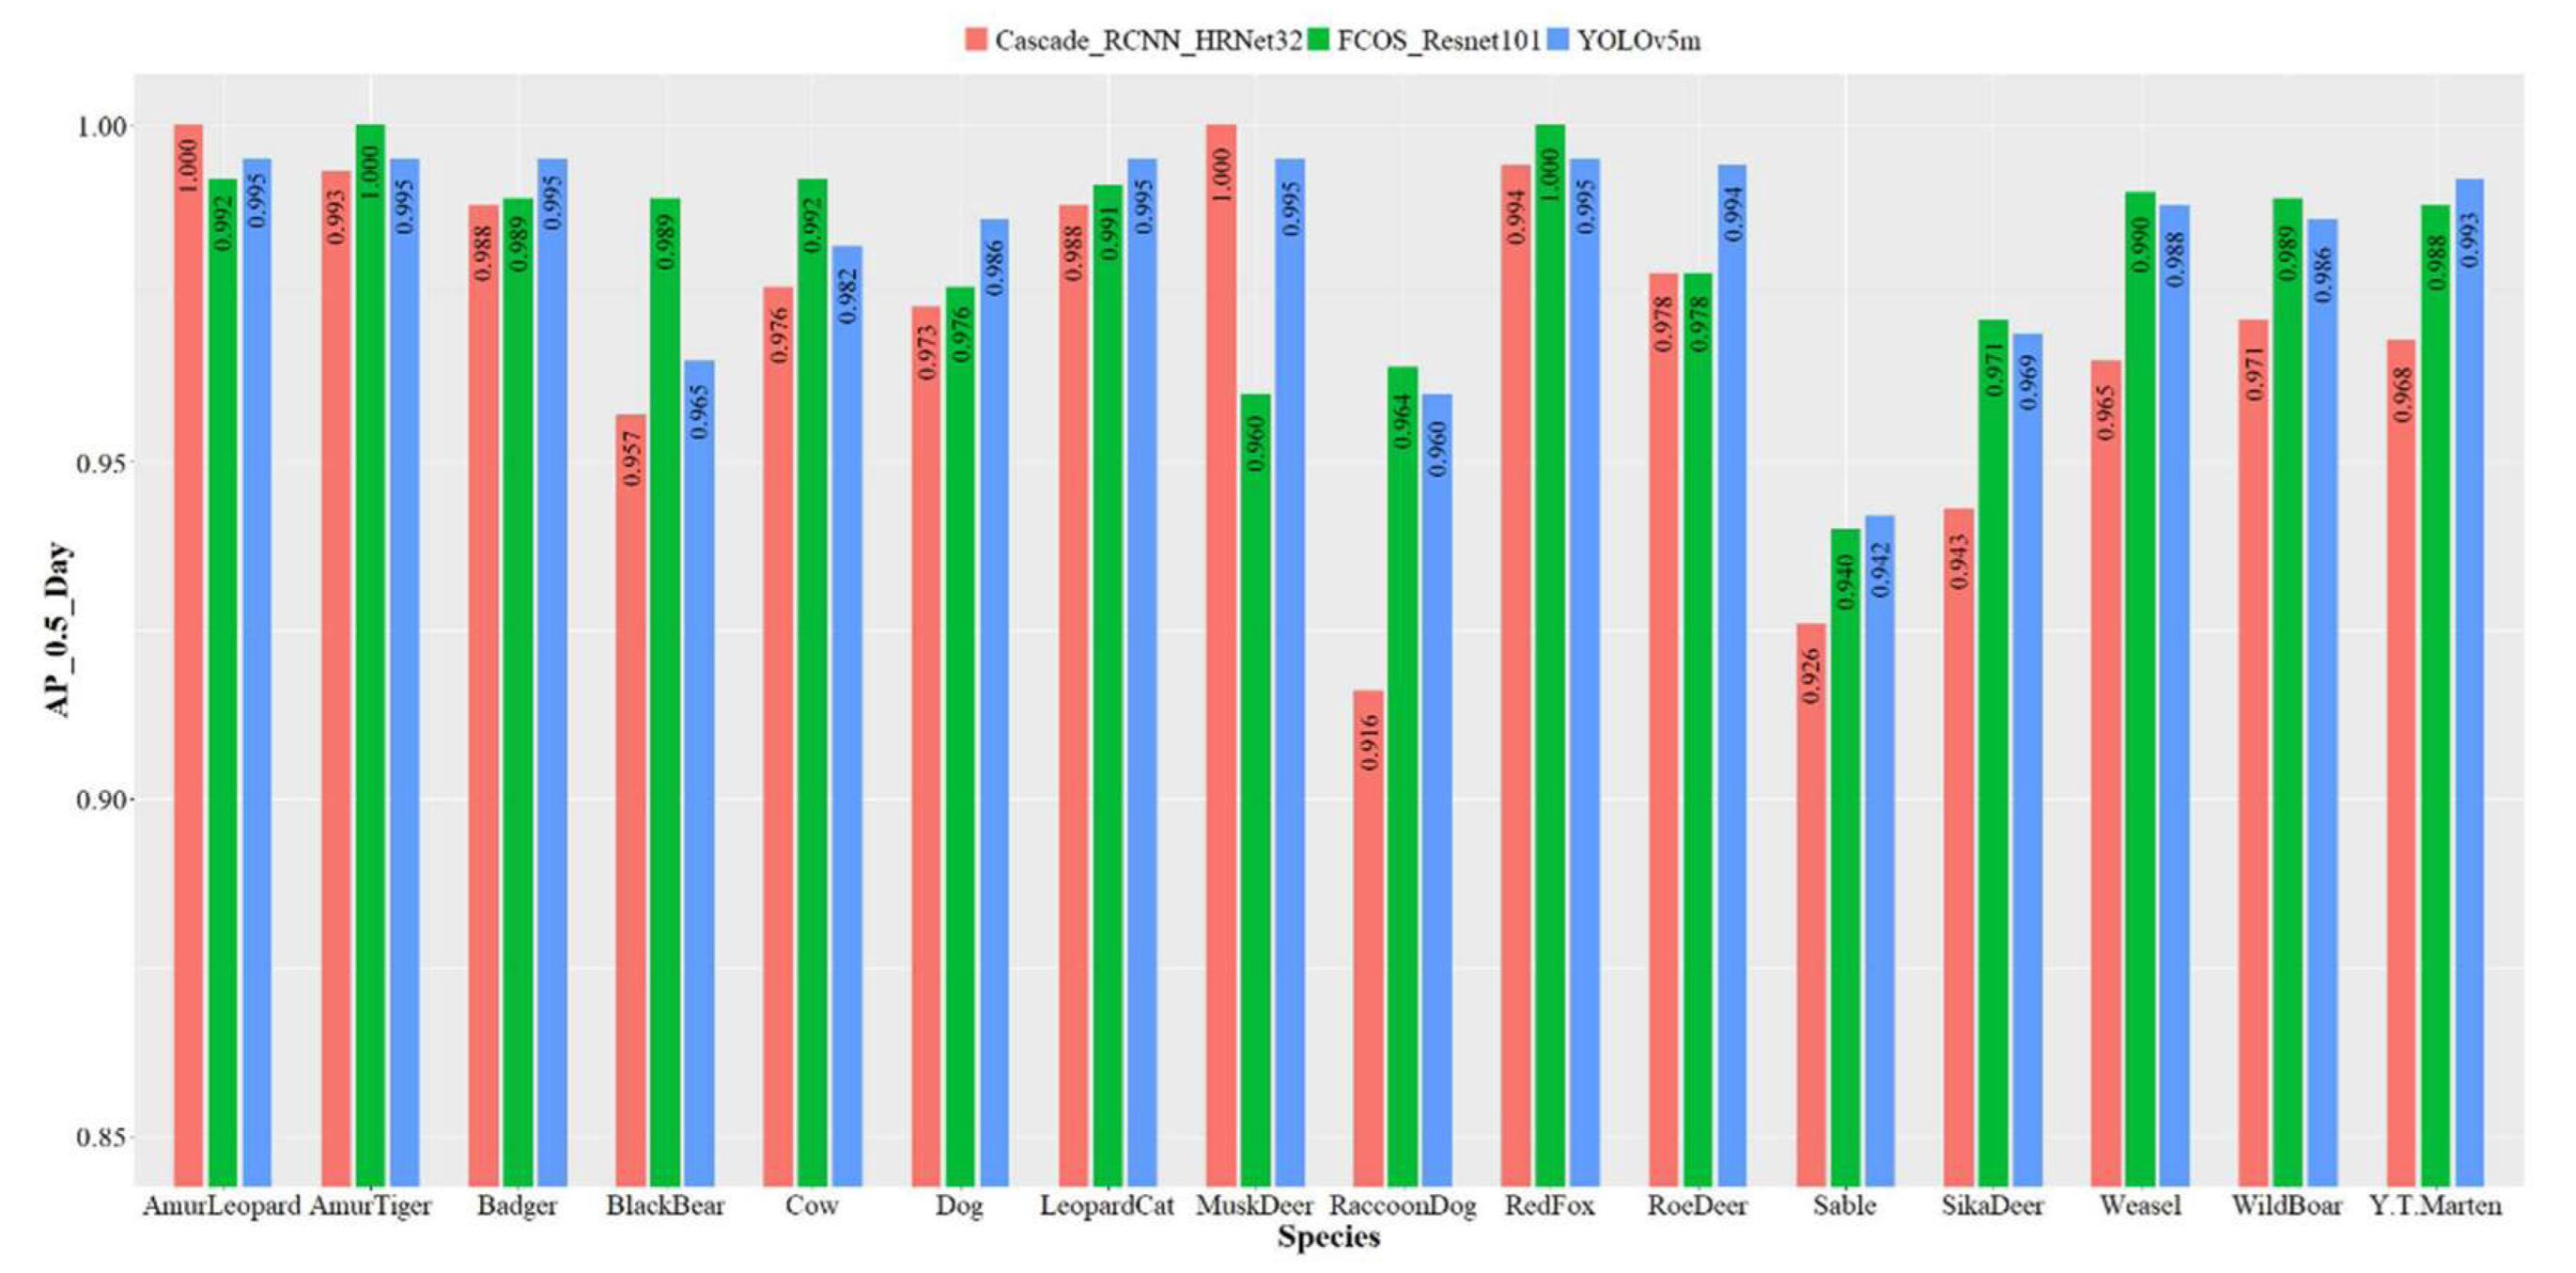
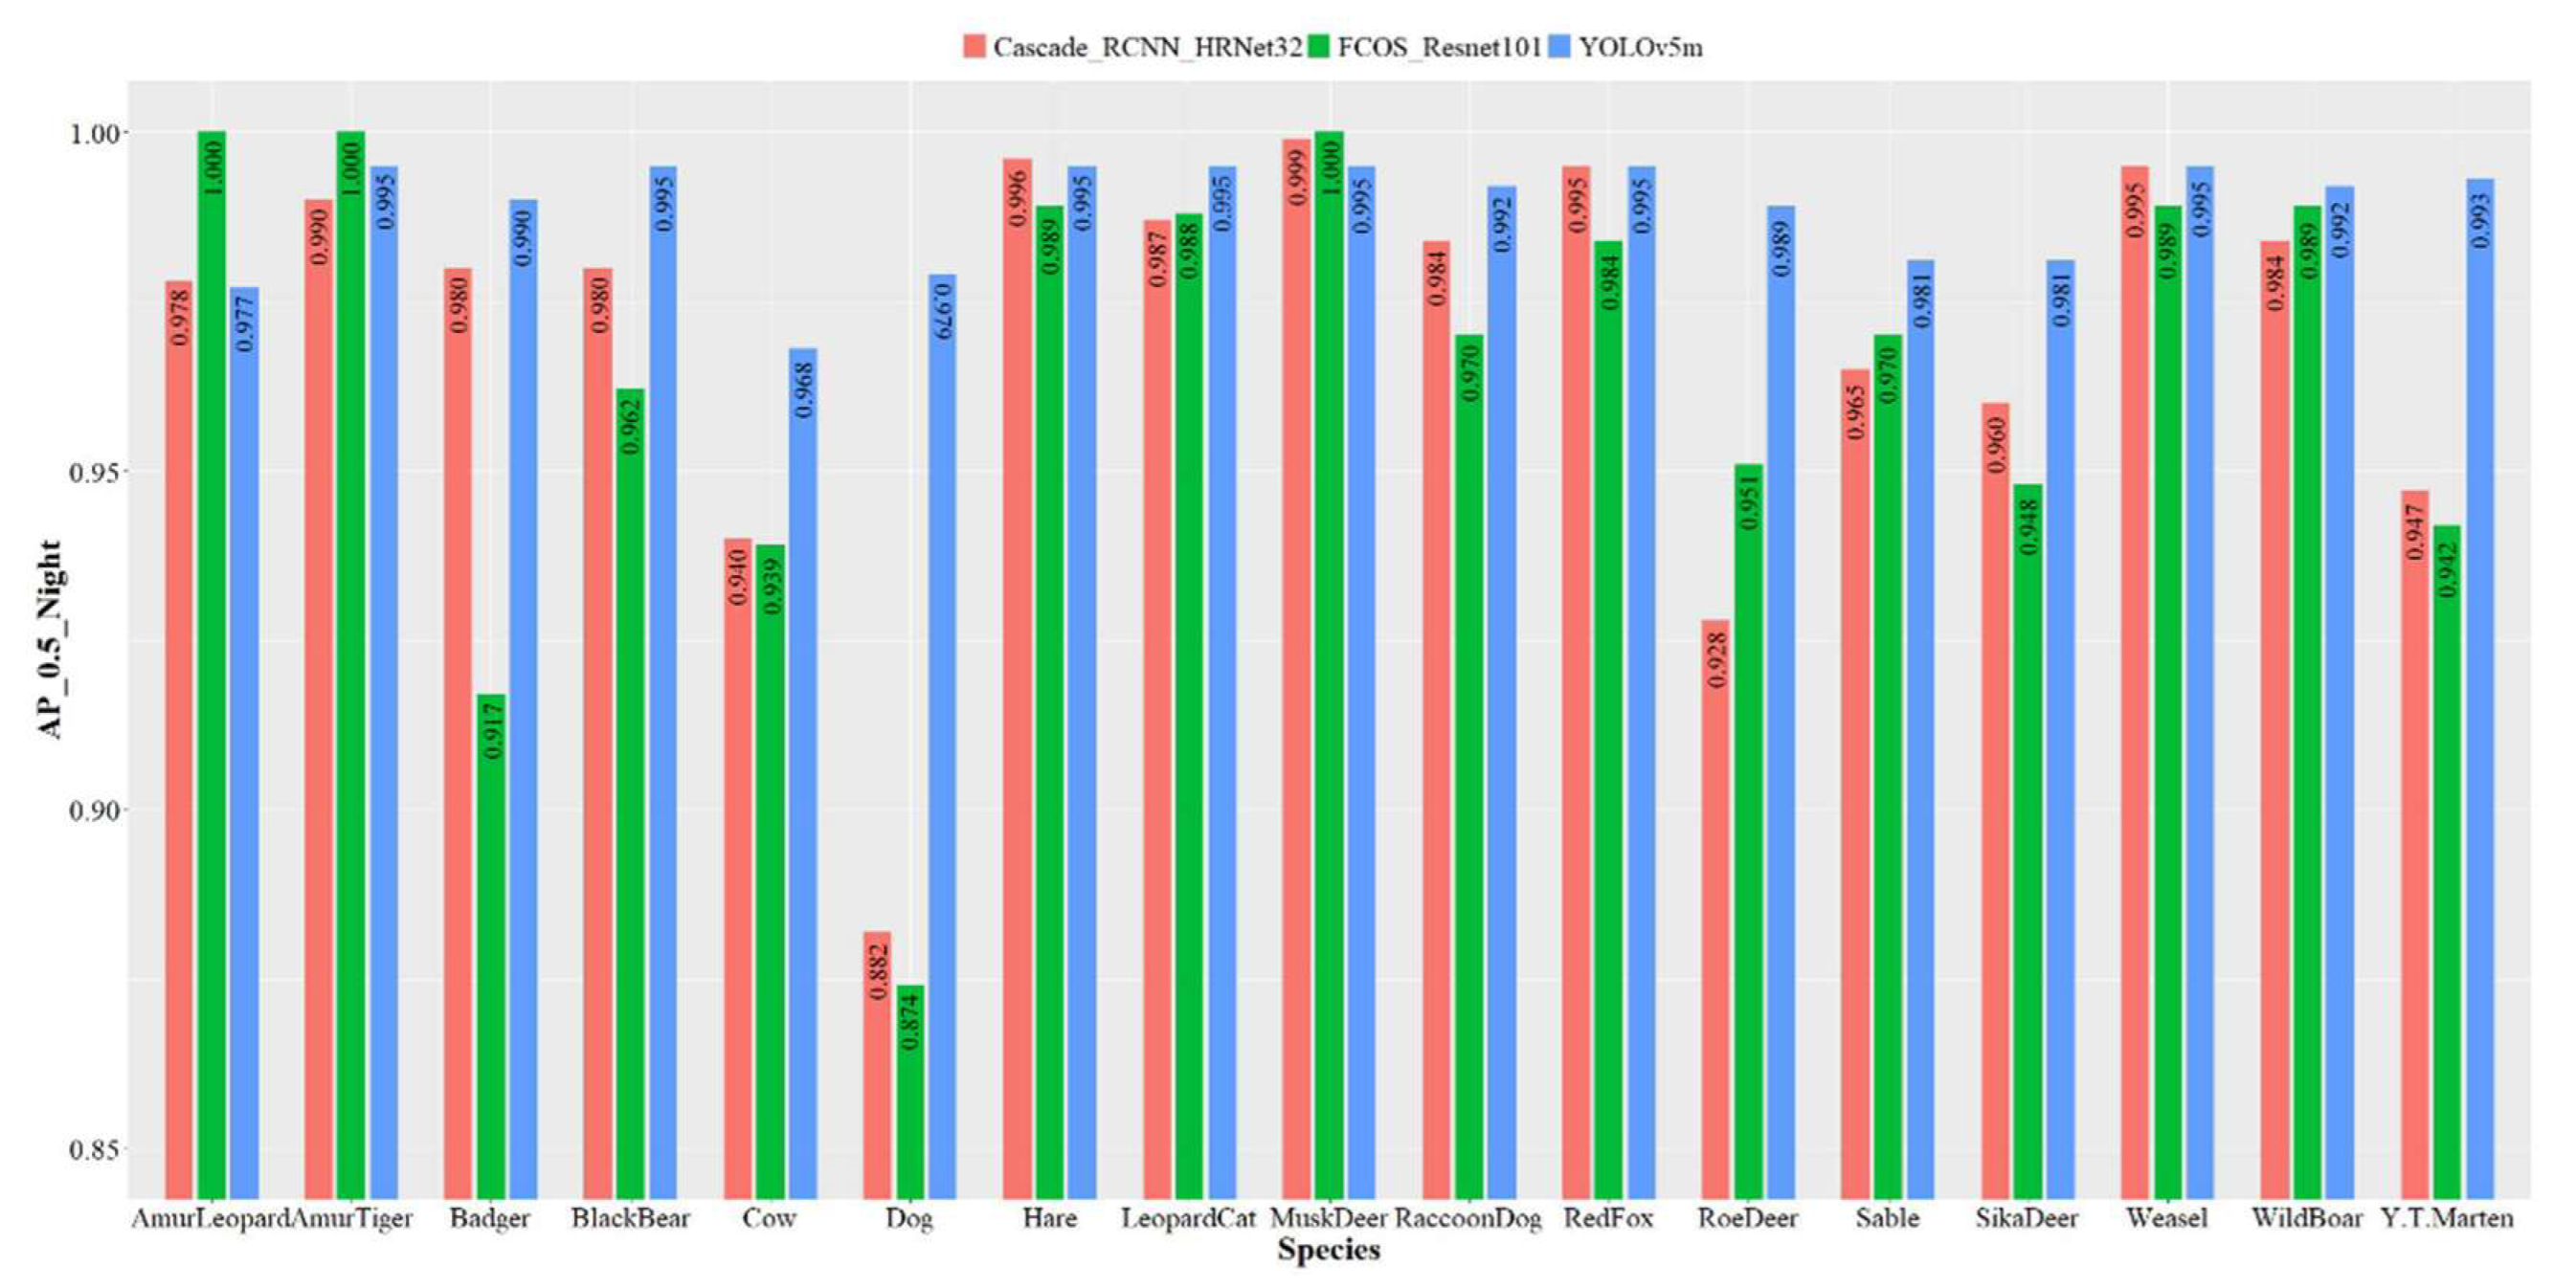
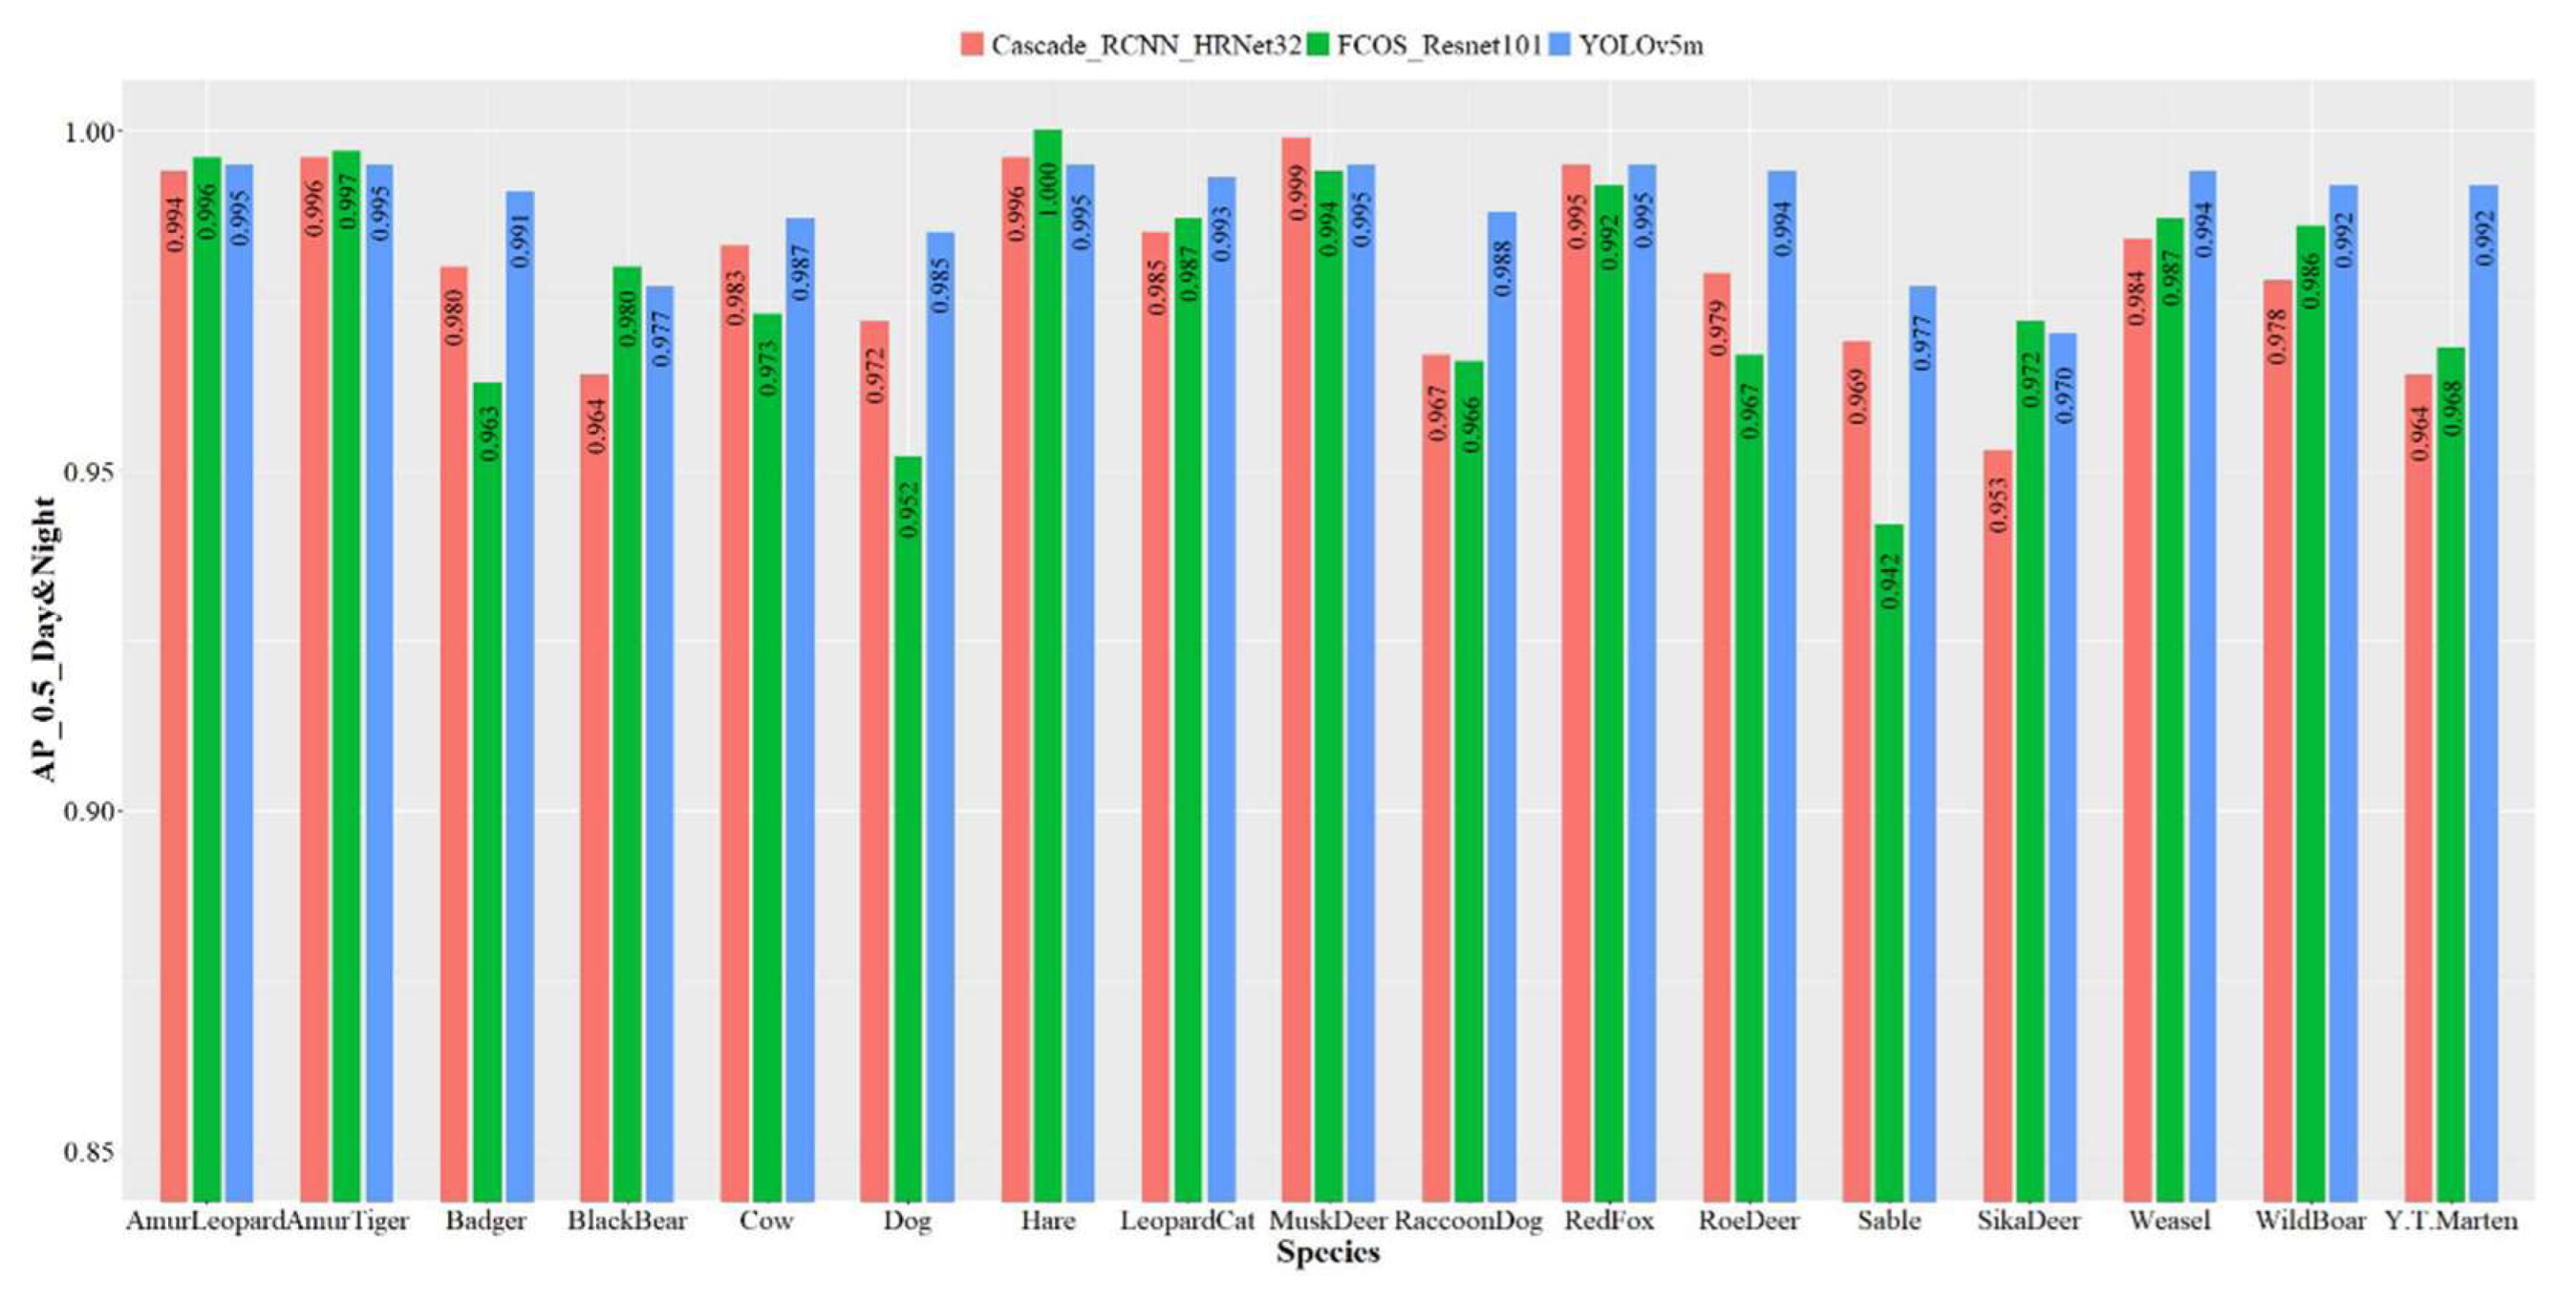
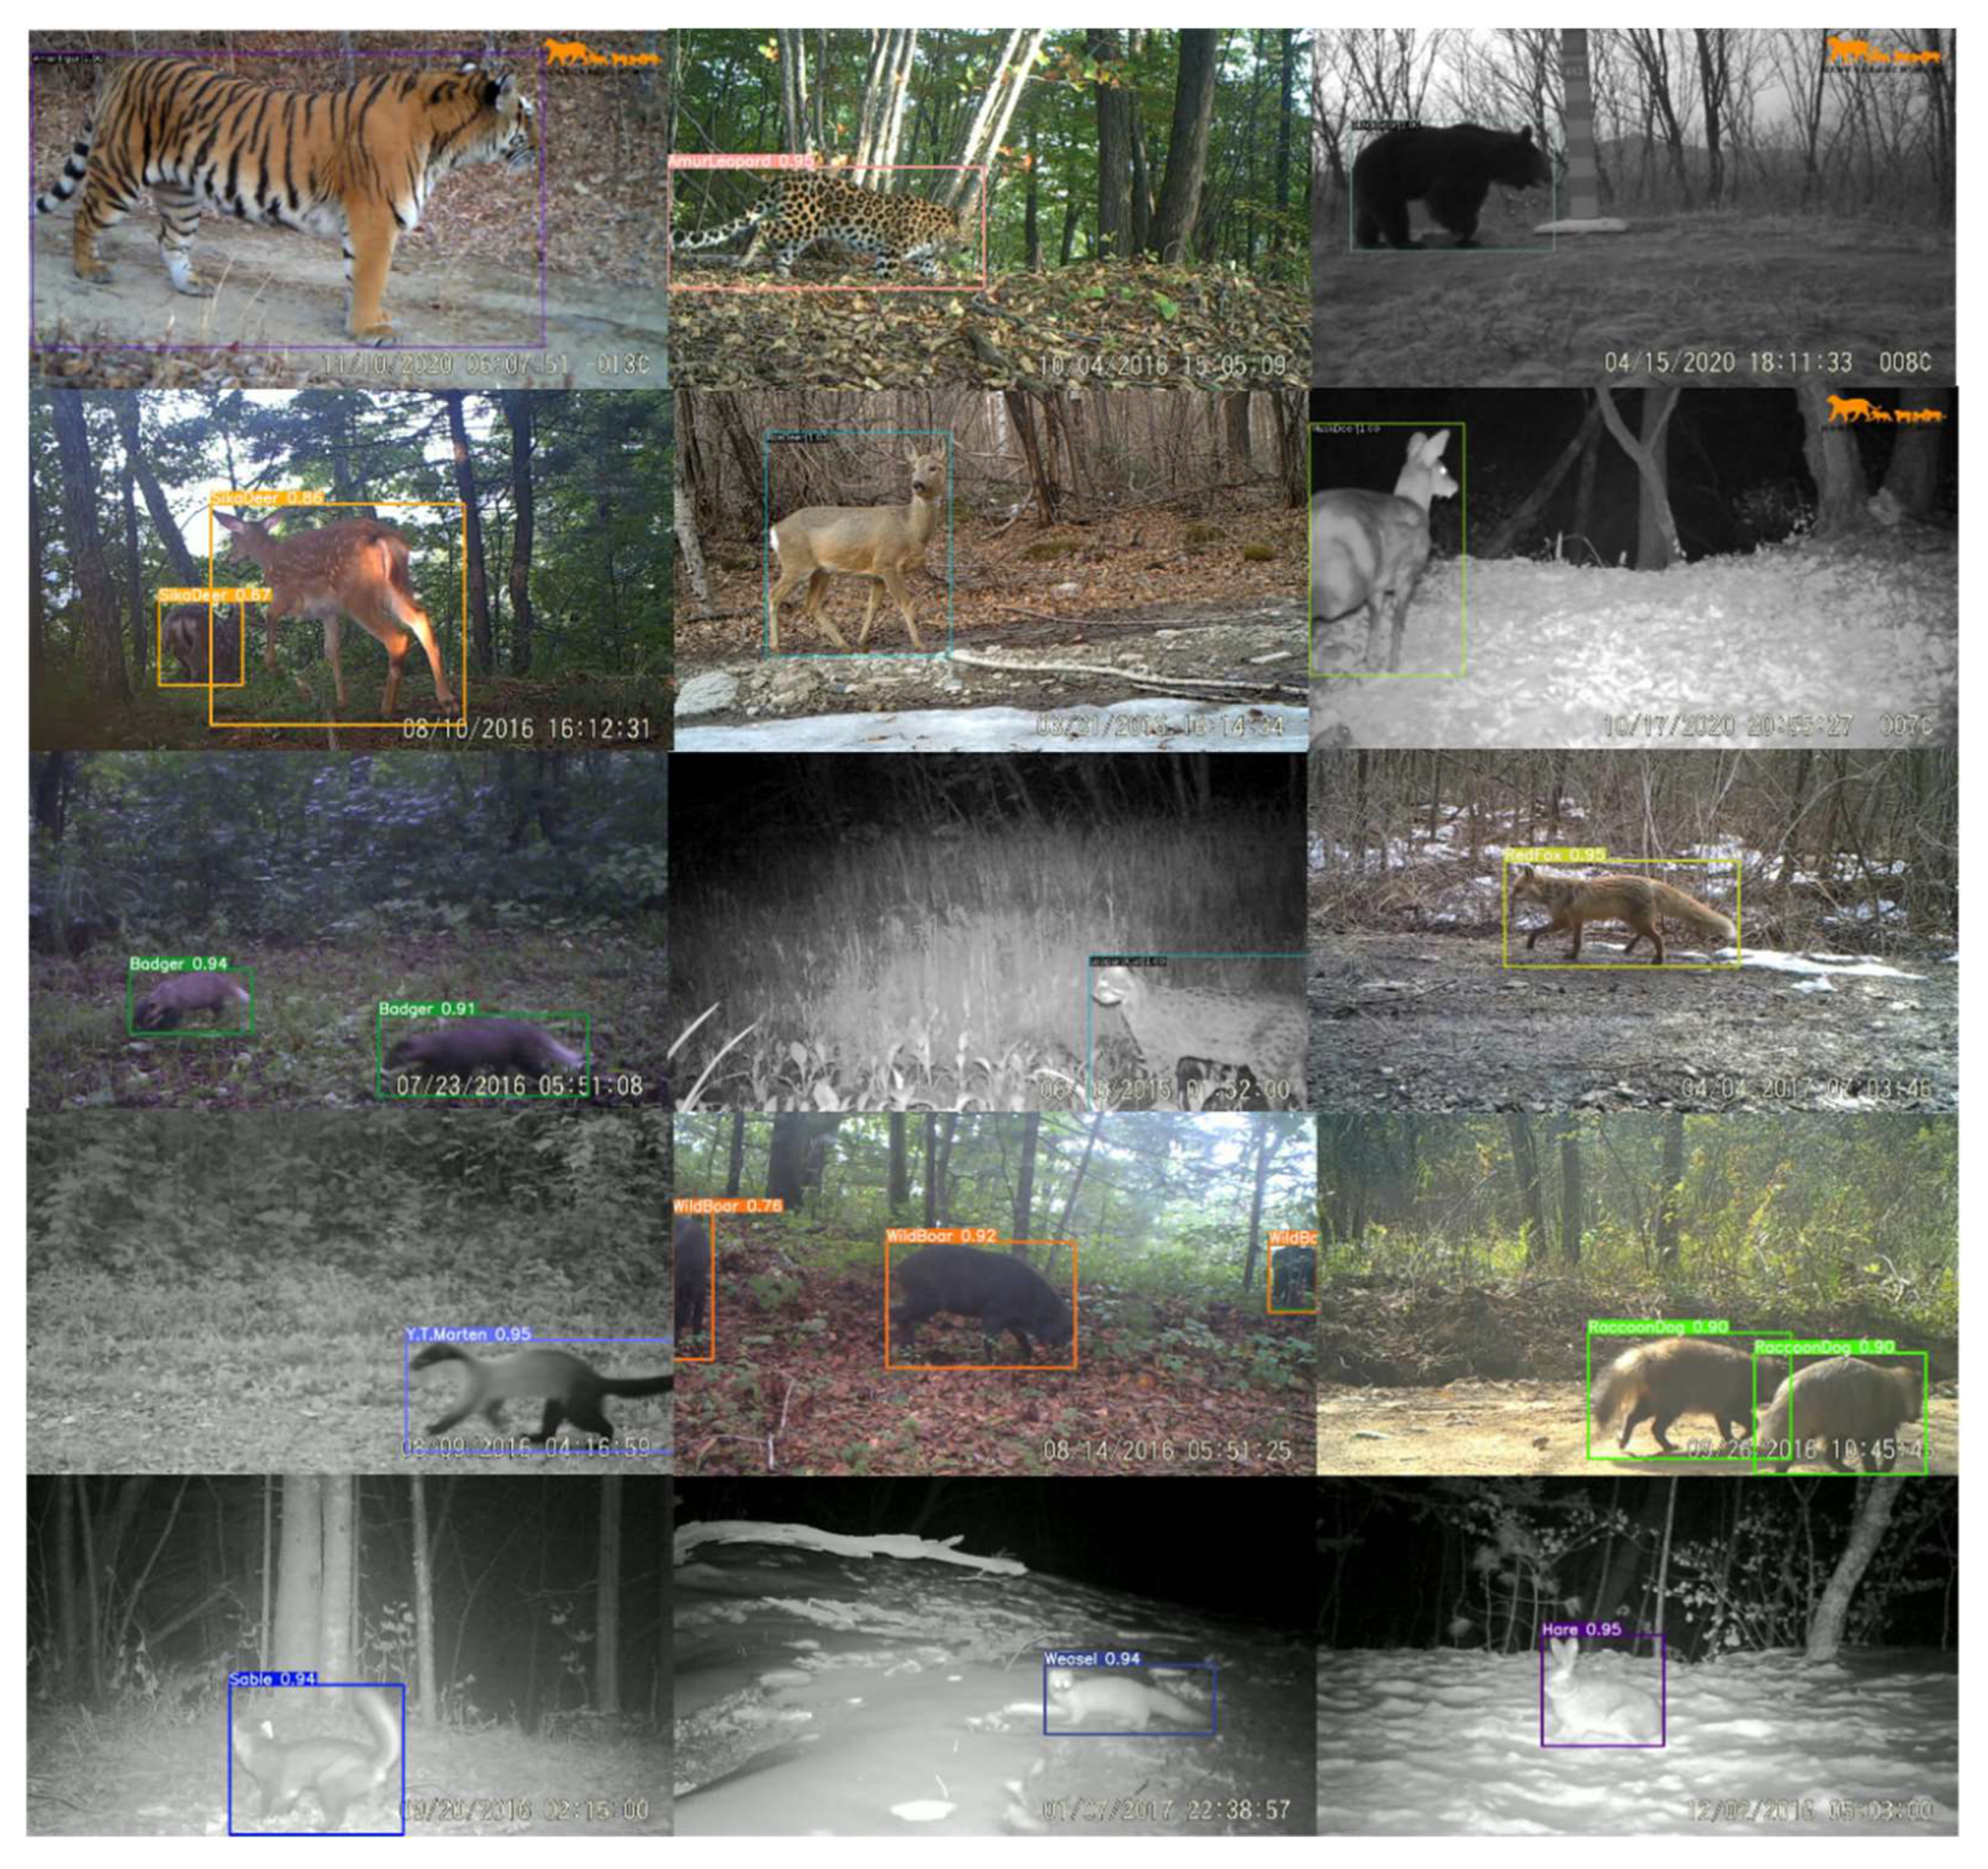
3.2.2. Species Detection and Classification
3.2.3. Video Automatic Recognition
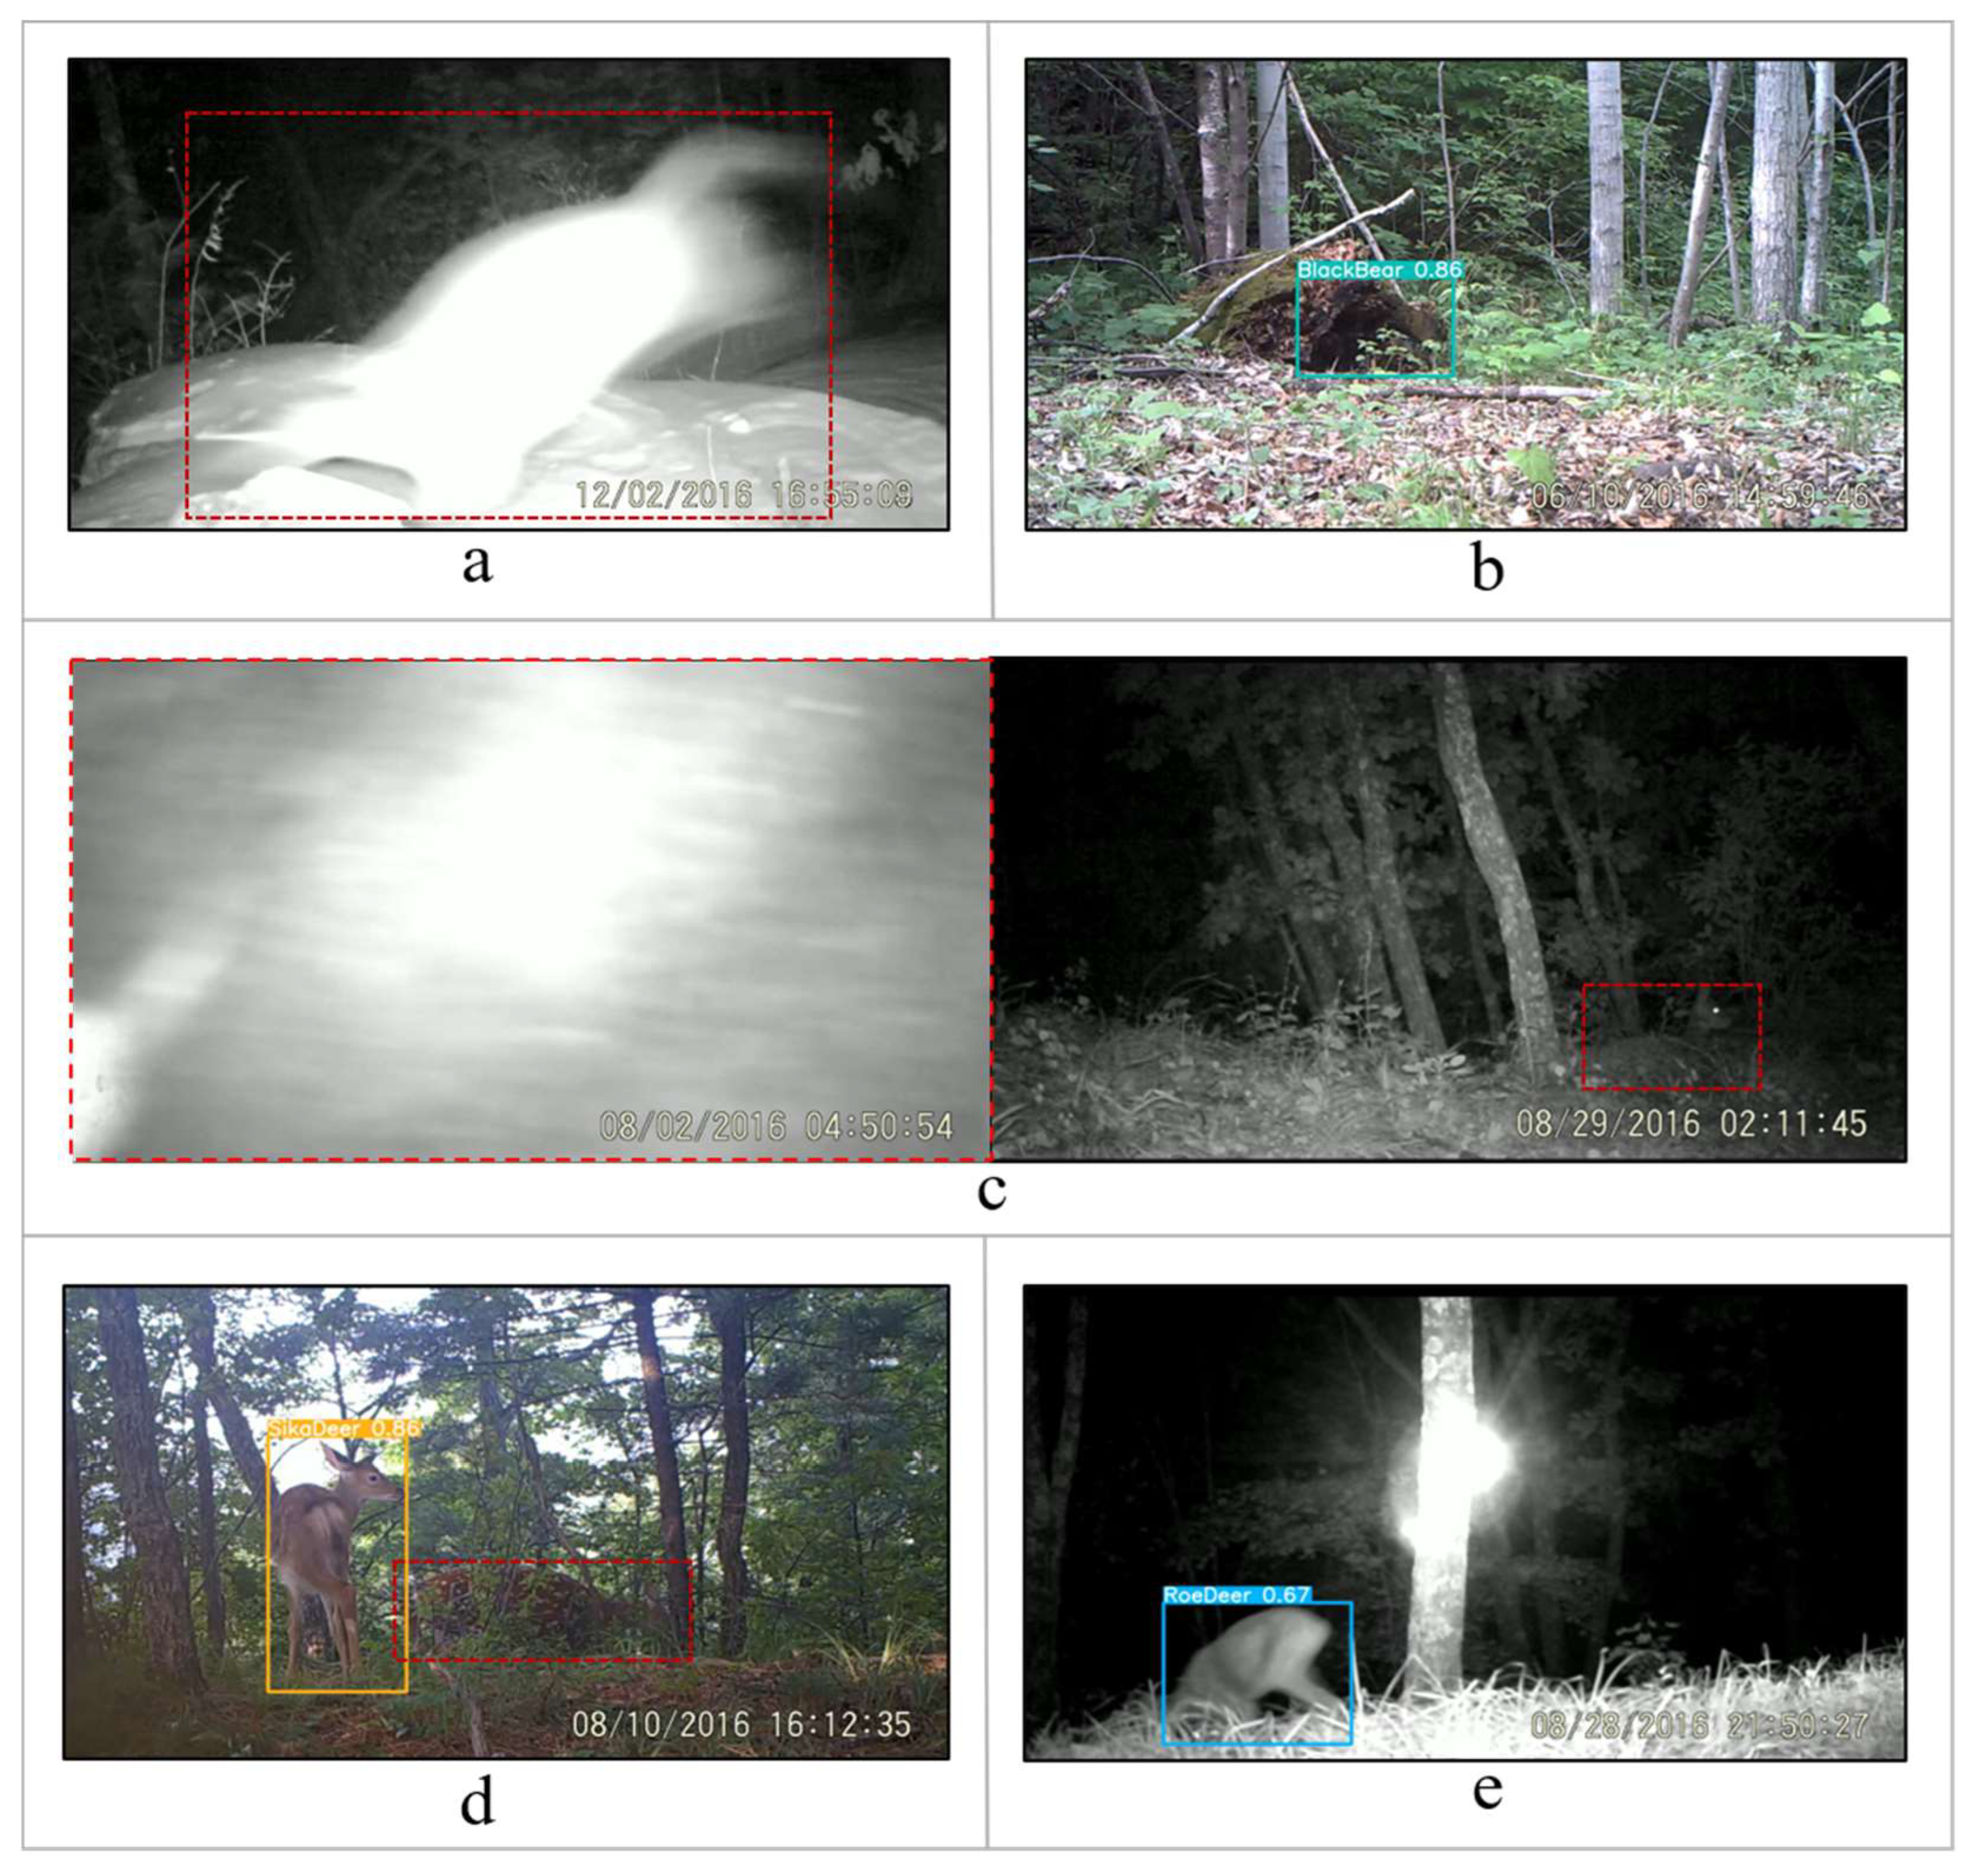
4. Discussion
5. Conclusions
Supplementary Materials
Author Contributions
Funding
Institutional Review Board Statement
Informed Consent Statement
Data Availability Statement
Acknowledgments
Conflicts of Interest
References
- Hooper, D.U.; Adair, E.C.; Cardinale, B.J.; Byrnes, J.E.; Hungate, B.A.; Matulich, K.L.; Gonzalez, A.; Duffy, J.E.; Gamfeldt, L.; O’Connor, M.I. A global synthesis reveals biodiversity loss as a major driver of ecosystem change. Nature 2012, 486, 105–108. [Google Scholar] [CrossRef] [PubMed]
- Dirzo, R.; Young, H.S.; Galetti, M.; Ceballos, G.; Isaac, N.J.; Collen, B. Defaunation in the Anthropocene. Science 2014, 345, 401–406. [Google Scholar] [CrossRef] [PubMed]
- Díaz, S.M.; Settele, J.; Brondízio, E.; Ngo, H.; Guèze, M.; Agard, J.; Arneth, A.; Balvanera, P.; Brauman, K.; Butchart, S. The Global Assessment Report on Biodiversity and Ecosystem Services: Summary for Policy Makers; Intergovernmental Science-Policy Platform on Biodiversity and Ecosystem Services: Bonn, Germany, 2019; ISBN 978-3-947851-13-3. [Google Scholar]
- Almond, R.E.; Grooten, M.; Peterson, T. Living Planet Report 2020-Bending the Curve of Biodiversity Loss; World Wildlife Fund: Washington, DC, USA, 2020. [Google Scholar]
- Anderson, C.B. Biodiversity monitoring, earth observations and the ecology of scale. Ecol. Lett. 2018, 21, 1572–1585. [Google Scholar] [CrossRef] [PubMed]
- Adam, M.; Tomášek, P.; Lehejček, J.; Trojan, J.; Jůnek, T. The Role of Citizen Science and Deep Learning in Camera Trapping. Sustainability 2021, 13, 10287. [Google Scholar] [CrossRef]
- Ordeñana, M.A.; Crooks, K.R.; Boydston, E.E.; Fisher, R.N.; Lyren, L.M.; Siudyla, S.; Haas, C.D.; Harris, S.; Hathaway, S.A.; Turschak, G.M. Effects of urbanization on carnivore species distribution and richness. J. Mammal. 2010, 91, 1322–1331. [Google Scholar] [CrossRef] [Green Version]
- Gilbert, N.A.; Pease, B.S.; Anhalt-Depies, C.M.; Clare, J.D.; Stenglein, J.L.; Townsend, P.A.; Van Deelen, T.R.; Zuckerberg, B. Integrating harvest and camera trap data in species distribution models. Biol. Conserv. 2021, 258, 109147. [Google Scholar] [CrossRef]
- Palencia, P.; Fernández-López, J.; Vicente, J.; Acevedo, P. Innovations in movement and behavioural ecology from camera traps: Day range as model parameter. Methods Ecol. Evol. 2021, 12, 1201–1212. [Google Scholar] [CrossRef]
- Luo, G.; Wei, W.; Dai, Q.; Ran, J. Density estimation of unmarked populations using camera traps in heterogeneous space. Wildl. Soc. Bull. 2020, 44, 173–181. [Google Scholar] [CrossRef]
- Mölle, J.P.; Kleiven, E.F.; Ims, R.A.; Soininen, E.M. Using subnivean camera traps to study Arctic small mammal community dynamics during winter. Arct. Sci. 2021, 8, 183–199. [Google Scholar] [CrossRef]
- O’Connell, A.F.; Nichols, J.D.; Karanth, K.U. Camera Traps in Animal Ecology: Methods and Analyses; Springer: Berlin/Heidelberg, Germany, 2011; Volume 271. [Google Scholar]
- Jia, L.; Tian, Y.; Zhang, J. Domain-Aware Neural Architecture Search for Classifying Animals in Camera Trap Images. Animals 2022, 12, 437. [Google Scholar] [CrossRef]
- Newey, S.; Davidson, P.; Nazir, S.; Fairhurst, G.; Verdicchio, F.; Irvine, R.J.; van der Wal, R. Limitations of recreational camera traps for wildlife management and conservation research: A practitioner’s perspective. Ambio 2015, 44, 624–635. [Google Scholar] [CrossRef] [Green Version]
- Carl, C.; Schönfeld, F.; Profft, I.; Klamm, A.; Landgraf, D. Automated detection of European wild mammal species in camera trap images with an existing and pre-trained computer vision model. Eur. J. Wildl. Res. 2020, 66, 62. [Google Scholar] [CrossRef]
- Rovero, F.; Zimmermann, F.; Berzi, D.; Meek, P. Which camera trap type and how many do I need? A review of camera features and study designs for a range of wildlife research applications. Hystrix 2013, 24, 148–156. [Google Scholar]
- Yousif, H.; Yuan, J.; Kays, R.; He, Z. Animal Scanner: Software for classifying humans, animals, and empty frames in camera trap images. Ecol. Evol. 2019, 9, 1578–1589. [Google Scholar] [CrossRef] [PubMed]
- Yang, D.-Q.; Li, T.; Liu, M.-T.; Li, X.-W.; Chen, B.-H. A systematic study of the class imbalance problem: Automatically identifying empty camera trap images using convolutional neural networks. Ecol. Inform. 2021, 64, 101350. [Google Scholar] [CrossRef]
- Christin, S.; Hervet, É.; Lecomte, N. Applications for deep learning in ecology. Methods Ecol. Evol. 2019, 10, 1632–1644. [Google Scholar] [CrossRef]
- Browning, E.; Gibb, R.; Glover-Kapfer, P.; Jones, K.E. Passive Acoustic Monitoring in Ecology and Conservation. WWF Conserv. Technol. Ser. 1 2017, 2, 10–12. [Google Scholar]
- Shepley, A.; Falzon, G.; Meek, P.; Kwan, P. Automated location invariant animal detection in camera trap images using publicly available data sources. Ecol. Evol. 2021, 11, 4494–4506. [Google Scholar] [CrossRef] [PubMed]
- Culina, A.; Baglioni, M.; Crowther, T.W.; Visser, M.E.; Woutersen-Windhouwer, S.; Manghi, P. Navigating the unfolding open data landscape in ecology and evolution. Nat. Ecol. Evol. 2018, 2, 420–426. [Google Scholar] [CrossRef] [Green Version]
- Olden, J.D.; Lawler, J.J.; Poff, N.L. Machine learning methods without tears: A primer for ecologists. Q. Rev. Biol. 2008, 83, 171–193. [Google Scholar] [CrossRef] [Green Version]
- Najafabadi, M.M.; Villanustre, F.; Khoshgoftaar, T.M.; Seliya, N.; Wald, R.; Muharemagic, E. Deep learning applications and challenges in big data analytics. J. Big Data 2015, 2, 1. [Google Scholar] [CrossRef] [Green Version]
- Villa, A.G.; Salazar, A.; Vargas, F. Towards automatic wild animal monitoring: Identification of animal species in camera-trap images using very deep convolutional neural networks. Ecol. Inform. 2017, 41, 24–32. [Google Scholar] [CrossRef] [Green Version]
- Chen, G.; Han, T.X.; He, Z.; Kays, R.; Forrester, T. Deep convolutional neural network based species recognition for wild animal monitoring. In Proceedings of the 2014 IEEE International Conference on Image Processing (ICIP), Paris, France, 27–30 October 2014; pp. 858–862. [Google Scholar]
- Norouzzadeh, M.S.; Nguyen, A.; Kosmala, M.; Swanson, A.; Palmer, M.S.; Packer, C.; Clune, J. Automatically identifying, counting, and describing wild animals in camera-trap images with deep learning. Proc. Natl. Acad. Sci. USA 2018, 115, E5716–E5725. [Google Scholar] [CrossRef] [Green Version]
- Schneider, S.; Taylor, G.W.; Kremer, S. Deep learning object detection methods for ecological camera trap data. In Proceedings of the 2018 15th Conference on Computer and Robot Vision (CRV), Toronto, ON, Canada, 8–10 May 2018; pp. 321–328. [Google Scholar]
- Zhao, Z.-Q.; Zheng, P.; Xu, S.-t.; Wu, X. Object detection with deep learning: A review. IEEE Trans. Neural Netw. Learn. Syst. 2019, 30, 3212–3232. [Google Scholar] [CrossRef] [Green Version]
- Vecvanags, A.; Aktas, K.; Pavlovs, I.; Avots, E.; Filipovs, J.; Brauns, A.; Done, G.; Jakovels, D.; Anbarjafari, G. Ungulate Detection and Species Classification from Camera Trap Images Using RetinaNet and Faster R-CNN. Entropy 2022, 24, 353. [Google Scholar] [CrossRef]
- Tuia, D.; Kellenberger, B.; Beery, S.; Costelloe, B.R.; Zuffi, S.; Risse, B.; Mathis, A.; Mathis, M.W.; van Langevelde, F.; Burghardt, T. Perspectives in machine learning for wildlife conservation. Nat. Commun. 2022, 13, 792. [Google Scholar] [CrossRef]
- Feng, J.; Xiao, X. Multiobject Tracking of Wildlife in Videos Using Few-Shot Learning. Animals 2022, 12, 1223. [Google Scholar] [CrossRef] [PubMed]
- Zou, Z.; Shi, Z.; Guo, Y.; Ye, J. Object detection in 20 years: A survey. arXiv 2019, arXiv:1905.05055. [Google Scholar]
- Carranza-García, M.; Torres-Mateo, J.; Lara-Benítez, P.; García-Gutiérrez, J. On the performance of one-stage and two-stage object detectors in autonomous vehicles using camera data. Remote Sens. 2020, 13, 89. [Google Scholar] [CrossRef]
- Tian, Z.; Shen, C.; Chen, H.; He, T. Fcos: Fully convolutional one-stage object detection. In Proceedings of the IEEE/CVF International Conference on Computer Vision, Seoul, Korea, 27 October–2 November 2019; pp. 9626–9635. [Google Scholar]
- Cai, Z.; Vasconcelos, N. Cascade r-cnn: Delving into high quality object detection. In Proceedings of the IEEE Conference on Computer Vision and Pattern Recognition, Salt Lake City, UT, USA, 18–23 June 2018; pp. 6154–6162. [Google Scholar]
- Redmon, J.; Divvala, S.; Girshick, R.; Farhadi, A. You only look once: Unified, real-time object detection. In Proceedings of the IEEE Conference on Computer Vision and Pattern Recognition, Las Vegas, NV, USA, 27–30 June 2016; pp. 779–788. [Google Scholar]
- Bochkovskiy, A.; Wang, C.-Y.; Liao, H.-Y.M. Yolov4: Optimal speed and accuracy of object detection. arXiv 2020, arXiv:2004.10934. [Google Scholar]
- Wang, C.-Y.; Liao, H.-Y.M.; Wu, Y.-H.; Chen, P.-Y.; Hsieh, J.-W.; Yeh, I.-H. CSPNet: A new backbone that can enhance learning capability of CNN. In Proceedings of the IEEE/CVF Conference on Computer Vision and Pattern Recognition Workshops, Seattle, WA, USA, 14–19 June 2020; pp. 1571–1580. [Google Scholar]
- Liu, S.; Qi, L.; Qin, H.; Shi, J.; Jia, J. Path aggregation network for instance segmentation. In Proceedings of the IEEE Conference on Computer Vision and Pattern Recognition, Salt Lake City, UT, USA, 18–23 June 2018; pp. 8759–8768. [Google Scholar]
- Lin, T.-Y.; Dollár, P.; Girshick, R.; He, K.; Hariharan, B.; Belongie, S. Feature pyramid networks for object detection. In Proceedings of the IEEE Conference on Computer Vision and Pattern Recognition, Honolulu, HI, USA, 21–26 July 2017; pp. 936–944. [Google Scholar]
- Paszke, A.; Gross, S.; Massa, F.; Lerer, A.; Bradbury, J.; Chanan, G.; Killeen, T.; Lin, Z.; Gimelshein, N.; Antiga, L.; et al. PyTorch: An imperative style, high-performance deep learning library. In Proceedings of the 33rd International Conference on Neural Information Processing Systems, Vancouver, BC, Canada, 8–14 December 2019; Curran Associates Inc.: Red Hook, NY, USA, 2019; p. 721. [Google Scholar]
- He, K.; Zhang, X.; Ren, S.; Sun, J. Deep residual learning for image recognition. In Proceedings of the IEEE Conference on Computer Vision and Pattern Recognition, Las Vegas, NV, USA, 27–30 June 2016; pp. 770–778. [Google Scholar]
- Sun, K.; Zhao, Y.; Jiang, B.; Cheng, T.; Xiao, B.; Liu, D.; Mu, Y.; Wang, X.; Liu, W.; Wang, J. High-resolution representations for labeling pixels and regions. arXiv 2019, arXiv:1904.04514. [Google Scholar]
- Ren, S.; He, K.; Girshick, R.; Sun, J. Faster R-CNN: Towards real-time object detection with region proposal networks. In Proceedings of the 28th International Conference on Neural Information Processing Systems, Montreal, QC, Canada, 7–12 December 2015; MIT Press: Montreal, QC, Canada, 2015; Volume 1, pp. 91–99. [Google Scholar]
- Chen, K.; Wang, J.; Pang, J.; Cao, Y.; Xiong, Y.; Li, X.; Sun, S.; Feng, W.; Liu, Z.; Xu, J. MMDetection: Open mmlab detection toolbox and benchmark. arXiv 2019, arXiv:1906.07155. [Google Scholar]
- Padilla, R.; Netto, S.L.; Da Silva, E.A. A survey on performance metrics for object-detection algorithms. In Proceedings of the 2020 International Conference on Systems, Signals and Image Processing (IWSSIP), Niterói, Brazil, 1–3 July 2020; pp. 237–242. [Google Scholar]
- Beery, S.; Wu, G.; Rathod, V.; Votel, R.; Huang, J. Context r-cnn: Long term temporal context for per-camera object detection. In Proceedings of the IEEE/CVF Conference on Computer Vision and Pattern Recognition, Seattle, WA, USA, 14–19 June 2020; pp. 13072–13082. [Google Scholar]
- Yousif, H.; Yuan, J.; Kays, R.; He, Z. Fast human-animal detection from highly cluttered camera-trap images using joint background modeling and deep learning classification. In Proceedings of the 2017 IEEE International Symposium on Circuits and Systems (ISCAS), Baltimore, MD, USA, 28–31 May 2017; pp. 1–4. [Google Scholar]
- Miao, Z.; Gaynor, K.M.; Wang, J.; Liu, Z.; Muellerklein, O.; Norouzzadeh, M.S.; McInturff, A.; Bowie, R.C.; Nathan, R.; Yu, S.X. Insights and approaches using deep learning to classify wildlife. Sci. Rep. 2019, 9, 8137. [Google Scholar] [CrossRef]
- Yang, B.; Zhang, Z.; Yang, C.-Q.; Wang, Y.; Orr, M.C.; Wang, H.; Zhang, A.-B. Identification of species by combining molecular and morphological data using convolutional neural networks. Syst. Biol. 2022, 71, 690–705. [Google Scholar] [CrossRef]
- Lin, C.; Huang, X.; Wang, J.; Xi, T.; Ji, L. Learning niche features to improve image-based species identification. Ecol. Inform. 2021, 61, 101217. [Google Scholar] [CrossRef]
- Shi, C.; Liu, D.; Cui, Y.; Xie, J.; Roberts, N.J.; Jiang, G. Amur tiger stripes: Individual identification based on deep convolutional neural network. Integr. Zool. 2020, 15, 461–470. [Google Scholar] [CrossRef] [PubMed]
- Hou, J.; He, Y.; Yang, H.; Connor, T.; Gao, J.; Wang, Y.; Zeng, Y.; Zhang, J.; Huang, J.; Zheng, B. Identification of animal individuals using deep learning: A case study of giant panda. Biol. Conserv. 2020, 242, 108414. [Google Scholar] [CrossRef]
- Guo, S.; Xu, P.; Miao, Q.; Shao, G.; Chapman, C.A.; Chen, X.; He, G.; Fang, D.; Zhang, H.; Sun, Y. Automatic identification of individual primates with deep learning techniques. Iscience 2020, 23, 101412. [Google Scholar] [CrossRef]
- Fennell, M.; Beirne, C.; Burton, A.C. Use of object detection in camera trap image identification: Assessing a method to rapidly and accurately classify human and animal detections for research and application in recreation ecology. Glob. Ecol. Conserv. 2022, 35, e02104. [Google Scholar] [CrossRef]


| Model | Epoch | Batch Size |
|---|---|---|
| YOLOv5s_day | 80 | 32 |
| YOLOv5m_day | 80 | 32 |
| YOLOv5l_day | 80 | 16 |
| YOLOv5s_night | 65 | 32 |
| YOLOv5m_night | 65 | 32 |
| YOLOv5l_night | 65 | 16 |
| YOLOv5s_togather | 60 | 32 |
| YOLOv5m_togather | 60 | 32 |
| YOLOv5l_togather | 45 | 16 |
| Species Category | No. of Total Images | No. of Daytime Images | No. of Nighttime Images | Image Resolution |
|---|---|---|---|---|
| 17 | 25,657 | 15,313 | 10,344 | 1280 × 720/1600 × 1200 |
| Species | Day and Night | Day | Night | |||
|---|---|---|---|---|---|---|
| Training Set | Test Set | Training Set | Test Set | Training Set | Test Set | |
| Amur tiger | 1123 | 246 | 676 | 145 | 447 | 101 |
| Amur leopard | 1260 | 314 | 872 | 219 | 388 | 95 |
| Wild boar | 1801 | 423 | 1159 | 291 | 642 | 132 |
| Sika dear | 1726 | 466 | 1216 | 328 | 510 | 138 |
| Red fox | 1504 | 358 | 802 | 188 | 702 | 170 |
| Raccoon dog | 1169 | 324 | 248 | 81 | 921 | 243 |
| Asian badger | 1052 | 257 | 735 | 176 | 317 | 81 |
| Asian black bear | 1084 | 285 | 772 | 188 | 312 | 97 |
| Leopard cat | 1589 | 385 | 841 | 196 | 748 | 189 |
| Roe deer | 1749 | 374 | 1317 | 293 | 432 | 81 |
| Siberian weasel | 985 | 284 | 554 | 175 | 431 | 109 |
| Yellow-throated marten | 779 | 205 | 681 | 178 | 98 | 27 |
| Sable | 483 | 129 | 152 | 40 | 331 | 89 |
| Musk deer | 1045 | 248 | 216 | 47 | 829 | 201 |
| Manchurian hare | 1010 | 270 | 17 | 3 | 993 | 267 |
| Cow | 1016 | 284 | 936 | 263 | 80 | 21 |
| Dog | 1150 | 280 | 1056 | 252 | 94 | 28 |
| Total | 20,525 | 5132 | 12,250 | 3063 | 8275 | 2069 |
| Experiment | Model | Metric | |||
|---|---|---|---|---|---|
| Precision | Recall | mAP_0.5 | mAP_0.5:0.95 | ||
| Day&Night | YOLOv5s | 0.981 | 0.972 | 0.987 | 0.858 |
| YOLOv5m | 0.987 | 0.975 | 0.989 | 0.880 | |
| YOLOv5l | 0.984 | 0.975 | 0.989 | 0.878 | |
| FCOS_Resnet50 | 0.969 | 0.892 | 0.979 | 0.812 | |
| FCOS_Resnet101 | 0.963 | 0.882 | 0.978 | 0.820 | |
| Cascade_R-CNN_HRNet32 | 0.809 | 0.986 | 0.980 | 0.840 | |
| Day | YOLOv5s | 0.981 | 0.968 | 0.984 | 0.867 |
| YOLOv5m | 0.981 | 0.974 | 0.984 | 0.880 | |
| YOLOv5l | 0.982 | 0.969 | 0.983 | 0.889 | |
| FCOS_Resnet50 | 0.909 | 0.904 | 0.981 | 0.825 | |
| FCOS_Resnet101 | 0.928 | 0.920 | 0.983 | 0.832 | |
| Cascade_R-CNN_HRNet32 | 0.815 | 0.980 | 0.973 | 0.845 | |
| Night | YOLOv5s | 0.956 | 0.972 | 0.984 | 0.850 |
| YOLOv5m | 0.976 | 0.982 | 0.989 | 0.867 | |
| YOLOv5l | 0.971 | 0.986 | 0.989 | 0.874 | |
| FCOS_Resnet50 | 0.940 | 0.859 | 0.947 | 0.678 | |
| FCOS_Resnet101 | 0.970 | 0.867 | 0.965 | 0.796 | |
| Cascade_R-CNN_HRNet32 | 0.738 | 0.981 | 0.970 | 0.824 | |
| Videos | Model | Acc_0.6 | Acc_0.7 | Acc_0.8 |
|---|---|---|---|---|
| 725 | YOLOv5m | 88.8% | 89.6% | 89.5% |
| Cascade_R-CNN_HRNet32 | 86.3% | 86.4% | 86.5% | |
| FCOS_Resnet101 | 91.6% | 86.6% | 64.7% |
Publisher’s Note: MDPI stays neutral with regard to jurisdictional claims in published maps and institutional affiliations. |
© 2022 by the authors. Licensee MDPI, Basel, Switzerland. This article is an open access article distributed under the terms and conditions of the Creative Commons Attribution (CC BY) license (https://creativecommons.org/licenses/by/4.0/).
Share and Cite
Tan, M.; Chao, W.; Cheng, J.-K.; Zhou, M.; Ma, Y.; Jiang, X.; Ge, J.; Yu, L.; Feng, L. Animal Detection and Classification from Camera Trap Images Using Different Mainstream Object Detection Architectures. Animals 2022, 12, 1976. https://doi.org/10.3390/ani12151976
Tan M, Chao W, Cheng J-K, Zhou M, Ma Y, Jiang X, Ge J, Yu L, Feng L. Animal Detection and Classification from Camera Trap Images Using Different Mainstream Object Detection Architectures. Animals. 2022; 12(15):1976. https://doi.org/10.3390/ani12151976
Chicago/Turabian StyleTan, Mengyu, Wentao Chao, Jo-Ku Cheng, Mo Zhou, Yiwen Ma, Xinyi Jiang, Jianping Ge, Lian Yu, and Limin Feng. 2022. "Animal Detection and Classification from Camera Trap Images Using Different Mainstream Object Detection Architectures" Animals 12, no. 15: 1976. https://doi.org/10.3390/ani12151976