Article

Recovery from Hypersaline-Stress-Induced Immunity Damage and Intestinal-Microbiota Changes through Dietary β-glucan Supplementation in Nile tilapia (Oreochromis niloticus)

1
Key Laboratory of Tropical Hydrobiology and Biotechnology of Hainan Province, Hainan Aquaculture Breeding Engineering Research Center, College of Marine Sciences, Hainan University, Haikou 570228, China
2
School of Life Sciences, East China Normal University, Shanghai 200241, China
3
School of Biological Sciences, Flinders University, Adelaide, SA 5001, Australia
*
Author to whom correspondence should be addressed.
These authors contributed equally to this work.
Animals 2020, 10(12), 2243; https://doi.org/10.3390/ani10122243
Submission received: 4 November 2020 / Revised: 25 November 2020 / Accepted: 27 November 2020 / Published: 30 November 2020

Abstract

:

Simple Summary

Long-term hypersaline stress can induce coagulation disorders and splenomegaly and down-regulate the complement pathway in tilapia, which can increase risk in healthy breeding. As a prebiotic, β-glucan dietary supplementation can significantly reduce enlarged spleen resulting from hypersaline stress. The hematological aspects of the red blood cell count, hematocrit, red cell distribution width, platelet count, and plateletcrit were also decreased by supplementation with dietary β-glucan. In the spleen and intestine, β-glucan intake significantly decreased the high expression of immune-related genes due to hypersaline stress resulting from β-glucan intake in tilapia. β-glucan supplementation also significantly increased the abundance of beneficial microbiota such as Lactobacillus, Phycicoccus, and Rikenellaceae in the intestine. In summary, β-glucan intake can relieve tissue damage and optimize the intestinal microbiota of tilapia in brackish water and improve fish health.

Abstract

Long-term exposure to hyperosmotic environments can induce severe immune damage and increase risk in tilapia breeding. As an effective immunoregulator, β-glucan has attracted extensive attention in nutritional research and given rise to high expectations of improving health status and alleviating organismal damage in tilapia, Oreochromis niloticus, in brackish water. In this study, an 8-week cultivation experiment was conducted on tilapia fed a basal diet or diets with β-glucan supplementation in freshwater (control) and brackish water. Growth performance, hematological aspects, immune cytokine expression, and the intestinal microbiota of tilapia were analyzed. The results indicated that supplementation with β-glucan significantly reduced the enlarged spleen of tilapia resulting from hypersaline stress. Tilapia fed β-glucan showed significantly-greater decreases in the red blood cell count, hematocrit, red cell distribution width, platelet count, and plateletcrit than those fed the basal diet. β-glucan significantly decreased the high expression of immune-related genes in the spleen induced by hyperosmotic stress. In the intestine, the high migration inhibitory factor-2 (MIF-2) and IL-1β gene expression induced by hypersaline stress was significantly reduced. β-glucan supplementation also significantly increased the abundance of beneficial microbiota such as Lactobacillus, Phycicoccus, and Rikenellaceae. Therefore, dietary β-glucan supplementation can significantly reduce spleen enlargement and improve immune function in tilapia in brackish water. β-glucan intake can also optimize the intestinal microbiota of tilapia in brackish water and improve fish health.

1. Introduction

As a biologically-active immunomodulator, β-glucan is a ubiquitous component of fungi, yeast, oats, and seaweed [1]. β-glucan can be recognized by the innate immune system, which plays an essential role in host defense [2]. In pharmaceutics, β-glucan shows potential therapeutic value for immune improvement, along with anti-inflammatory and anti-cancer effects [3,4]. As a dietary additive, the positive effect of β-glucan is also found in various aquatic animals under stress conditions. Resistance capacity against bacterial infection and immune function can be enhanced by β-glucan addition in Oreochromis niloticus [5,6]. β-glucan supplementation also can improve growth and immune function in zebrafish [7], Pagrus major [8], Ictalurus punctatus [9], and Pseudosciaena crocea [10]. In Litopenaeus vannamei, dietary β-glucan can significantly improve growth performance and induce higher respiratory burst and higher richness of probiotics in the intestine versus basal diets at low salinity [11,12].
In mammals, β-glucans have a significant impact on the intestinal microbiota, and in turn on organismal health [13]. In addition to its effective immunomodulatory properties, β-glucan is also a typical fiber digested by intestinal enzymes to produce short-chain fatty acids (SCFAs) [14]. SCFAs are beneficial to reduce the pH and are thus beneficial for the competitive exclusion of pathogens in the intestine [15]. Intestinal bacterial metabolism in aquatic animals shows important functions in health regulation and nutrient absorption [16]. Dietary β-glucan supplementation can improve intestinal microbiota communities in Cyprinus carpio [17], Scophthalmus maximus [18], Rutilus Frisii kutum [19], and Cyprinus carpio L [20]. β-glucans can also increase the dominance of the intestinal microbiota richness in L. vannamei under the conditions of ammonia and low-salinity stress [12,21].
For aquatic animals, salinity is a key ecological index that directly influences growth, physiological status, immune function, and nutritional value [22]. In our previous research, chronic hyperosmotic stress induced an intumescent spleen and enlarged macrophage centers in head kidney and suppressed immune function in O. niloticus [23]. As the two largest lymphoid and immunocompetent organs, the spleen and head kidney are sensitive to environmental changes [24,25]. In O. mossambicus, acute salinity stress can increase phagocytosis, respiratory burst activity, and humoral immune reactions in the spleen and head kidney [26]. Chronic salinity stress can also increase susceptibility to streptococcus infection in O. mossambicus [27]. After exposure to endosulfan at a level equivalent to ½ LC50 for 96 h, a lower spleen cell viability and relative spleen weight were found in O. niloticus [28]. Similarly, exposure to cadmium chloride (20.93 mg/L) for 120 h can cause significant changes in melano-macrophage centers (MMCs) and free macrophages in the spleen and head kidney of O. mossambicus [29]. The blood parameters of teleost fish are also sensitive to salinity stress, as evidenced in Huso [30], Rachycentron canadum [31], Notopterus notopterus [32], and Acipenser brevirostrum [33].
Nile tilapia (Oreochromis niloticus) is the most economically-important and extensively-cultured aquatic species worldwide. Although tilapia exhibit strong adaptation to environmental salinity, hypersaline stress can still damage immune function and increase the risks of disease and death. Previous research has indicated that environmental salinity can significantly alter the gut microbiota and induce impaired immune function in O. niloticus [23,34]. Therefore, it is necessary to find an effective method to mitigate or eliminate the negative impacts in tilapia induced by environmental hyperosmotic stress. In this study, the effects of β-glucan supplementation in the diet on growth performance, hematology, histology, immunity gene expression, and intestinal microbiota communities were analyzed to evaluate the comprehensive health status response in Nile tilapia under hypersaline environments. This study will provide new insights to explore the role of dietary nutrient manipulation in fish to cope with environmental stress.

2. Materials and Methods

2.1. Ethical Approval

The animal ethics protocol was approved by the East China Normal University Experimental Animal Ethics Committee (No. f20190201).

2.2. Experimental Diets

Isonitrogenous and isoenergetic experimental diets were formulated with three concentrations of β-glucan (0, 0.2 and 0.4%). Raw materials were crushed with a pulverizer and sieved through a 60-μm mesh and then mixed evenly. Each mixture was dissolved by adding deionized water and then wet-extruded into 2.5-mm-diameter pellets using a double-helix plodder (F-26, SCUT industrial factory, Guangdong, China). The scattered pellets were air-dried at room temperature until <10% moisture content was attained. Pellets were graded to various sizes by 12- and 8-mesh sieves and stored at −20 °C until use. Ingredient and proximate compositions of the three experimental diets are given in Table 1.

2.3. Experimental Fish and Management Procedure

The juvenile Nile tilapia (all males) were obtained from a local farm in Hainan, China. All fish were acclimated in four tanks for one week with commercial diets. During acclimation, the salinity in the three tanks was gradually increased to 16 practical salinity units (psu) at a daily rate of 4 psu by adding sea salt. After the salinity reached the target value, fish with an initial weight of 1.28 ± 0.03 g were randomly assigned to 16 tanks (750 L) at a density of 35 fish per tank. There were four experimental treatments (freshwater-0% β-glucan, 16 psu-0% β-glucan, 16 psu-0.2% β-glucan, and 16 psu-0.4% β-glucan) with four replicates each. During the 53-day experiment, fish were fed to satiation twice daily (0800 and 1400 h). Two tanks (freshwater and brackish water) were used for water storage before entering the experimental system. The daily water exchange rate was 50% of the water volume. Animals were illuminated by natural light with a specific photoperiod. Water quality parameters were checked every three days. The concentration of dissolved oxygen was 6.5–7.5 mg/L, pH averaged 7.50 ± 0.30, ammonia-N was < 0.05, and water temperature averaged 30 ± 2 °C.

2.4. Sample Collection

At the end of the cultivation, all fish were fasted for 24 h. Subsequently, the fish were anesthetized in 30 ppm MS-222 before being counted and weighed to determine survival and weight gain [35,36]. The blood of each fish was individually sampled by caudal sinus puncture with plastic sterile syringes. Blood samples were transferred to lithium heparin tubes for hematological determination. The spleen, head kidney, and mid-intestine of 15 fish in each tank were dissected quickly and then stored in liquid nitrogen to analyze immune gene mRNA and intestinal microflora. The spleens of five fish in each tank were dissected and weighed to determine relative spleen weight. Survival, weight gain, and relative spleen weight were calculated as follows:
Survival (%) = (final fish number/initial fish number) × 100
Weight gain (WG, %) = (final weight (g) − initial weight (g))/initial weight (g) × 100
Relative spleen weight (RSW, %) = (wet spleen weight)/(wet body weight) × 100

2.5. Hematological Assay

The red blood cell count (RBC, 1,012/L), hematocrit (HCT, %), red cell distribution width (RDW, %), white blood cell count (WBC, 109/L), platelet count (PLT, 109/L) and plateletcrit (PCT, %) were investigated by an automated hematological analyzer (BC-2800vet, Shenzhen, Mindray Bio-Medical Electronics, Shenzhen, China).

2.6. Immune-Related Gene Expression

Total RNA in the spleen, head kidney, and intestine was extracted with the TRIzol reagent (RN0101, Aidlab, Beijing, China). RNA quality and quantity were analyzed using a NanoDrop 2000 spectrophotometer (Thermo, Wilmington, NC, USA). After the quantity was analyzed, 1 μg total RNA was reverse transcribed using the PrimeScripTM RT Master Mix (RR047A, Takara, Japan). The system program was 42 °C for 2 min to remove genomic DNA followed by 37 °C for 15 min and 85 °C for 5 s to complete reverse transcription. Six replicates per treatment were run for each gene with elongation factor-1α (EF-1α) as the internal control. Primers of interleukin-1β (IL-1β), migration-inhibitory factor-2 (MIF-2), transforming growth factor-β1 (TGF- β1), and tumor necrosis factor-α (TNF-α) were designed and validated by Primer Premier 6.0 according to National Coalition Building Institute (NCBI) (Table 2).
Real-time PCR (RT-PCR) was performed in a volume of 20 μL containing 10 μL 2×Ultra SYBR mixture (CW0957, Kangwei, China), 0.5 μL of 10 mM primers, 2.5 μL of diluted first-standard cDNA template and 6.5 μL of H2O. The program cycling conditions were denaturation at 95 °C for 30 s, followed by 40 cycles of 94 °C for 15 s, 58 °C for 20 s, 72 °C for 20 s, and a 0.5 °C per 5 s increment from 60 °C to 95 °C. RT-PCR was analyzed in the CFX96 Real-Time PCR system (Bio-Rad, Richmond, CA, USA). The cycle time (Ct) values of different experimental treatments in hypersaline water were compared to their corresponding internal control and then converted to fold change by comparison with the freshwater treatment through the quantified method of 2−ΔΔct. CFX Manager™ Software (version 1.0) was used to study data visualization and relative quantification analysis.

2.7. Intestinal Microbiota Analysis in Nile tilapia

Intestinal contents were used for bacterial composition analysis in Nile tilapia under four experimental treatments. The total microbiota DNA was isolated with an E.Z.N.A.TM soil DNA kit according to the manufacturer’s instructions. DNA quality was assessed by PCR amplification of the bacterial 16S rRNA genes, and the quantity was measured using a NanoDrop spectrophotometer (Thermo, Wilmington, DE, USA). The V3–V4 region of the bacterial 16S ribosomal RNA genes was amplified by PCR using the primers 338F (ACTCCTACGGGAGGCAGCA) and 806R (GGACTACHVGGGTWTCTAAT). The PCR reactions were performed in a 25 μL mixture containing 5 μL of 5× reaction buffer, 5 μL of 5× GC buffer, 2 μL of 2.5 mM dNTPs, 1 μL of forward primer (10 μM), 1 μL of reverse primer (10 μM), 2 μL of DNA template, 8.75 μL of H2O, and 0.25 μL of Q5 high-fidelity DNA polymerase (M0419S, New England BioLabs, Beijing, China). The PCR reaction conditions were as follows: 98 °C for 2 min, followed by 26 cycles of denaturation at 98 °C for 15 s, annealing at 55 °C for 30 s, extension at 72 °C for 30 s, and extension at 72 °C for 5 min. The purified PCR products were subjected to the Illumina MiSeq PE300 platform (Shanghai Personal Biotechnology Co., Ltd., Shanghai, China), generating paired-end reads. Low-quality sequences with a length below 150 bp, and mononucleotide repeats over 8 bp, average Phred scores <20 and with ambiguous bases were removed. The sequences obtained in the present study can be downloaded from Sequence ReadArchive (SRA) with the accession number PRJNA433775.
Operational taxonomic units (OTUs) were clustered according to the similarity cutoff of 97% using UPARSE (version 7.1 http://drive5.com/uparse/) (Edgar, 2013). The most abundant sequence in the OTUwas selected as the representative sequence, followed by taxonomic assignment in the Greengenes database (release 13.8) using the confidence threshold of 70%. QIIME calculated alpha diversity indices. Partial least squares discriminant analysis (PLS-DA) was used to test classification model influence by R software. A Venn diagram was constructed to identify the same and unique OTUs. Intestinal microbiota interspecies interaction among dominant classes with abundance in the top 50 of four treatments was calculated using Mothur, constructing the interspecies interaction network for the dominant class with Rho > 0.6 and p < 0.01. The network properties were calculated and visualized with Gephi.

2.8. Statistical Analysis

Statistical analysis was performed using SPSS statistics 20 (IBM, Armonk, NY, USA). All data were mean ± standard error (mean ± S.E.). Significant differences in relative spleen weight and intestinal microbiota richness and diversity were analyzed by one-way analysis of variance (ANOVA) in tilapia among all treatments. Data on hematology and mRNA expression in tilapia in brackish water were analyzed by ANOVA. Student’s t-test was used to analyze significant differences in hematological data and mRNA expression in tilapia between freshwater and brackish water. A total of 37 OTUs were selected for heatmap analysis using Student’s t-test with subsequent Bonferroni correction. A single asterisk “*” represents significant differences (p < 0.05), and double asterisks “**” represent extremely-significant differences (p < 0.01).

3. Results

3.1. Survival, Growth Performance, and Relative Spleen Weight

There were no significant differences in weight gain (WG) or survival among all treatments. Tilapia in hypersaline water showed a significantly-higher relative spleen weight (RSW) than those in freshwater (p < 0.05). The supplementation of β-glucan significantly reduced RSW in tilapia in brackish water (p < 0.05) (Table 3).

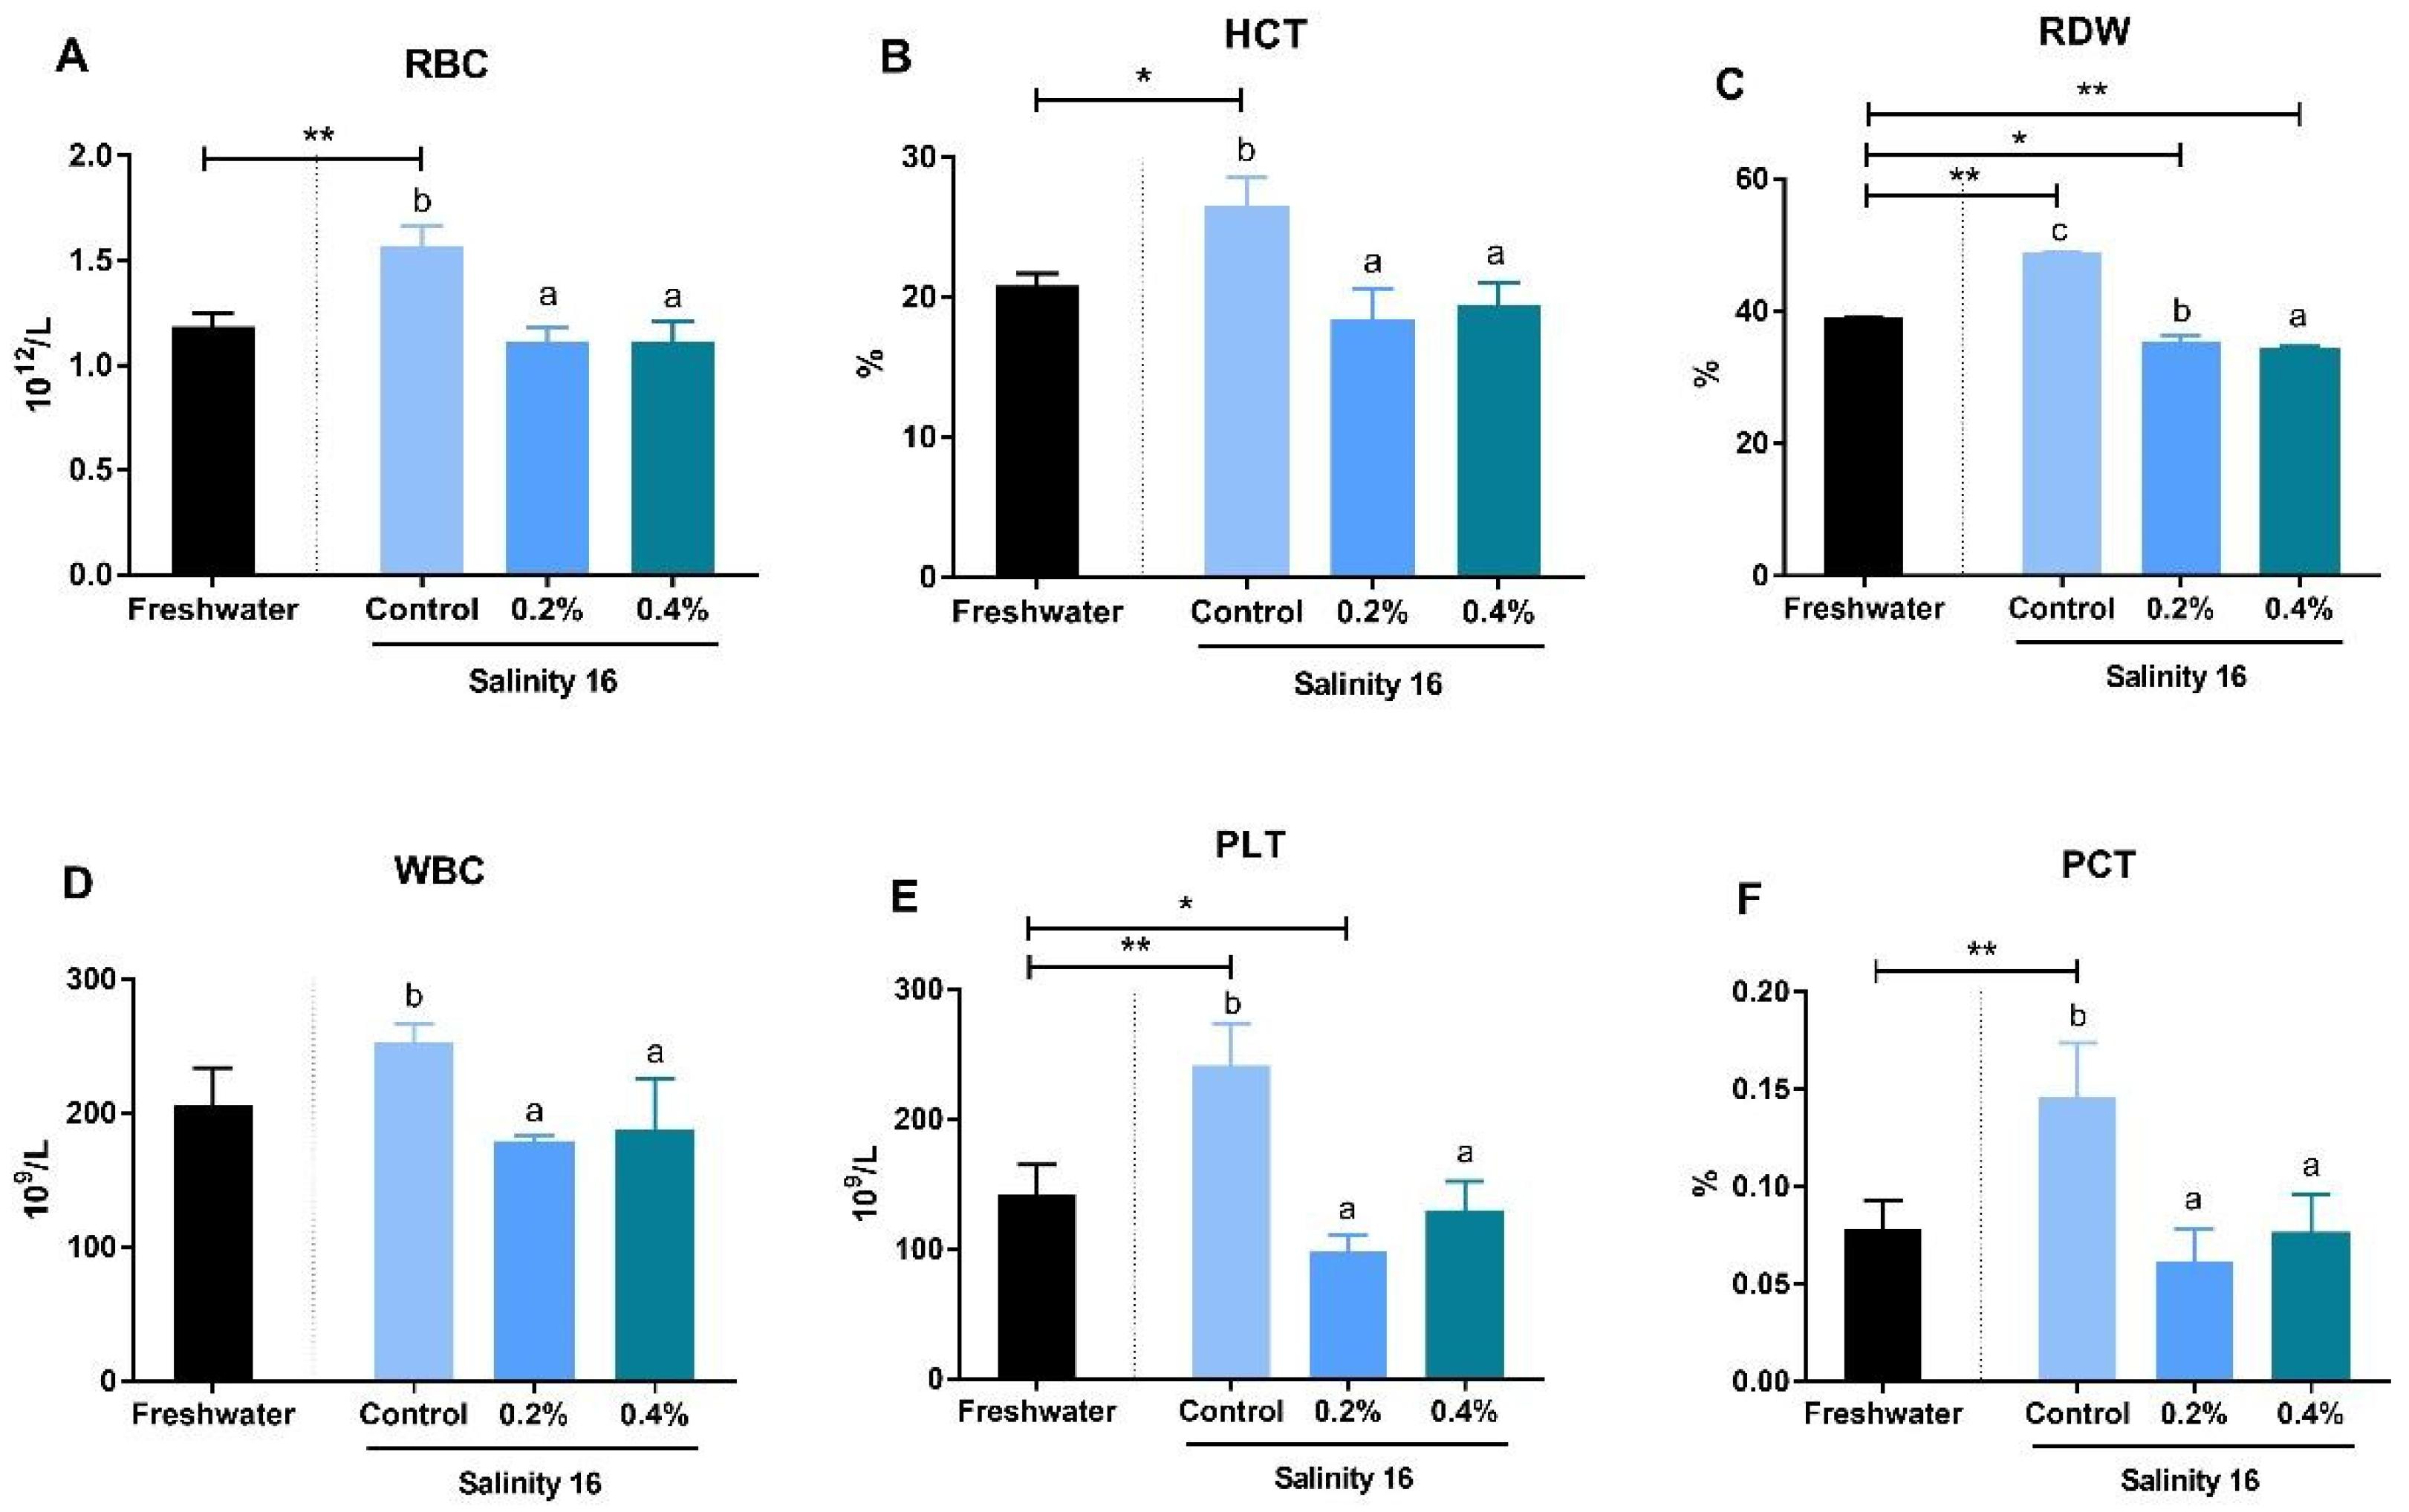
3.2. Hematological Parameters

Brackish water significantly increased RBC, HCT, RDW, PLT, and PCT in the blood of tilapia (p < 0.05). Tilapia fed diets with β-glucan showed significantly-lower RBC, HCT, RDW, PLT, and PCT than tilapia in brackish water fed the basal diet (p < 0.05) (Figure 1).

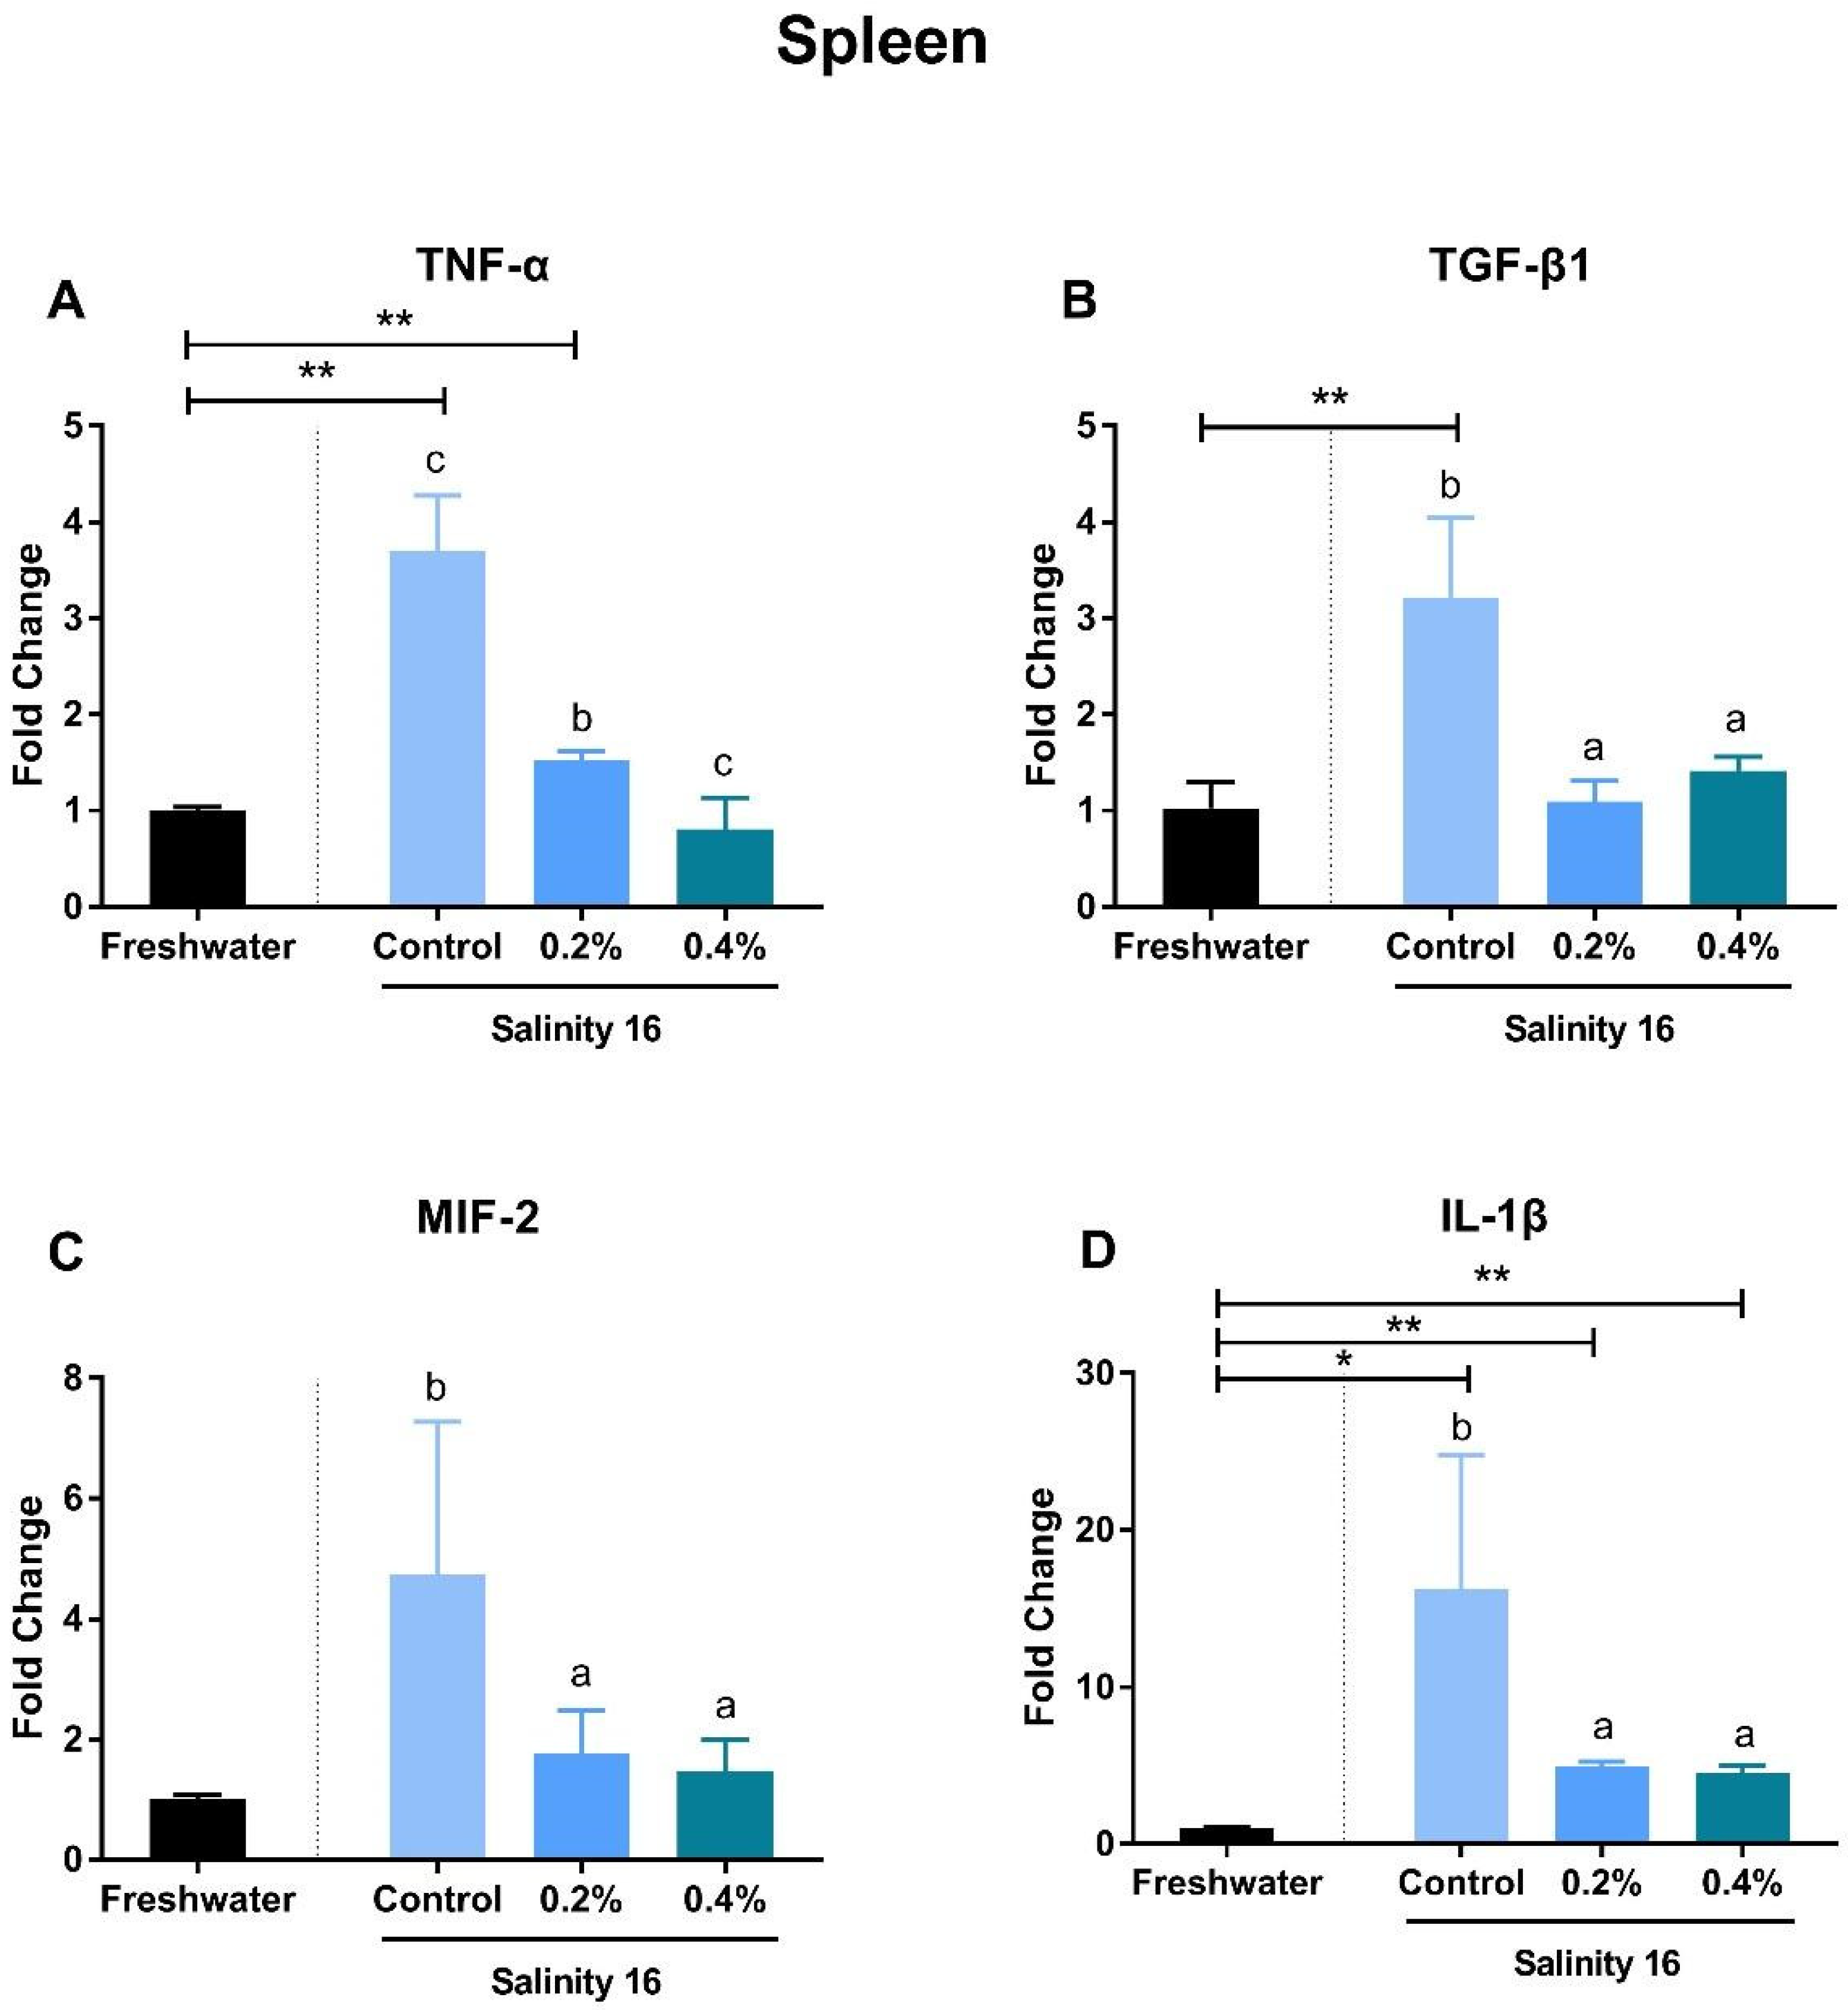
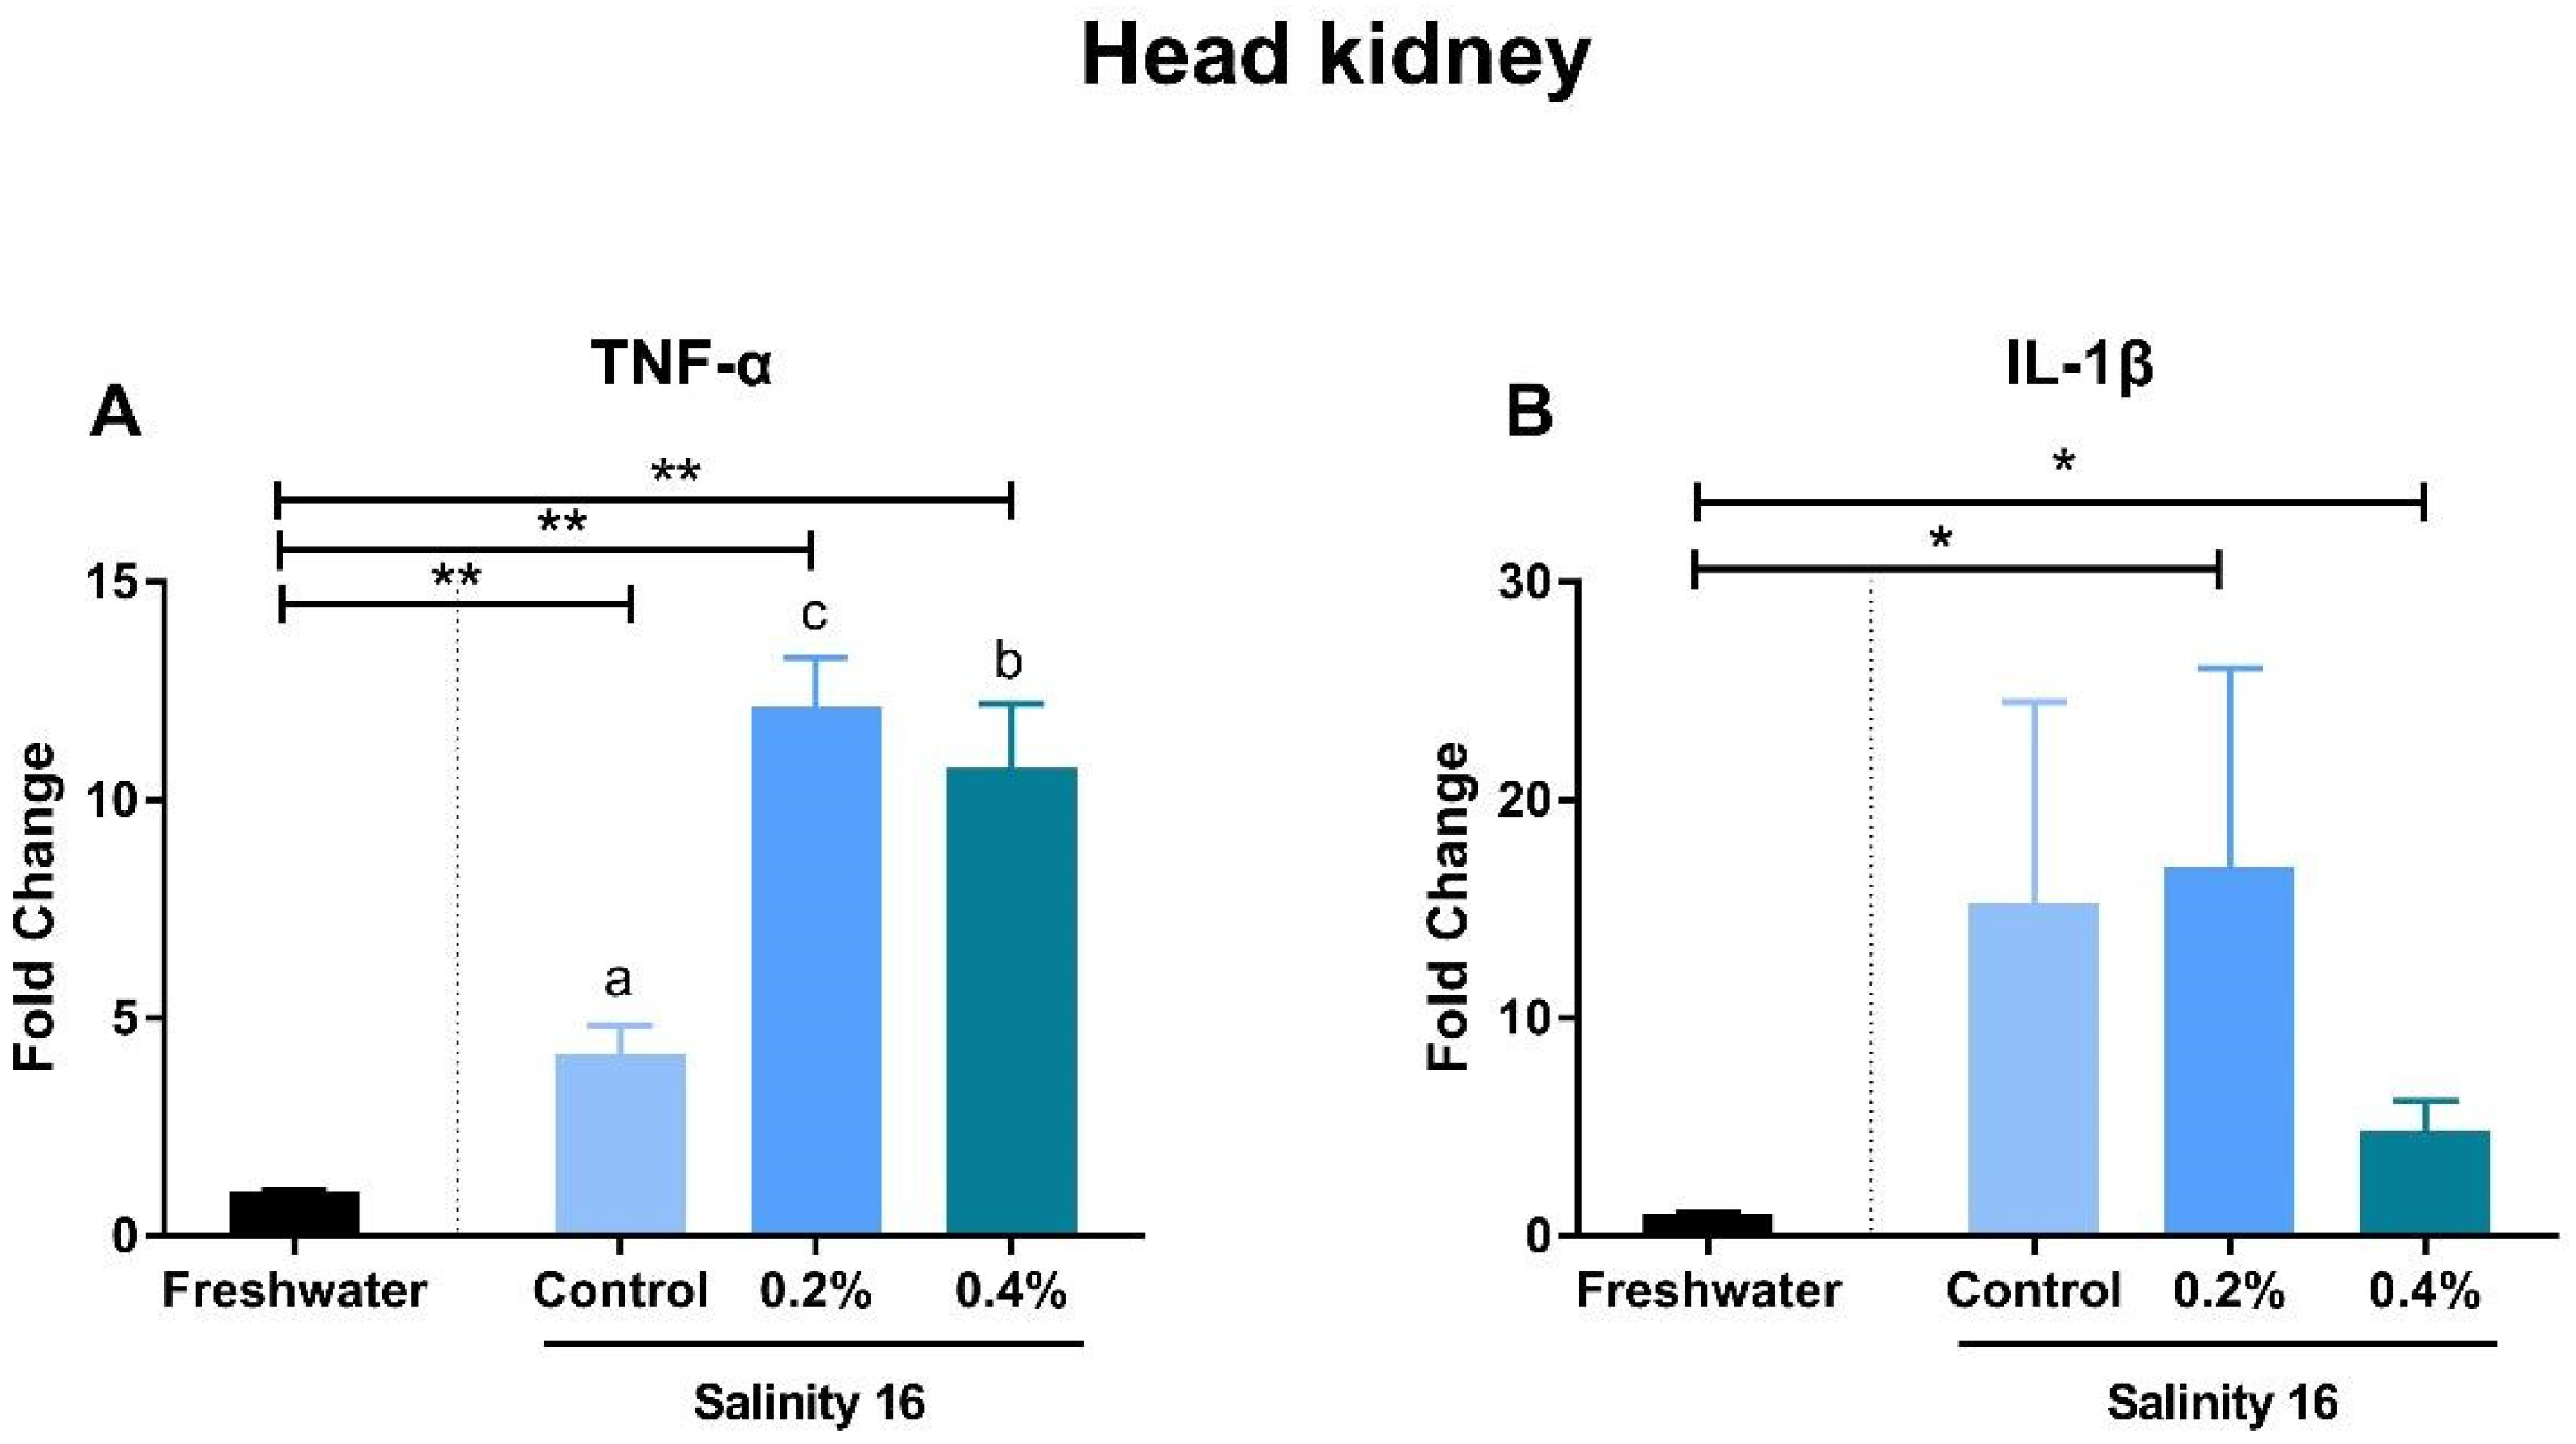
3.3. Gene Expression of Immune-Inflammatory Cytokines

Tilapia in brackish water exhibited significantly-higher gene expression of TNF-α, TGF-β, and IL-1β in the spleen than in freshwater (p < 0.05). Supplementation with β-glucan significantly reduced the gene expression of these immune genes (p < 0.05) (Figure 2A,B,D). The supplementation of β-glucan significantly decreased gene expression of TNF-α in a dose-dependent manner. In the intestine, gene expression of MIF-2 and IL-1β was significantly increased in a brackish water environment (p < 0.05). These increments can be alleviated in tilapia when fed diets with β-glucan (Figure 3C,D). TGF-β expression in the intestine of tilapia fed the basal diet and the 0.2% β-glucan diets in brackish water was significantly higher than that in freshwater (p < 0.05) (Figure 3B). However, the gene expression of TNF-α was significantly higher in tilapia fed diets with β-glucan in brackish water than in freshwater (p < 0.05) (Figure 3A). In the head kidney, the TNF-α expression of tilapia in brackish water was significantly higher than that in tilapia in freshwater (p < 0.05). Tilapia in brackish water fed diets with β-glucan showed significantly-higher gene expression of IL-1β than in freshwater (p < 0.05) (Figure 4).

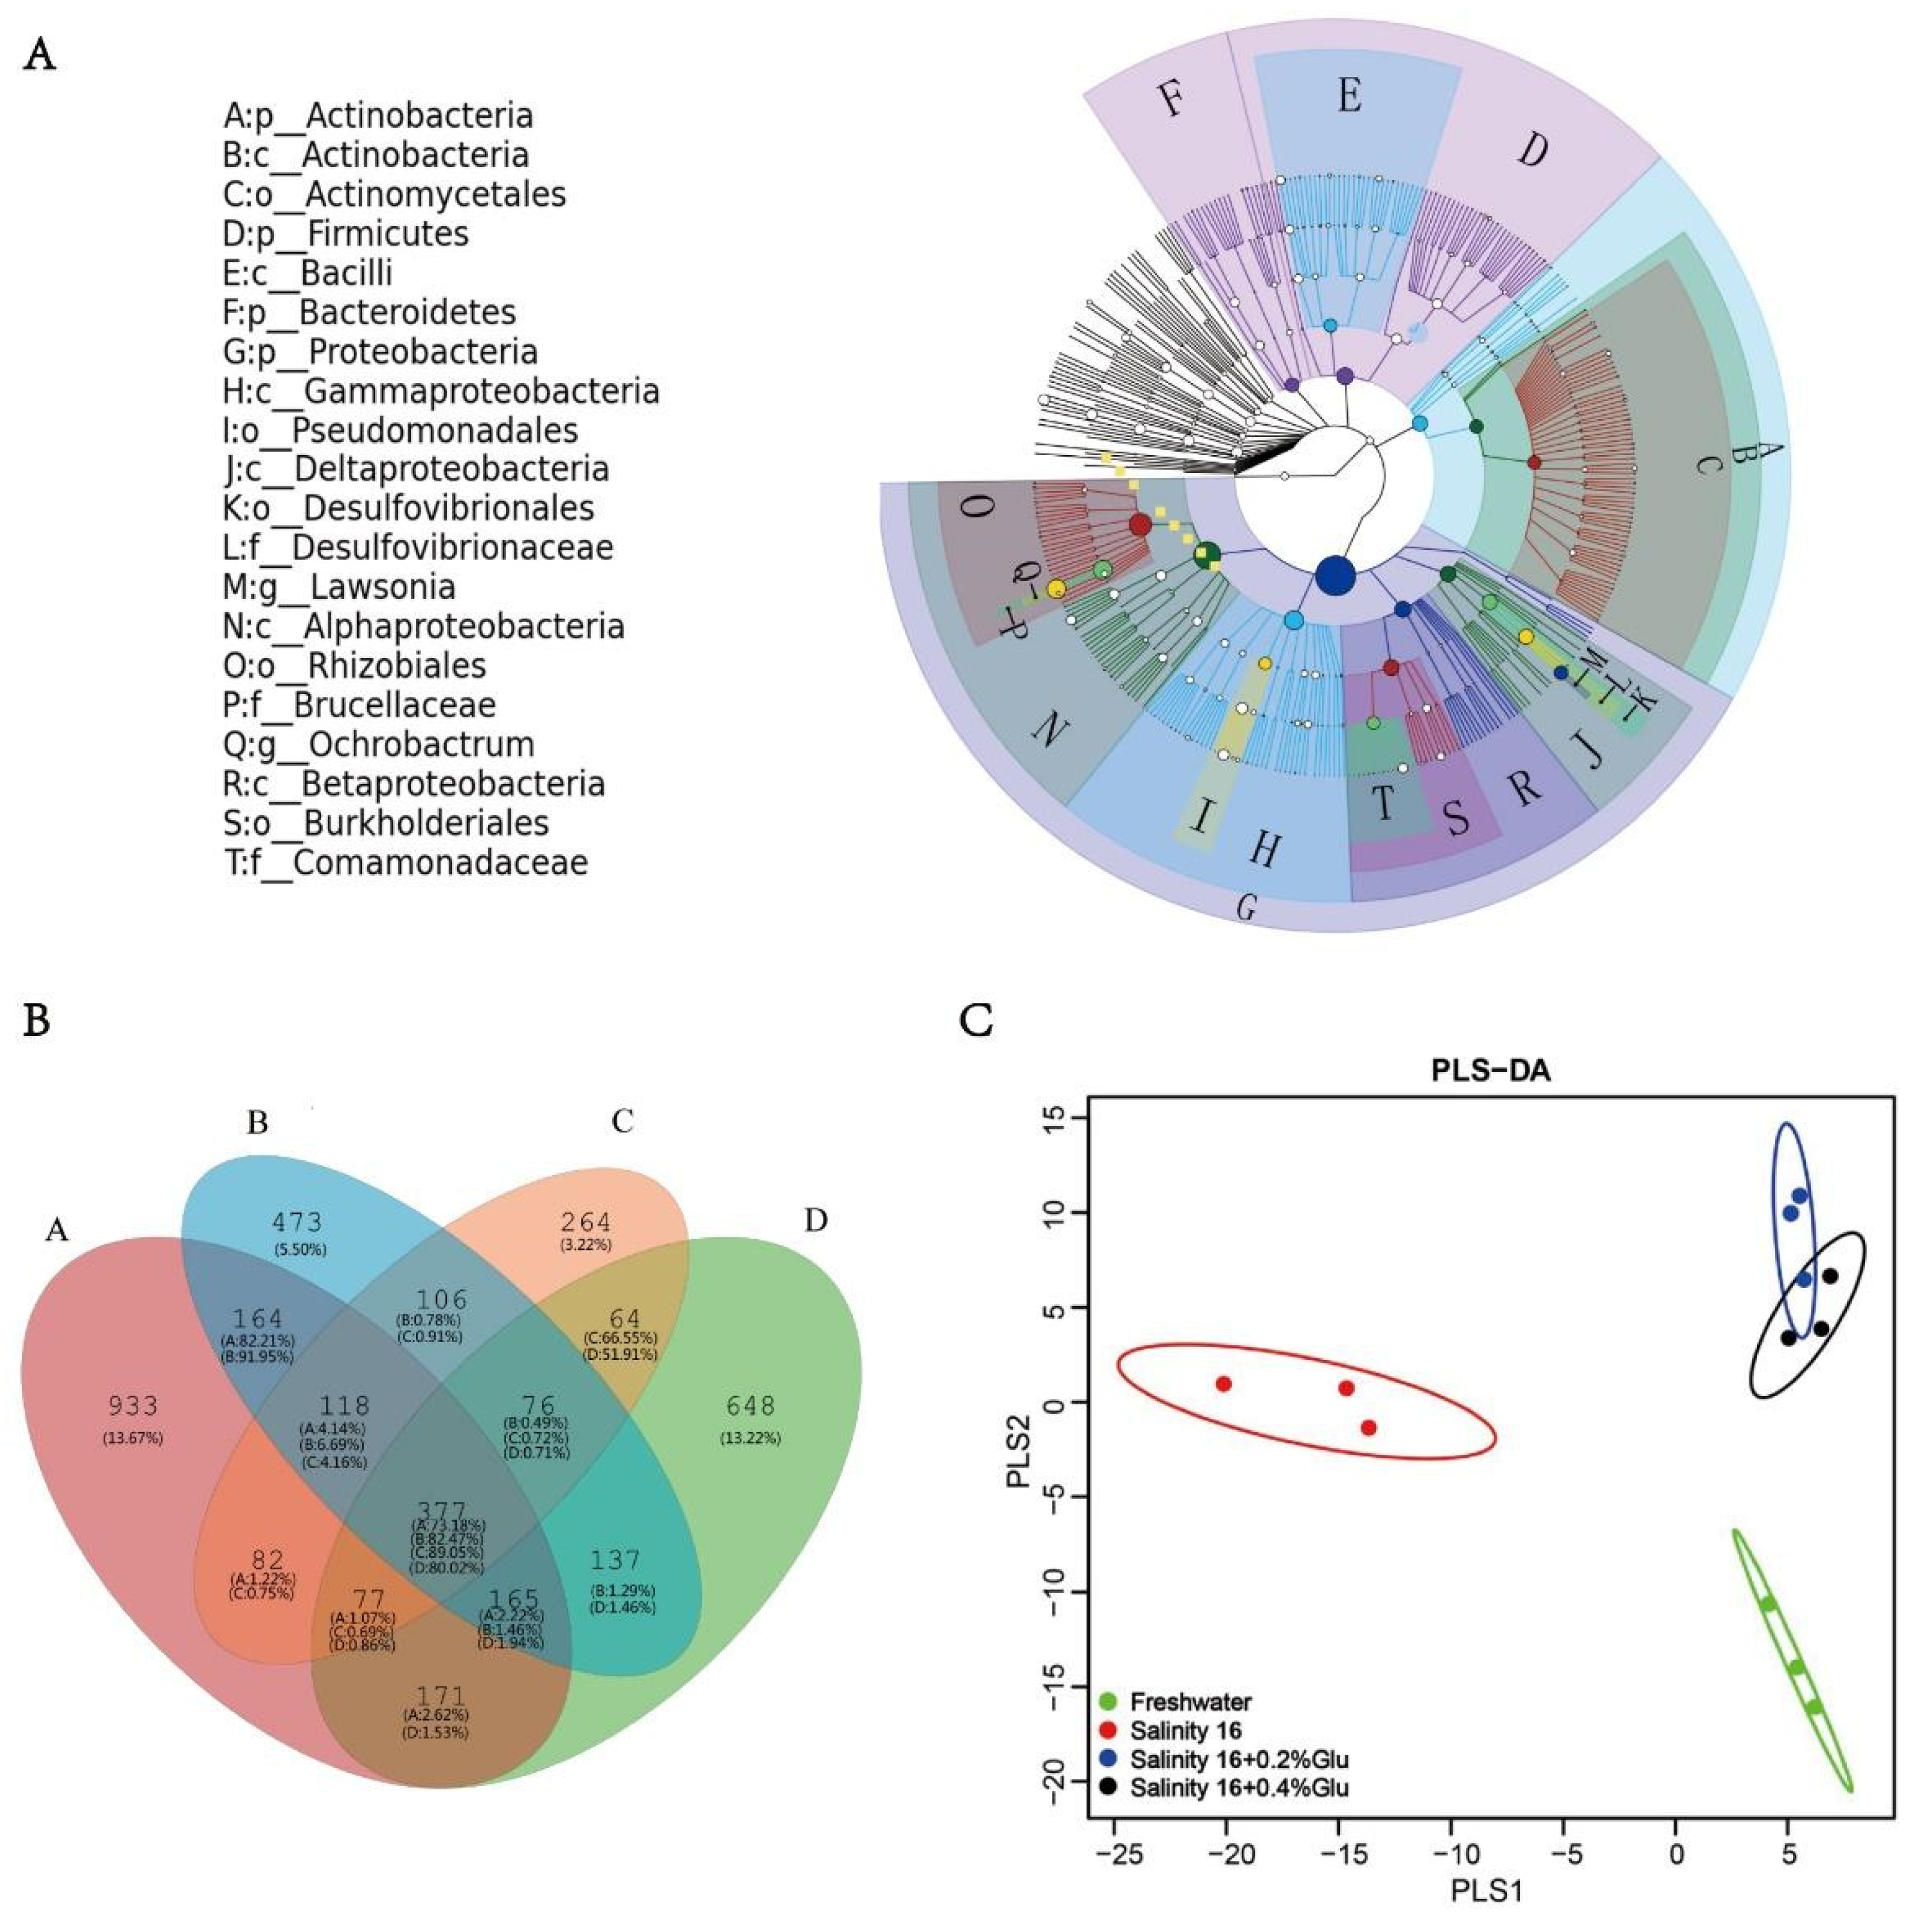
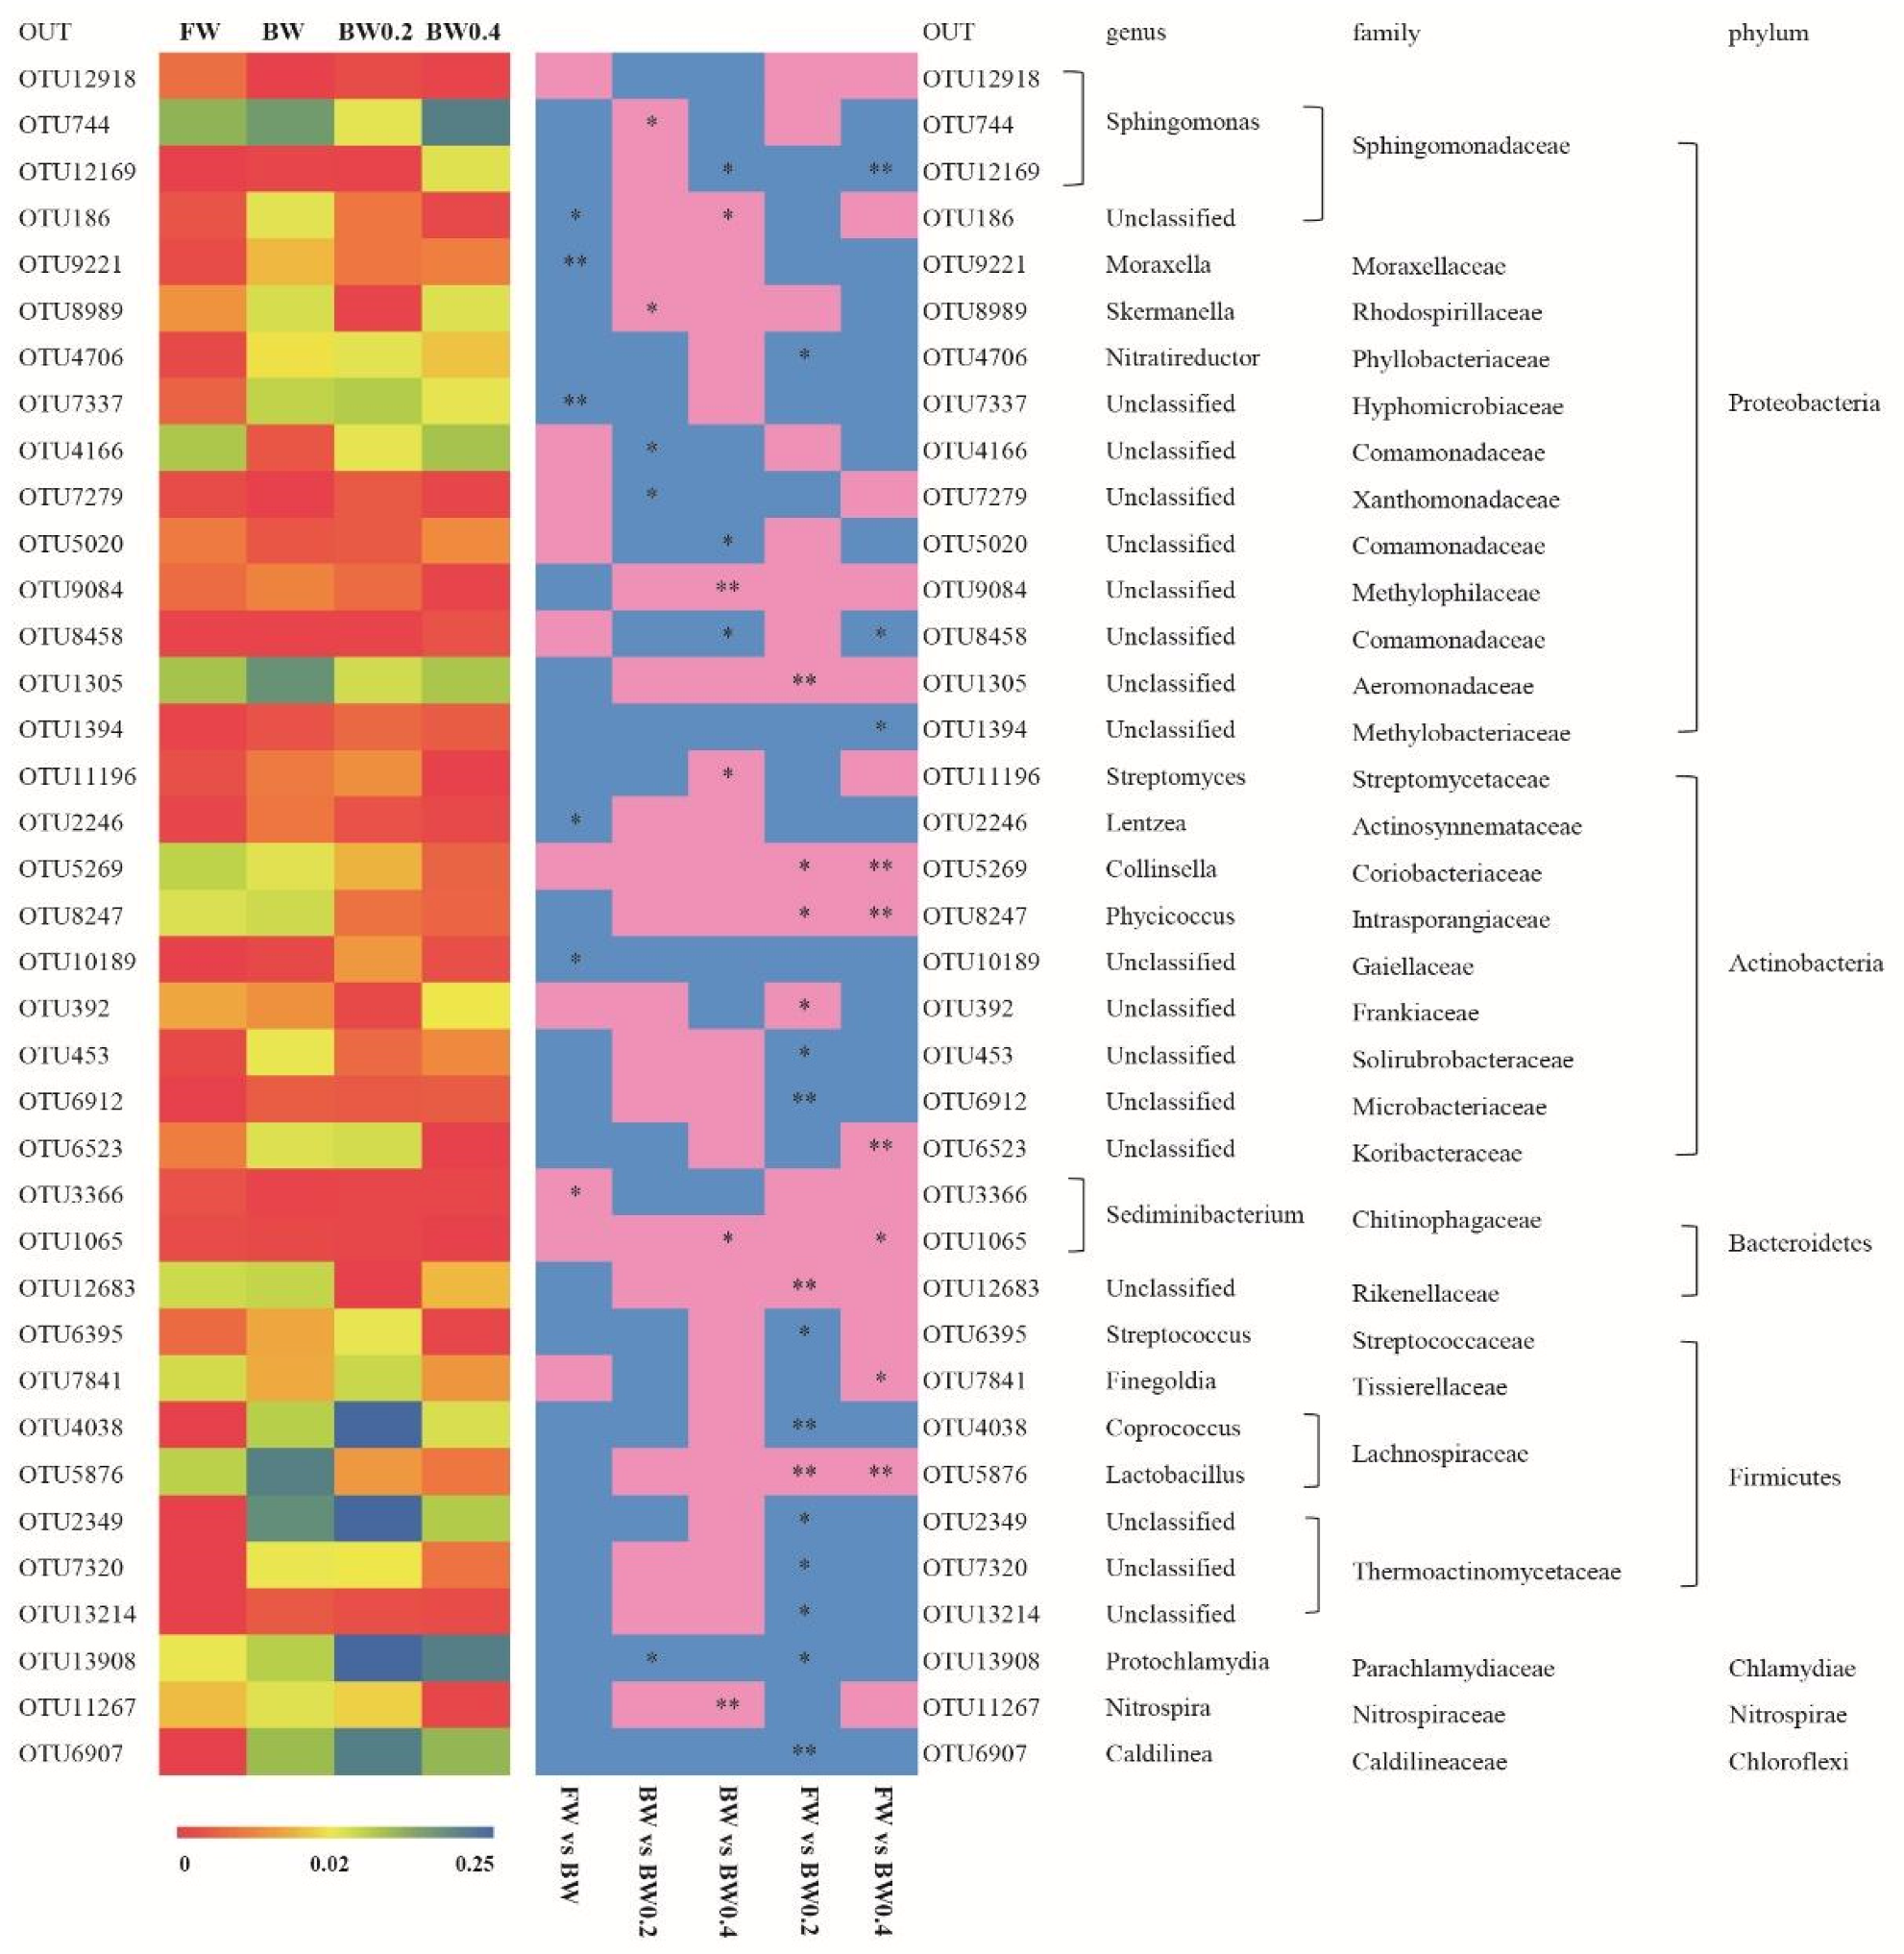
3.4. Differences in Bacterial Community Composition, Diversity, and Structure

A total of 351,714 high-quality sequences were obtained from the intestinal microbiota with an average of 87,929 sequences per sample. Microbiota richness of Chao 1 and Ace ranged from 564.00 to 939.67 and from 564.11 to 939.67, respectively. Diversity of Shannon and Simpson ranged from 5.46 to 7.02 and from 0.93 to 0.97, respectively (Table 4). Supplementation with 0.4% β-glucan significantly reduced Chao 1, ACE Shannon, and Simpson indexes in the intestine as compared with those in tilapia fed the basal diet in brackish water (p < 0.05). Although 0.2% β-glucan addition in diets also reduced intestinal microbiota richness and diversity as compared with absence of supplementation in the basal diet in brackish water, there was no significant difference between these two treatments.
The top 20 taxa of relative abundance were differentiated by letters in the graph (outer layers to inner layers in the order from phylum to genus) (Figure 5A). Proteobacteria showed the highest abundance, followed by Actinobacteria, Firmicutes and Bacteroidetes, which were the dominant bacteria in the intestine across all treatments.
In the Venn diagram, there were 377 OTUs shared in tilapia among four treatments. Compared with the tilapia intestinal microbiota in freshwater (648 OTUs), there were 933 in 16 psu-0% β-glucan, 473 in 16 psu-0.2% β-glucan, and 264 unique OTUs in 16 psu-0.4% β-glucan (Figure 5B). Supplementation with dietary β-glucan reduced the quantity of unique OTUs in tilapia as compared with the diet without β-glucan supplementation in freshwater and brackish water.
As shown by PLS-DA (partial least squares discriminant analysis) (Figure 5C), the distributions of bacterial communities in tilapia in freshwater and brackish water were distinguishable and showed a far coordinate distance. Supplementation with β-glucan reduced the coordinate distance, making it closer to that of the freshwater control, especially in the case of 0.4% β-glucan treatment. There was an obvious overlap of the bacteria community distributions of tilapia in brackish water fed diets with 0.2% and 0.4% β-glucan.
The heatmap analysis included 37 OTUs (Figure 6). Moraxella and Leuzea decreased significantly in tilapia in brackish water as compared with those in freshwater (p < 0.05). The abundances of Thermoactinomycetacae, Parachlamydiaceae, Caldilineaceae, Solirubrobacteraceae, Microbacteriaceae, and Phyllobacteriaceae were significantly lower in tilapia fed 0.2% β-glucan (p < 0.05) in brackish water than in freshwater. Tilapia fed 0.2 and 0.4% β-glucan exhibited significantly higher Lactobacillus, Phycicoccus and Collinsella than those in freshwater (p < 0.05). Meanwhile, Aeromonadaceae and Rikenellaceae showed a significantly-higher abundance in tilapia fed 0.2% β-glucan than those in freshwater (p < 0.01). Finegoldia and Sediminibacterium exhibited significantly higher abundance in tilapia fed 0.4% β-glucan than in freshwater (p < 0.05). Compared to tilapia fed the basal diet in brackish water, 0.4% β-glucan supplementation significantly increased Nitrospira and Streptomyces richness in tilapia (p < 0.05).

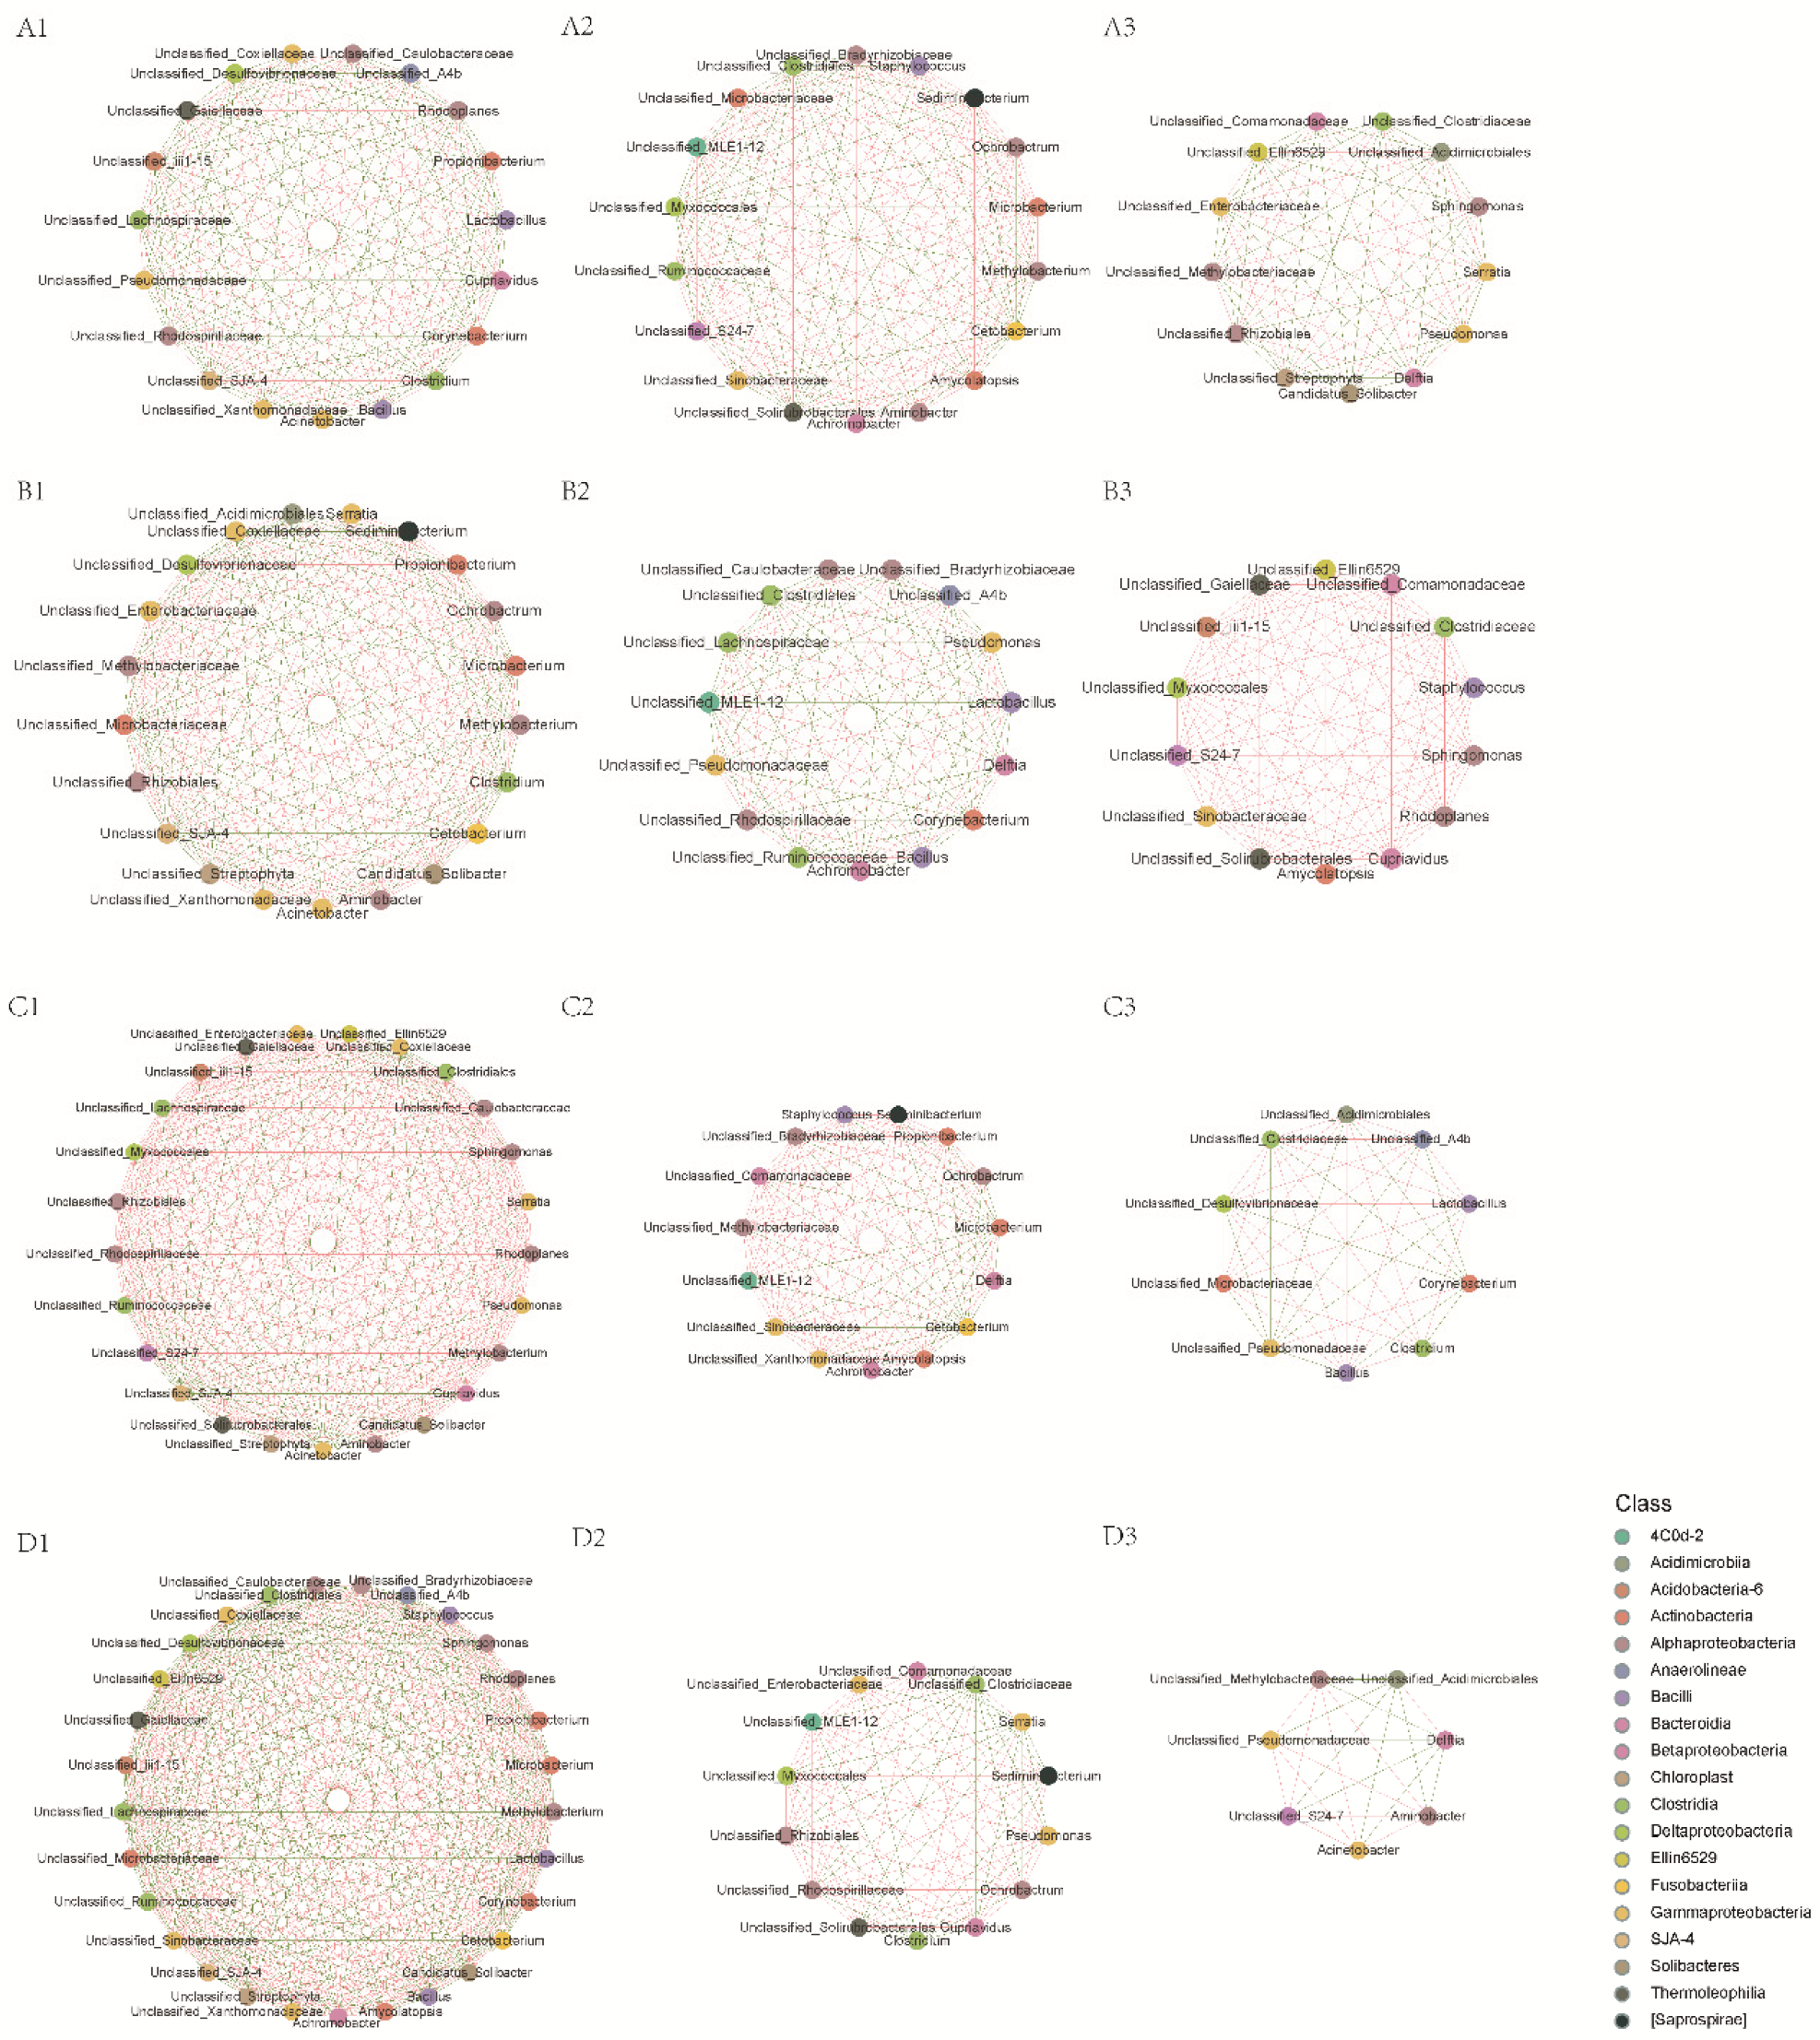
3.5. Intestinal Microbiota Interspecies Interaction

The interspecies interaction network was analyzed to evaluate the influence of environmental salinity and dietary β-glucan supplementation on interspecies interactions among the intestinal microbiota. Compared to the freshwater control, the network in O. niloticus in brackish water was more complex and better connected. The networks were more complex when β-glucan supplementation was provided; a dose-dependent effect was exhibited (Figure 7). The topological properties also indicated that the average path in tilapia fed β-glucan was higher than that of tilapia fed the basal diet (Table 5). There were increases in edges, average degree, graph density, centralization, and heterogeneity in the intestinal microbiota when β-glucan was supplemented in diets. β-glucan supplementation at 0.4% significantly improved the negative association ratio with respect to the results under 0.2% β-glucan supplementation.

4. Discussion

As an immunostimulant, β-glucan is considered an effective reagent for enhancing the immune status of aquatic animals in aquaculture [37]. β-glucan supplementation in diets can significantly improve growth performance in various fish, such as Cyprinus carpio koi [38], Oncorhynchus mykiss [39], O. niloticus [40], and Apostichopus japonicas [41]. However, in the present study, weight gain was not improved by dietary β-glucan in tilapia in brackish water. In O. mossambicus, only 1% β-glucan in the diet significantly increased weight gain after an 8-week cultivation [42]. Similar results were also found in Dicentrachus labrax [43], O. nilotics [44], and Carassius auratus by adding β-glucan [45]. Therefore, the supplementary dose of β-glucan in the diet has a key influence on growth performance, especially in a stressful environment.
Although no significant improvement in growth performance was observed in tilapia, the tissue damage was significantly alleviated by dietary β-glucan supplementation in this study. The enlargement of the spleen due to long-term hypersaline stress can be significantly improved by β-glucan supplementation in the diet regardless of concentrations. β-glucan (0.1%) in the diet also can decrease RSW in O. niloticus under diazinon stress [46]. Cytologically, the spleen is the largest lymphoid organ and an immunocompetent organ in teleost that is rich in melano-macrophages for phagocytosis in the immune response [47]. The normal volume of the spleen is vital to physiological function in fish. Previous research indicated that fungal polysaccharides can activate the innate immune system by binding to receptors on macrophages to stimulate the phagocytosis index in vertebrates [48]. Therefore, the spleen can be recovered to a healthy status in tilapia after an 8-week β-glucan intake under a hyperosmotic environment.
In addition to its immune function role, the spleen also serves a hematopoietic function equivalent to erythropoiesis in the bone marrow until adulthood [47]. The hematological results indicated that the RBC count was significantly higher in fish fed the basal diet in brackish water than in freshwater. Long-term hyperosmotic stress can inhibit coagulation cascades in the spleen and result in an enlarged spleen in paraffin sections from O. niloticus [23]. β-glucan supplementation could significantly decrease HCT, RDW, PLT, and PCT in O. niloticus in brackish water. However, this result is at odds with previous studies where β-glucan increased WBC and RBC in Trachinotus ovatus [49], Rutilus Frisii kutum [19], and Labeo rohita [50]. It seems that the response of hematological indicators in fish fed β-glucan supplements depends on the condition of environmental stress.
Inflammatory cytokines exhibited a pattern of different gene expression in the spleen, intestine, and head kidney. In the spleen, the increase in TNF-α expression was significantly decreased by dietary β-glucan supplementation. TNF-α is produced primarily by monocytic lineage cells, such as macrophages and TNF-α-activated macrophages, which can cause many autoimmune diseases [51]. In the spleen section, macrophage disappearance is reflected by the reduction of gene expression of TNF-α in tilapia fed β-glucan in brackish water. In macrophages, as a receptor, TNF-α can regulate the production of TGF-β1 through the c-Jun NH2 terminal kinase pathway. However, this pathway in macrophages acts a negative autoregulatory loop in the control of TNF-α-induced TGF-β1 production [52]. Therefore, gene expression of TGF-β1 also exhibited a significant decrease in the spleen of tilapia fed β-glucan in brackish water. TGF-β1 in the intestine showed a different expression pattern compared to that in the spleen. IL-1β is a pro-inflammatory cytokine that can initiate and regulate the inflammatory process, as well as apoptosis and cell division processes, and this gene is important for stimulating effective innate host defenses, cell multiplication, phagocytosis, and nitric oxide production [53,54]. Supplementation with β-glucan can significantly suppress the expression of IL-1β in the spleen, intestine, and head kidney of tilapia. Similarly, β-glucan supplementation can also down-regulate the expression of IL-1β in the head kidney and intestine of Cyprinus carpio L [55]. The MIF has gained substantial attention as a pivotal upstream mediator of innate and adaptive immune responses and can serve as a biomarker for diseases with inflammatory reaction [56]. The gene expression of MIF in the intestine and spleen was decreased due to β-glucan intake in brackish water. β-glucan has a dual function of both pro-inflammatory mediator production and anti-inflammatory properties [57,58]. In the present study, the enhanced immune response in the spleen induced by environmental salinity could be significantly relieved by dietary β-glucan. However, pro-inflammatory indicators, such as TNF-α in the intestine and head kidney, were still significantly increased by the supplementation with β-glucan in brackish water.
The health status response of the intestine was also reflected in the results of the microbial community. β-glucan can be absorbed by the intestine and stimulate immune response [59]. It can be used as a probiotic fermentation substrate which is catabolized by anaerobic bacteria to produce SCFA, modulate the production of cytokines and chemokines, and improve systemic inflammation [60]. SCFA is also a vital nutrient substrate for mucosa and epithelial cells, improving intestinal epithelial cell proliferation and promoting peristalsis [14,15]. Intestinal microbiota richness and diversity estimators were decreased due to the supplementation of β-glucan, especially in tilapia fed 0.4% β-glucan. In Solea senegalensis, three different glucan diets all reduced microbiome species richness and diversity by oral intubation [61]. The reduction of richness and diversity was also reported in Apostichopus japonicus and C. carpio L fed β-glucan [20,62]. Similar results were found in L. vannamei fed β-glucan under salinity stress [12]. Although bacterial diversity and richness can play essential roles in maintaining intestinal ecological function, the vital effect still depends on the enrichment of certain beneficial species in the intestinal microbiota community, rather than diversity itself [63,64]. Additionally, PLS-DA indicated that β-glucan supplementation can modulate the intestinal microbiota community of tilapia, and the modulated community was similar to that in the freshwater control, especially in tilapia fed 0.4% β-glucan. This is indicative that β-glucan supplementation in the diet can restore and benefit the intestinal microbiota environment in tilapia in brackish water.
With respect to the constituents of the intestinal microbiota at the genus level, 0.2% and 0.4% β-glucan supplementation significantly increased the abundance of Lactobacillus in tilapia. Lactic acid bacteria are beneficial to the fish intestinal ecosystem due to producing bacteriocins, lactic acid, and other antagonistic compounds to inhibit the amounts of some fish pathogens [65]. Previous research indicated that β-glucan is a fermentative substrate that enhances the proliferation of Lactobacillus in vitro [66]. Lactobacillus plantarum is an effective additive in the tilapia diet [67]. The dose of 0.4% β-glucan in the diet significantly increased the abundance of Nitrospiraceae in the intestine of tilapia as compared with the abundance observed in fish in brackish water fed the basal diet. This may present a close relationship with a low pH in the intestine due to high richness of Lactobacillus and Nitrospiraceae, which are more commonly found at a pH < 2.0 [68]. Phycicoccus and Collinsella also showed significantly-higher abundance in tilapia fed β-glucan. These two groups of microorganisms showed higher abundance in the intestine of Eriocheir sinensis and canines when fed diets with L-tryptophan and green tea polyphenols, respectively [69,70]. Compared to tilapia in brackish water fed a basal diet, 0.4% β-glucan in the diet significantly increased the richness of Streptomyces in the intestine. Streptomyces fungus can produce chitinase in the intestine to inhibit pathogens [71]. Streptomyces cerevisiae β-glucan can also prevent airway hyperreactivity and pulmonary inflammation in a murine asthma model [72]. At the family level, 0.2% β-glucan supplementation significantly decreased the abundance of Thermoactinomycetacae, Caldilineaceae, Solirubrobacteraceae, Microbacteriaceae and Phyllobacteriaceae in the intestine of tilapia as compared with those in the freshwater group. The Caldilineaceae abundance can be inhibited by resveratrol and oxytetracycline intake in tilapia and zebrafish, respectively [73,74,75]. Meanwhile, resveratrol can also increase the abundance of Firmicutes, just like β-glucan in tilapia [74]. Compared to the results without β-glucan supplementation in both freshwater and brackish water, β-glucan supplementation in the diet could increase the abundance of Rikenellaceae in the intestine of tilapia. The richness of Rikenellaceae is positively correlated with the inflammatory foci and the alleviation of intestinal barrier dysfunction [76]. At the phylum level, 0.4% β-glucan significantly increased Firmicutes abundance in tilapia intestine compared with fish in brackish water fed a basal diet. Similar results were found in L. vannamei and Acipenser baerii fed β-glucan and arabinoxylan oligosaccharides, respectively [12,77].
The intestinal microbial communities of O. niloticus fed with 0.4% β-glucan showed the highest average connectivity and most complex ecological networks among all the treatments. Interacting intestinal bacteria can achieve a dynamic balance in an organism, though they are still sensitive to environmental and nutritional factors [78]. In addition to the characteristics of ecological network complexity, intestinal microbial stability is also closely related to the forms of interspecific interaction with similar or complementary functions [79]. Positive interactions indicate complementation or cooperation, while negative interactions may show competition or predation between bacteria at the family level [80]. Supplementation with 0.2% β-glucan can significantly increase the ratio of positive interaction, and the 0.4% β-glucan supplementation can significantly increase the negative interactions of the intestinal microbiota in O. niloticus. Positive interactions can improve evolutionary stability when families are more likely to interact with other cooperators [81]. However, the intestinal microbiota may be more stable when the community is more competitive than cooperative. Therefore, 0.4% β-glucan supplementation can provide a more stable intestinal microbial community in O. niloticus than 0.2% β-glucan supplementation and the basic diet.

5. Conclusions

Dietary supplementation with 0.2% and 0.4% β-glucan can significantly relieve the spleen enlargement and improve the immune function of O. niloticus in brackish water. Meanwhile, β-glucan intake (especially 0.4% concentration) also can optimize the intestinal microbiota, enhance the complex microbiota interactions of O. niloticus in brackish water and improve fish health.

Author Contributions

Data curation, C.X. and Y.S.; formal analysis, C.X., Y.S., and X.W.; methodology, Y.S., E.L., and L.C.; software, C.X., Y.S., and X.W.; supervision, E.L. and J.G.Q; writing—original draft, C.X. and Y.S.; writing—review and editing, C.X., J.G.Q., and E.L.; funding acquisition, E.L. and X.W. All authors have read and agreed to the published version of the manuscript.

Funding

This research was funded by grants from the Hainan Provincial Key Research and Development Program (ZDYF2019068), the National Natural Science Foundation of China (31802311), the Initial Fund from Hainan University for R & D (KYQD(ZR)1736), and the Construction Project of Scientific Research Platforms of Hainan University (ZY2019HN09).

Conflicts of Interest

The authors declare no conflict of interest.

References

  1. Vetvicka, V.J.; Vetvickova, J. Physiological effects of different types of β-glucan. Biomed. Pap. Med. Fac. Univ. Palacky Olomouc Czech. Repub. 2007, 151, 225–231. [Google Scholar] [CrossRef] [PubMed] [Green Version]
  2. Goodridge, H.S.; Wolf, A.J.; Underhill, D.M. β-Glucan recognition by the innate immune system. Immunol. Rev. 2009, 230, 38–50. [Google Scholar] [CrossRef] [PubMed]
  3. Cao, Y.; Sun, Y.; Zou, S.W.; Duan, B.C.; Sun, M.Y.; Xu, X.J. Yeast β-glucan suppresses the chronic inflammation and improves the microenvironment in adipose tissues of ob/ob mice. J. Agric. Food Chem. 2018, 66, 621–629. [Google Scholar] [CrossRef] [PubMed]
  4. Chan, C.F.; Chan, W.K.; Sze, M.Y. The effects of β-glucan on human immune and cancer cells. J. Hematol. Oncol. 2009, 2, 25. [Google Scholar] [CrossRef] [PubMed] [Green Version]
  5. Pilarski, F.; de Oliveira, C.A.F.; de Souza, F.P.B.D.; Zanuzzo, F.S. Different β-glucans improve the growth performance and bacterial resistance in Nile tilapia. Fish Shellfish Immunol. 2017, 70, 25–29. [Google Scholar] [CrossRef] [Green Version]
  6. Dawood, M.A.O.; Eweedah, N.M.; Moustafa, E.M.; Shahin, M.G. Effects of aspergillus oryzae and β-glucan on growth and oxidative and immune responses of Nile tilapia, Oreochromis niloticus. Probiotics Antimicro. 2019, 425, 9. [Google Scholar] [CrossRef]
  7. Udayangani, R.; Dananjaya, S.; Fronte, B.; Kim, C.H.; Lee, J.; Zoysa, M.D. Feeding of nano scale oats β-glucan enhances the host resistance against Edwardsiella tarda and protective immune modulation in zebrafish larvae. Fish Shellfish Immunol. 2017, 60, 72–77. [Google Scholar] [CrossRef]
  8. Dawood, M.A.O.; Koshio, S.; Ishikawa, M.; Yokoyama, S.; El Basuini, M.F.; Hossain, M.S.; Nhu, T.H.; Moss, A.S.; Dossou, S.; Wei, H. Dietary supplementation of β-glucan improves growth performance, the innate immune response and stress resistance of red sea bream, Pagrus major. Aquac. Nurt. 2017, 23, 148–159. [Google Scholar] [CrossRef]
  9. Chen, D.; Ainsworth, A.J. Glucan administration potentiates immune defence mechanisms of channel catfish, Ictalurus punctatus Rafinesque. J. Fish. Dis. 2006, 15, 295–304. [Google Scholar] [CrossRef]
  10. Ai, Q.H.; Mai, K.S.; Zhang, L.; Tan, B.P.; Zhang, W.B.; Xu, W.; Li, H.T. Effects of dietary β-1, 3 glucan on innate immune response of large yellow croaker, Pseudosciaena crocea. Fish Shellfish Immunol. 2007, 22, 394–402. [Google Scholar] [CrossRef]
  11. Murthy, H.S.; Li, P.; Lawrence, A.L.; Gatlin, D.M. Dietary β-glucan and nucleotide effects on growth, survival and immune responses of pacific white shrimp, Litopenaeus vannamei. J. Appl. Aquac. 2009, 21, 160–168. [Google Scholar] [CrossRef]
  12. Li, H.F.; Xu, C.; Zhou, L.; Dong, Y.F.; Su, Y.J.; Wang, X.D.; Jian, G.Q.I.N.; Chen, L.Q.; Li, E.C. Beneficial effects of dietary beta-glucan on growth and health status of Pacific white shrimp Litopenaeus vannamei at low salinity. Fish Shellfish Immunol. 2019, 91, 315–324. [Google Scholar] [CrossRef] [PubMed]
  13. Jayachandran, M.; Chen, J.L.; Chung, S.S.M.; Xu, B.J. A critical review on the impacts of β-glucans on gut microbiota and human health. J. Nutr. Bio. 2018, 61, 101–110. [Google Scholar] [CrossRef] [PubMed]
  14. Sima, P.; Vannucci, L.; Vetvicka, V. β-glucans and cholesterol (Review). Int. J. Mol. Med. 2018, 41, 1799–1808. [Google Scholar] [CrossRef] [PubMed] [Green Version]
  15. Scott, K.P.; Gratz, S.W.; Sheridan, P.O.; Flint, H.J.; Duncan, S.H. The influence of diet on the gut microbiota. Pharmacol. Res. 2013, 69, 52–60. [Google Scholar] [CrossRef] [PubMed]
  16. Li, E.C.; Xu, C.; Wang, X.D.; Wang, S.F.; Zhao, Q.; Zhang, M.L.; Jian, G.Q.I.N.; Chen, L.Q. Gut microbiota and its modulation for healthy farming of Pacific white shrimp, Litopenaeus vannamei. Rev. Fish. Sci. Aquac. 2018, 26, 381–399. [Google Scholar] [CrossRef]
  17. Jung-Schroers, V.; Adamek, M.; Jung, A.; Harris, S.; Harris, S.; Dóza, Ö.-S.; Baumer, A.; Steinhagen, D. Feeding of β-1,3/1,6-glucan increases the diversity of the intestinal microflora of carp (Cyprinus carpio). Aquacult Nutr. 2015, 22, 1026–1039. [Google Scholar] [CrossRef]
  18. Miest, J.J.; Arndt, C.; Adamek, M.; Steinhagen, D.; Reusch, T.B.H. Dietary β-glucan (MacroGard®) enhances survival of first feeding turbot (Scophthalmus maximus) larvae by altering immunity, metabolism and microbiota. Fish Shellfish Immunol. 2016, 48, 94–104. [Google Scholar] [CrossRef]
  19. Rufchaie, R.; Hoseinifar, S.H. Effects of dietary commercial yeast glucan on innate immune response, hematological parameters, intestinal microbiota and growth performance of white fish (Rutilus frisii kutum) fry. Croat. J. Fisheries. 2014, 72, 156–163. [Google Scholar] [CrossRef] [Green Version]
  20. Kühlwein, H.; Emery, M.J.; Rawling, M.D.; Harper, G.M.; Merrifield, S.J.; Davies, S.J. Effects of a dietary β-(1, 3) (1, 6)-D-glucan supplementation on intestinal microbial communities and intestinal ultrastructure of mirror carp (Cyprinus carpio L.). J. Appl. Microbiol. 2013, 115, 1091–1106. [Google Scholar] [CrossRef]
  21. Wongsasak, U.; Chaijamrus, S.; Kumkhong, S.; Boonanuntanasarn, S. Effects of dietary supplementation with β-glucan and synbiotics on immune gene expression and immune parameters under ammonia stress in Pacific white shrimp. Aquaculture 2015, 436, 179–187. [Google Scholar] [CrossRef]
  22. Brocker, C.; Thompson, D.C.; Vasilis, V. The role of hyperosmotic stress in inflammation and disease. Biomol. Concepts 2012, 3, 345–364. [Google Scholar] [CrossRef] [PubMed]
  23. Xu, C.; Li, E.C.; Suo, Y.T.; Su, Y.J.; Lu, M.H.; Zhao, Q.; Jian, G.Q.I.N.; Chen, L.Q. Histological and transcriptomic responses of two immune organs, the spleen and head kidney, in Nile tilapia (Oreochromis niloticus) to long-term hypersaline stress. Fish Shellfish Immunol. 2018, 76, 48–57. [Google Scholar] [CrossRef] [PubMed] [Green Version]
  24. Zapata, A.; Diez, B.; Cejalvo, T.; Gutiérrezde, F.C.; Cortés, A. Ontogeny of the immune system of fish. Fish Shellfish Immunol. 2006, 20, 126–136. [Google Scholar] [CrossRef]
  25. Fishelson, L. Cytomorphological alterations of the thymus, spleen, head-kidney, and liver in cardinal fish (Apogonidae, Teleostei) as bioindicators of stress. J. Morphol. 2006, 267, 57–69. [Google Scholar] [CrossRef]
  26. Jiang, I.F.; Kumar, V.B.; Lee, D.N.; Weng, C.F. Acute osmotic stress affects Tilapia (Oreochromis mossambicus) innate immune responses. Fish Shellfish Immunol. 2008, 25, 841–846. [Google Scholar] [CrossRef]
  27. Tellez-Bañuelos, M.C.; Santerre, A.; Casas-Solis, J.; Bravo-Cuellar, A.; Zaitseva, G. Oxidative stress in macrophages from spleen of Nile tilapia (Oreochromis niloticus) exposed to sublethal concentration of endosulfan. Fish Shellfish Immunol. 2009, 27, 105–111. [Google Scholar] [CrossRef]
  28. Hussein, M.M.A.; Elsadaawy, H.A.; El-Murr, A.; Ahmed, M.M.; Bedawy, A.M.; Tukur, H.A.; Swelum, A.A.A.; Saadeldin, I.M. Endosulfan toxicity in Nile tilapia (Oreochromis niloticus) and the use of lycopene as an ameliorative agent. Comp. Bioche. Phys. C 2019, 224, 108573. [Google Scholar] [CrossRef]
  29. Suresh, N. Effect of cadmium chloride on liver, spleen and kidney melano macrophage centres in Tilapia mossambica. J. Environ. Biol. 2009, 30, 505–508. [Google Scholar] [CrossRef]
  30. Zarejabad, A.M.; Jalali, M.A.; Sudagar, M.; Pouralimotlagh, S. Hematology of great sturgeon (Huso huso Linnaeus, 1758) juvenile exposed to brackish water environment. Fish. Physiol. Biochem. 2010, 36, 655–659. [Google Scholar] [CrossRef]
  31. Xu, L.W.; Feng, J.; Guo, Z.X.; Lin, H.Z.; Guo, G.X. Effect of salinity on hematology and gill Na+-K+ ATPase activity of juvenile cobia, Rachycentron canadum Linnaeus. Mar. Environ. Sci. 2008, 27, 602–606. [Google Scholar] [CrossRef]
  32. Kavya, K.S.; Jadesh, M.; Kulkarni, R.S. Hematology and serum biochemical changes in response to change in saline concentration in fresh water fish Notopterus notopterus. World Sci. News 2016, 32, 49–60. [Google Scholar]
  33. Jarvis, P.L.; Ballantyne, J.S. Metabolic responses to salinity acclimation in juvenile shortnose sturgeon Acipenser brevirostrum. Aquaculture 2003, 219, 891–909. [Google Scholar] [CrossRef]
  34. Zhang, M.L.; Sun, Y.H.; Liu, Y.K.; Qiao, F.; Chen, L.Q.; Liu, W.T.; Du, Z.Y.; Li, E.C. Response of gut microbiota to salinity change in two euryhaline aquatic animals with reverse salinity preference. Aquaculture 2016, 454, 72–80. [Google Scholar] [CrossRef]
  35. Readman, G.D.; Owen, S.F.; Knowles, T.G.; Murrell, J.C. Species specific anaesthetics for fish anaesthesia and euthanasia. Sci. Rep. 2017, 7, 1–7. [Google Scholar] [CrossRef] [PubMed] [Green Version]
  36. Laria, C.; Saoca, C.; Guerrera, M.C.; Ciulli, S.; Brundo, M.V.; Piccione, G.; Lanteri, G. Occurrence of diseases in fish used for experimental research. Lab. Anim. 2019, 53, 619–629. [Google Scholar] [CrossRef] [Green Version]
  37. Meena, D.K.; Das, P.; Kumar, S.; Mandal, S.C.; Prusty, A.K.; Singh, S.K.; Akhtar, M.S.; Behera, B.K.; Kumar, K.; Pal, A.K.; et al. Beta-glucan: An ideal immunostimulant in aquaculture (a review). Fish. Physiol. Biochem. 2013, 39, 431–457. [Google Scholar] [CrossRef]
  38. Lin, S.M.; Pan, Y.; Luo, L.; Luo, L. Effects of dietary β-1,3-glucan, chitosan or raffinose on the growth, innate immunity and resistance of koi (Cyprinus carpio koi). Fish Shellfish Immunol. 2011, 31, 788–794. [Google Scholar] [CrossRef]
  39. Ji, L.Q.; Sun, G.X.; Li, J.; Wang, Y.; Du, Y.S.; Li, X.; Liu, Y. Effect of dietary β-glucan on growth, survival and regulation of immune processes in rainbow trout (Oncorhynchus mykiss) infected by, Aeromonas salmonicida. Fish Shellfish Immunol. 2017, 64, 56–67. [Google Scholar] [CrossRef]
  40. El-Murr Abd elhakeem, I.; Hakim, Y.A.E.; Neamat-Allah, A.N.F.; Baeshen, M.; Ali, H.A. Immune-protective, antioxidant and relative genes expression impacts of β-glucan against fipronil toxicity in Nile tilapia, Oreochromis niloticus. Fish Shellfish Immunol. 2019, 94, 427–433. [Google Scholar] [CrossRef]
  41. Zhao, Y.C.; Ma, H.M.; Zhang, W.B.; Ai, Q.H.; Mai, K.S.; Xu, W.; Wang, X.J.; Liu, Z.G. Effects of dietary β-glucan on the growth, immune responses and resistance of sea cucumber, Apostichopus japonicus against Vibrio splendidus infection. Aquaculture 2011, 315, 269–274. [Google Scholar] [CrossRef]
  42. Divya, M.; Gopi, N.; Iswarya, A.; Govindarajan, M.; Alharbi, N.S.; Kadaikunnan, S.; Khaled, J.M.; Almanaa, T.N.; Vaseeharan, B. β-glucan extracted from eukaryotic single-celled microorganism Saccharomyces cerecisiae: Dietary supplementation and enhanced ammonia stress tolerance on Oreochromis mossambicus. Microb. Pathog. 2020, 139, 103917. [Google Scholar] [CrossRef] [PubMed]
  43. Bagni, M.; Romano, N.; Finoia, M.G.; Abelli, L.; Scapigliati, G.; Tiscar, P.G.; Sarti, M.; Marino, G. Short- and long-term effects of a dietary yeast beta-glucan (Macrogard) and alginic acid (Ergosan) preparation on immune response in sea bass (Dicentrarchus labrax). Fish Shellfish Immunol. 2005, 18, 311–325. [Google Scholar] [CrossRef] [PubMed]
  44. Lu, D.L.; Limbu, S.M.; Lv, H.B.; Ma, Q.; Chen, L.Q.; Zhang, M.L.; Du, Z.Y. The comparisons in protective mechanisms and efficiencies among dietary α-lipoic acid, β-glucan and l-carnitine on Nile tilapia infected by Aeromonas hydrophila. Fish Shellfish Immunol. 2018, 86, 785–793. [Google Scholar] [CrossRef] [PubMed]
  45. Cao, H.Z.; Yu, R.H.; Zhang, Y.Y.; Hu, B.Q.; Jian, S.Q.; Wen, C.G.; Kajbaf, K.; Kumar, V.; Yang, G. Effects of dietary supplementation with β-glucan and Bacillus subtilis on growth, fillet quality, immune capacity, and antioxidant status of Pengze crucian carp (Carassius auratus var. Pengze). Aquaculture 2019, 508, 106–112. [Google Scholar] [CrossRef]
  46. Abdelhamid, F.M.; Elshopakey, G.E.; Aziza, A.E. Ameliorative effects of dietary Chlorella vulgaris and β-glucan against diazinon-induced toxicity in Nile tilapia (Oreochromis niloticus). Fish Shellfish Immunol. 2020, 96, 213–222. [Google Scholar] [CrossRef]
  47. Uribe, C.; Folch, H.; Enriquez, R.; Moran, G. Innate and adaptive immunity in teleost fish: A review. Vet. Med. 2011, 56, 486–503. [Google Scholar] [CrossRef] [Green Version]
  48. De Oliveira, C.A.F.; Vetvicka, V.; Zanuzzo, F.S. β-Glucan successfully stimulated the immune system in different jawed vertebrate species. Comp. Immunol. Diagn. Microbiol. Infect. Dis. 2019, 62, 1–6. [Google Scholar] [CrossRef]
  49. Huu, H.D.; Sang, H.M.; Thanh, T.N.T. Dietary β-glucan improved growth performance, Vibrio counts, haematological parameters and stress resistance of pompano fish, Trachinotus ovatus Linnaeus, 1758. Fish Shellfish Immunol. 2016, 54, 402–410. [Google Scholar] [CrossRef]
  50. Sahoo, P.K.; Mukherjee, S.C. Effect of dietary beta-1,3 glucan on immune responses and disease resistance of healthy and aflatoxin B1-induced immunocompromised rohu (Labeo rohita Hamilton). Fish Shellfish Immunol. 2001, 11, 683–695. [Google Scholar] [CrossRef]
  51. Flavell, R.A. The relationship of inflammation and initiation of autoimmune disease: Role of TNF super family members. Curr. Top. Microbiol. Immun. 2002, 266, 1–9. [Google Scholar] [CrossRef]
  52. Pallai, A.; Kiss, B.; Vereb, G.; Armaka, M.; Kollias, G.; Szekanecz, Z.; Szondy, Z. Transmembrane TNF—Reverse signaling inhibits lipopolysaccharide-induced proinflammatory cytokine formation in macrophages by inducing TGF-: Therapeutic implications. J. Immunol. 2016, 196, 1146–1157. [Google Scholar] [CrossRef] [PubMed] [Green Version]
  53. Netea, M.G.; Simon, A.; De Veerdonk, F.V.; Kullberg, B.J.; Van der Meer, J.W.; Joosten, L.A. IL-1beta processing in host defense: Beyond the inflammasomes. PLoS Pathol. 2010, 6, e1000661. [Google Scholar] [CrossRef] [PubMed] [Green Version]
  54. Goetz, F.W.; Planas, J.V.; MacKenzie, S. Tumor necrosis factors. Dev. Compar. Immunol. 2004, 28, 487–497. [Google Scholar] [CrossRef] [PubMed]
  55. Falco, A.; Frost, P.; Miest, J.; Pionnier, N.; Irnazarow, I.; Hoole, D. Reduced inflammatory response to Aeromonas salmonicida infection in common carp (Cyprinus carpio L.) fed with β-glucan supplements. Fish Shellfish Immunol. 2012, 32, 1051–1057. [Google Scholar] [CrossRef] [PubMed]
  56. Sparkes, A.; De Baetselier, P.; Roelants, K.; Trez, C.D.; Magez, S.; Ginderachter, J.A.V.; Raes, G.; Bucala, R.; Stijlemans, B. The non-mammalian MIF superfamily. Immunobiology 2016, 222, 473–482. [Google Scholar] [CrossRef] [Green Version]
  57. Douxfils, J.; Fierro-Castro, C.; Mandiki, S.N.M.; Emile, W.; Tort, L.; Kestemont, P. Dietary β-glucans differentially modulate immune and stress-related gene expression in lymphoid organs from healthy and, Aeromonas hydrophila-infected rainbow trout (Oncorhynchus mykiss). Fish Shellfish Immunol. 2017, 63, 285–296. [Google Scholar] [CrossRef]
  58. Carlos, C.V.; Rodriguez, M.E.M.; Arizaga, G.G.C.; Jara, J.S.; Angulo, C.; Becerril, M.R. Immobilizing yeast β-glucan on zinc-layered hydroxide nanoparticle improves innate immune response in fish leukocytes. Fish Shellfish Immunol. 2018, 82, 504–513. [Google Scholar] [CrossRef]
  59. Metzler-Zebeli, B.U.; Ganzle, M.G.; Mosenthin, R.; Zijlstra, R.T. Oat β-glucan and dietary calcium and phosphorus differentially modify intestinal expression of proinflammatory cytokines and monocarboxylate transporter 1 and cecal morphology in weaned pigs. J. Nutr. 2012, 142, 668–674. [Google Scholar] [CrossRef] [Green Version]
  60. McLoughlin, R.F.; Berthon, B.S.; Jensen, M.E.; Baines, K.J.; Wood, L.G. Short-chain fatty acids, prebiotics, synbiotics, and systemic inflammation: A systematic review and meta-analysis. Am. J. Clin. Nutr. 2017, 106, 930–945. [Google Scholar] [CrossRef] [Green Version]
  61. Carballo, C.; Pinto, P.I.S.; Mateus, A.P.; Berbel, C.; Guerreiro, C.C.; Martinez-Blanch, J.F.; Codoner, F.M.; Mantecon, L.; Power, D.M.; Manchado, M. Yeast β-glucan and microalgal extracts modulate the immune response and gut microbiome in Senegalese sole (Solea senegalensis). Fish Shellfish Immunol. 2019, 92, 31–39. [Google Scholar] [CrossRef] [PubMed]
  62. Yang, G.; Xu, Z.J.; Tian, X.L.; Dong, S.L.; Peng, M. Intestinal microbiota and immune related genes in sea cucumber (Apostichopus japonicus) response to dietary β-glucan supplementation. Biochem. Bioph. Res. Co. 2015, 458, 98–103. [Google Scholar] [CrossRef] [PubMed]
  63. Siriyappagouder, P.; Galindo-Villegas, J.; Lokesh, J.; Mulero, V.; Fernandes, J.M.O.; Kiron, V. Exposure to yeast shapes the intestinal bacterial community assembly in zebrafish larvae. Front. Microbiol. 2018, 9, 1868. [Google Scholar] [CrossRef] [PubMed]
  64. Zhou, L.; Chen, C.Z.; Xie, J.; Xu, C.; Zhao, Q.; Jian, G.Q.I.N.; Chen, L.Q.; Li, E.C. Intestinal bacterial signatures of the “cotton shrimp-like” disease explain the change of growth performance and immune responses in Pacific white shrimp (Litopenaeus vannamei). Fish Shellfish Immunol. 2019, 92, 629–636. [Google Scholar] [CrossRef] [PubMed]
  65. Gatesoupe, F.J. Updating the importance of lactic acid bacteria in fish farming: Natural occurrence and pro-biotic treatments. J. Mol. Microb. Biotech. 2008, 14, 107–114. [Google Scholar] [CrossRef] [PubMed] [Green Version]
  66. Jaskari, J.; Kontula, P.; Siitonen, A.; Somer, H.J.; Sandholm, T.M.; Poutanen, K. Oat β-glucan and xylan hydrolysates as selective substrates for Bifidobacterium and Lactobacillus strains. App. Microbiol. Biotechnol. 1998, 49, 175–181. [Google Scholar] [CrossRef] [PubMed]
  67. Foysal, M.J.; Alam, M.; Kawser, A.Q.M.R.; Hasan, F.; Rahman, M.M.; Tay, C.Y.; Prodhan, M.S.H.; Gupta, S.K. Meta-omics technologies reveals beneficiary effects of Lactobacillus plantarum as dietary supplements on gut microbiota, immune response and disease resistance of Nile tilapia (Oreochromis niloticus). Aquaculture 2020, 520, 734974. [Google Scholar] [CrossRef]
  68. Johnson, D.B. Biodiversity and ecology of acidophilic microorganisms. FEMS Microbiol. Ecol. 1998, 27, 307–317. [Google Scholar] [CrossRef]
  69. Yang, X.Z.; Xu, M.J.; Huang, G.Y.; Zhang, C.; Pang, Y.Y.; Cheng, Y.X. Effect of dietary L-tryptophan on the survival, immune response and gut microbiota of the Chinese mitten crab, Eriocheir sinensis. Fish Shellfish Immunol. 2019, 84, 1007–1017. [Google Scholar] [CrossRef]
  70. Yu, L.; Rahman, S.U.; Huang, Y.Y.; Zhang, Y.F.; Ming, P.F.; Zhu, L.; Chu, X.Y.; Li, J.C.; Feng, S.B.; Wang, X.H.; et al. Green tea polyphenols decrease weight gain, ameliorate alteration of gut microbiota, and mitigate intestinal inflammation in canines with high-fat-diet-induced obesity. J. Nutr. Biochem. 2020, 78, 108324. [Google Scholar] [CrossRef]
  71. Tzelepis, G.; Karlsson, M. Killer toxin-like chitinases in filamentous fungi: Structure, regulation and potential roles in fungal biology. Fungal Biol. Rev. 2018, 33, 123–132. [Google Scholar] [CrossRef]
  72. Oh, M.; Zhang, T.; Seljelid, R.; Li, X. Treptomyces cerevisiae 1,3/1,6 beta-glucan prevents airway hyperreactivity and pulmonary inflammation in a murine asthma model. J. Allergy Clin. Immunol. 2007, 119, S6. [Google Scholar] [CrossRef]
  73. Zarantoniello, M.; Zimbelli, A.; Randazzo, B.; Compagni, M.D.; Truzzi, C.; Antonucci, M.; Riolo, P.; Loreto, N.; Osimani, A.; Milanović, V.; et al. Black Soldier Fly (Hermetia illucens) reared on roasted coffee by-product and Schizochytrium sp. as a sustainable terrestrial ingredient for aquafeeds production. Aquaculture 2019, 518, 734659. [Google Scholar] [CrossRef]
  74. Zheng, Y.; Wu, W.; Hu, G.D.; Qin, L.P.; Meng, S.L.; Song, C.; Fan, L.M.; Zhao, Z.X.; Bing, X.W.; Chen, J.Z. Gut microbiota analysis of juvenile genetically improved farmed tilapia (Oreochromis niloticus) by dietary supplementation of different resveratrol concentrations. Fish Shellfish Immunol. 2018, 77, 200–207. [Google Scholar] [CrossRef] [PubMed]
  75. Almeidaa, A.R.; Alvesb, M.; Dominguesa, I.; Henriques, I. The impact of antibiotic exposure in water and zebrafish gut microbiomes: A 16S rRNA gene-based metagenomic analysis. Ecotox. Environ. Safe. 2019, 186, 109771. [Google Scholar] [CrossRef] [PubMed]
  76. Ye, J.Z.; Lv, L.X.; Wu, W.R.; Li, Y.T.; Shi, D.; Fang, D.Q.; Guo, F.F.; Jiang, H.Y.; Yan, R.; Ye, W.C.; et al. Butyrate protects mice against methionine-choline-deficient diet-induced nonalcoholic steatohepatitis by improving gut barrier function, attenuating inflammation and reducing endotoxin levels. Front. Microbiol. 2018, 9, 1967. [Google Scholar] [CrossRef] [Green Version]
  77. Geraylou, Z.; Souffreau, C.; Rurangwa, E.; Maes, G.E.; Spanier, K.I.; Courtin, C.M.; Delcour, J.A.; Buyse, J.; Ollevier, F. Prebiotic effects of arabinoxylan oligosaccharides on juvenile Siberian sturgeon (Acipenser baerii) with emphasis on the modulation of the gut microbiota using 454 pyrosequencing. FEMS Microbiol. Ecol. 2013, 86, 357–371. [Google Scholar] [CrossRef] [Green Version]
  78. Coyte, K.Z.; Schluter, J.; Foster, K.R. The ecology of the microbiome: Networks, competition, and stability. Science 2015, 350, 663. [Google Scholar] [CrossRef]
  79. Zhou, J.; Deng, Y.; Luo, F.; He, Z.; Yang, Y. Phylogenetic molecular ecological network of soil microbial communities in response to elevated CO2. MBio 2011, 2, e00122–11. [Google Scholar] [CrossRef] [Green Version]
  80. Deng, Y.; Jiang, Y.; Yang, Y.; He, Z.; Luo, F.; Zhou, J. Molecular ecological network analyses. BMC Bioinform. 2012, 13, 113. [Google Scholar] [CrossRef] [Green Version]
  81. Pande, S.; Kaftan, F.; Lang, S.; Svatoš, A.; Germerodt, S.; Kost, C. Privatization of cooperative benefits stabilizes mutualistic cross-feeding interactions in spatially structured environments. ISME J. 2016, 10, 1413. [Google Scholar] [CrossRef] [PubMed]
Figure 1. Effects of β-glucan supplementation on hematology in O. niloticus in freshwater and brackish water. Values are represented as mean ± SE. A single asterisk (*) indicates a significant difference (p < 0.05), and two asterisks (**) indicate an extremely-significant difference (p < 0.01). (A) red blood cell count (RBC); (B) hematocrit (HCT); (C) red cell distribution width (RDW); (D) white blood cell count (WBC); (E) platelet count (PLT); and (F) plateletcrit (PCT). Different letters with a–c indicated significant differences among three treatments in 16 salinity water (p < 0.05).
Animals 10 02243 g001
Figure 2. The gene expression of TNF-α (A), TGF-β1 (B), MIF-2 (C), and IL-1β (D) in the spleen of O. niloticus fed diets with β-glucan in freshwater and brackish water. A single asterisk (*) indicates a significant difference (p < 0.05) and two asterisks (**) indicate an extremely-significant difference (p < 0.01). Different letters with a–c indicated significant differences among three treatments in 16 salinity water (p < 0.05).
Animals 10 02243 g002
Figure 3. The gene expression of TNF-α (A), TGF-β1 (B), MIF-2 (C), and IL-1β (D) in the intestine of O. niloticus fed diets with β-glucan in freshwater and brackish water. A single asterisk (*) indicates a significant difference (p < 0.05), and two asterisks (**) indicate an extremely significant difference (p < 0.01). Different letters with a,b indicated significant differences among three treatments in 16 salinity water (p < 0.05).
Animals 10 02243 g003
Figure 4. The gene expression of TNF-α (A) and IL-1β (B) in the head kidney of O. niloticus fed diets with β-glucan in freshwater and brackish water. A single asterisk (*) indicates a significant difference (p < 0.05), and two asterisks (**) indicate an extremely-significant difference (p < 0.01). Different letters with a–c indicated significant differences among three treatments in 16 salinity water (p < 0.05).
Animals 10 02243 g004
Figure 5. Cladogram (top 20), Venn diagram, and partial least squares discrimination analysis (PLS-DA) diagram of the intestinal microbiota in O. niloticus fed diets with β-glucan in freshwater and brackish water. (A) Cladogram of the intestinal microbiota displaying the top 20 components as inferred by GraPhlAn. Node size is proportional to the average abundance. Color indicates the relative concentration of the clusters. (B) Venn diagram showing the distribution of all OTUs shared and unique in O. niloticus reared in different environmental salinity conditions and fed diets with or without β-glucan (0, 0.2%, and 0.4%). The percentage indicates the ratio of correlated OTUs in the total sequences of each treatment. A: 16 psu, B: 16 psu + 0.2% β-glucan, C: 16 psu + 0.4% β-glucan, D: freshwater. (C) PLS-DA discriminant analysis of intestinal microorganisms in O. niloticus under different environmental salinity conditions and fed diets with or without β-glucan (0, 0.2%, and 0.4%). Each dot represents a sample, the points with the same color belong to the same group, and the marked points of groups are marked with ellipses. If the samples belonging to the same treatment are closer to each other, and the distance between the different treatment points is farther, the classification model will be more reliable.
Animals 10 02243 g005
Figure 6. Heatmap analysis of 37 OTUs. The left heatmap includes the color bar of each OTU average value of three samples in each treatment. The right heatmap includes the color bars representing the difference of OTU in O. niloticus between two treatments. The pink bar suggests that the abundance of OTUs is higher and the blue bar suggests that the abundance of OTUs is lower. A single asterisk (*) indicates a significant difference (p < 0.05), and two asterisks (**) indicate an extremely-significant difference (p < 0.01). The taxonomy of the OTUs (genus, family, and phylum) is depicted on the figure’s right. FW denotes freshwater; BW denotes brackish water; BW 0.2 and BW 0.4 denote brackish water with 0.2% and 0.4% β-glucan, respectively.
Animals 10 02243 g006
Figure 7. Interspecies interaction network of the intestinal microbiota for O. niloticus among four treatments. Each node represents a bacterial OTU. Node colors indicate OTUs affiliated with different major classes. The green edge indicates negative interaction, and the red edge indicates positive interaction between two individual nodes. (A1,A2,A3): freshwater; (B1,B2,B3): 16 psu; (C1,C2,C3): 16 psu + 0.2% β-glucan; and (D1,D2,D3): 16 psu + 0.4% β-glucan.
Animals 10 02243 g007
Table 1. Ingredient formulation (g/kg dry basis) of three experimental diets fed to Oreochromis niloticus.
Ingredientsβ-glucan Contents (%)
00.200.40
Fish meal80.0080.0080.00
Soybean meal450.00450.00450.00
Maize meal250.00250.00250.00
Wheat middlings74.0074.0074.00
Maize oil36.0036.0036.00
Dicalcium10.0010.0010.00
Vitamin premix a5.005.005.00
Mineral premix b5.005.005.00
Cellulose60.0057.7355.46
Carboxymethyl cellulose30.0030.0030.00
β-glucan c0.002.274.54
Total1000.001000.001000.00
a Vitamin premix (mg/kg): vitamin A (500,000 IU/g), 8 mg; vitamin D3 (1,000,000 IU/g), 2 mg; vitamin K, 10 mg; vitamin E, 200 mg; thiamine, 10 mg; riboflavin, 12 mg; pyridoxine, 10 mg; calcium pantothenate, 32 mg; nicotinic acid, 80 mg; folic acid, 2 mg; vitamin B12, 0.01 mg; biotin, 0.2 mg; choline chloride, 400 mg; vitamin C-2- polyphosphate (150 mg/g vitamin C activity), 400 mg. b Mineral premix (mg/kg): zinc (ZnSO4·7H2O), 50.0 mg; iron (FeSO4·7H2O), 40 mg; manganese (MnSO4·7H2O), 15.3 mg; copper (CuCl2), 3.8 mg; iodine (KI), 5 mg; cobalt (CoCl2·6H2O), 0.05 mg; selenium (Na2SeO3), 0.09 mg. c β-glucan in this study was extracted from yeast cell walls and purchased from Swiss ABAC. Research and Development Co., Ltd (Barden, Swiss).
Table 2. Primers designed in the qPCR.
Gene5′-3′ Primer SequenceGenBank Accession No.
IL-1βF: GAGCACAGAATTCCAGGATGAAAGXM_019365841.1
R: TGAACTGAGGTGGTCCAGCTGT
MIF-2F: AGCAGAAGCAGGAAGGCGAAGAXM_003444573.4
R: CGGTACATCACCTCTGGCAACATT
TGF-β1F: AAGAGGAGGAGGAATACTTTGCCAXM_003459454
R: GAAGCTCATTGAGATGACTTTGGG
TNF-αF: CAGAAGCACTAAAGGCGAAGAACANM_001279533
R: TTCTAGATGGATGGCTGCCTTG
EF-1αF: ATCAAGAAGATCGGCTACAACCCTXM_005469373.3
R: ATCCCTTGAACCAGCTCATCTTGT
IL-1β, interleukin-1β; MIF-2, migration inhibitory factor-2; TGF-β1, transforming growth factor-β1; TNF-α, tumor necrosis factor-α; EF-1α, elongation factor-1α.
Table 3. Growth performance, survival, and relative spleen weight of Oreochromis niloticus fed diets with different β-glucan percentages under two salinities for 8 weeks.
ItemsFreshwaterBrackish Water (16 psu)-β-glucan (%)
00.20.4
Initial weight1.27 ± 0.011.28 ± 0.011.28 ± 0.011.27 ± 0.01
Final weight38.03 ± 2.8641.50 ± 1.5338.67 ± 2.2938.40 ± 2.70
Weight gain (%)2974.75 ± 226.023235.35 ± 109.633025.67 ± 172.763008.85 ± 206.30
Relative spleen weight (%)0.29 ± 0.01 b0.37 ± 0.03 c0.24 ± 0.09 a0.23 ± 0.02 a
Survival (%)100100100100
Values of initial weight and final weight are means of three measurements. Values of relative spleen weight are means of 15. Different superscript letters indicate significant differences within the same row (c indicated the highest value) (p < 0.05).
Table 4. Summary of diversity index (Shannon and Simpson) and estimated OTU richness (Chao 1 and ACE) for intestinal bacterial diversity analysis of Oreochromis niloticus fed diets with different β-glucan percentages under two salinities for 8 weeks.
ItemsFreshwaterBrackish Water (16 psu)-β-glucan (%)
00.20.4
Richness estimate
Chao 1 782.01 ± 138.12 ab939.67 ± 63.50 b758.00 ± 125.74 ab564.00 ± 16.07 a
ACE782.30 ± 138.15 ab939.67 ± 63.57 b758.11 ± 16.06 ab564.11 ± 16.06 a
Diversity estimators
Shannon6.10 ± 0.13 ab7.02 ± 0.40 b6.01 ± 0.71 ab5.46 ± 0.11 a
Simpson0.94 ± 0.01 ab0.97 ± 0.01 b0.94 ± 0.02 ab0.93 ± 0.01 a
All data are represented as mean ± S.E. (n = 3). Different superscript letters indicate significant differences within the same row (b indicates the higher value) (p < 0.05).
Table 5. Topological properties of the intestinal microbiota co-occurrence network.
ItemsFreshwater16 psu16 psu + 0.2% β-glucan16 psu + 0.4% β-glucan
Node50505050
Edge402406450518
Average degree16.0816.241820.72
Diameter1111
Graph density0.3280.3310.3670.423
Centralization0.0410.0800.1280.155
Heterogeneity0.1530.1980.3470.426
Average clustering Coefficient1111
Average path length1111
Positive/negative association (%)53.23/46.7764.53/35.4776/2455.02/44.98
Publisher’s Note: MDPI stays neutral with regard to jurisdictional claims in published maps and institutional affiliations.

