Article

Effects of Dietary Andrographolide Levels on Growth Performance, Antioxidant Capacity, Intestinal Immune Function and Microbioma of Rice Field Eel (Monopterus Albus)

1
Hunan Engineering Research Center for Utilization of Characteristics of Aquatic Resources, Hunan Agricultural University, Changsha 410128, China
2
Hunan Key Laboratory of Traditional Chinese Veterinary Medicine, Hunan Agricultural University, Changsha 410128, China
*
Author to whom correspondence should be addressed.
These two authors contributed to this work equally.
Animals 2020, 10(10), 1744; https://doi.org/10.3390/ani10101744
Submission received: 22 August 2020 / Revised: 22 September 2020 / Accepted: 23 September 2020 / Published: 25 September 2020

Abstract

:

Simple Summary

This study investigated the effects of dietary andrographolide on the growth performance, antioxidant capacity, intestinal immune function and microbioma of rice field eel. This study indicated that the diets supplemented with low-dose andrographolide (75 and 150 mg/kg) significantly improved growth performance, enhanced antioxidant capacity and regulated the intestinal physical barrier and microbiota of M. albus. In addition, dietary supplementation of andrographolide upregulated of anti-inflammatory cytokines and downregulated of proinflammatory cytokines. The anti-inflammatory function of andrographolide may be related to the suppression of the toll-like receptor signaling pathway. These results can provide the valuable data for future rice field eel feeds.

Abstract

An eight-week feeding trial was conducted to investigate the effects of dietary andrographolide on the growth performance, antioxidant capacity in the liver, intestinal inflammatory response and microbiota of Monopterus albus. A total of 900 health fish (25.00 ± 0.15 g) were randomly divided into five groups: AD1 (the basal diet) as the control, and AD2, AD3, AD4 and AD5 groups, which were fed the basal diet supplemented with 75, 150, 225 and 300 mg/kg andrographolide, respectively. The results showed that compared with the control group, dietary andrographolide supplementation (1) significantly increased trypsin and lipase activities in the intestine, and increased the weight gain rate but not significantly; (2) significantly increased the levels of glutathione reductase (GR), glutathione (GSH) and glutathione peroxidase (GPx) and the content of in the liver; significantly decreased the contents of reactive oxygen species (ROS) and malondialdehyde (MDA); remarkably upregulated the Nrf2, SOD1, GSTK and GSTO mRNA levels in the liver; downregulated the Keap1 mRNA level; (3) significantly increased the villi length and goblet cell numbers in the intestine, remarkably upregulated the Occludin mRNA level in the intestine, downregulated the Claudin-15 mRNA level; (4) remarkably upregulated the IL-10, TGF-β1 and TGF-β3 mRNA levels in the intestine; downregulated the IL-12β and TLR-3 mRNA levels; (5) significantly decreased the richness and diversity of the intestinal microbioma, increased the percentages of Fusobacteria and Firmicutes and significantly decreased the percentages of Cyanobacteria and Proteobacteria. In conclusion, these results showed that dietary low-dose andrographolide (75 and 150 mg/kg) promoted growth and antioxidant capacity, regulated the intestinal microbioma, enhanced intestinal physical and immune barrier function in rice field eel.

1. Introduction

With the rapid expansion of the scale of aquaculture and the increasing degree of intensification as well as the inappropriate use of feed ingredients, the immunity and intestinal health of fish are being adversely affected [1]. In the past, to prevent and control the aquatic animal diseases, antibiotics were commonly used in aquatic feed. However, due to drug resistance, drug residues and water pollution, their applications have been restricted [2]. In addition, The European Union began to restrict the use of feedstock antibiotics in 2006, and China has strengthened the management and application of antibiotics in recent years. Therefore, there is an urgent need to search for alternative strategies to increase disease resistance for the development of antibiotic-free, sustainable aquaculture [3,4].
In recent years, effective components derived from plants and herbs have often been considered as an alternative eco-friendly feed additive strategy in aquaculture [5]. Many studies have revealed their beneficial effects in terms of promoting the growth, immunity and disease resistance of economic fish, such as Mucuna pruriens and Withania somnifera in rohu (Labeo rohita) [6,7], sanguinarine (Macleaya cordata) in koi carp (Cryprinus carpiod) [8], astragalus polysaccharide (Astragalus) in pacific white shrimp (Litopenaeus vannamei) [9], aloe vera in pacu (Piaractus mesopotamicus) [10] and katuk (Sauropus androgynus L. Merr.) in namilton (Epinephelus coioides) [11]. Andrographolide, a diterpenoid, is the main active ingredient of Andrographis paniculata, and its structural formula is C20H30O5 [12,13]. It is mainly concentrated in the leaves and can be easily separated from crude plant extracts [14]. A large amount of evidence has shown that andrographolide exhibits a wide range of biological activities such as anti-inflammatory [15,16], antibacterial [17], anticancer [18], antioxidant [15], antipathogenic microorganism [19], anticardiovascular disease [20] and liver- and gallbladder-protective properties [21]. In aquatic animals, the beneficial effects of dietary andrographolide have only been verified in Labeo rohita fingerlings [22].
Rice field eel (Monopterus albus) is an important freshwater breeding species in China, and its production is currently estimated to be close to 320,000 tons, with a value of 20 billion yuan in 2019 [23]. Due to the deterioration of the breeding environment and the deterioration of feed quality, the immunity of rice field eel is reduced [24,25]. Toll-like Receptors (TLRs) are a kind of important receptor of pathogen recognition molecules, and are bridges of innate and acquired immunity of the body [26]. Studies have shown that the TLR signaling pathway is involved in intestinal inflammation [27]. In addition, the intestinal microbioma has made significant contributions to the health of their hosts. Studies have shown that the intestinal microbioma has important relationships with metabolic activities, feed conversion, immunity and disease resistance [28]. However, the effect of dietary andrographolide on rice field eel has not been reported. Therefore, the overall objective of this study was to evaluate the effects of dietary andrographolide on growth performance, antioxidant response in the liver, intestinal microbioma and intestinal immune function in rice field eel. The findings of this study will provide a clue for the application of andrographolide in aquatic animals feed.

2. Materials and Methods

2.1. Preparation of Experimental Diets and Experimental Design

In this experiment, the basal diet was formulated to contain 43.16% crude protein and 5.16% crude lipid. The protein and lipid sources were the same as our previous study [29]. Five experimental diets were supplemented with andrographolide (Hunan Jiaruisi Biological Technology Co., Ltd. Changsha, China) at the graded levels of 0 (control, AD1), 75 (AD2), 150 (AD3), 225 (AD4) and 300 mg/kg (AD5) (Table 1). The purity of andrographolide was greater than 98% according to area normalization of high-performance liquid chromatography. The main chromatographic conditions included: Column: shim-pack CLC-ODS (150 mm × 6 mm, 5 μm); mobile phase: methanol-water (60:40); flow rate: 1.0 mL/min; column temperature: 40 °C; detection wave length: 254 nm. Andrographolide was added to the feed in the form of powder. The processing, storage and feeding of the feed stuffs were the same as our previous study [29]. M. albus were reared in floating net cages (1.5 × 2 × 1.5 m). The cages were made up of polyamides with a mesh size of 0.25 mm. The water exchange rate of pond is about 15–20 m3/h.
Source and acclimation of M. albus fingerlings were referred to in our previous reports [29,30]. After the acclimation period, health fingerlings (25.00 ± 0.15 g) were randomly distributed into 15 floating cages, with each cage containing 60 fish per replicate. Each group (in triplicate) was fed one of the diets with different levels of andrographolide, as follows: control, AD1 (without andrographolide); AD2 (75 mg/kg); AD3 (150 mg/kg); AD4 (225 mg/kg); and AD5 (300 mg/kg), for a period of 56 days. The fish were fed at a rate of 3–5% of body weight once a day at 17:00–18:00. We usually adjusted the feed amount every five days according to the fish growth. We generally adjusted the feed amount every five days, and estimate the weight gain every five days according to the feed conversion rate of 1.5. The water temperature (28.3 ± 2.6 °C), pH (7.2 ± 0.5), dissolved oxygen (6.5 ± 0.3 mg/L), ammonia nitrogen (0.46 ± 0.03 mg/L) and natural light were kept stable during the experimental period.

2.2. Sample Collection

All experiments were performed in accordance with the European Union regulations concerning the protection of experimental animals. Pretreatment, anaesthesia and anatomy of the experimental M. albus before sampling and the methods of sample collection were referred to in our previous report [29]. The middle intestines from three M. albus were removed and immersed in 4% paraformaldehyde to make intestinal slices. At the same time, the posterior intestine and liver from three M. albus were pooled into 1.5 mL tubes and then stored at −20 °C for further analysis. The intestinal contents of the posterior intestines of six fish from each cage were collected, and the samples from three fish were mixed together and stored at −80 °C until further analysis. The posterior intestine and liver of three fish from each cage were collected and mixed together in 1.5 mL RNase-free tubes, respectively, immediately stored in liquid nitrogen and then transferred to −80 °C refrigerator for about a week for sample homogenization to isolate RNA.

2.3. Determination of Growth Parameters

The survival rate (SR), weight gain rate (WGR), feed conversion ratio (FCR), condition factor (CF), hepatosomatic index (HSI) and viserosomatic index (VSI) were calculated according to our previous report [24].
Survival rate (SR, %) = Nf/Ni × 100
Weight gain rate (WGR, %) = (Wt − Wo)/Wo × 100
Feed conversion rate (FCR) = total amount of the feed consumed (g)/(Wt − Wo)
Condition factor (CF, g/cm3) = Wt × 100/(body length)3
Hepatosomatic index (HSI, %) = liver weight (g)/Wt × 100
Viserosomatic index (VSI, %) = visceral weight (g)/Wt × 100
where Nf and Ni are the final and initial numbers of fish, respectively; and Wt (g) and Wo (g) are the final and initial fish weights, respectively.

2.4. Measurement of Digestive Enzyme Activities and Liver Antioxidant Parameters

Posterior intestine and liver samples were rinsed with 0.70% physiological saline and then homogenized on ice with 9 volumes (v/w) of cold physiological saline. Then centrifuge at 3500×g for 10 min at 4 °C to collect the supernatant and analyze the following parameters. The total protein content was determined by bisindoleacetic acid (BCA) method. The activities of trypsin, lipase and amylase in the posterior intestine were determined by a commercial kit (Nanjing Jiancheng Bioengineering Institute, Nanjing, China) [29]. The trypsin activity was spectrophotometrically determined with arginine ethyl ester as a substrate determined at 253 nm. The lipase activity was enzyme colorimetry measured at 580 nm. The amylase activity was Iodine-starch colorimetry measured at 660 nm.
Reactive oxygen species (ROS) levels were measured by using the enzyme-linked immunosorbent assay (ELISA) kit. An ROS ELISA kit was purchased from ZciBio Technology Co., Ltd., Shanghai, China. Determination principle: The purified ROS capture antibody was coated with a microporous plate to make a solid phase antibody. Samples were successively added to the coated micropores, and then combined with HRP-labeled detection antibodies to form an antibody–antigen–enzyme-labeled antibody complex. After thorough washing, substrate 3,3,5,5-TetraMethyl benzidine (TMB) was added for color development. TMB was converted to blue under the catalysis of HRP enzyme, and finally to yellow under the action of acid. The absorbance was measured with an enzyme marker at the wavelength of 450 nm [31]. The ROS level was calculated according to the measured standard curve. Glutathione (GSH) and malondialdehyde (MDA) contents and activities of glutathione S-transferase (GST), glutathione reductase (GR), superoxide dismutase (SOD), catalase (CAT) and glutathione peroxidase (GPx) in liver were assayed by using a commercial kit (Nanjing Jiancheng Bioengineering Institute, Nanjing, China). The GSH was reacted with dithionitrobenzoic acid, and the GSH content was quantitatively determined by a colorimetric method at 405 nm. The SOD activity was water soluble tetrazolium (WST-1) measured at 450 nm. The GST and GPx activities were spectrophotometrically measured at 412 nm. Additionally, the GR, CAT activities and MDA content were spectrophotometrically measured at 340, 405 and 532 nm, respectively.

2.5. Intestinal Histological Structure

The samples were immediately fixed in paraformaldehyde solution, and slides were prepared by subjecting the samples to washing, dehydration using different grades of alcohol, clearing with xylene and embedding in paraffin wax. The wax blocks were sectioned to a thickness of five microns and stained with haematoxylin and eosin (H&E). Villus length, muscular thickness and goblet cell numbers were measured according to Ramos et al. [32].

2.6. Reverse Transcription Real-Time Fluorescent Quantitative Polymerase Chain Reaction (RT-qPCR) Analysis

Total RNA from the posterior intestine and liver was extracted using TRIzol reagent (Invitrogen, Carlsbad, CA, USA) following the manufacturer’s protocol. A 30–50 mg sample was added to 1 mL TRIzol for homogenization (6000 rpm, 30 s), followed by 0.2 mL chloroform, which was violently oscillated for 15 s, and centrifuged at 12,000 rpm at 4 °C for 15 min. The upper layer of 500 μL colorless aqueous phase was absorbed, isopropyl alcohol was added in the same volume, and centrifuged at 12,000 rpm at 4 °C for 10 min. Wash with 75% ethanol and centrifuge at 12,000 rpm at 4 °C for 3 min. The supernatant was then removed and dried. RNA was dissolved in 50 μL enzyme-free water. The RNA samples were analyzed by 1.5% agarose electrophoresis and quantitated at 260 nm with a NanoDrop ND-2000 UV-Visible Spectrophotometer. All OD260/OD280 values were between 1.8 and 2.0 [33]. First strand cDNA was synthesized from 1 µg total RNA using Reverse Transcriptase MMLV Kit (Takara, Dalian, China) following the manufacturer’s protocol. The first-strand cDNA was stored at −80 °C. The RT-qPCR was carried out with a Bio-Rad CFX96 system (USA) with SYBR Premix Ex TaqⅡ (TaKaRa, Dalian, China). The total 25 μL volume of the PCR reaction was composed of 12.5 μL SYBR Premix Ex TaqⅡ (2×), 1 μL forward primer, 1 μL reverse primer, 2 μL cDNA and 8.5 μL sterile double-distilled water [34]. The program was 95 °C for 30 s followed by 35 cycles of 95 °C for 5 s, 58 °C for 15 s and 72 °C for 20 s. Melting curve analysis of PCR products was performed at the end of each PCR reaction to confirm the specificity. The mRNA primer sequences are listed in Table 2, and RPL-17 was selected as a reference gene. Expression was calculated using the Ct (2 −ΔΔCt) method [35,36,37].

2.7. Intestinal Microbiology

According to the growth performance, the AD1, AD2, AD3 and AD5 groups were selected for intestinal microbioma analysis. High-throughput sequencing was performed using the Illumina MiSeq platform, with the amplification of the 16S rRNA V3-V4 region. All sequences were classified into operational taxonomic units (OTUs), selected at a 97% similarity level using QIIME (version 2.0, http://qiime.org/index.html) after the removal of low-quality scores (Q score, 20) with a FASTX-Toolkit (Hannon Lab, NY, USA) [38]. Six indices (the observed species, Chao1, Shannon, PD whole tree, ACE and Good‘s coverage indices) that were used to analyze the complexity of species diversity in a sample were calculated using QIIME (Version 2.0, http://qiime.org/index.html) and displayed with R software (Version 2.15.3) [39]. Beta diversity analysis was performed to investigate the structural variation of the microbial communities across samples using UniFrac distance metrics [40], and the principal coordinates analysis (PCoA) was also performed using QIIME (version 2.0, http://qiime.org/index.html). Differences in the UniFrac distances for pairwise comparisons between groups were determined using a Student’s t-test and the Monte Carlo permutation test with 1000 permutations [29]. The results were visualized in box-and-whisker plots. Taxon abundance at the phylum and genus levels were statistically compared between groups using the Metastats program.

2.8. Statistical Analysis

All statistical analyses were performed using SPSS 24.0 (SPSS Inc., Michigan Avenue, Chicago, IL, USA). Growth performance, enzyme activities, intestinal morphology and mRNA levels were carried out using nonparametric tests. The nonparametric Kruskal–Wallis rank sum test and posthoc pairwise comparisons using the Mann–Whitney U test (p-values were adjusted using the Benjamini–Hochberg correction) were performed. A significance level of p < 0.05 was chosen.
Alpha-diversity indices (observed species, Chao1, Shannon, PD whole tree, ACE and Good‘s coverage) were checked for normality and homogeneity of variance by Shapiro–Wilk and Levene tests, respectively. These data were compared by one-way analysis of variance (ANOVA), and differences between the means were tested by Duncan’s multiple-range test. All results are reported as the “mean ± S.E.”, and differences were considered significant at p < 0.05 [41]. In addition, the overall difference in the bacterial community was evaluated by analysis of similarity (ANOSIM) [42].

3. Results

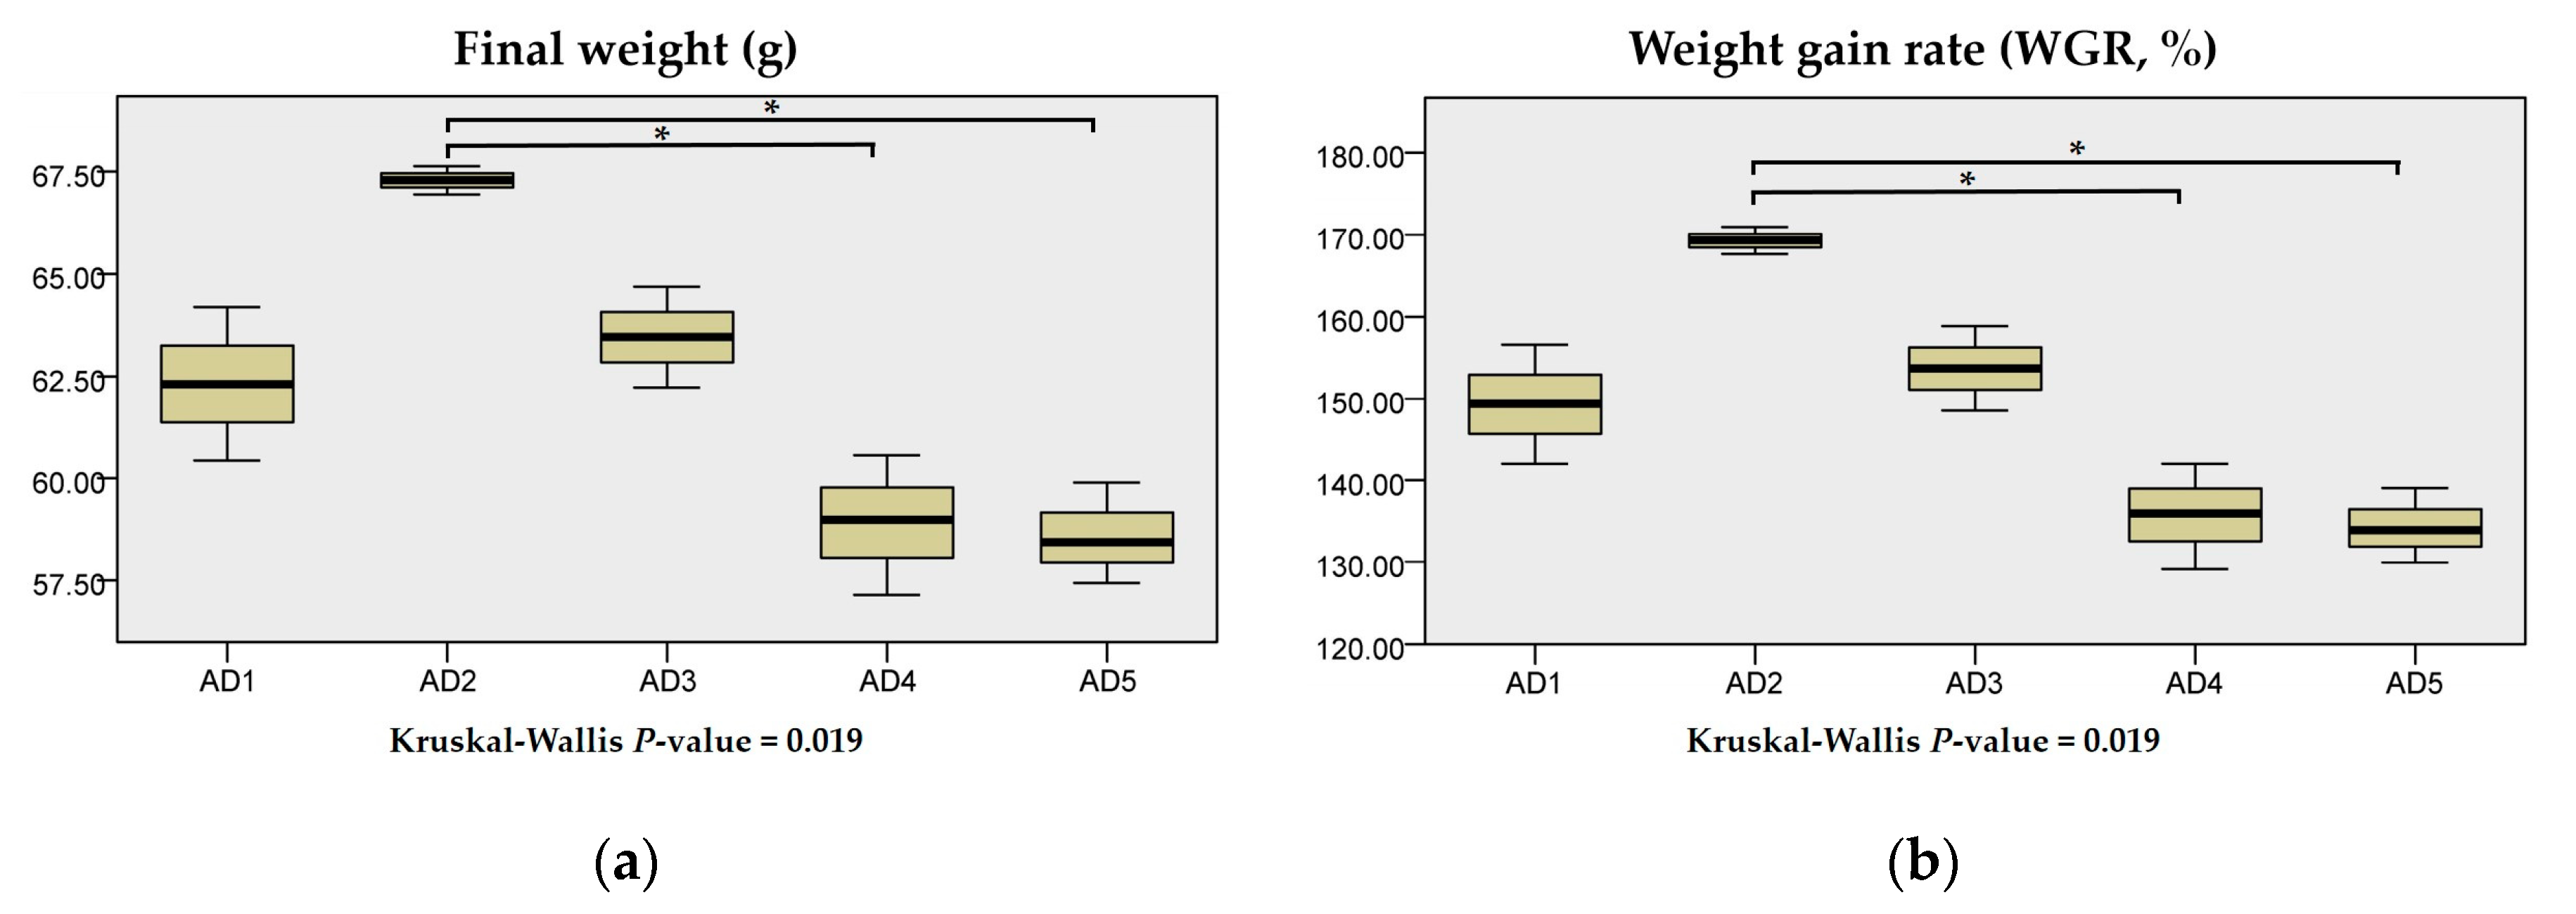
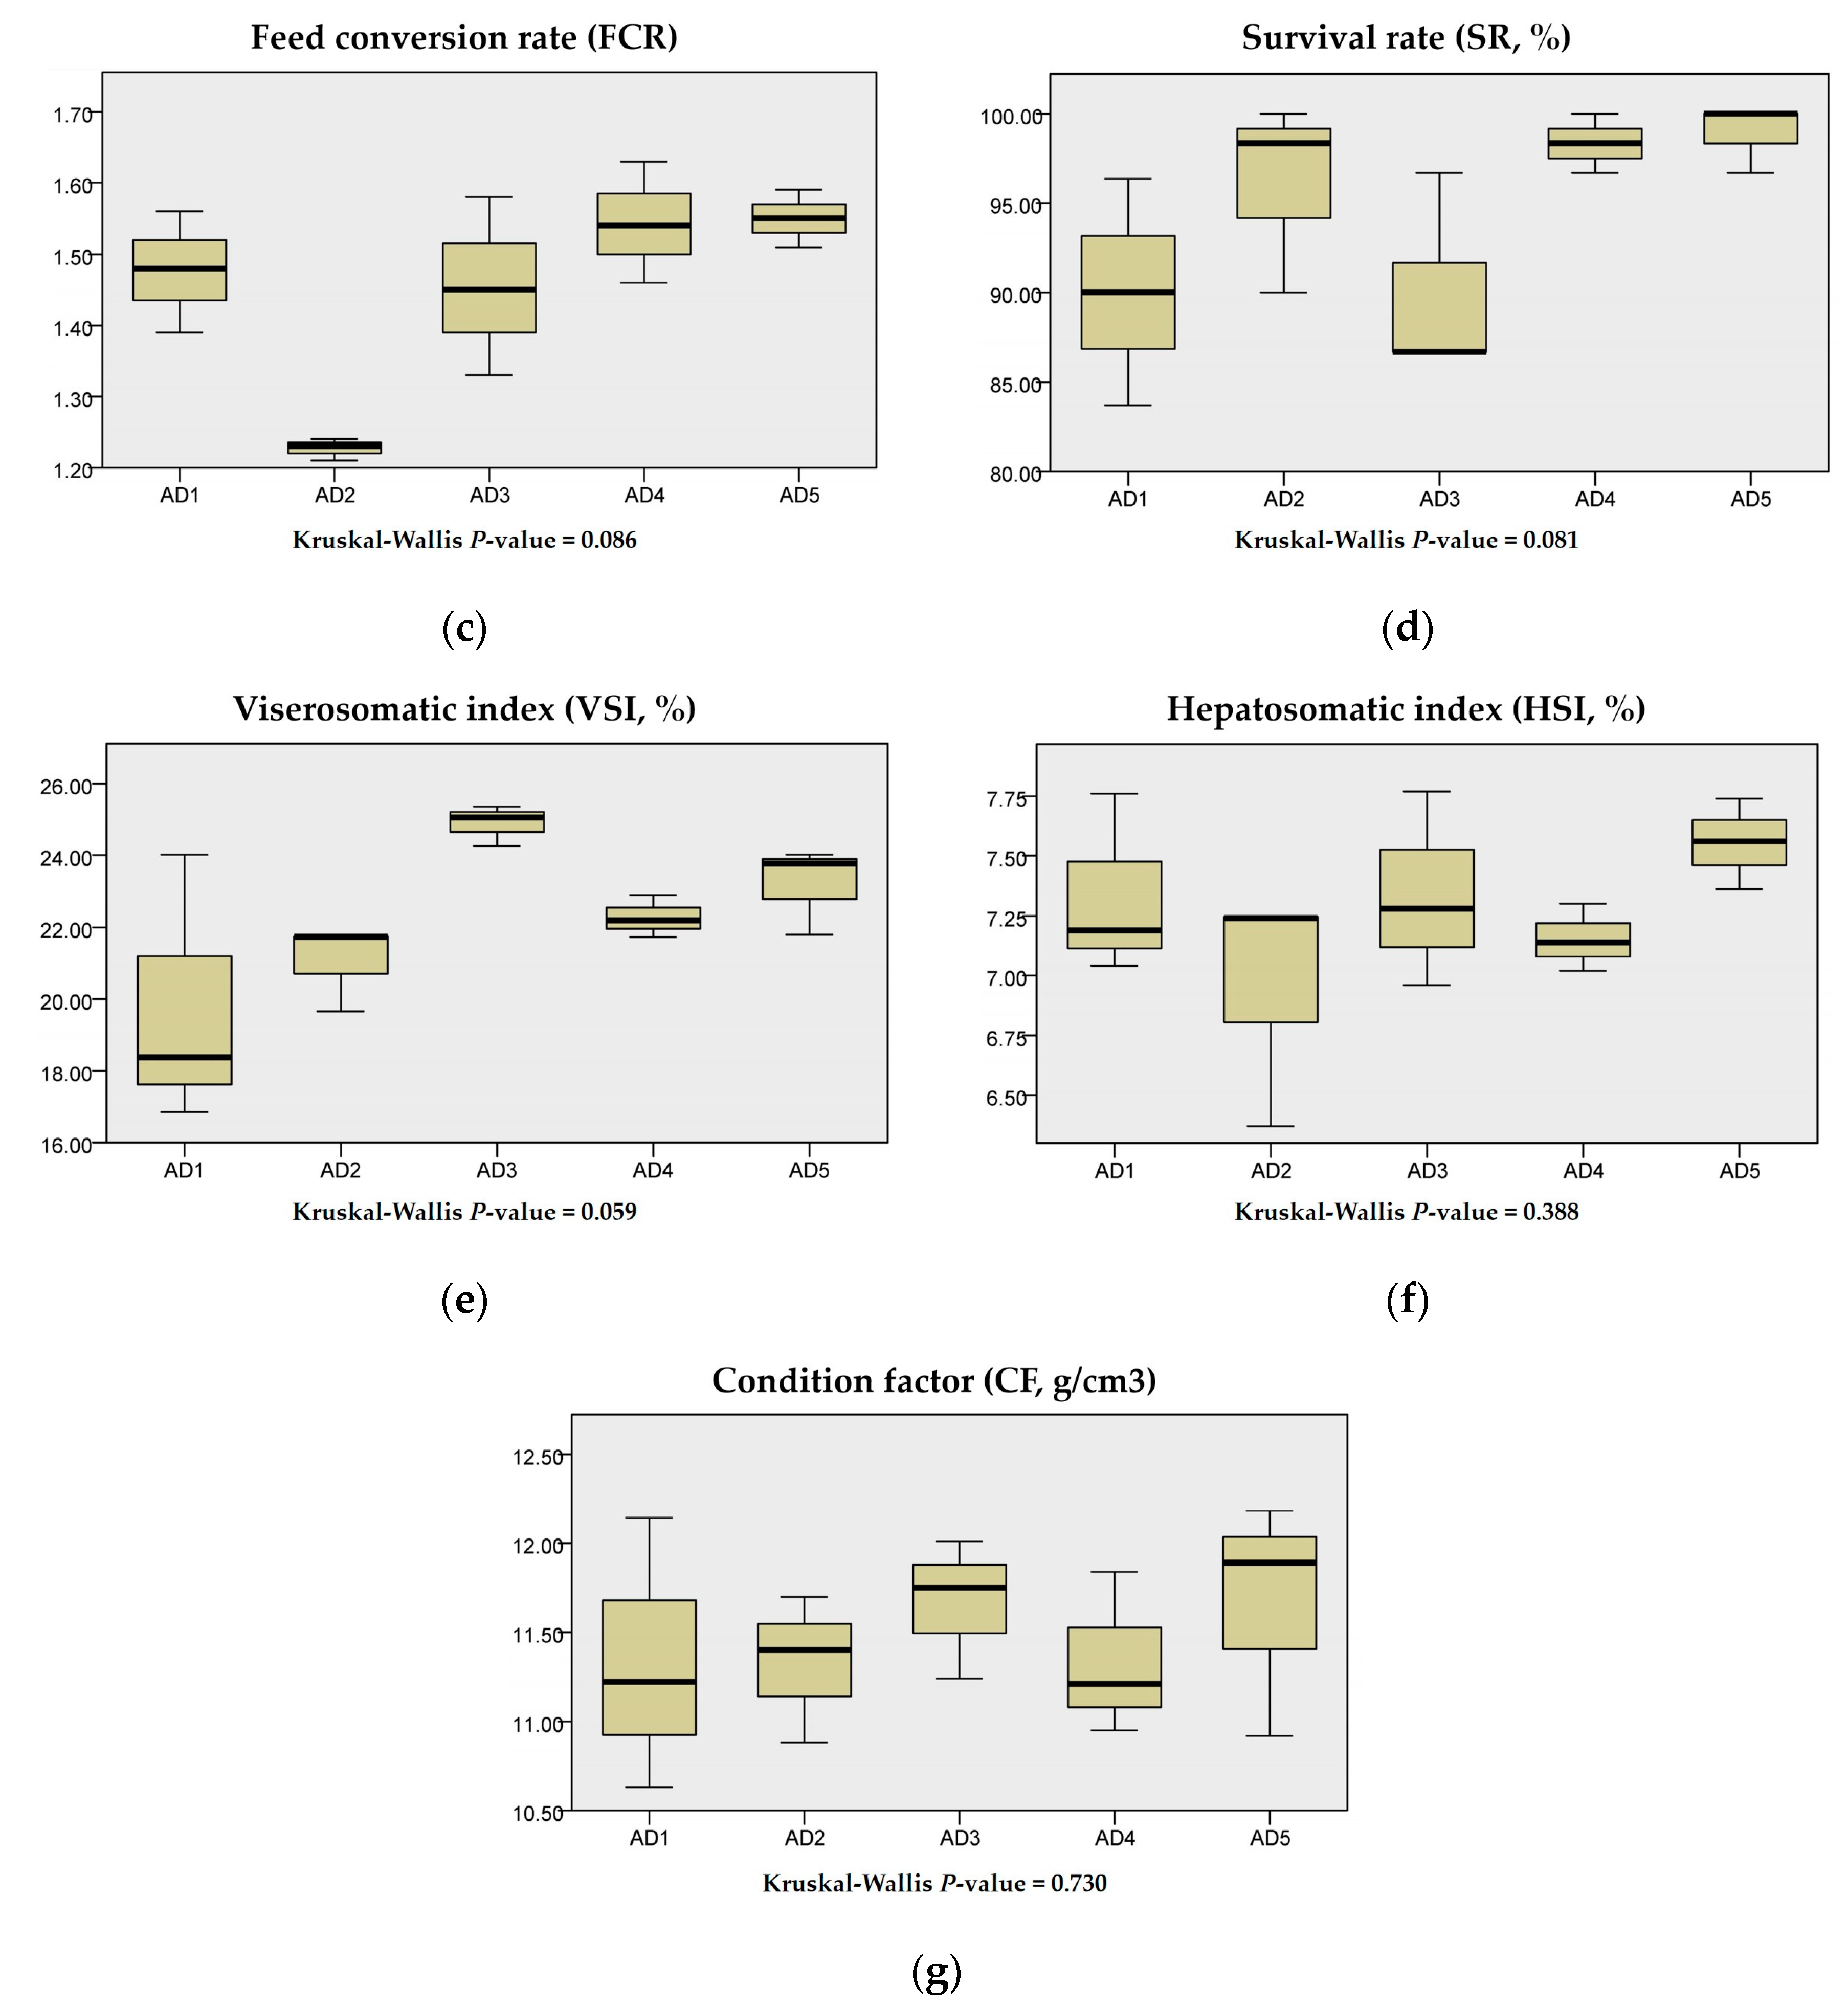
3.1. Growth Performance

FCR, SR, HIS, VSI and CF showed no significant differences between the treatments (p > 0.05) (Figure 1). The final weight and WGR were higher in the AD2 group than those in the AD1 group but not significant (p > 0.05). The final weight and WGR in the AD2 group were significantly higher than those in the AD4 and AD5 groups (p < 0.05). FCR in the AD2 group was decreased compared to those of other groups (AD1, AD3, AD4 and AD5) but not significant (p > 0.05).

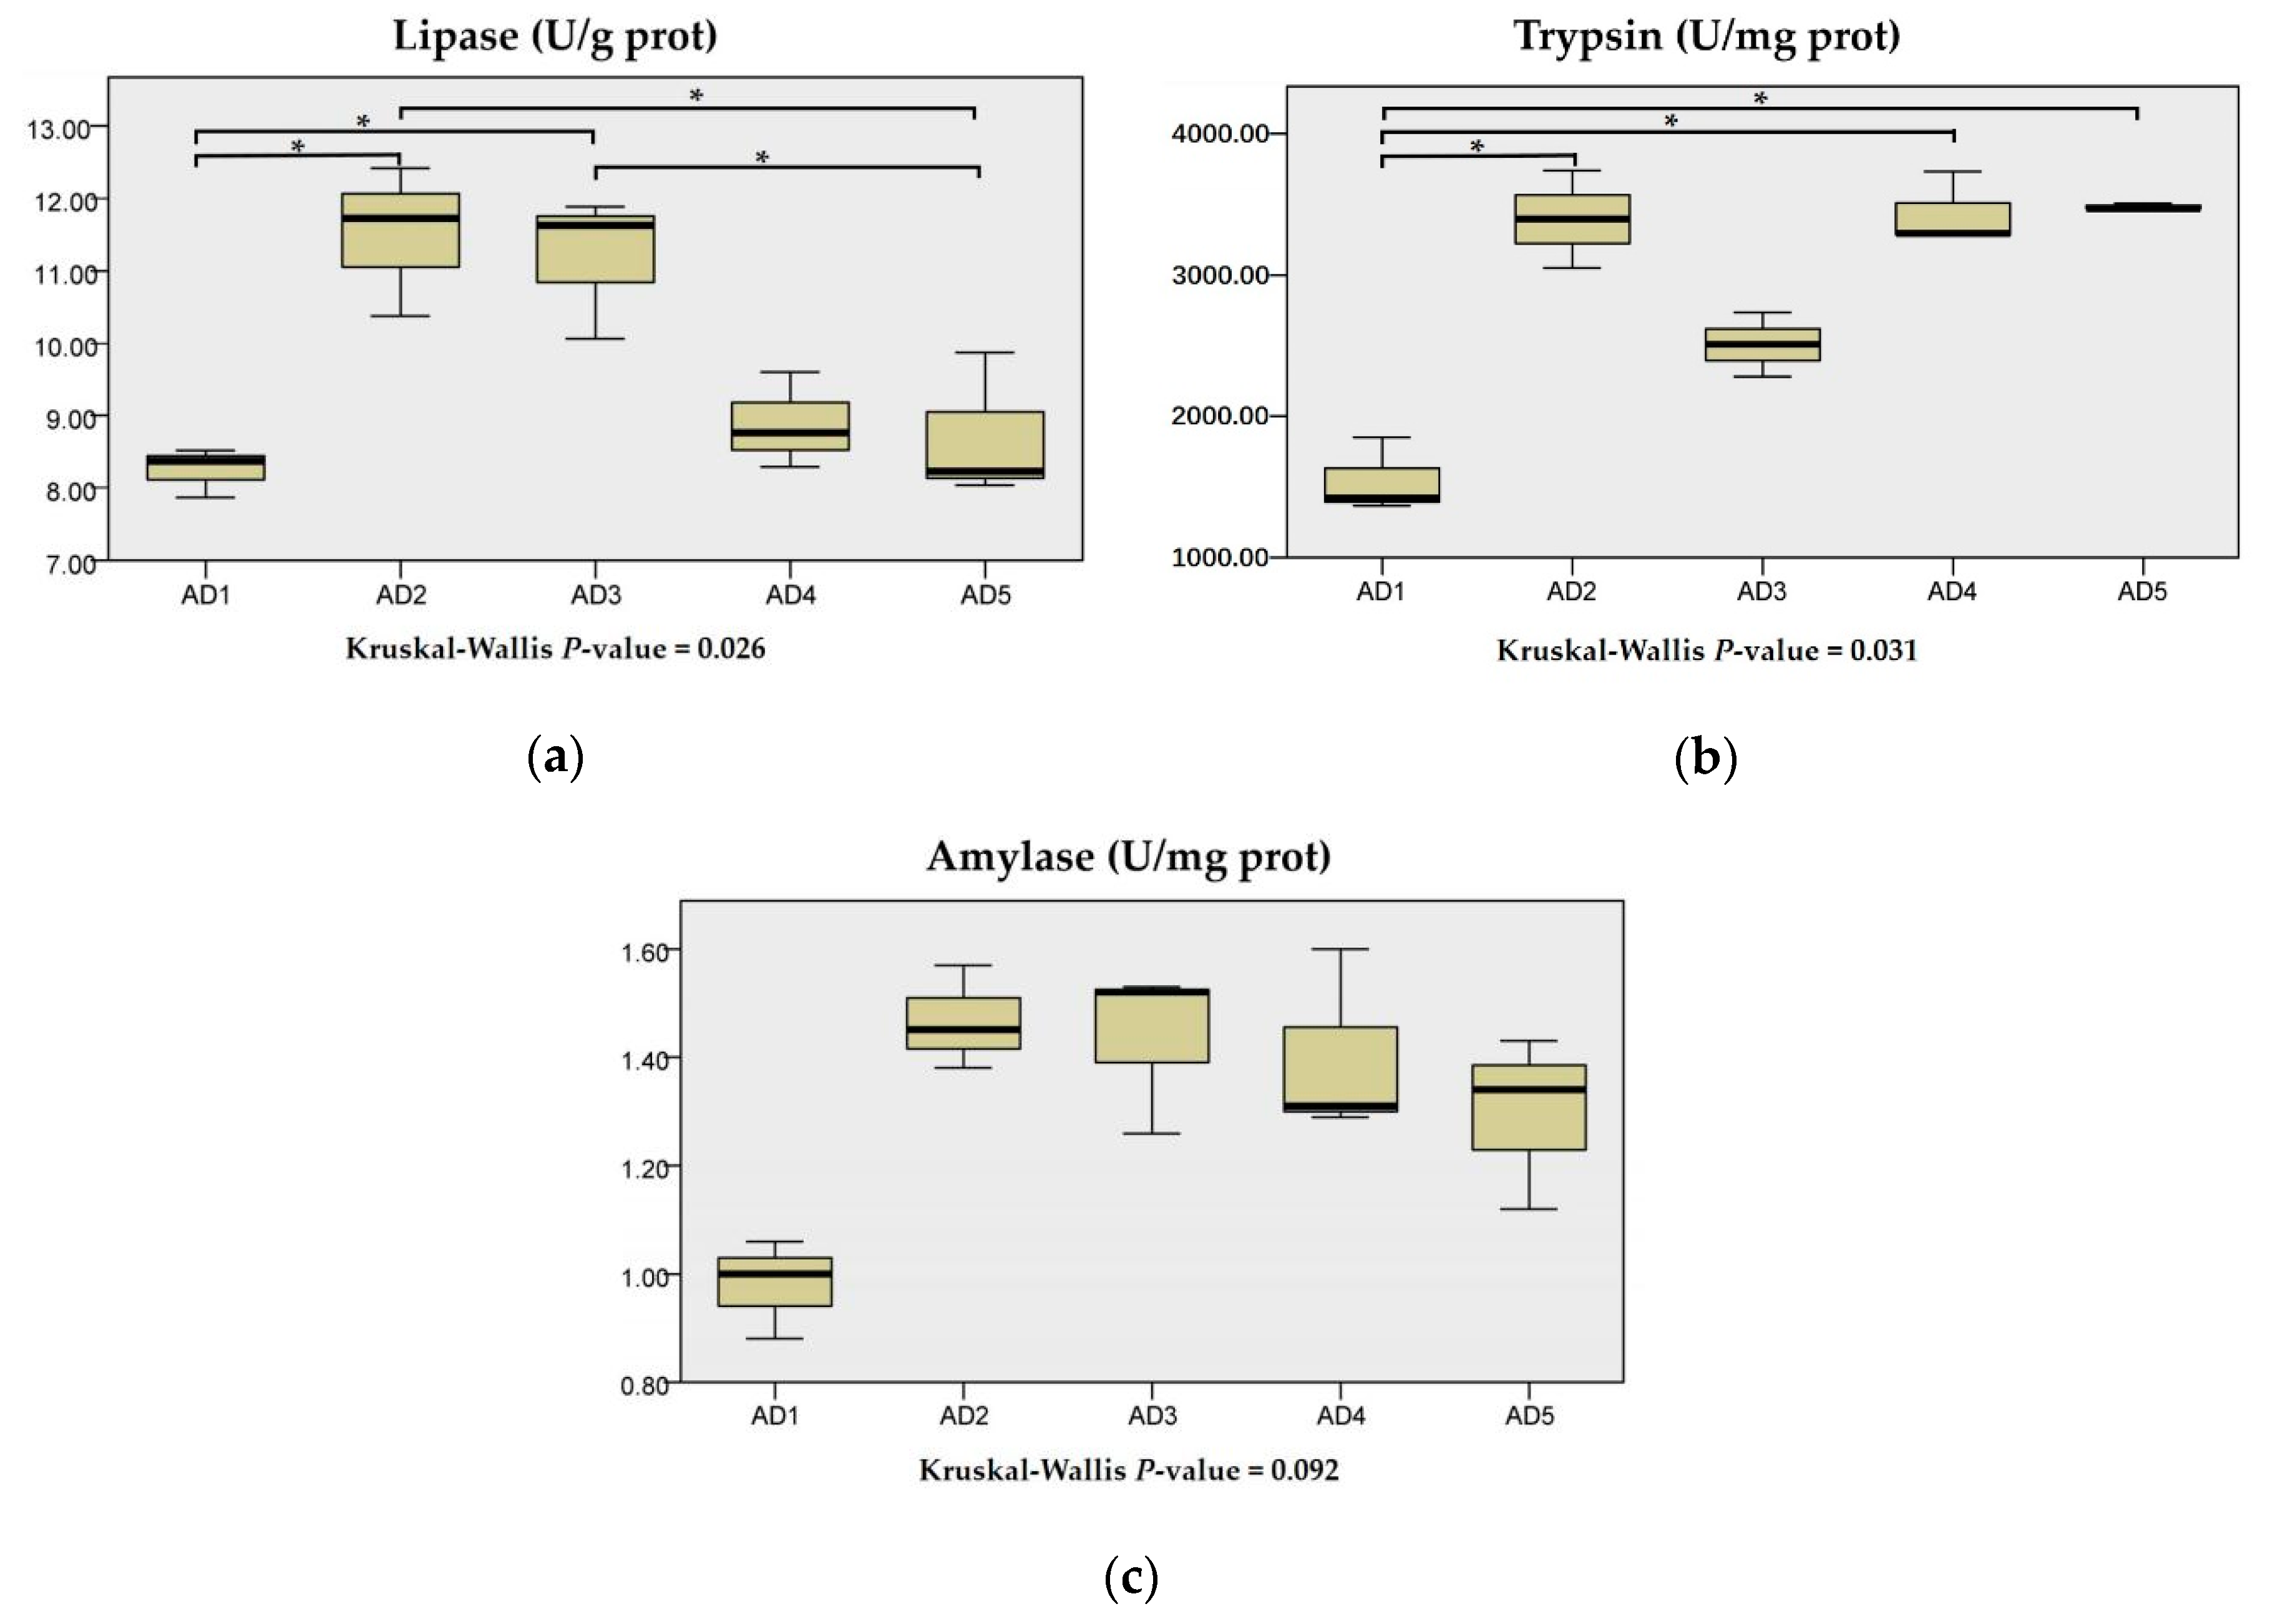
3.2. Digestive Enzyme Activities in Intestine

As shown in Figure 2, amylase activity in the intestine showed no significant differences between the treatments (p > 0.05). Trypsin activity in the intestine was significantly increased when the eels were fed a diet supplemented with 75, 225 and 300 mg/kg andrographolide compared to the AD1 group (p < 0.05). Lipase activity in the AD2 and AD3 groups was significantly higher than that in the AD1 and AD5 groups (p < 0.05).

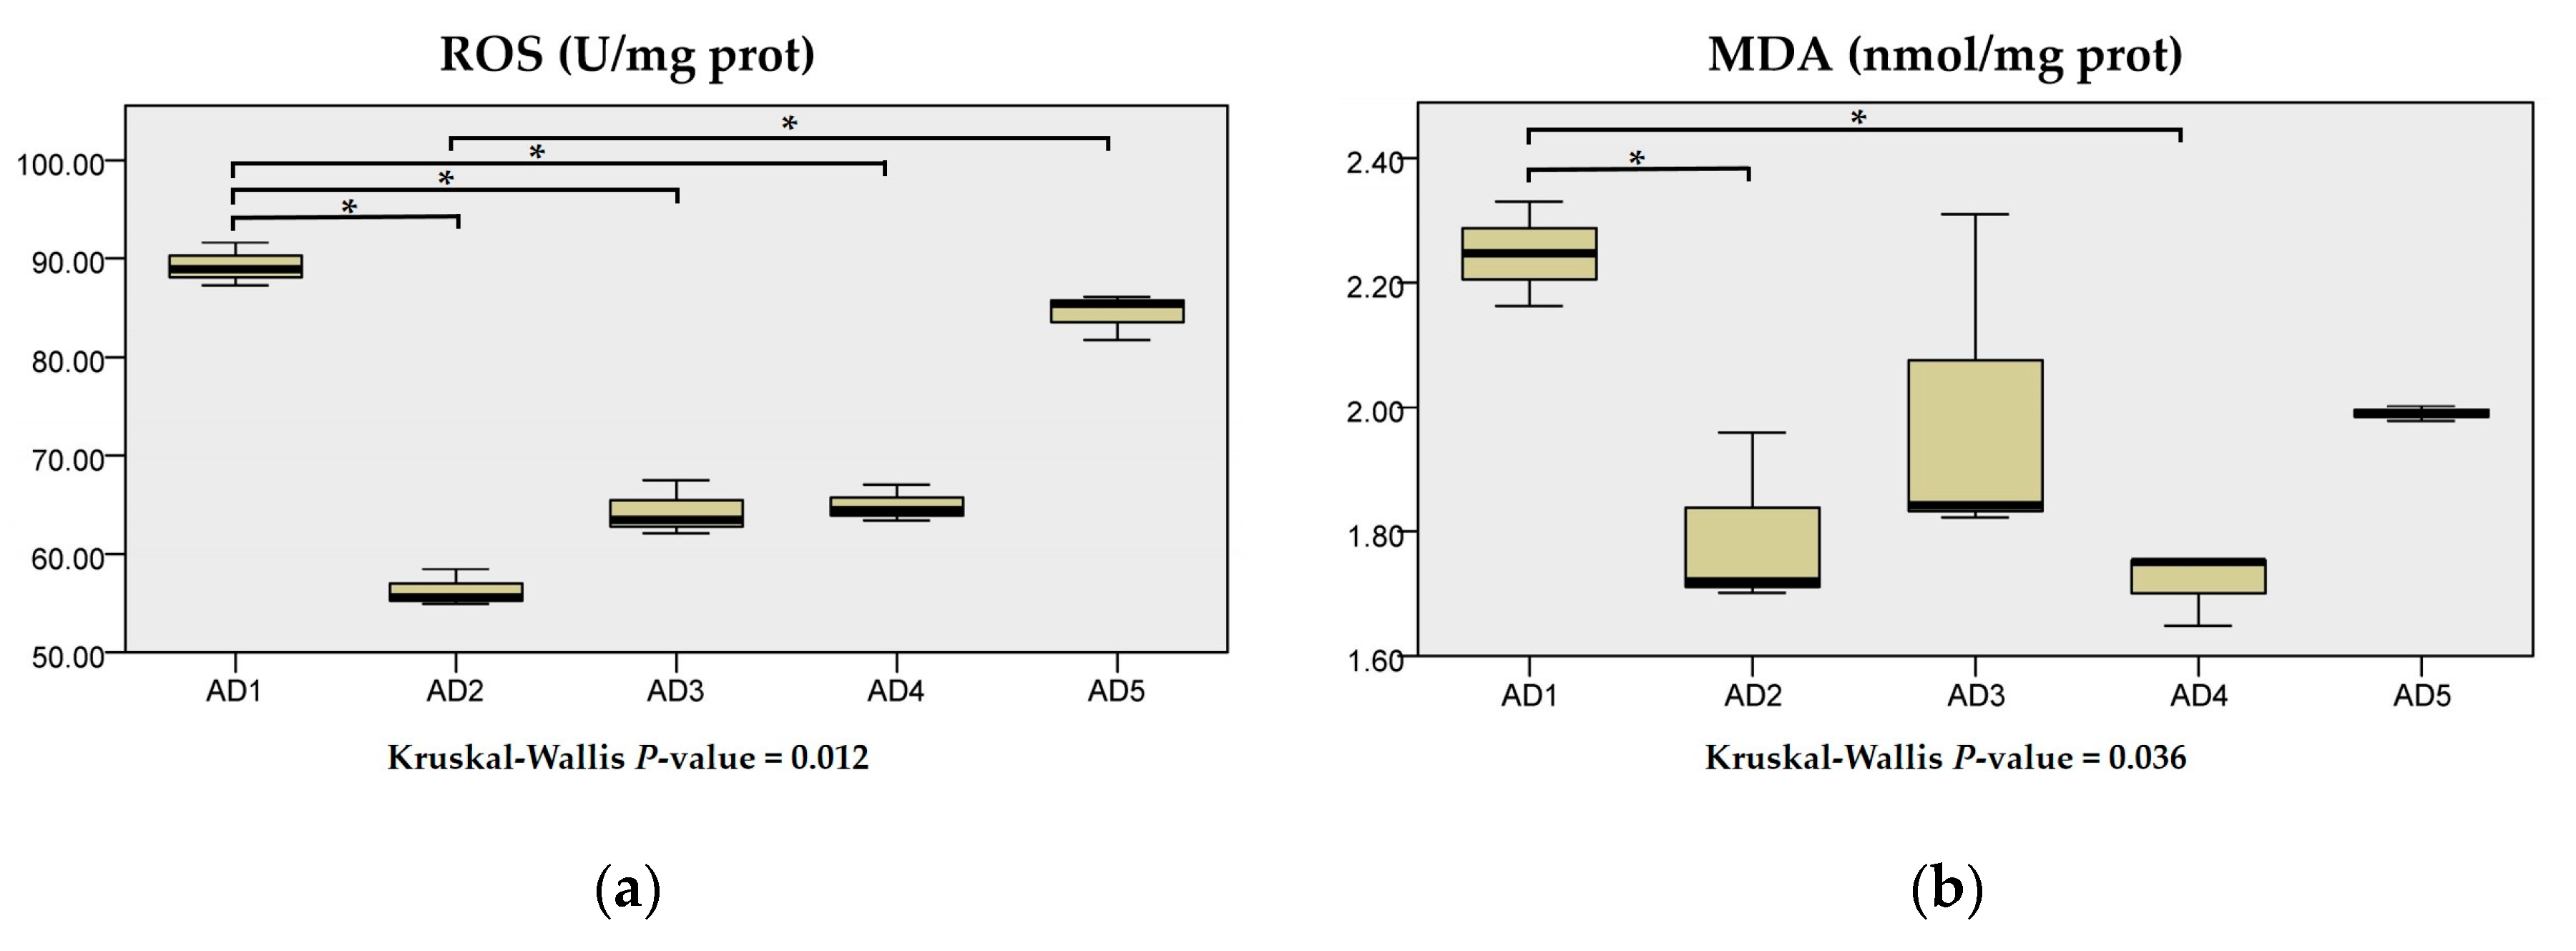
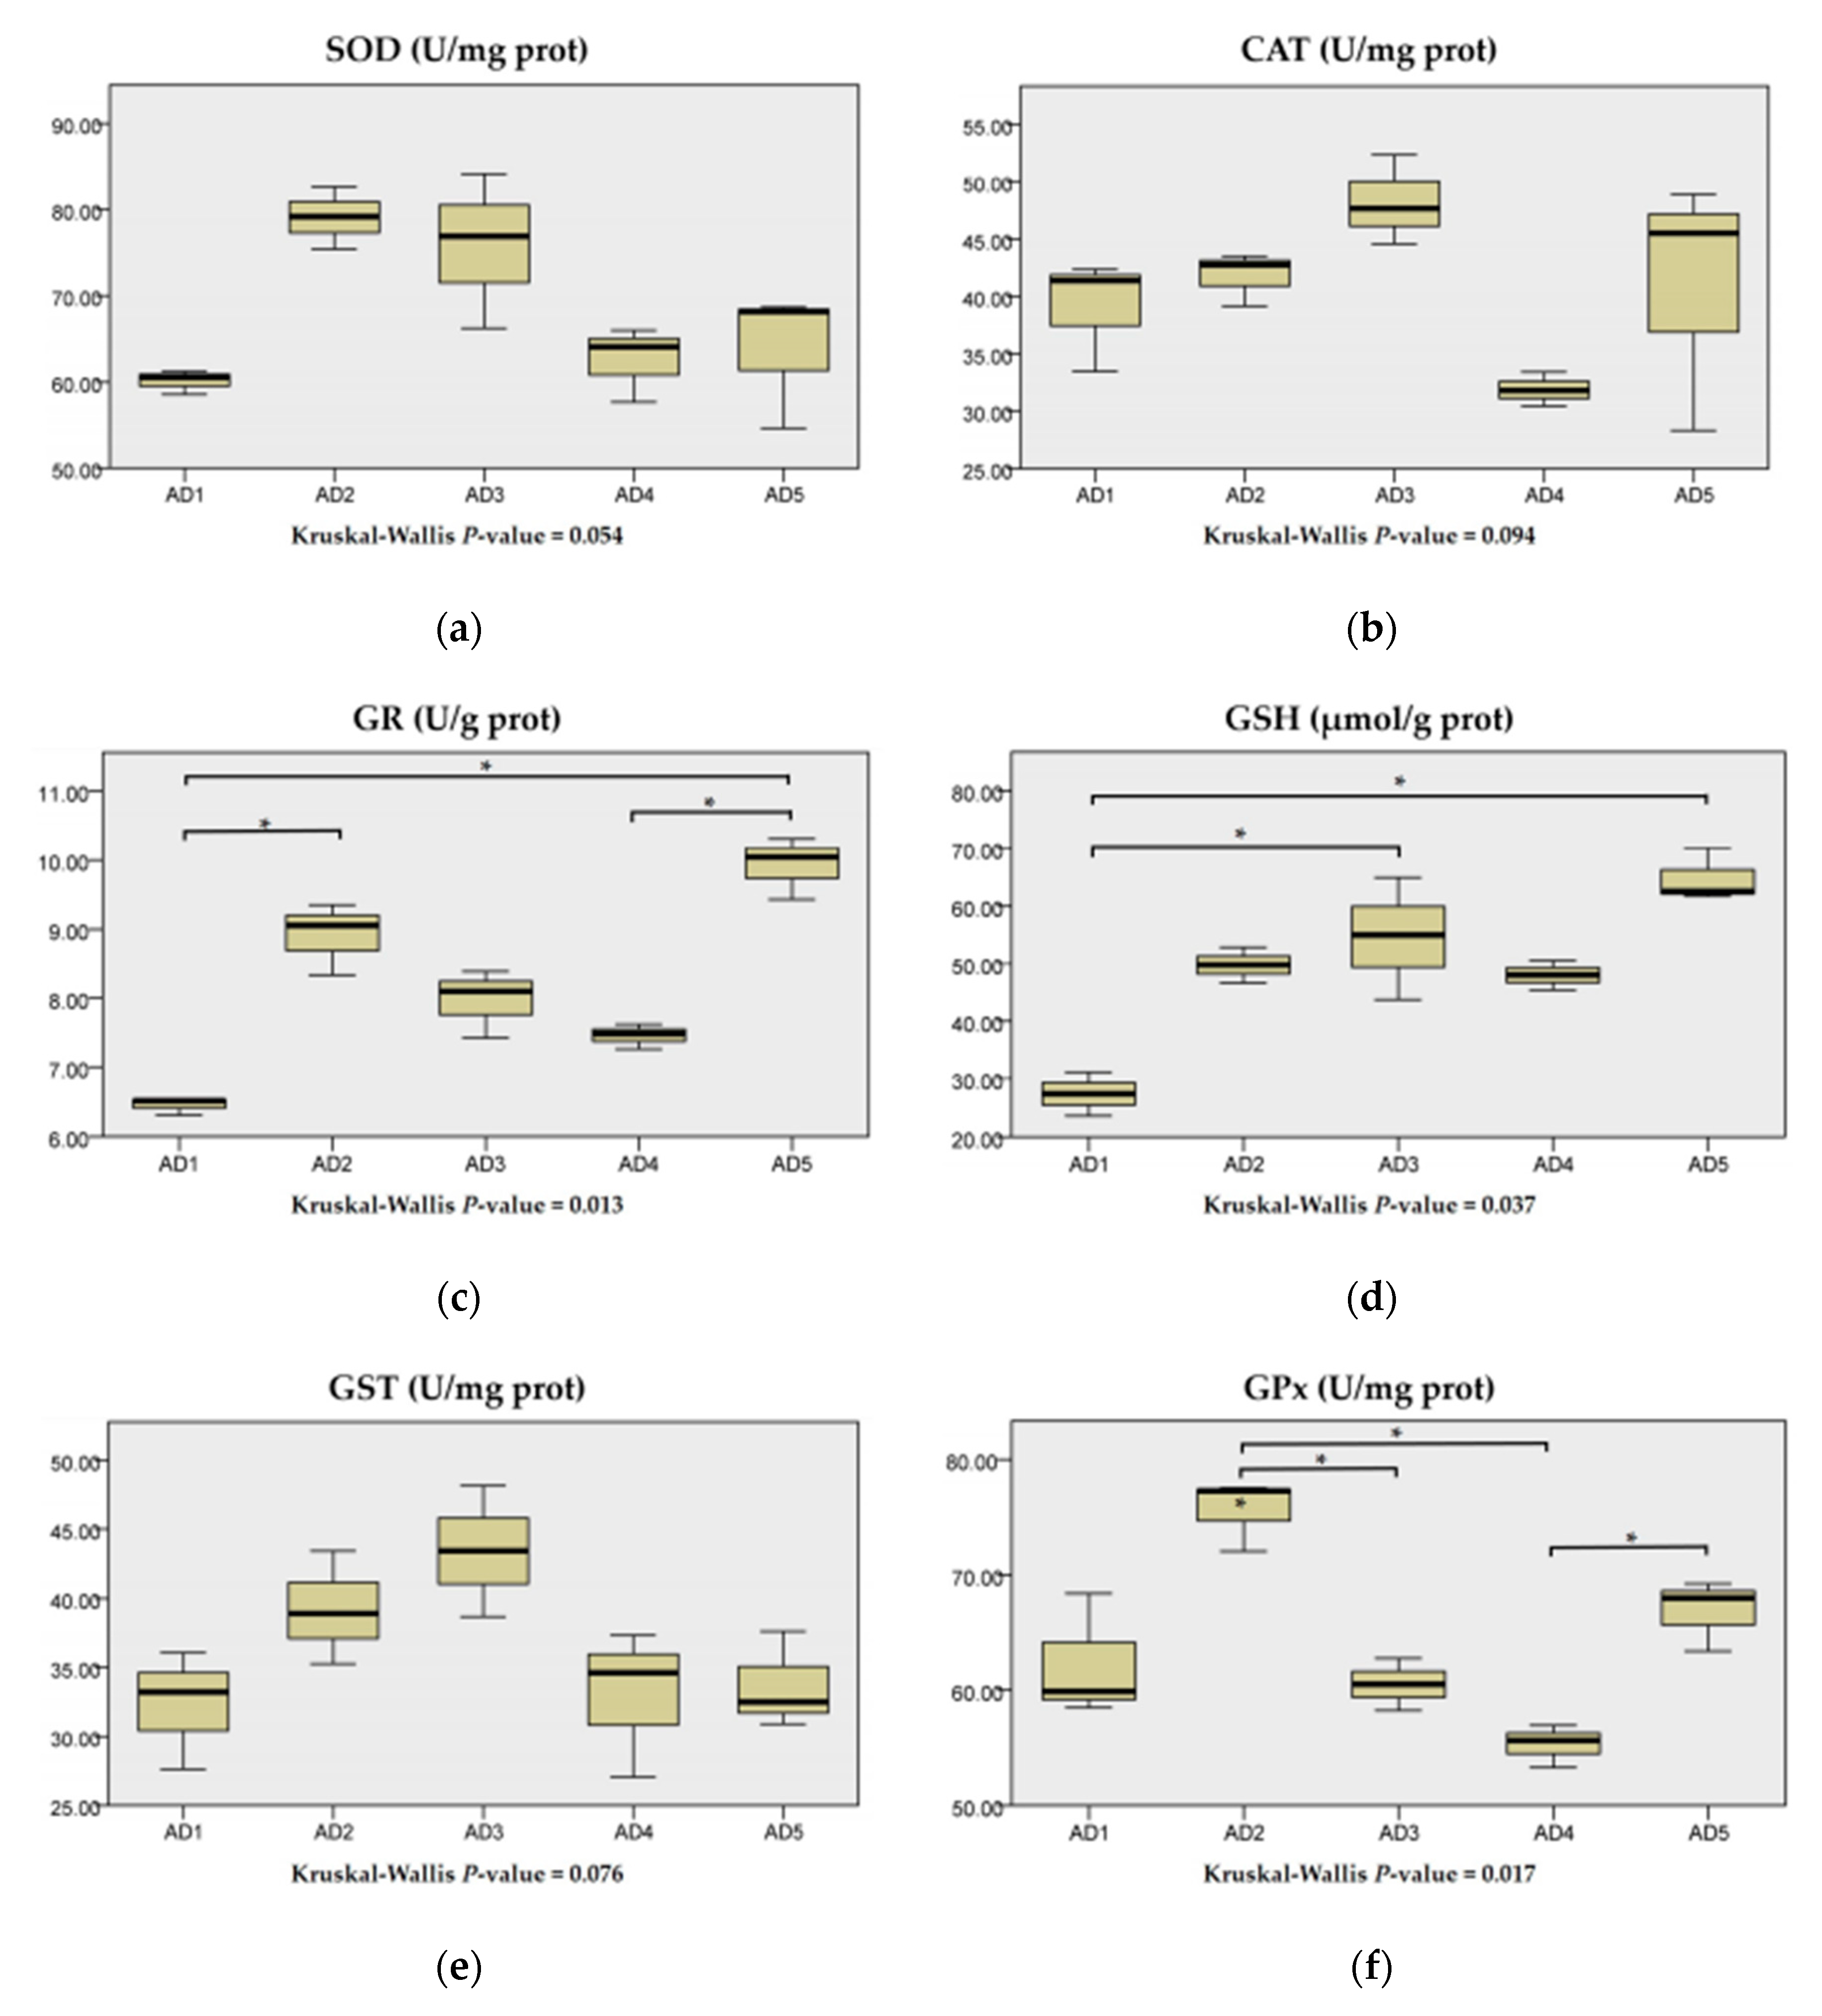
3.3. Antioxidant Enzyme Activities in the Liver

The content of MDA in the AD2 and AD4 groups, and the content of ROS in the AD2, AD3 and AD4 groups were significantly decreased compared to the AD1 group (p < 0.05; Figure 3).
As shown in Figure 4, the activities of SOD, CAT and GST in the liver were higher in the AD2 and AD3 groups than those in the AD1 group but not significant (p > 0.05). Compared to the AD1 group, the activities of GR in the AD2 and AD5 groups, and the contents of GSH in the AD3 and AD5 groups, were significantly increased (p < 0.05). The GPx activity in the AD2 group was significantly higher than that in the AD3 and AD4 groups (p < 0.05).

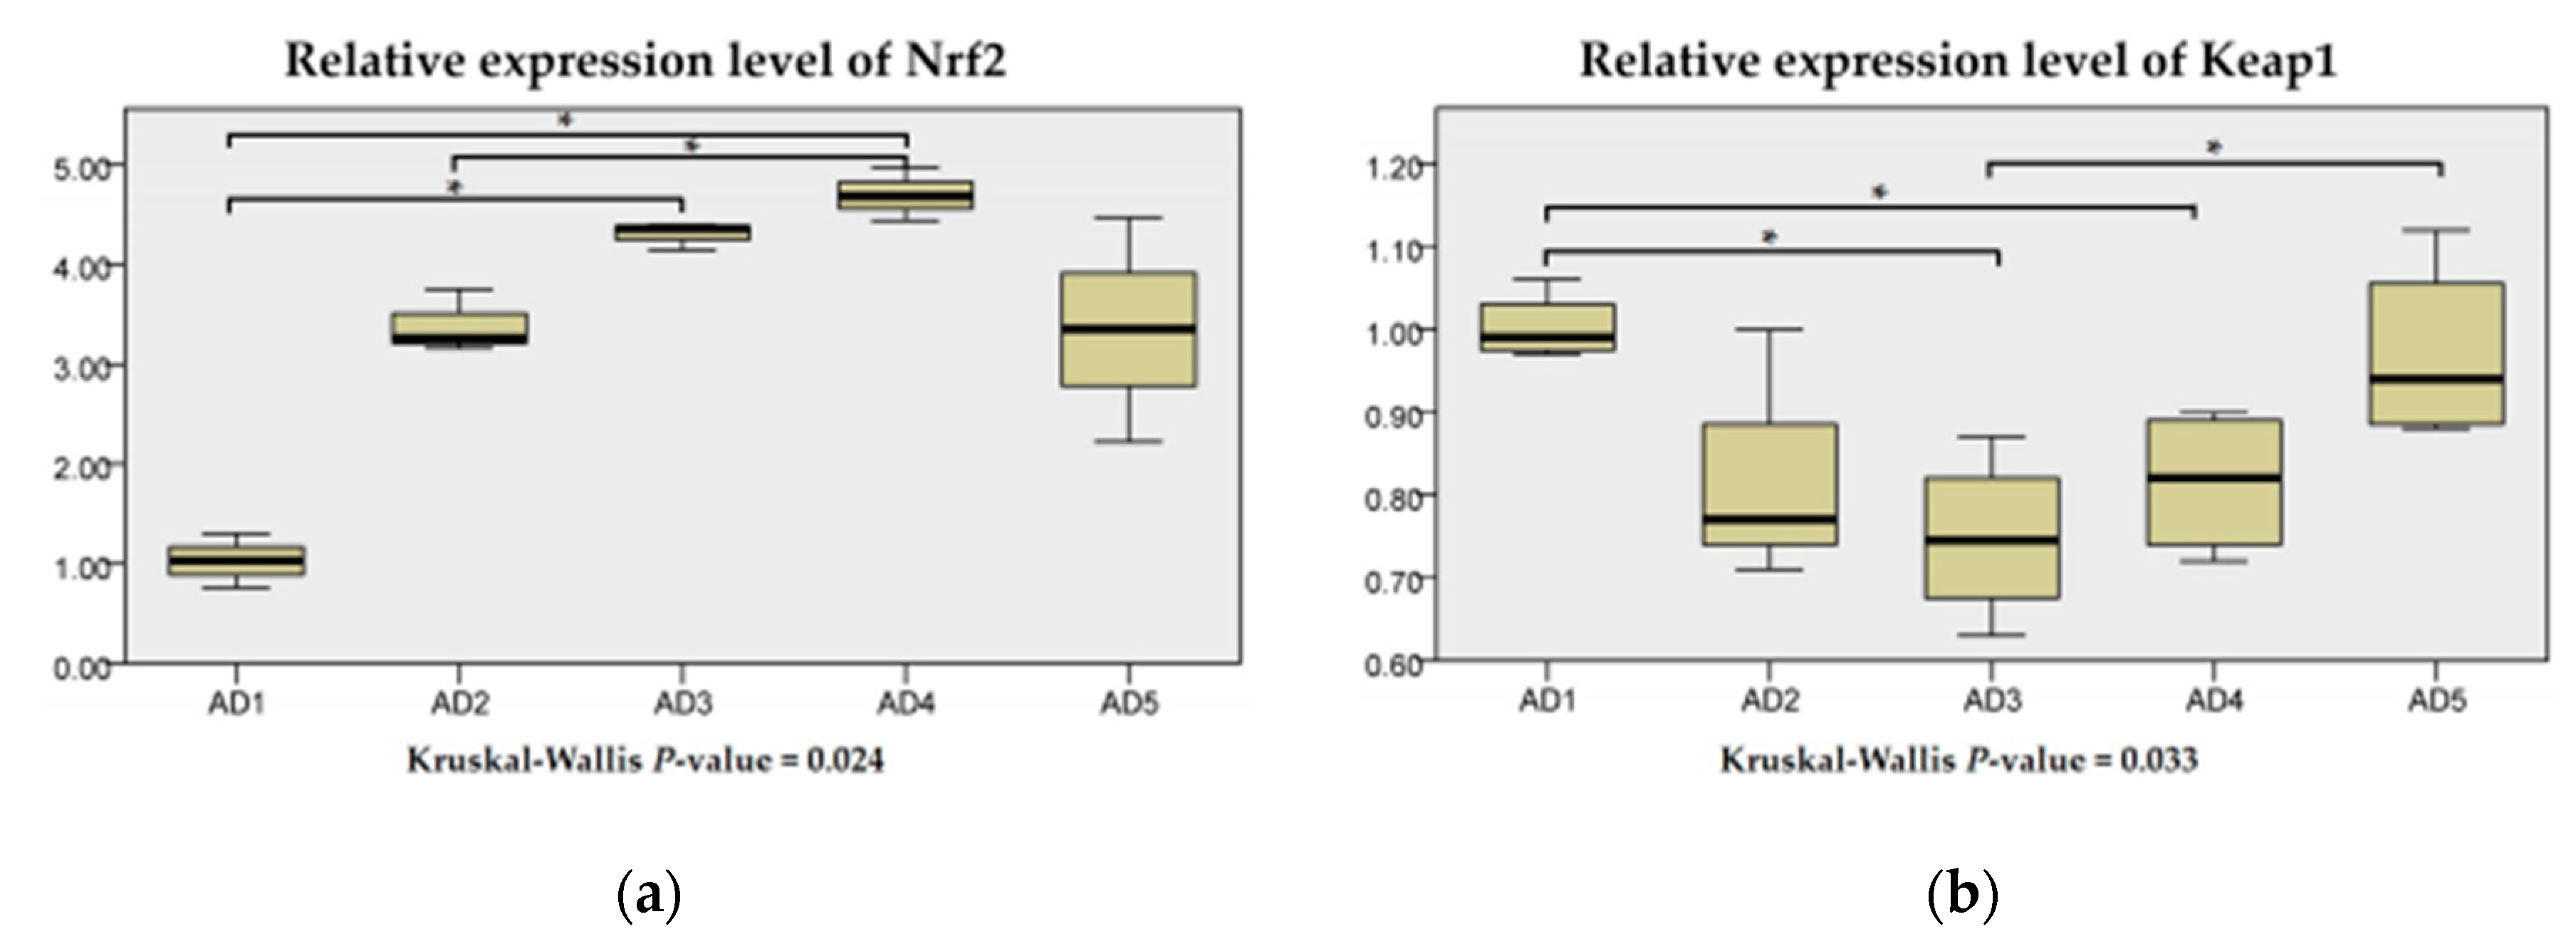
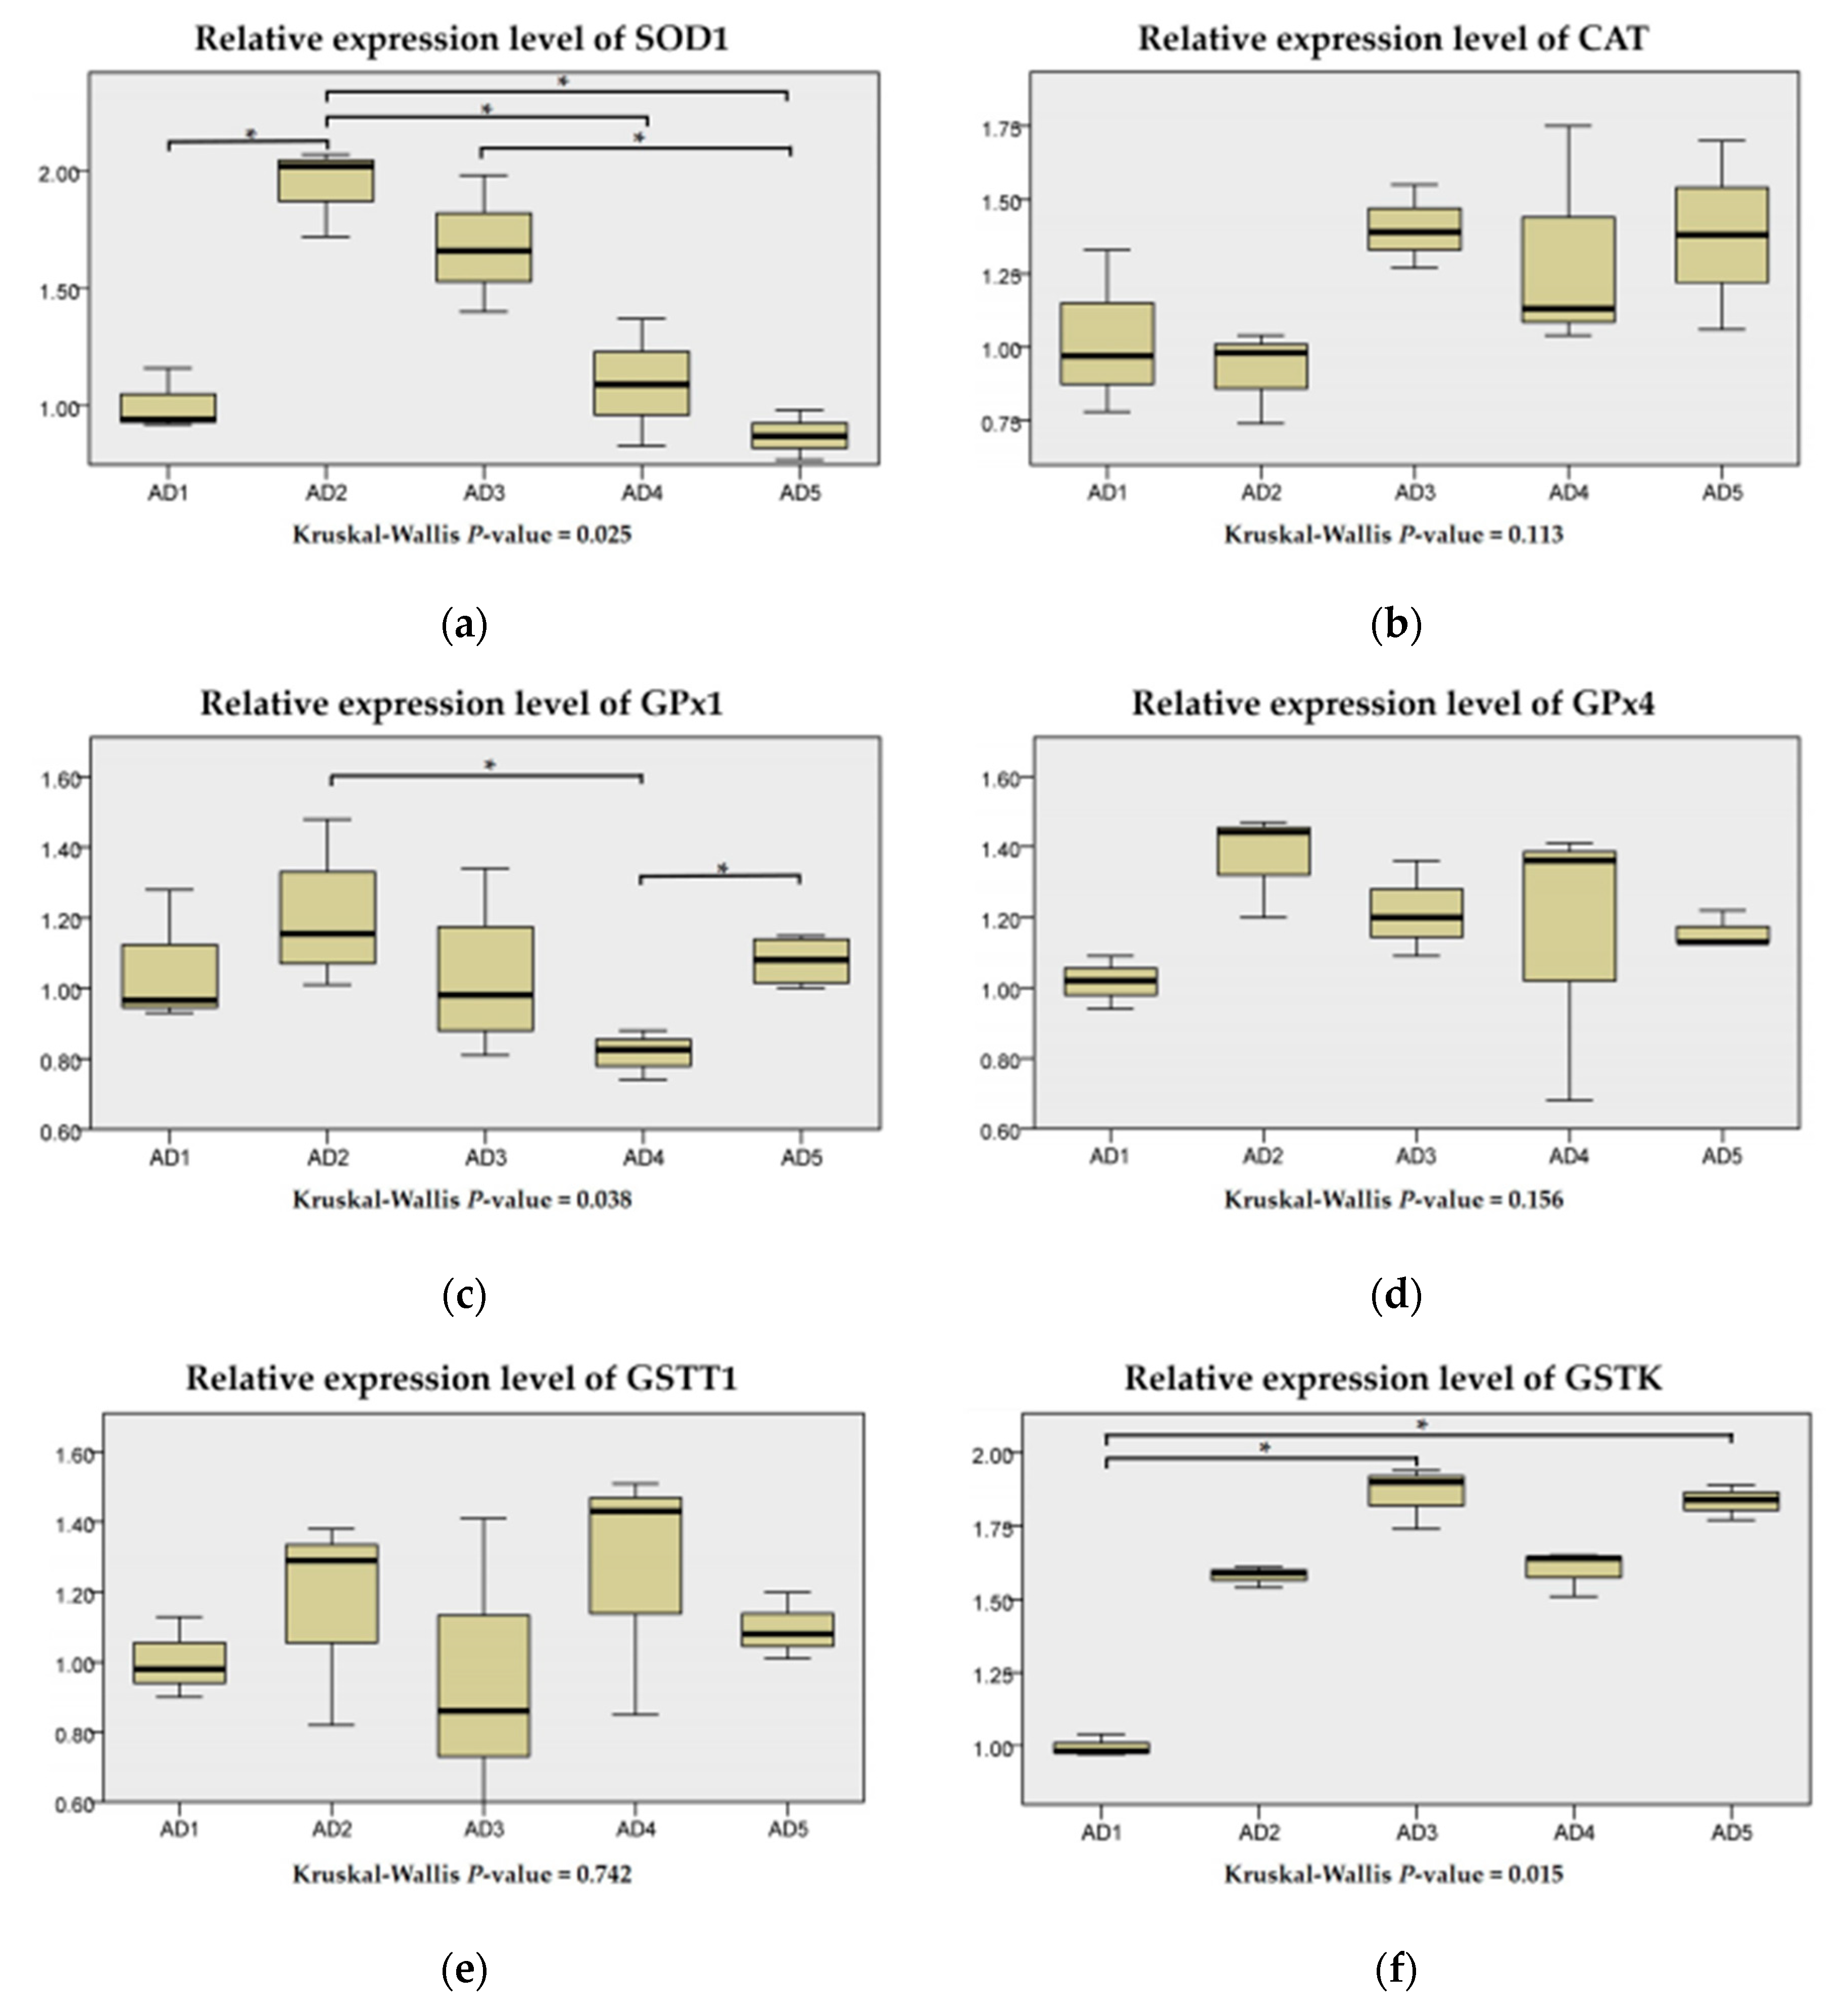
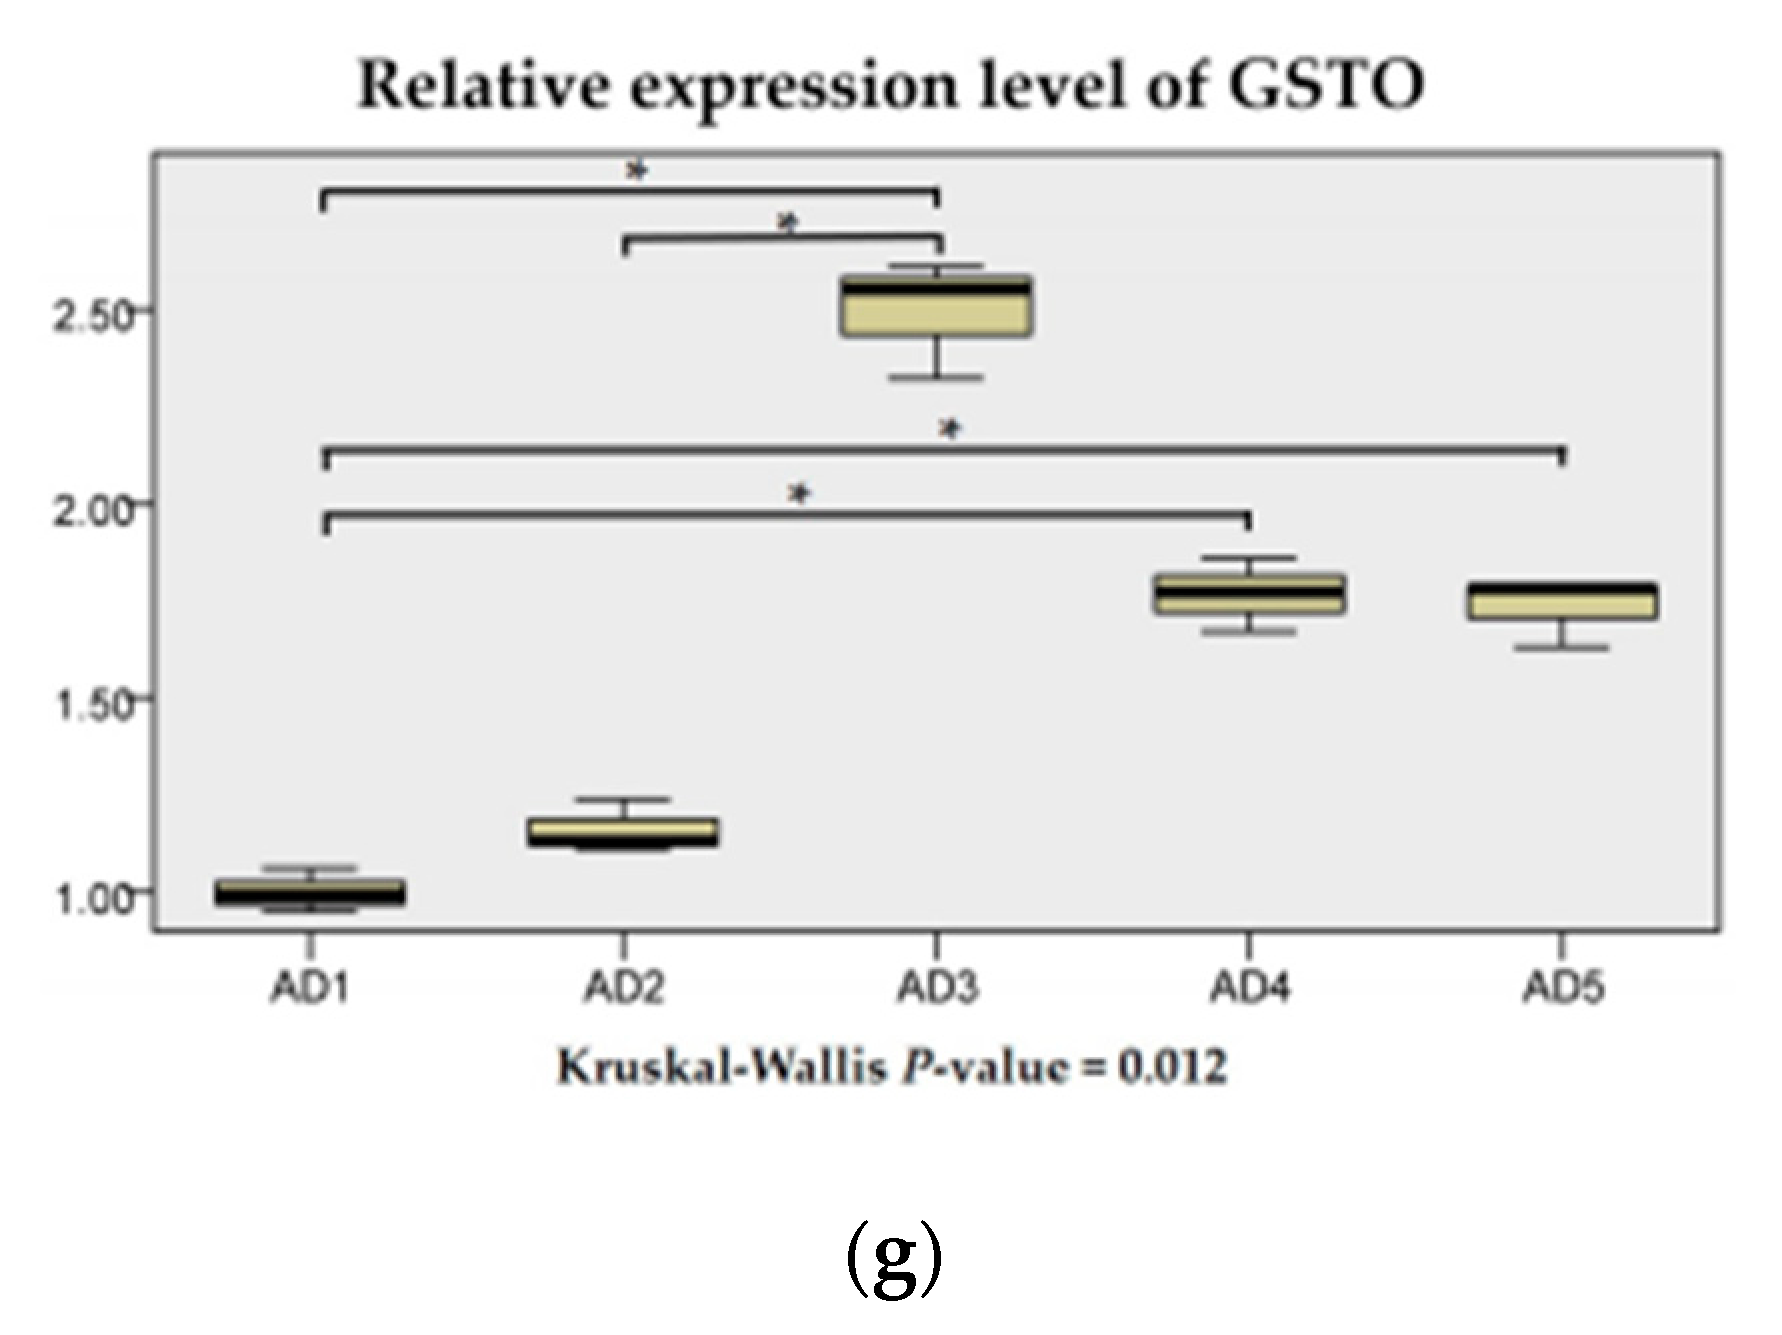
3.4. Antioxidant Related Gene Expression in the Liver

Compared to the AD1 group, the expression level of Nrf2 was significantly upregulated (p < 0.05) in eels fed a diet supplemented with 150 and 225 mg/kg andrographolide groups. The expression level of Keap1 in the AD3 and AD4 groups was significantly lower than that in the AD1 group (p < 0.05; Figure 5).
As shown in Figure 6, compared to the AD1 group, the mRNA level of SOD1 in the AD2 group; the mRNA levels of GSTK in the AD3 and AD5 groups; and the mRNA levels of GSTO in the AD3, AD4 and AD5 groups were significantly upregulated (p < 0.05). The mRNA levels of GPx1 in the AD2 and AD5 groups were significantly higher than those in the AD4 group (p < 0.05). The expression levels of CAT, GPx4 and GSTT1 were independent of dietary treatment (p > 0.05).

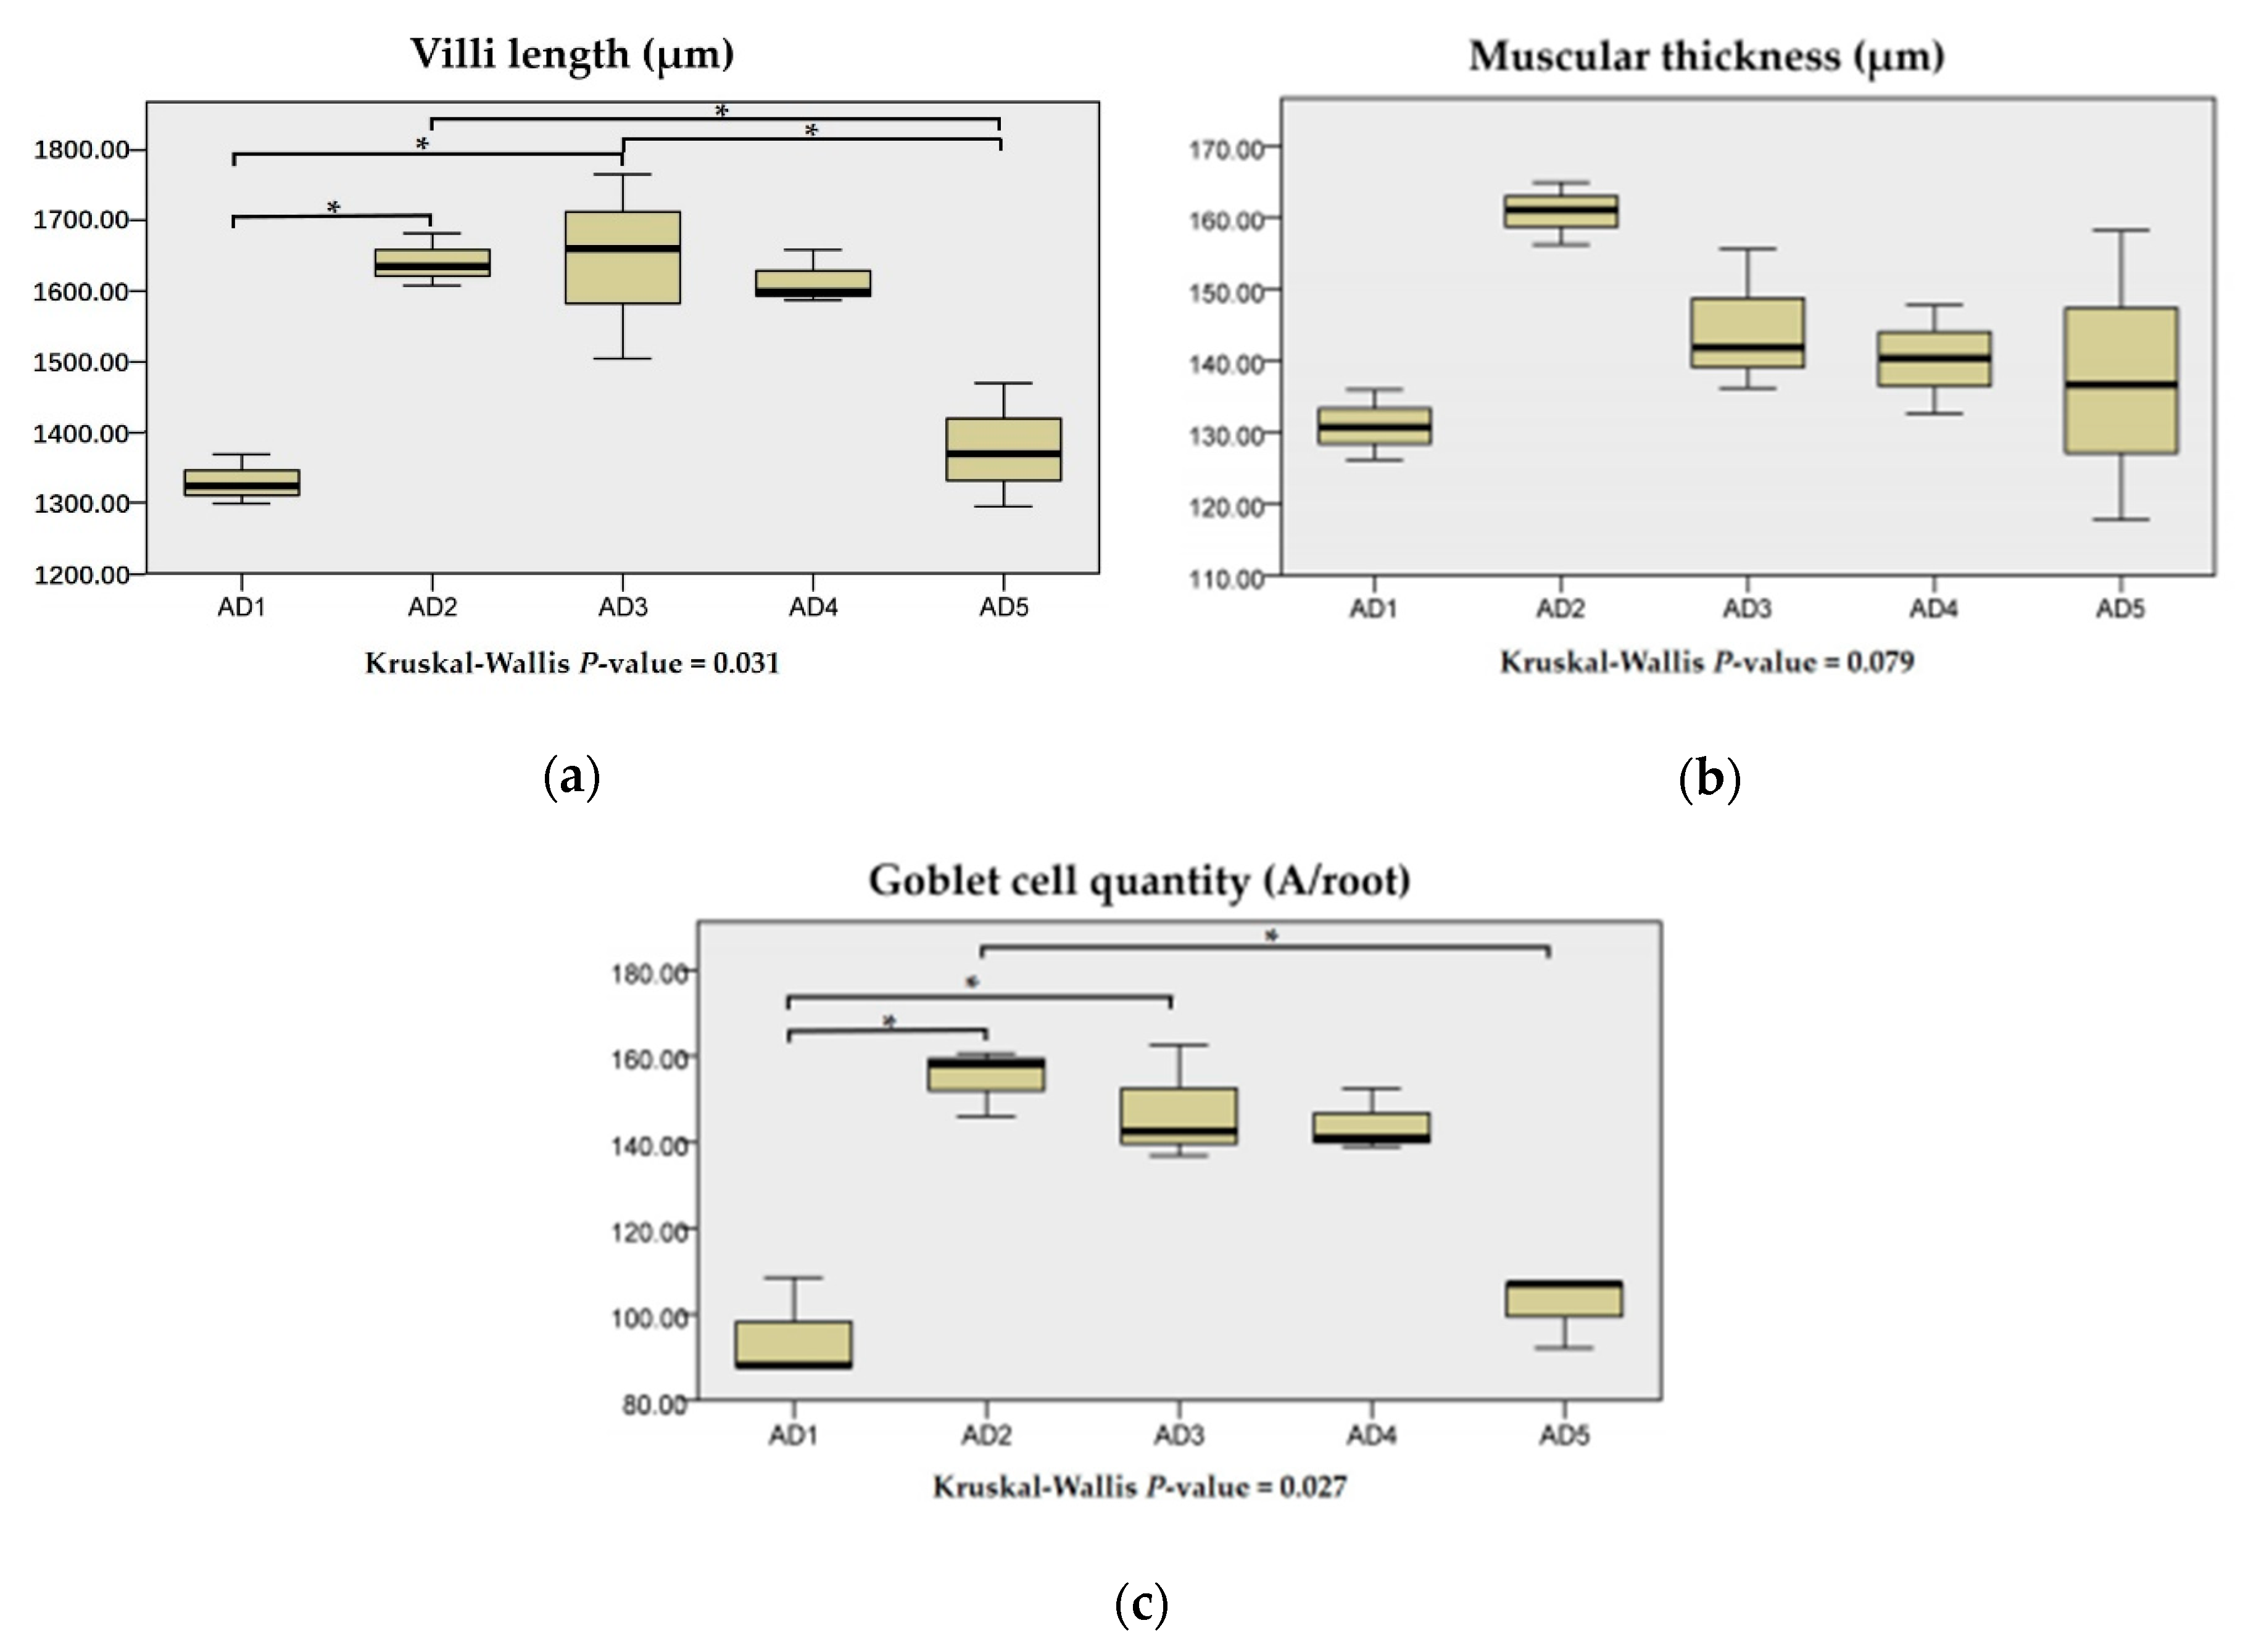
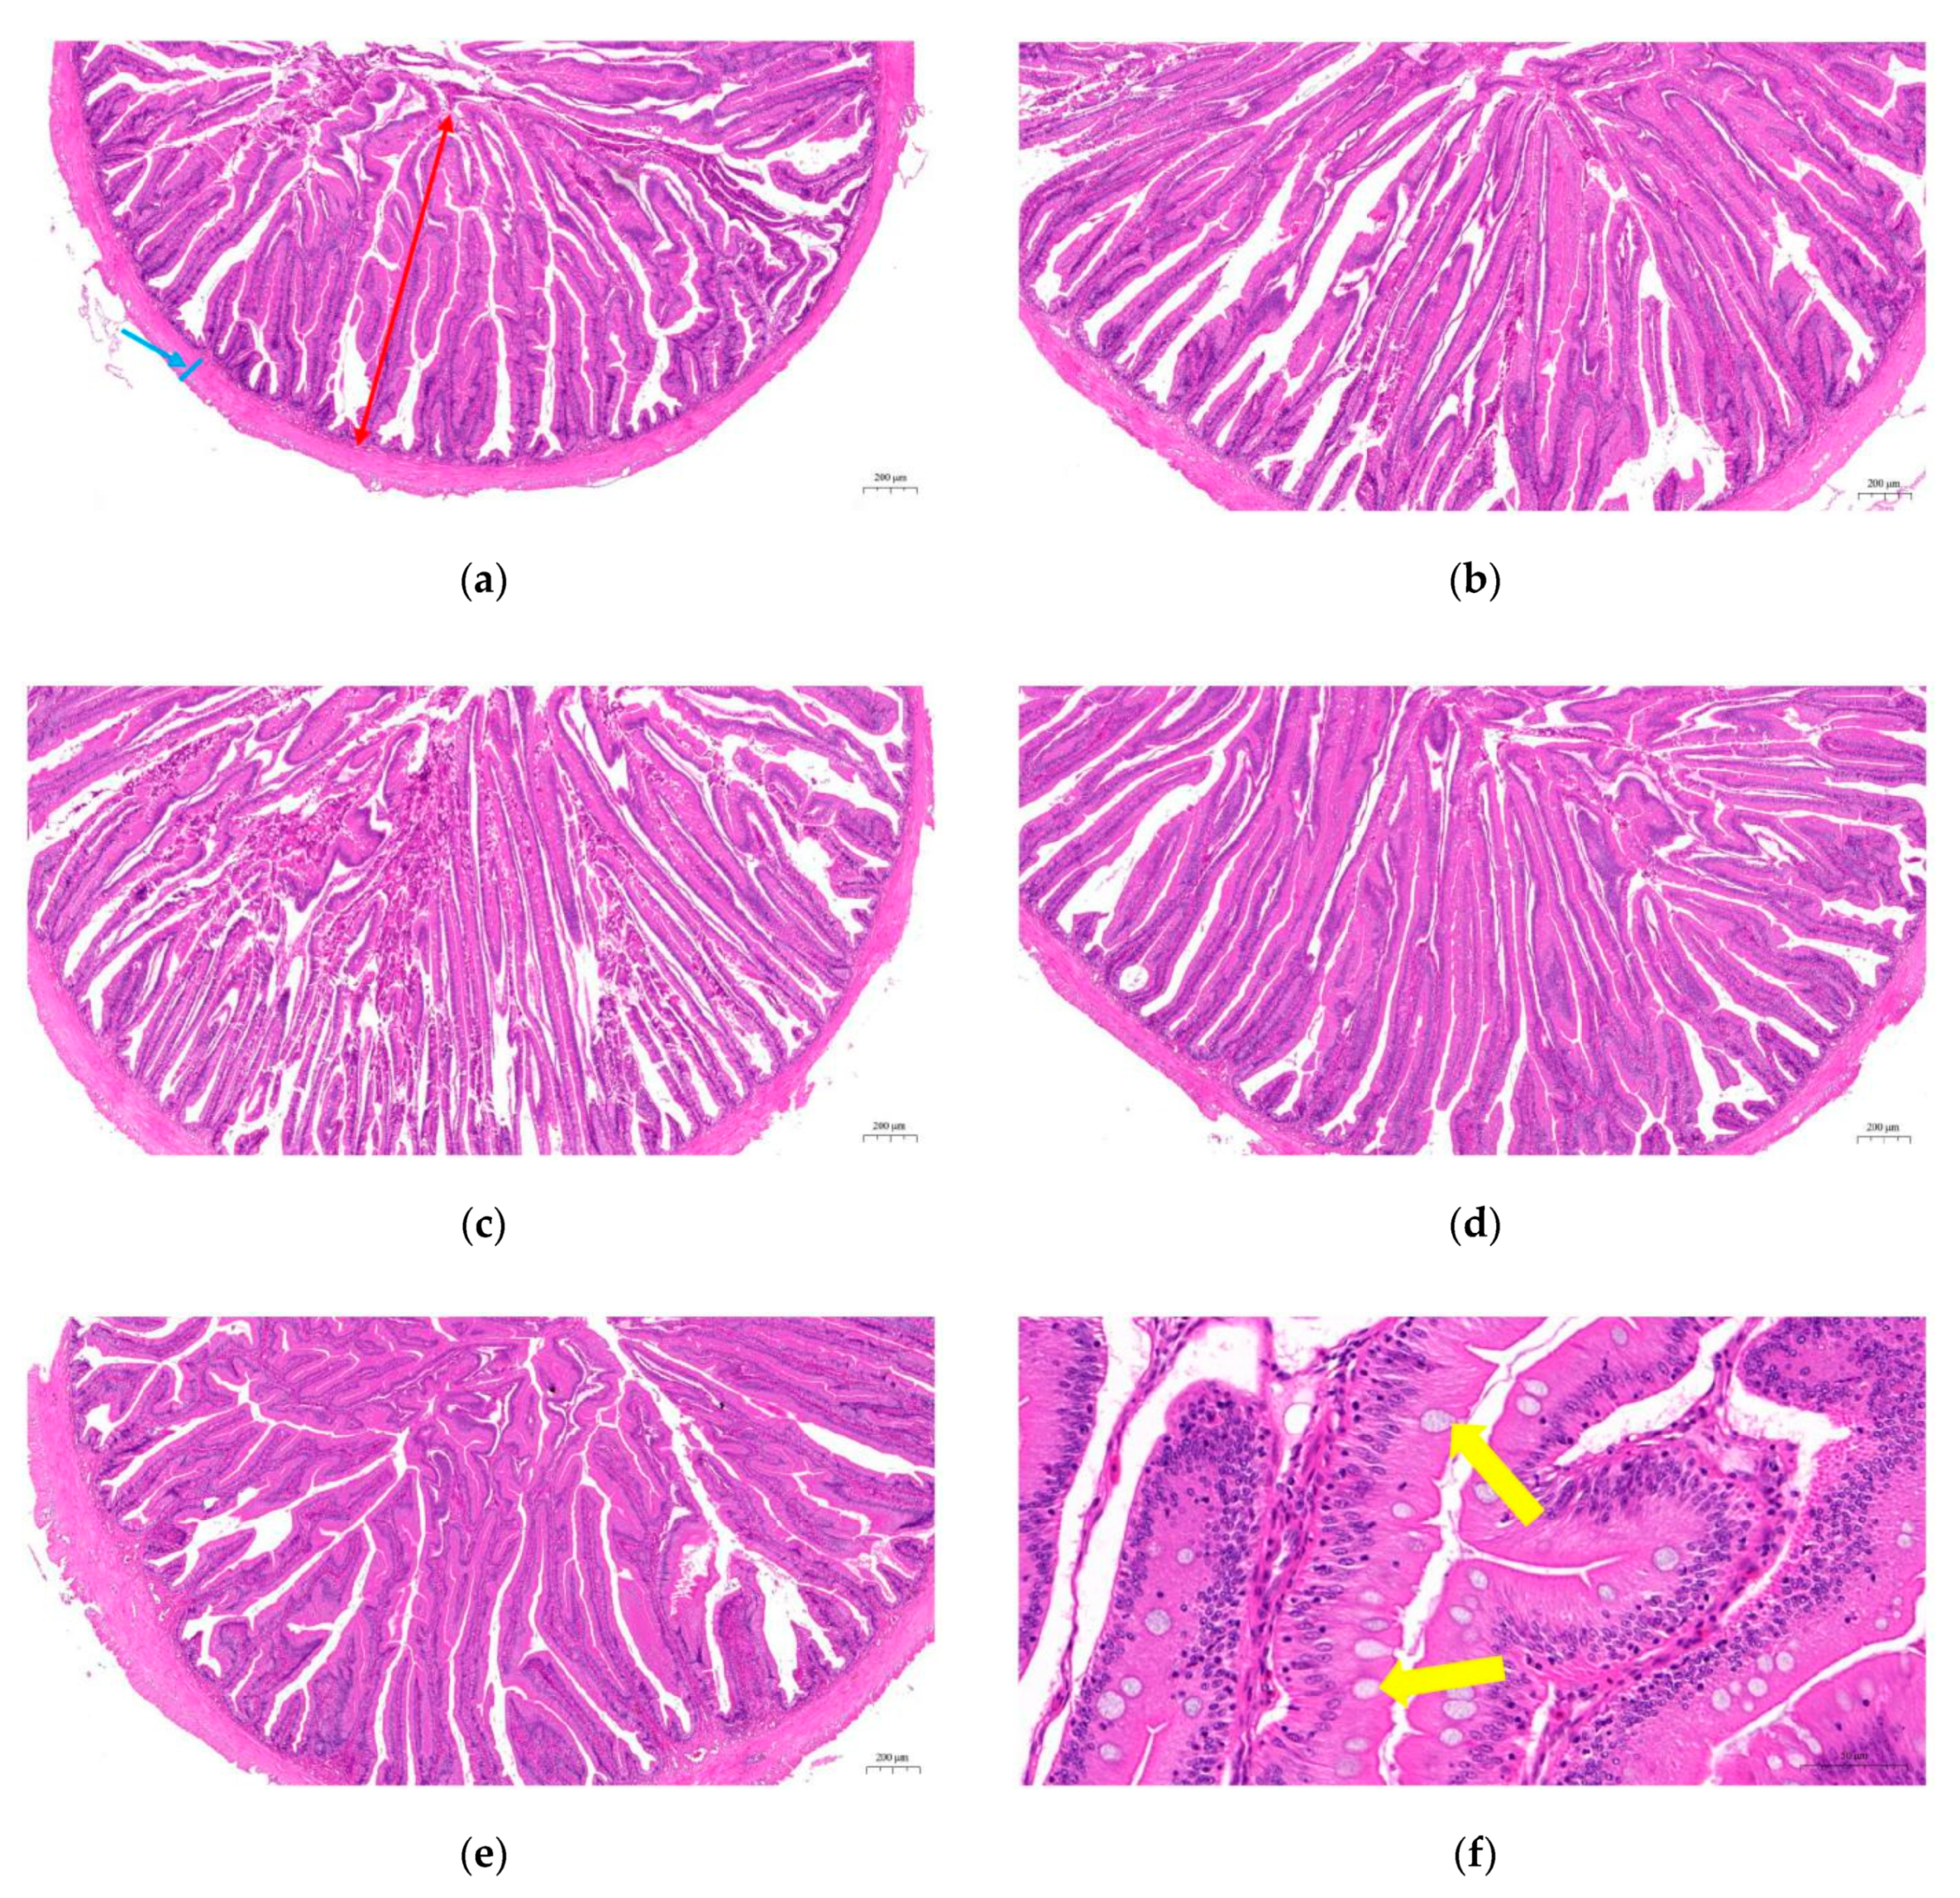
3.5. Histological Structure in the Intestine

As shown in Figure 7, villus lengths and goblet cell numbers in the AD2 and AD3 groups were significantly increased compared to the AD1 group (p < 0.05). Muscular thickness in the intestine showed no significant differences between the treatments, but the AD2 group was the highest (p > 0.05). In addition, the AD2, AD3 and AD4 groups showed a more orderly arrangement of intestinal villi (Figure 8).

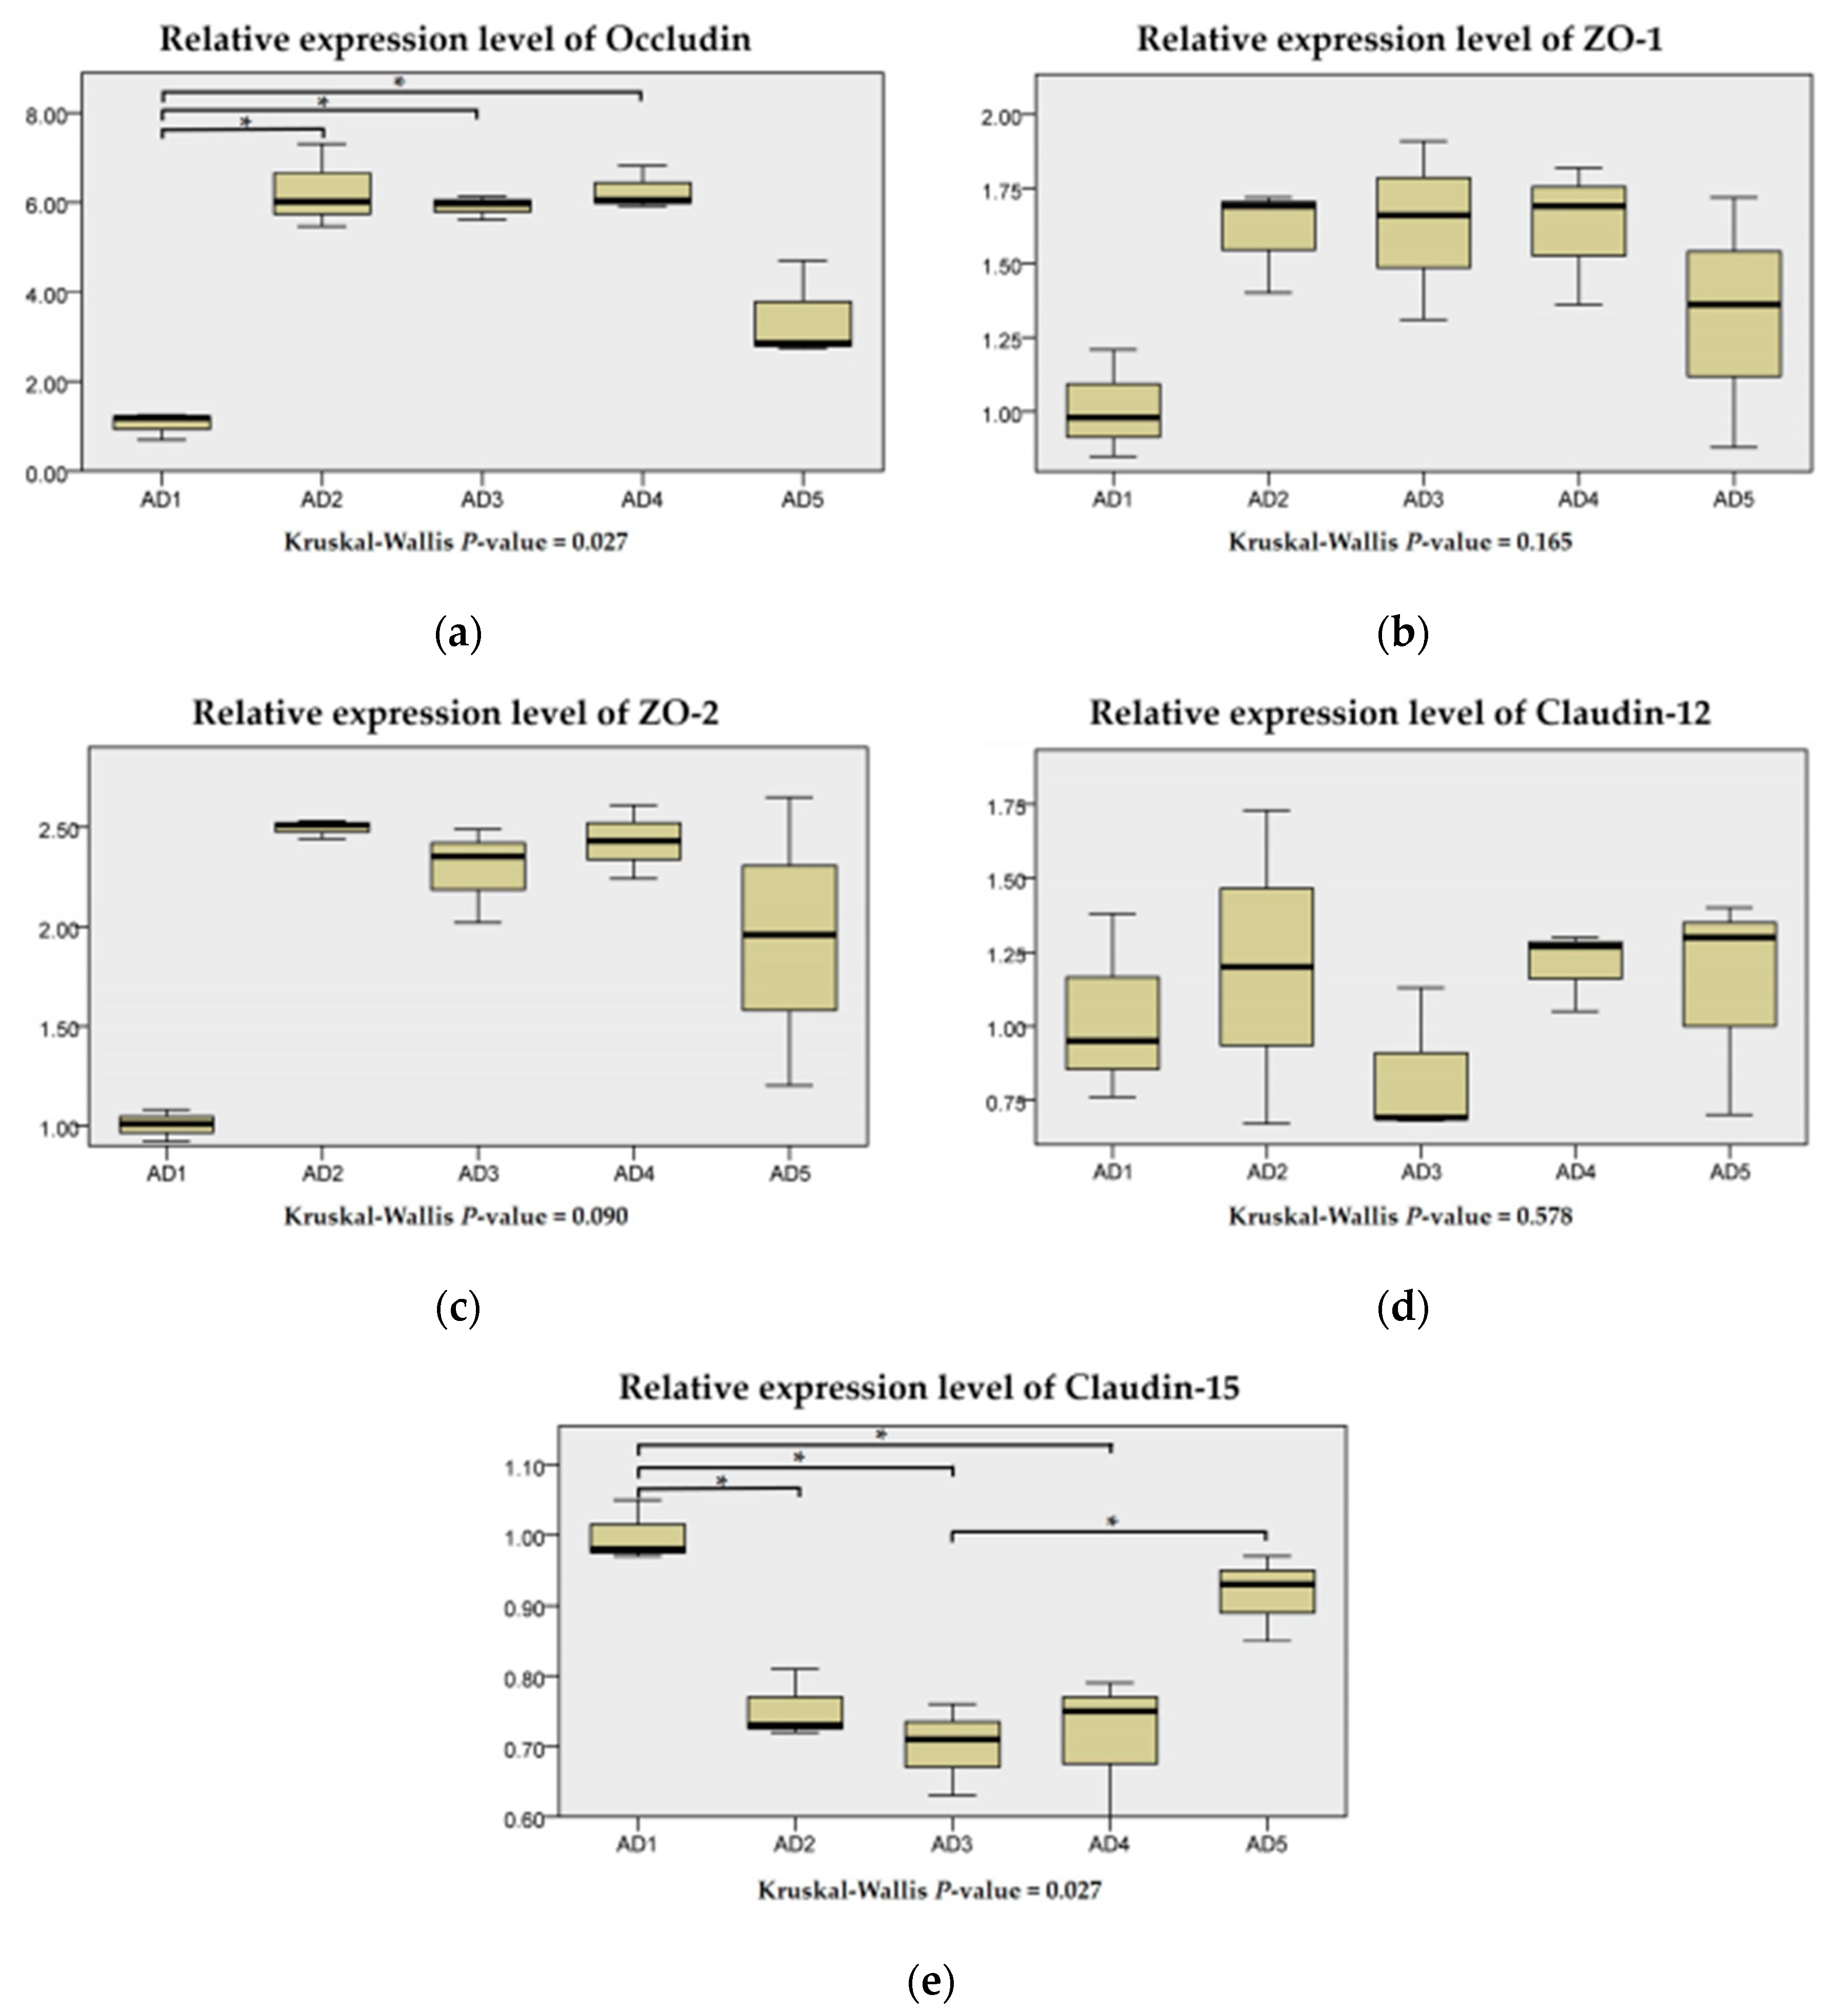
3.6. Expressions of Physical Barrier-Related Genes in the Intestine

There were no significant differences in the mRNA levels of Claudin-12 among all treatment groups (p > 0.05; Figure 9). The mRNA levels of ZO-1 and ZO-2 were higher in the AD2, AD3 and AD4 groups than those in the AD1 group but not significant (p > 0.05). Compared to the AD1 group, the mRNA levels of Occludin in the AD2, AD3 and AD4 groups were significantly upregulated (p < 0.05), and the mRNA levels of Claudin-15 in the AD2, AD3 and AD4 groups were significantly downregulated (p < 0.05).

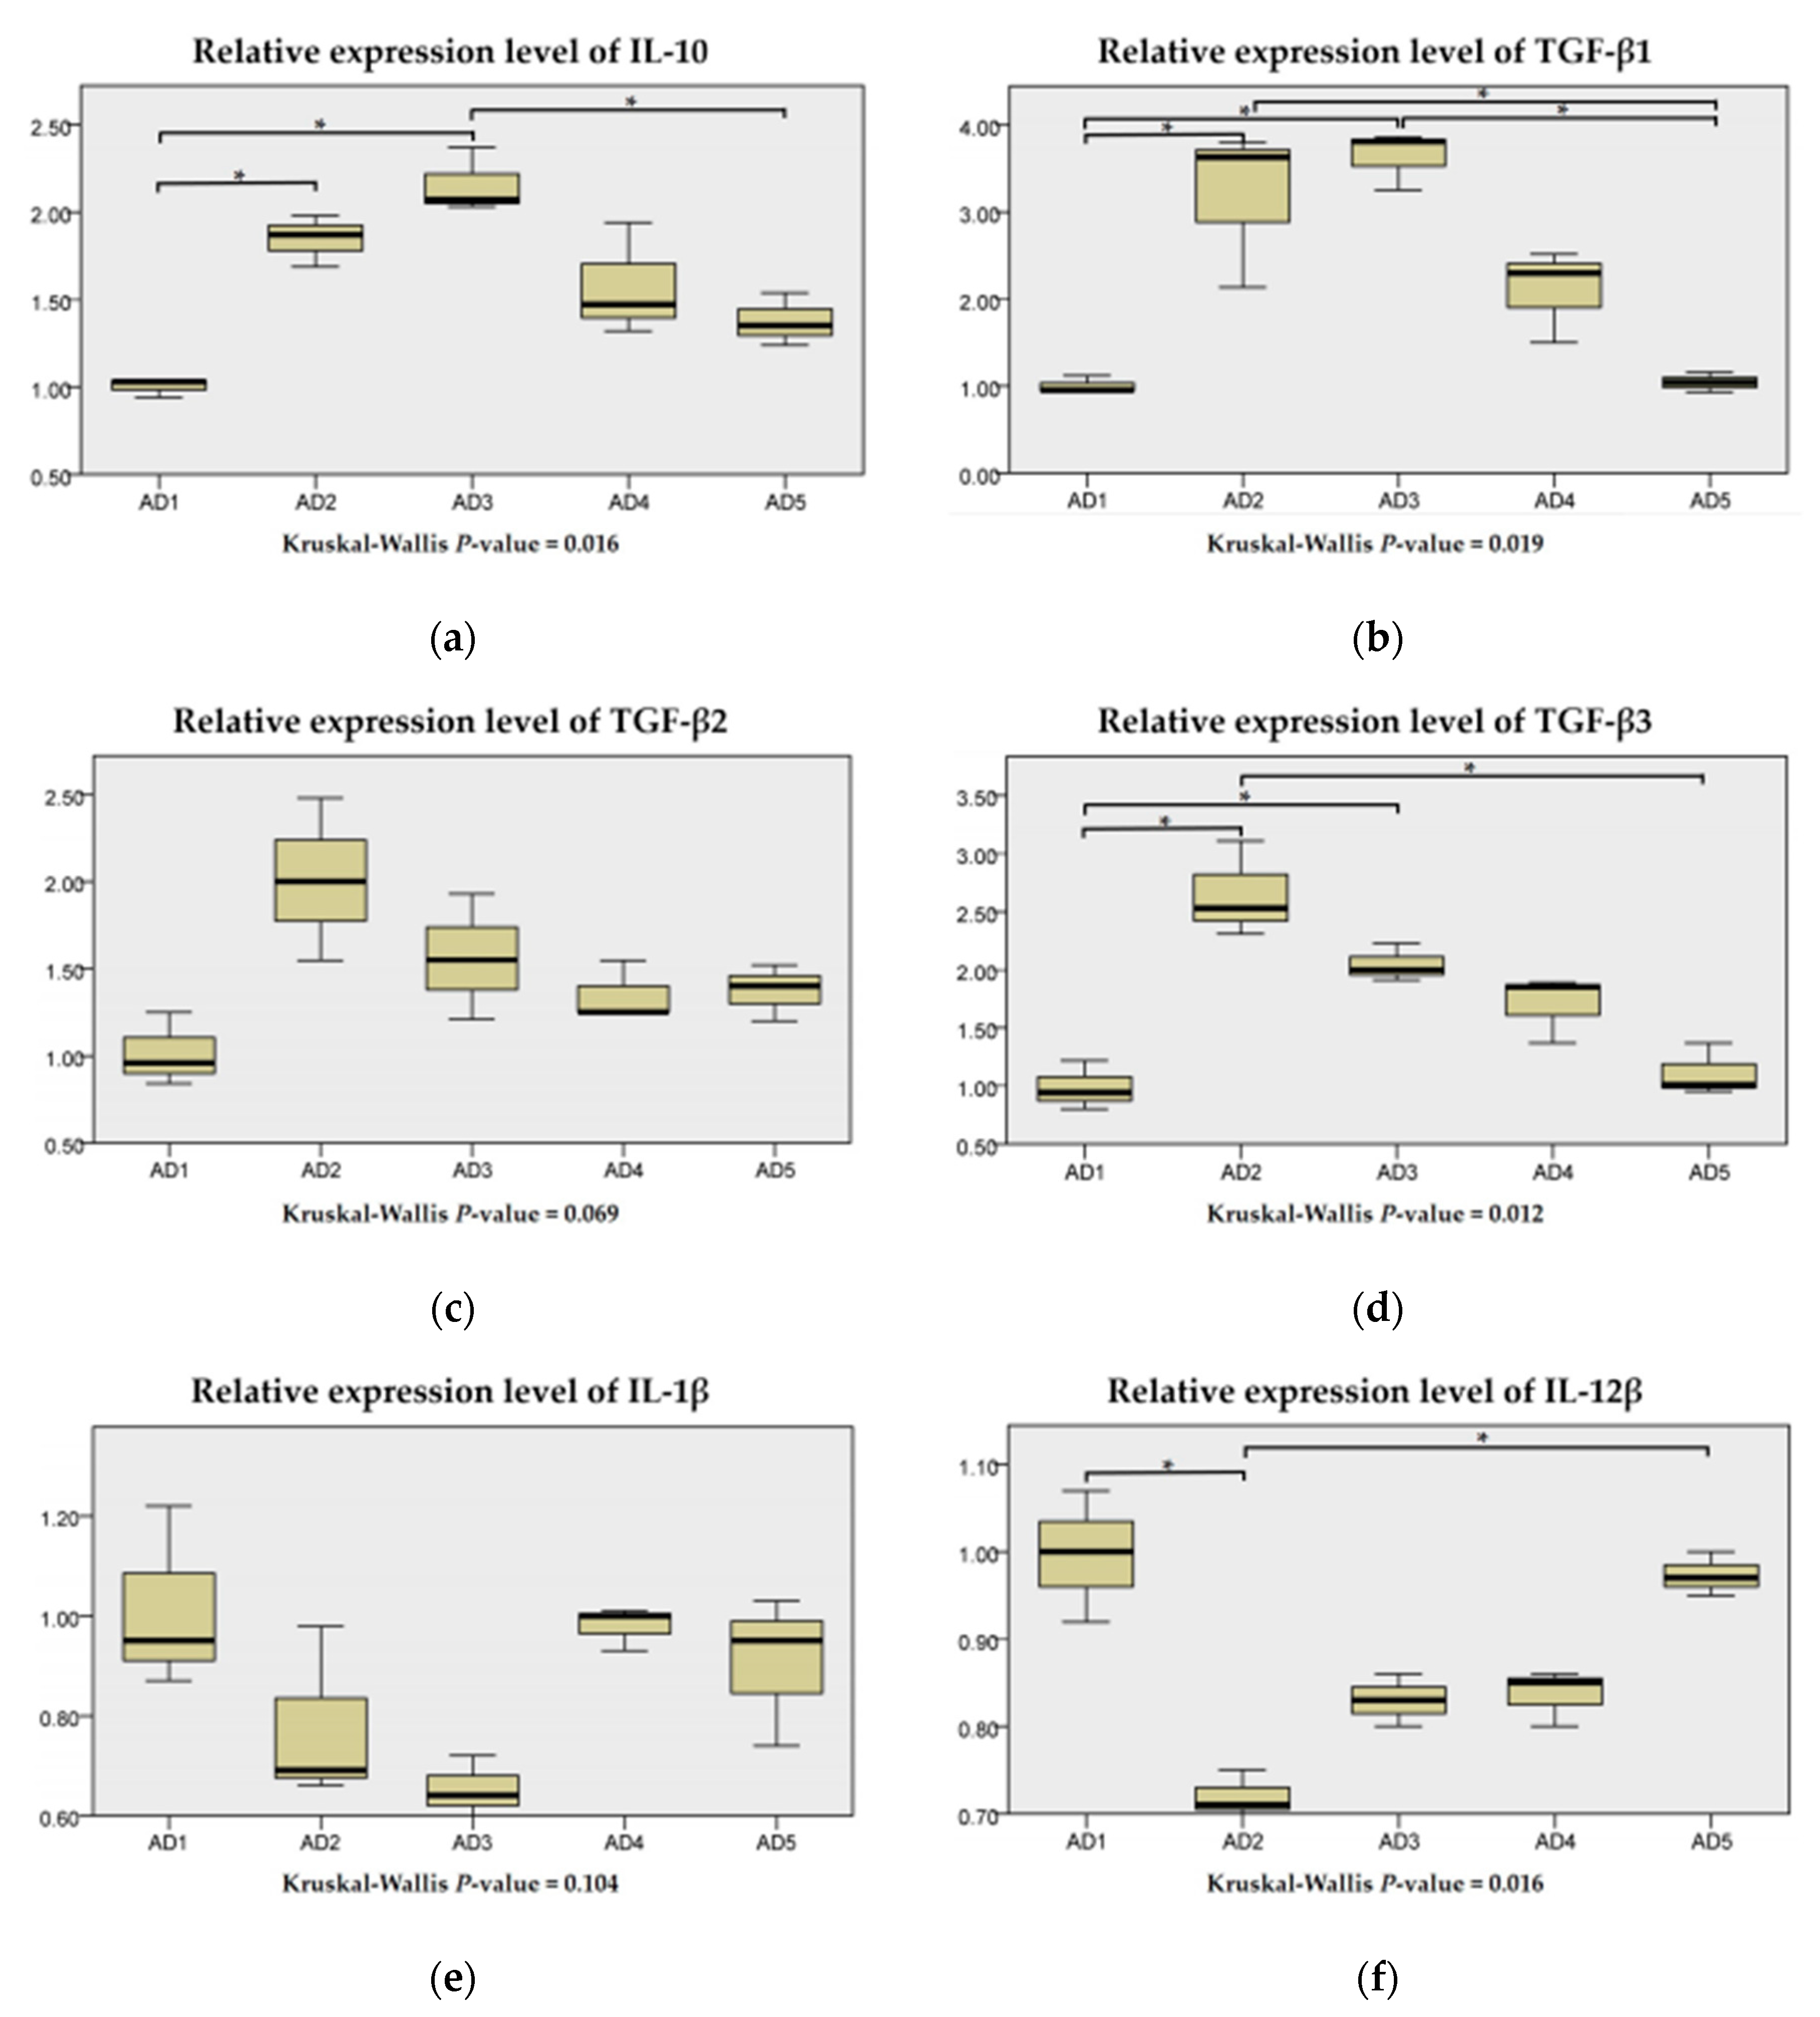
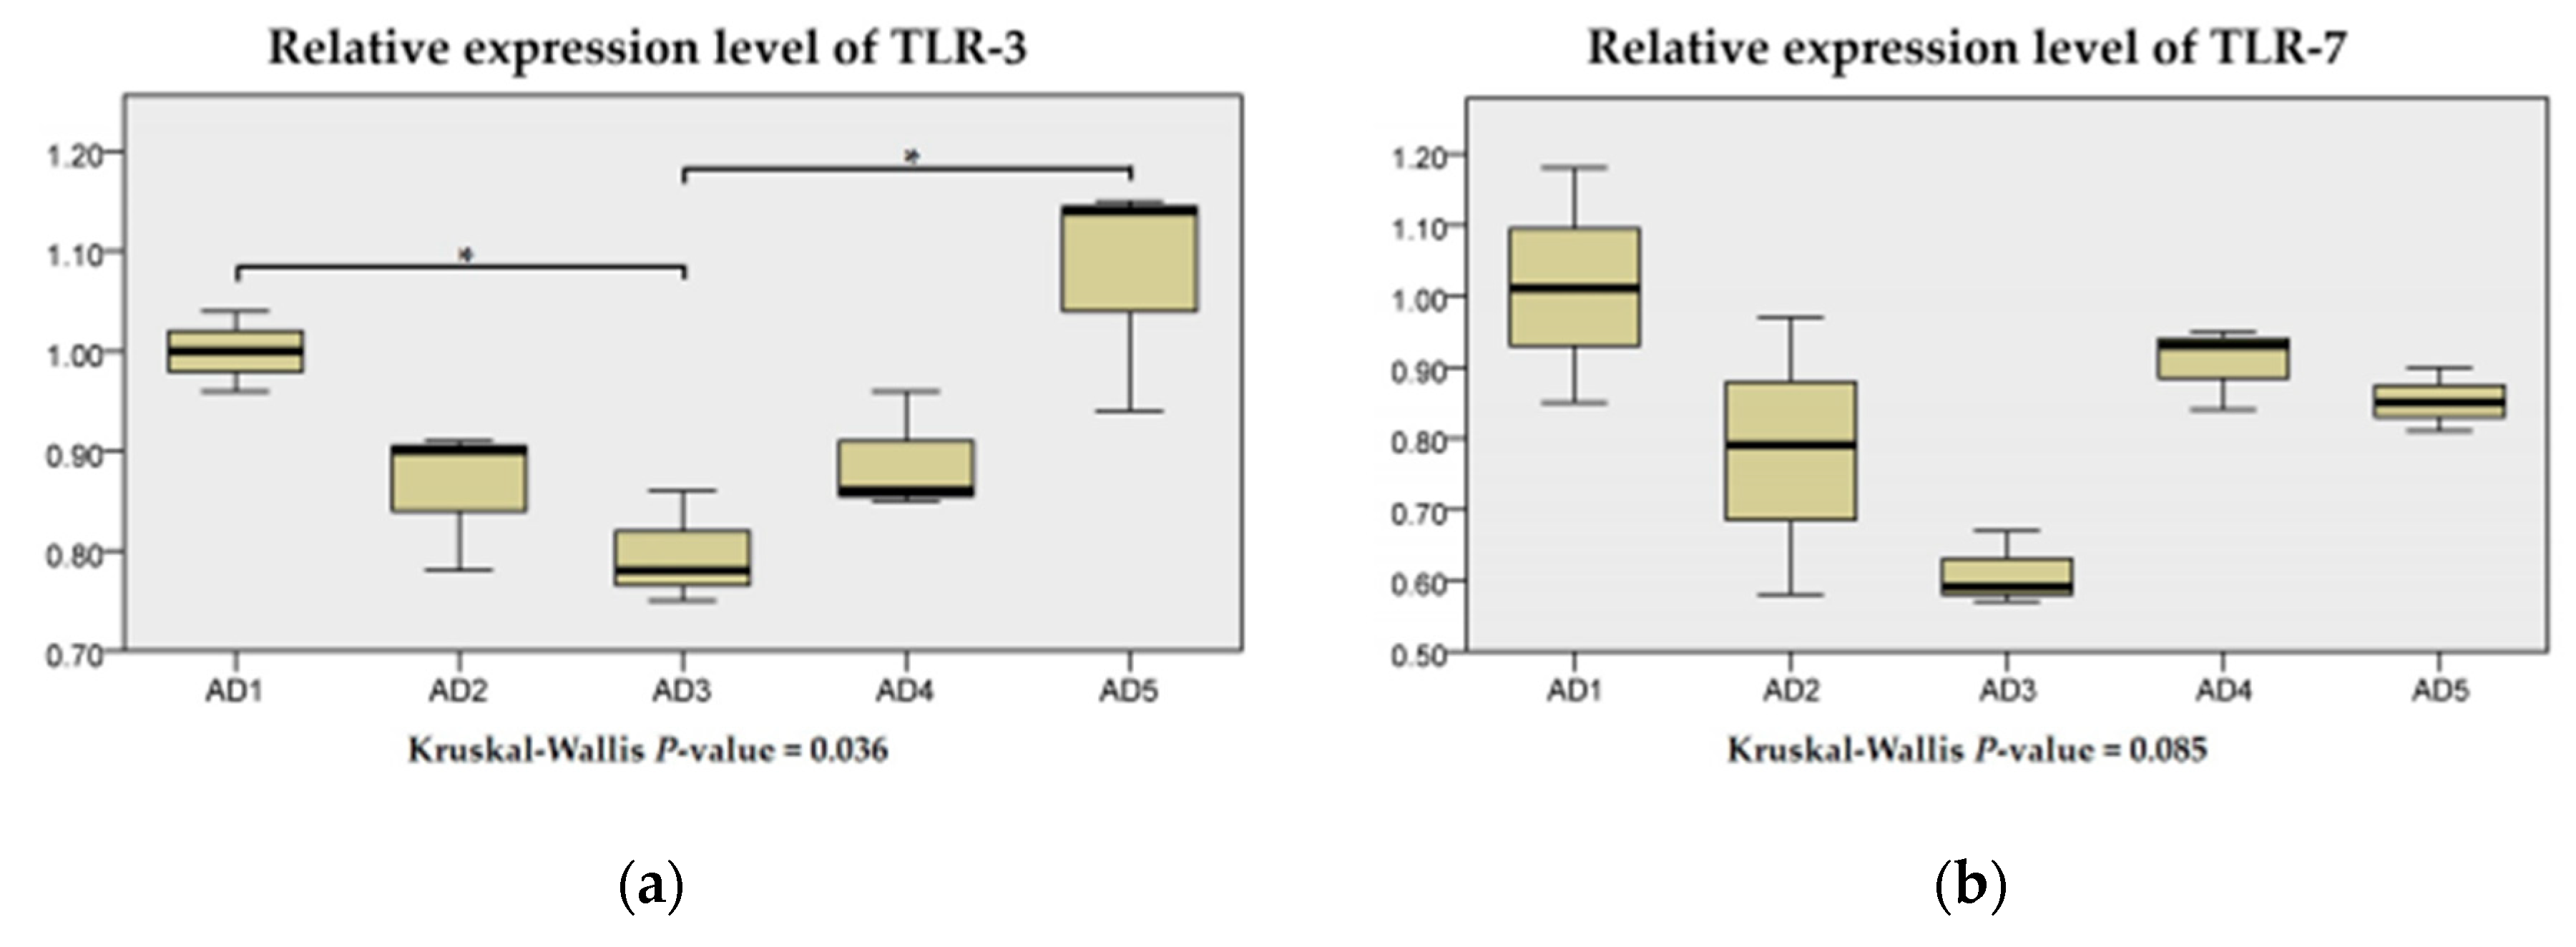
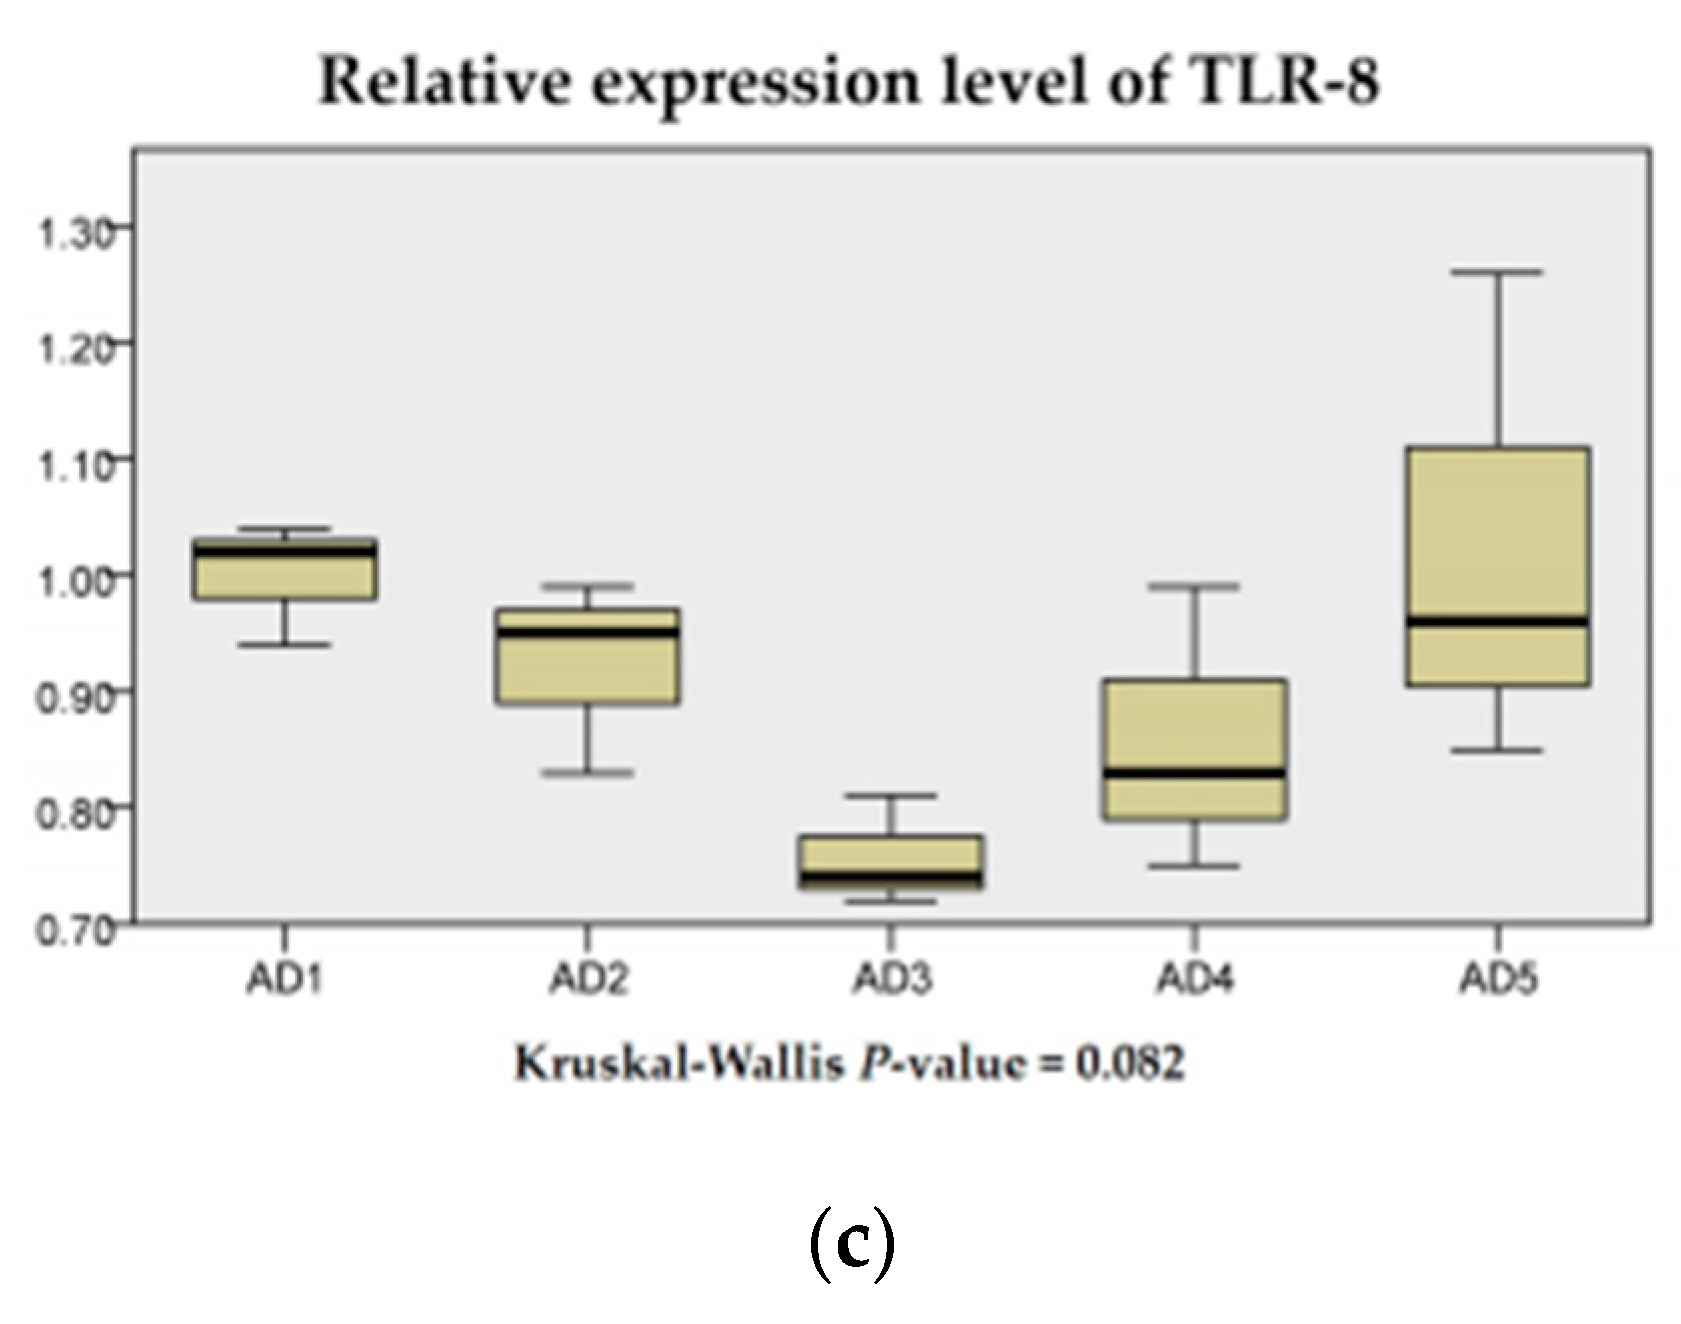
3.7. The mRNA Expression of Inflammation and the TLR Signaling Pathway in the Intestine

As shown in Figure 10, the IL-10, TGF-β1 and TGF-β3 mRNA expression levels in the AD2 and AD3 groups were significantly upregulated compared to the AD1 group (p < 0.05), while the mRNA expression level of IL-12β in the AD2 group was significantly downregulated (p < 0.05). The TGF-β2 and IL-1β mRNA expression levels showed no significant differences between the treatments (p > 0.05). However, the TGF-β2 mRNA expression in the AD2 group was the highest, and the IL-1β mRNA expression level in the AD3 group was the lowest (p > 0.05).
The TLR-3, TLR-7 and TLR-8 mRNA expression levels were the lowest in rice field eel fed the diet with 150 mg/kg andrographolide than those were fed other diets (Figure 11). The TLR-3 mRNA expression level in the AD3 group was significantly downregulated compared to the AD1 and AD5 groups (p < 0.05). With an increase in the andrographolide supplementation level, the TLR-3, TLR-7 and TLR-8 mRNA expression levels were first decreased and then increased.

3.8. Intestinal Microbiology Analysis

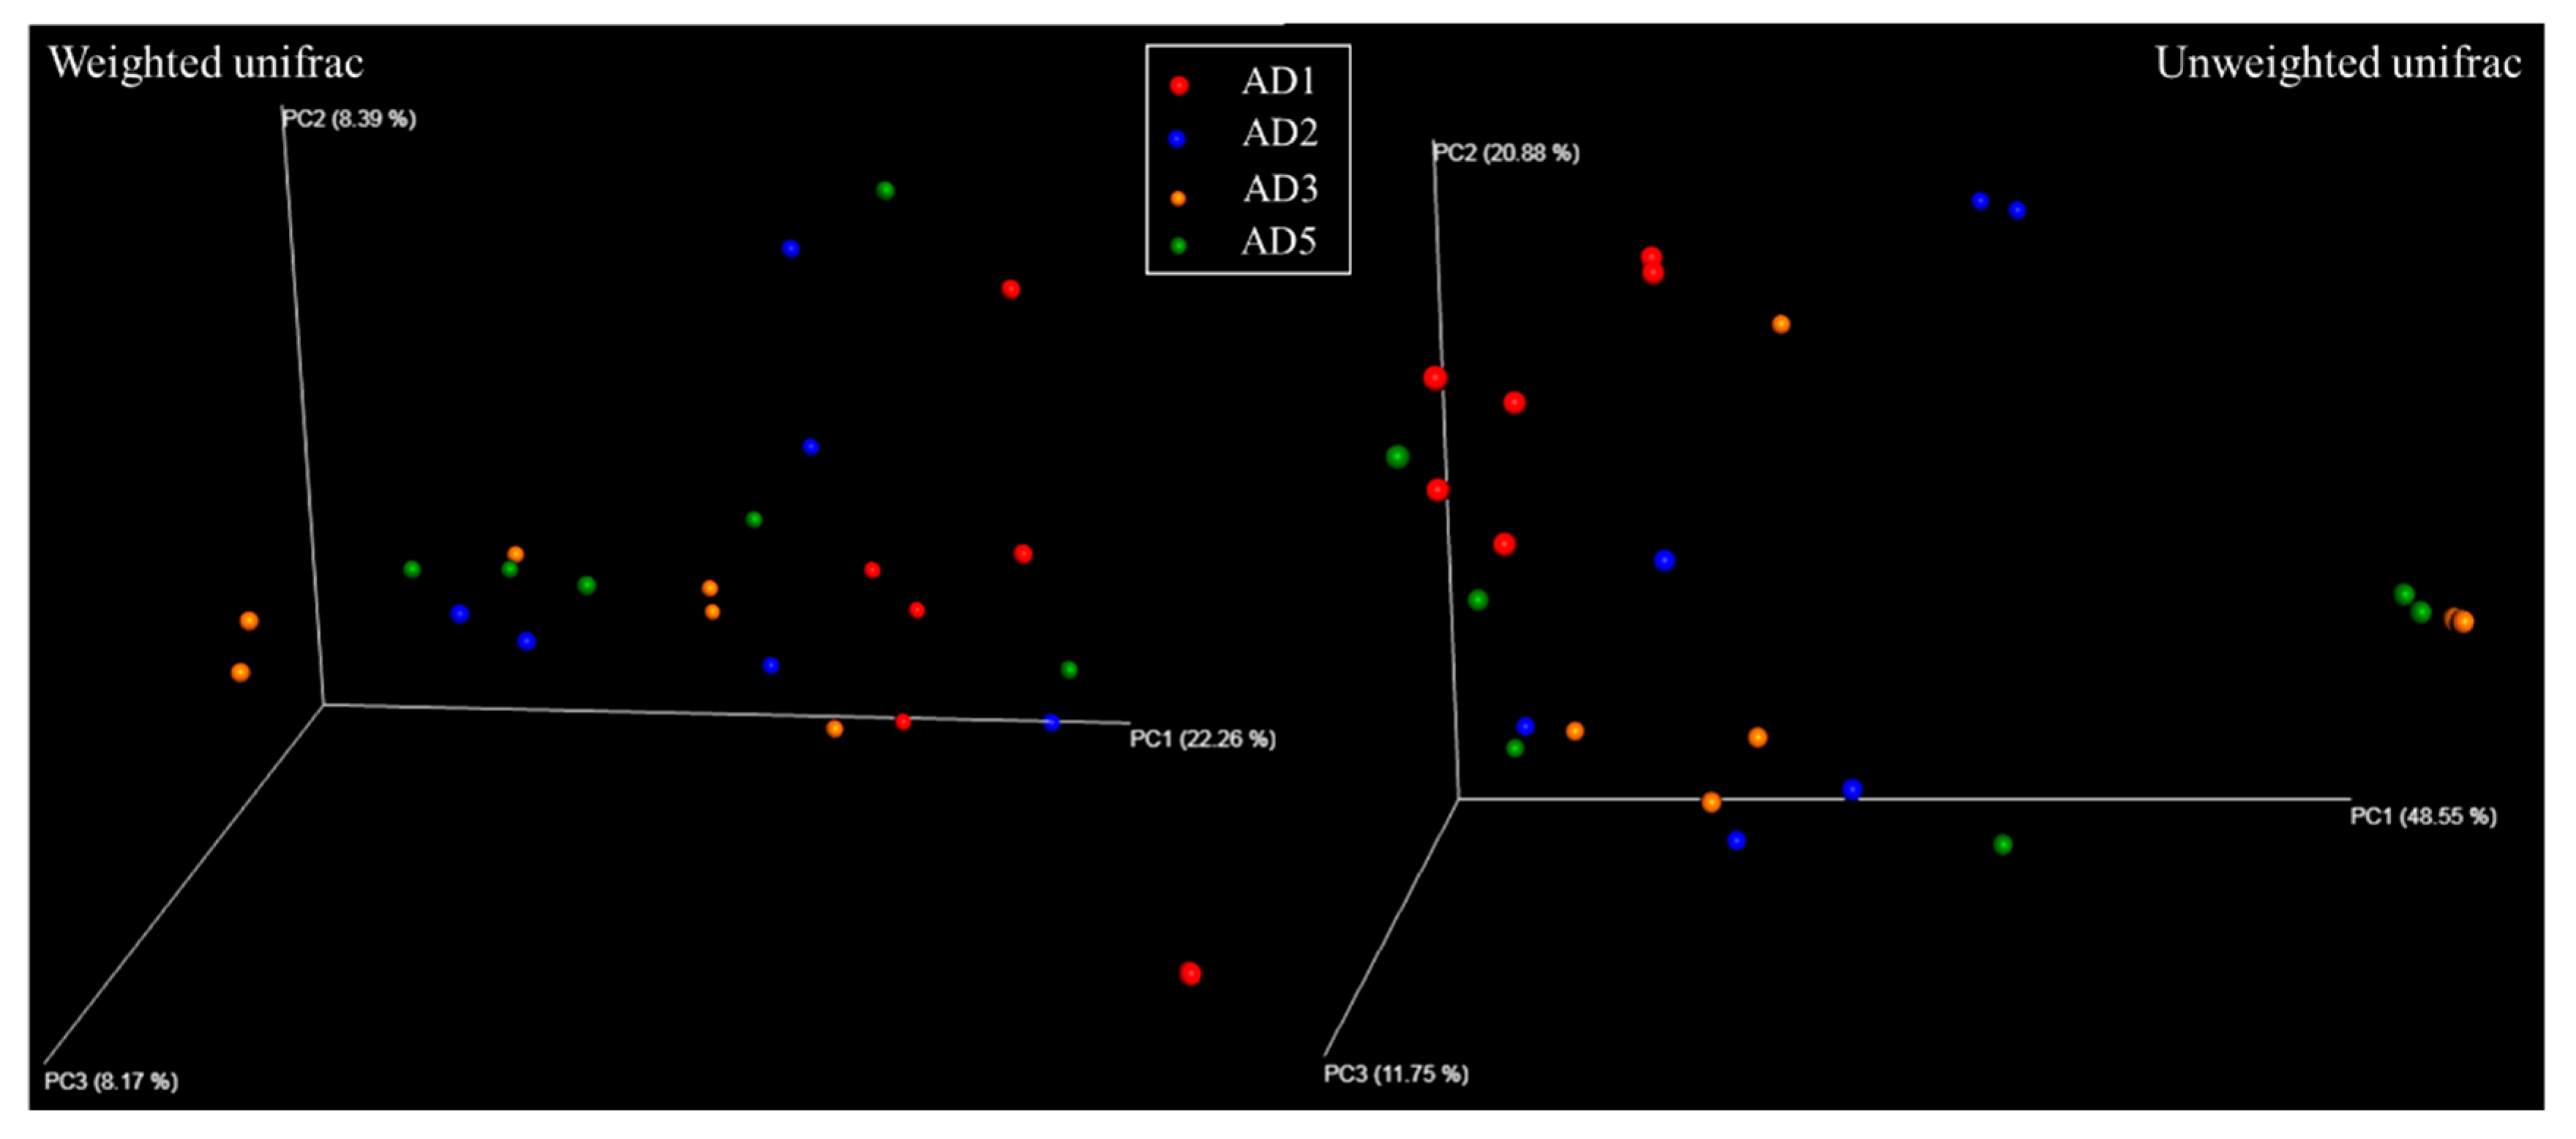
3.8.1. Diversity Analysis

Compared to the AD1 group, the observed species, Chao1, ACE and PD whole tree indices were significantly decreased in the AD2, AD3 and AD5 groups (p < 0.05), and the Shannon index was significantly decreased in the AD2 and AD3 groups (p < 0.05; Table 3).
PCoA based on the weighted and unweighted UniFrac metrics revealed a clear distinction in the microbiota, revealing considerable differences in the AD2, AD3 and AD5 groups compared to the AD1 group (Figure 12). ANOSIM analysis confirmed that the microbial community in the AD2, AD3 and AD5 groups differed significantly from that in the AD1 group (p < 0.05). Moreover, no significant difference was detected between the microbial communities in the AD2, AD3 and AD5 groups (p > 0.05).

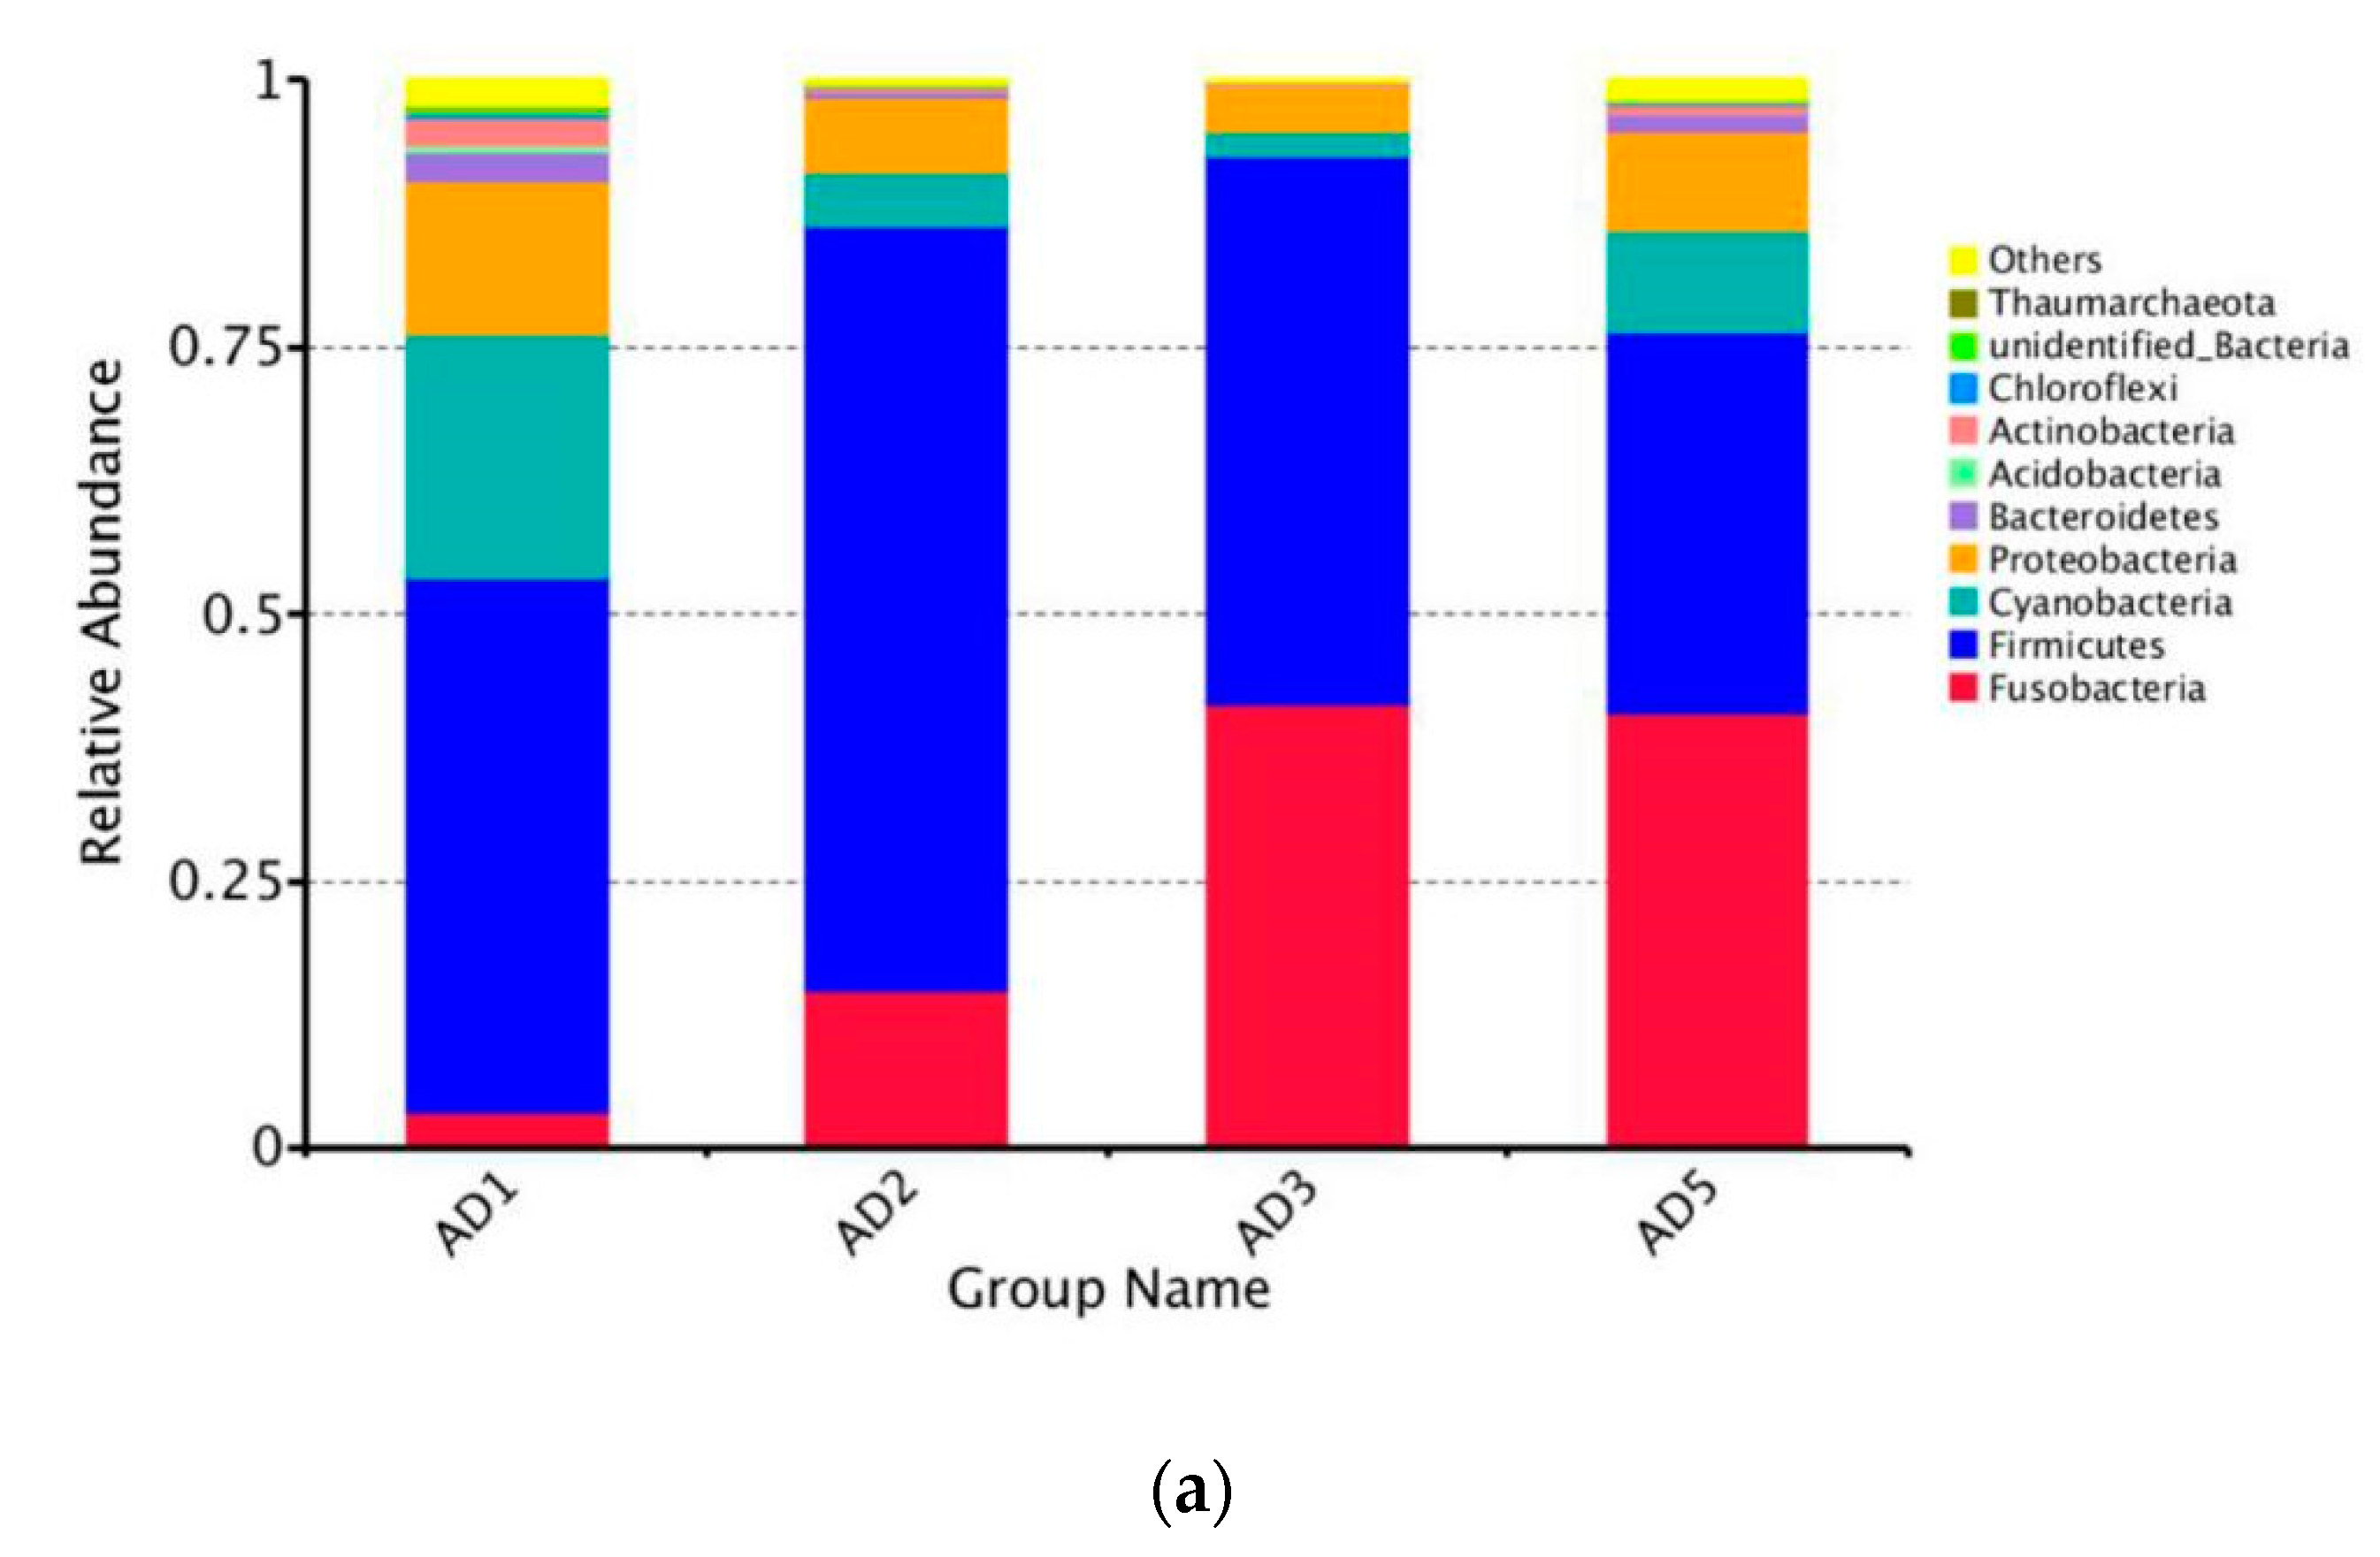
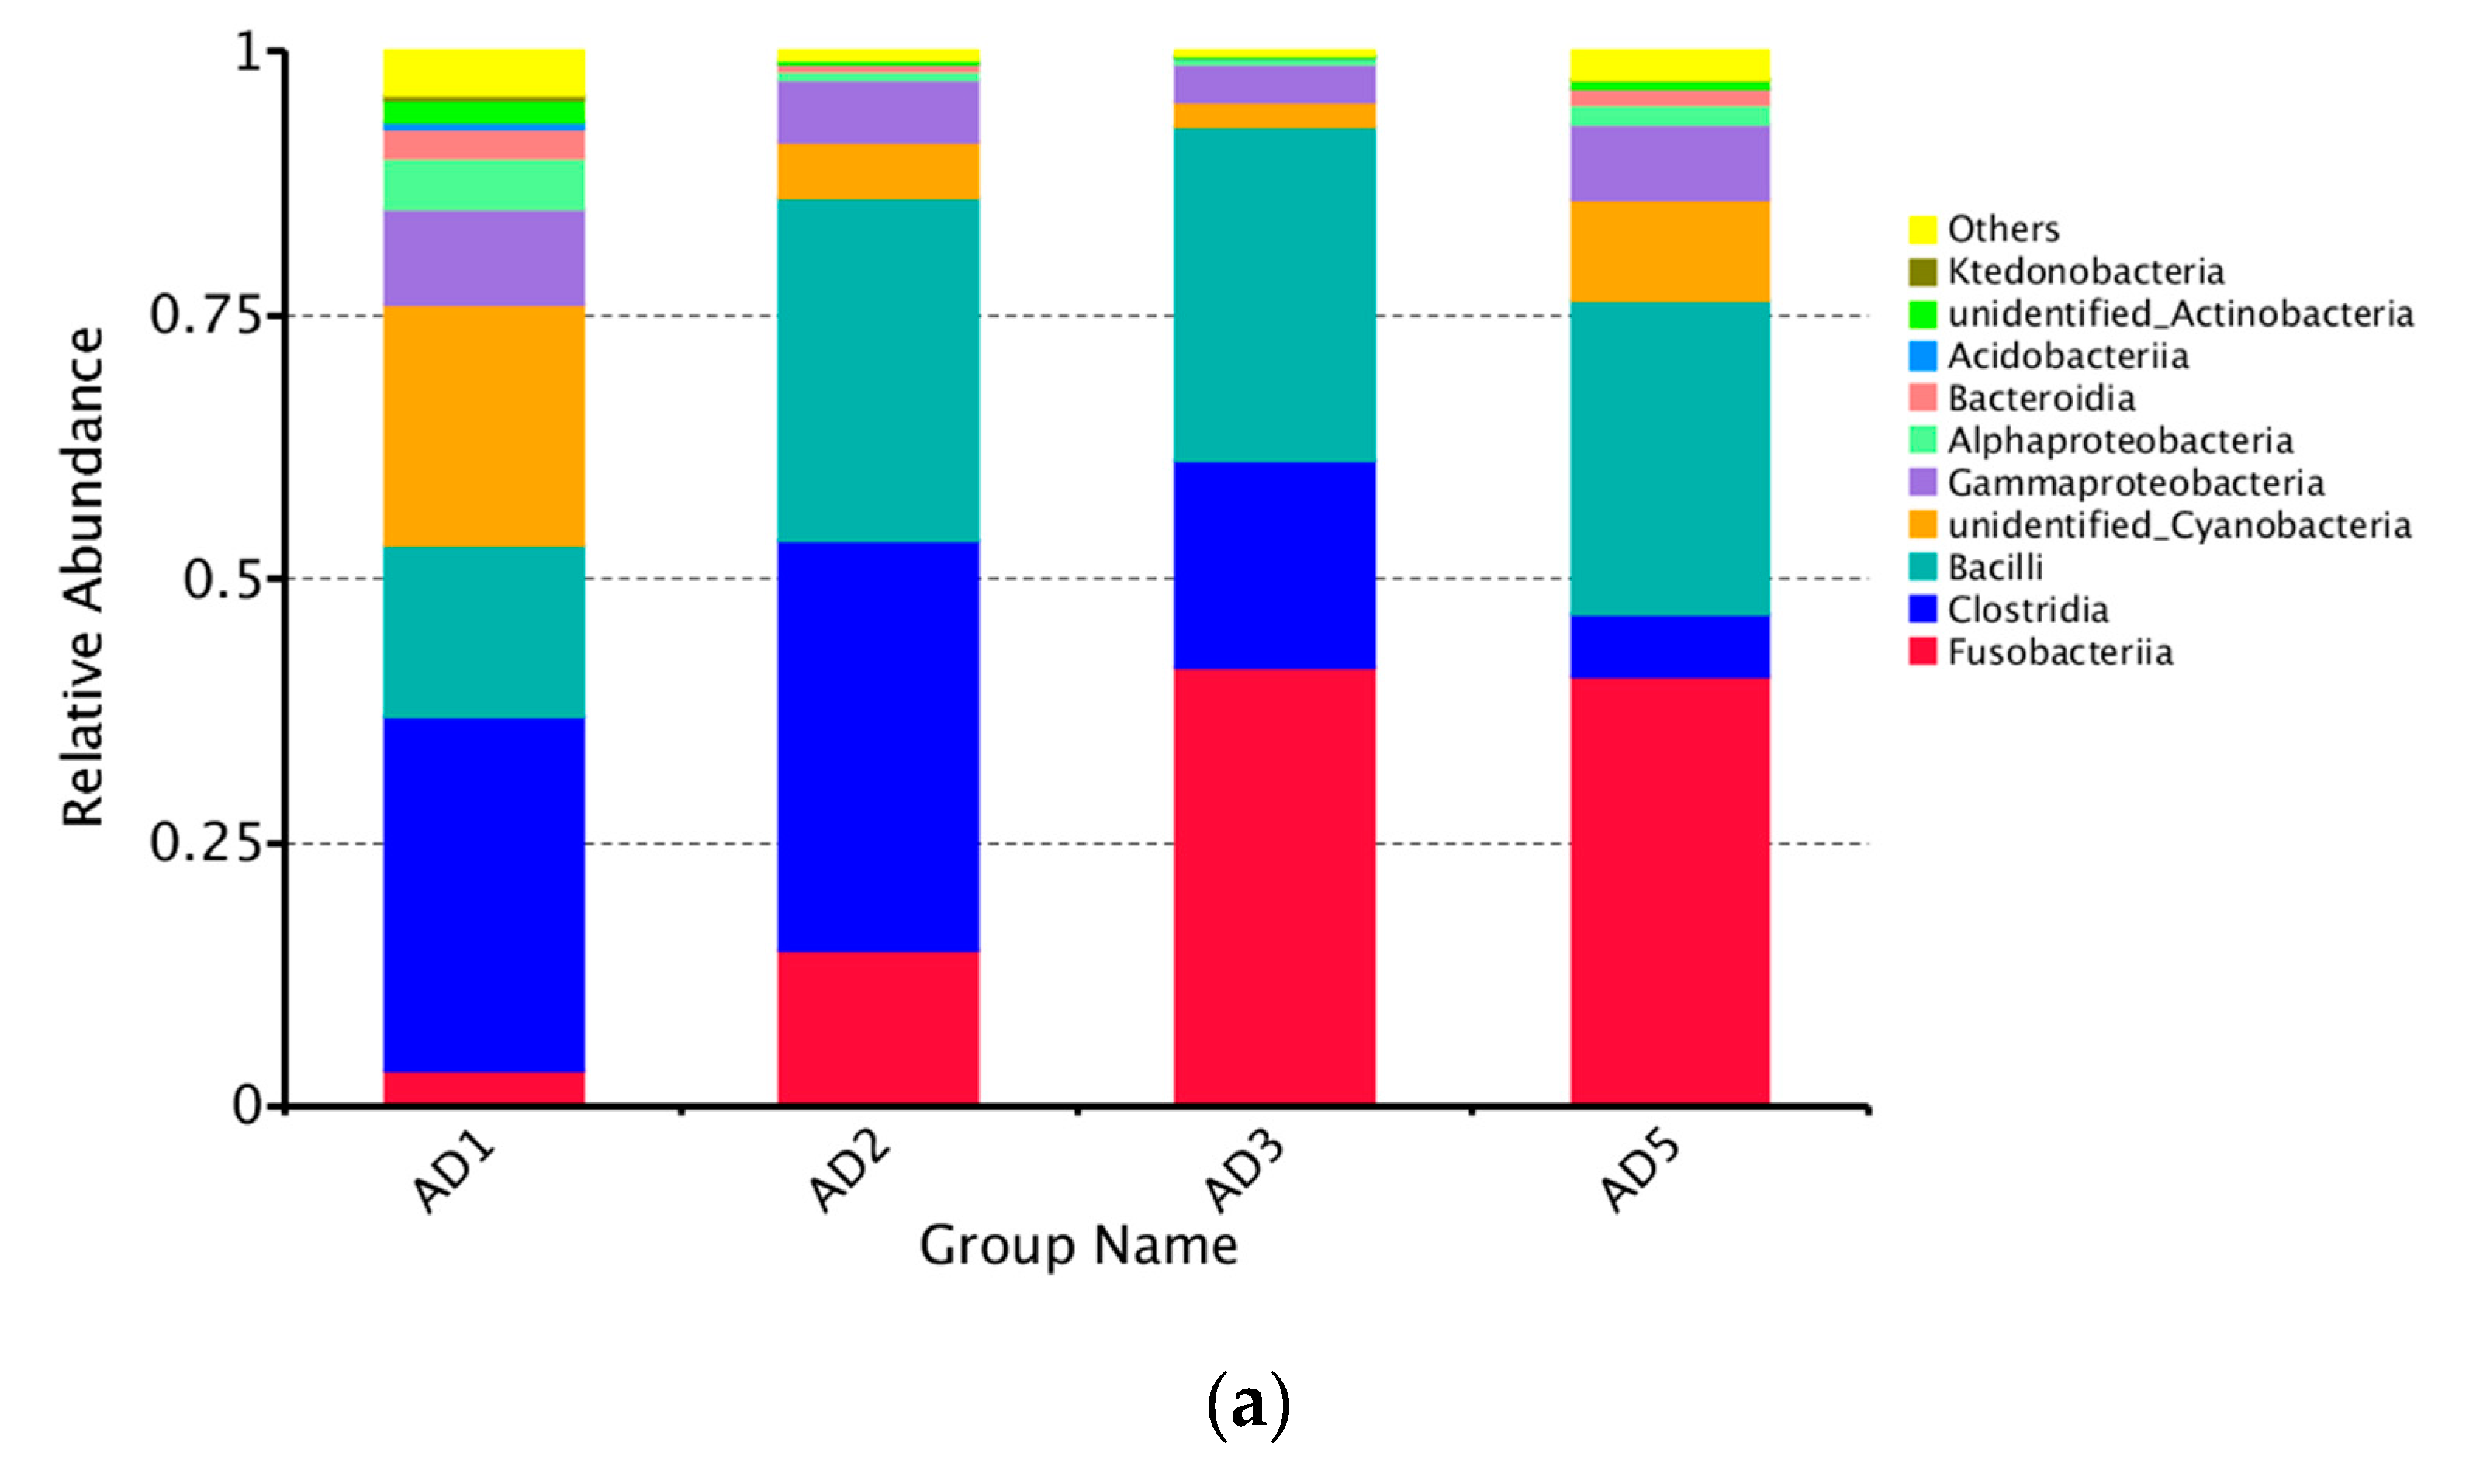
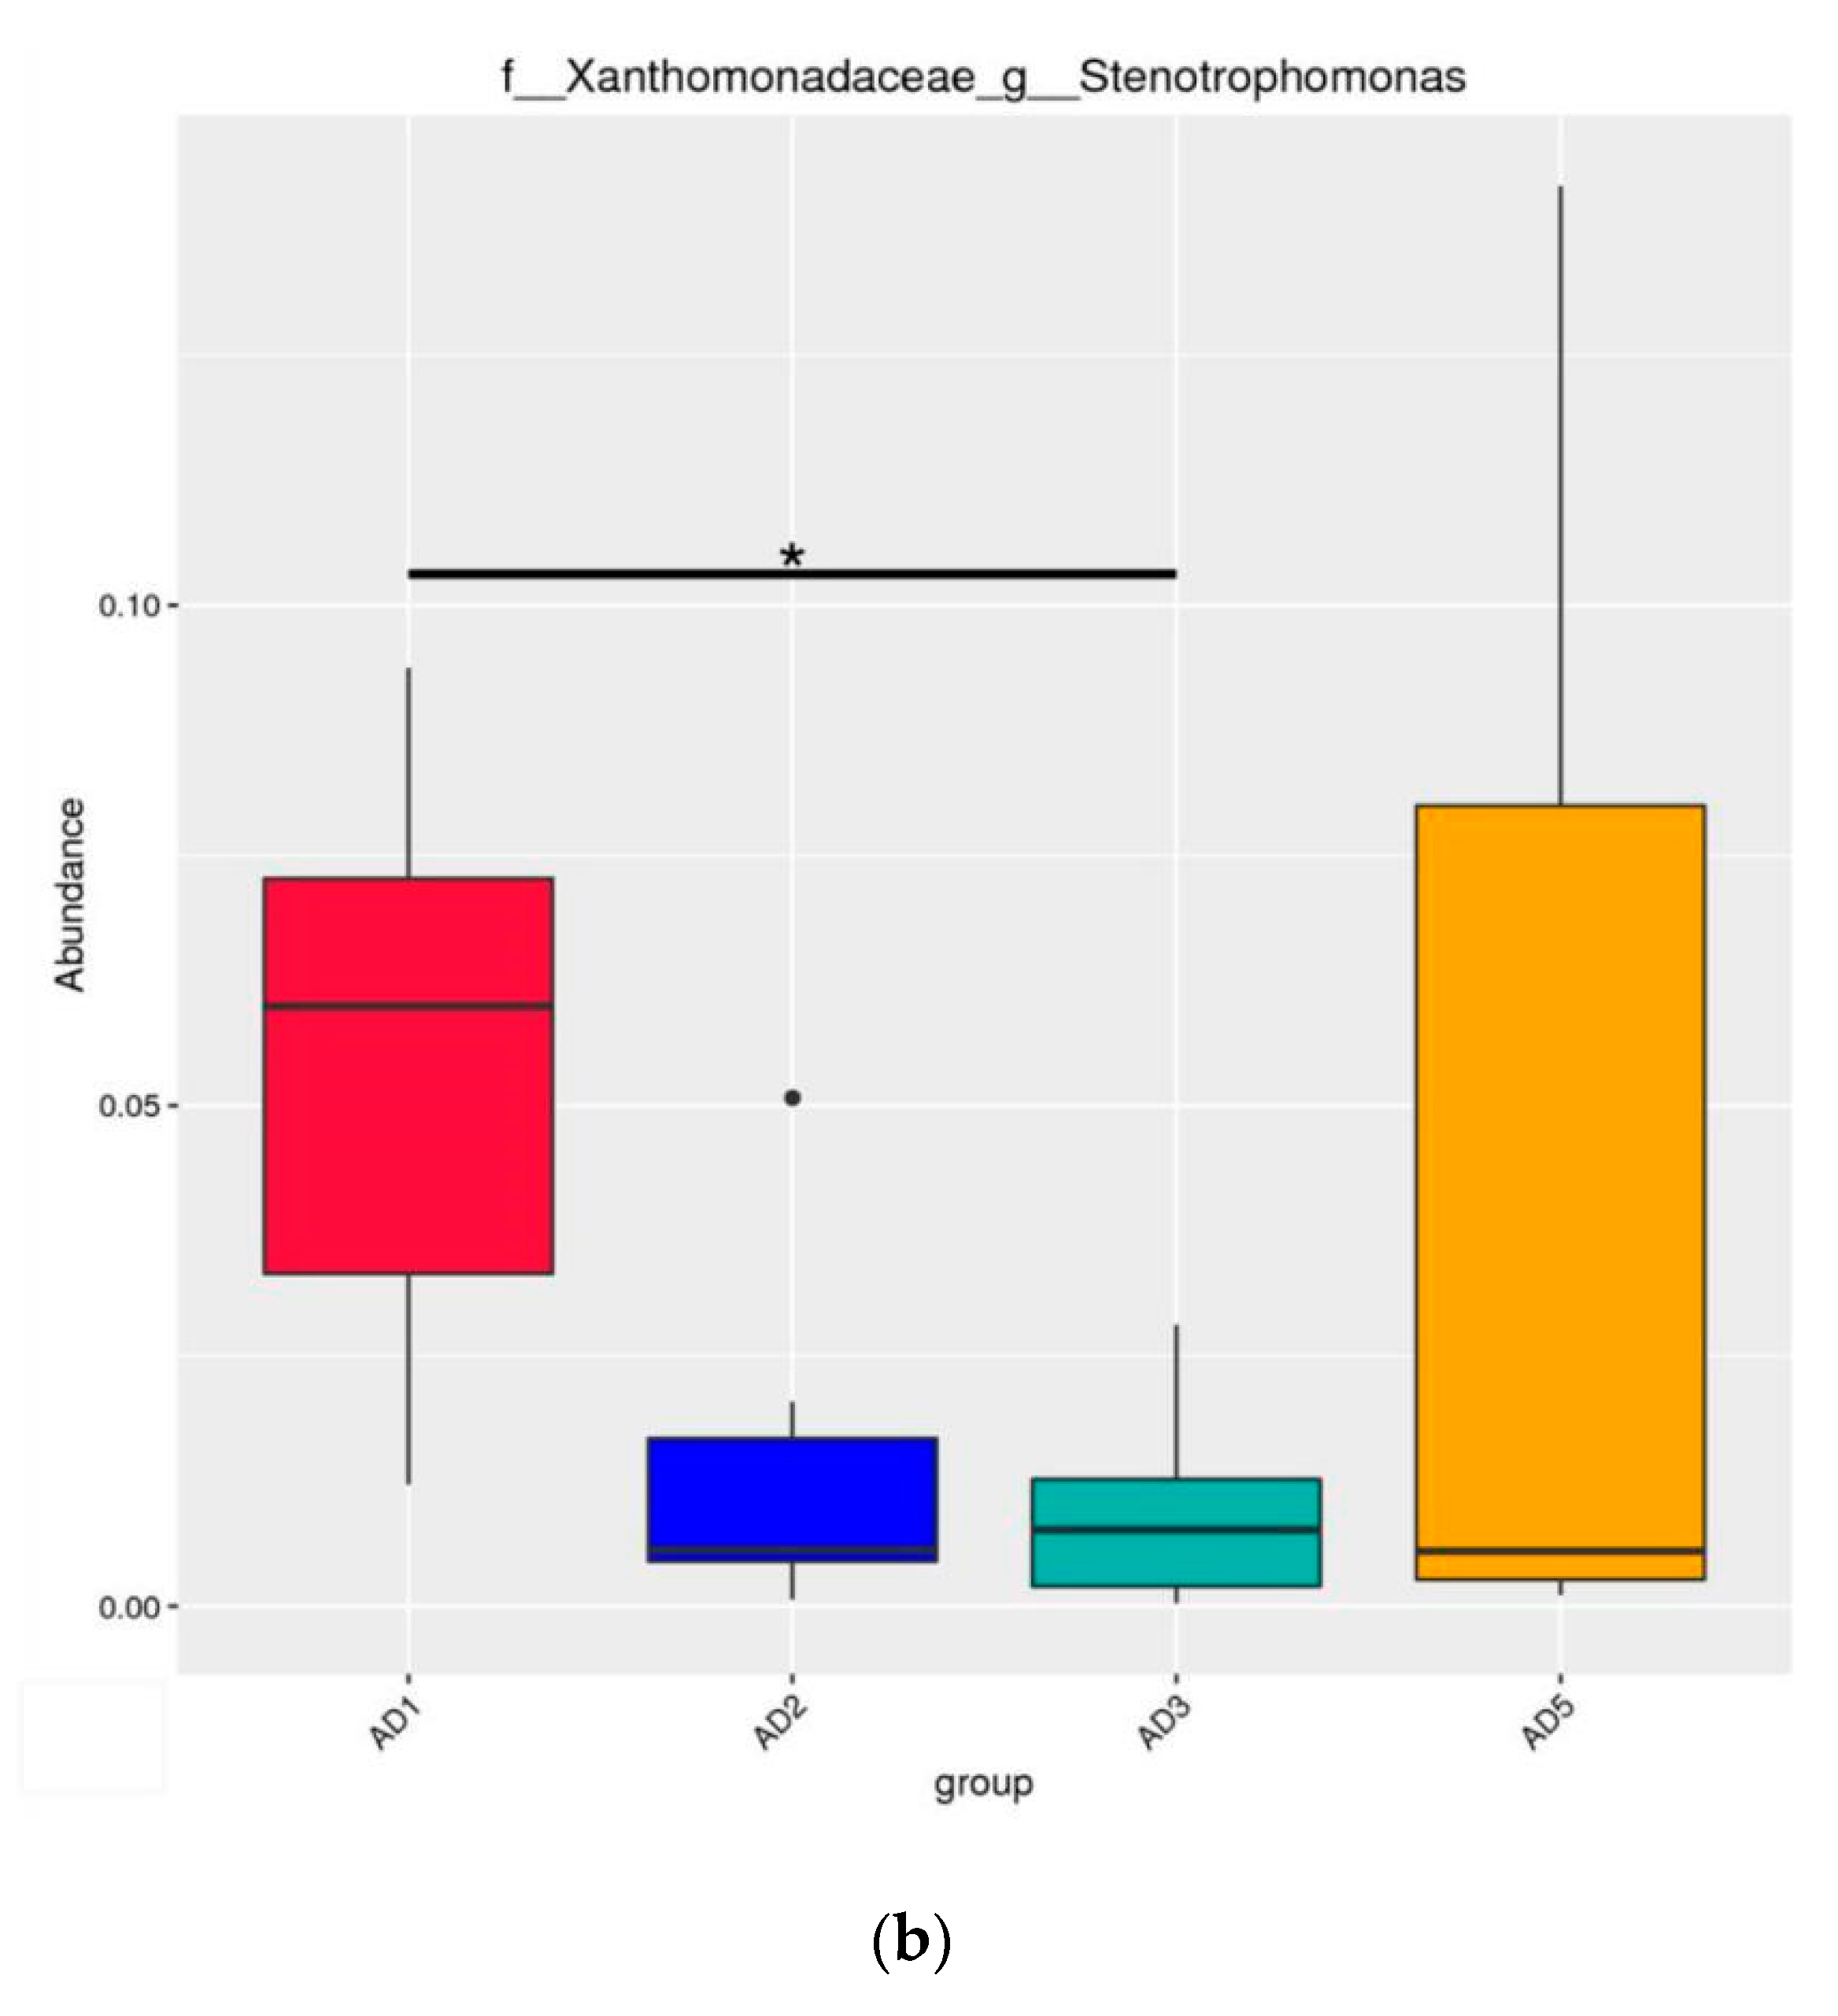
3.8.2. Microbial Composition

At the phylum level, the predominant members of the intestinal microbioma were Firmicutes, Fusobacteria, Cyanobacteria and Proteobacteria (Figure 13a). Among the experimental groups, the AD2 group exhibited the highest relative abundance of Firmicutes. The relative abundance of Cyanobacteria and Proteobacteria in the AD2 and AD3 groups significantly decreased compared to the AD1 group (p < 0.05) (Figure 13b). Specifically, Clostridia, Bacilli and unidentified Cyanobacteria predominated in the AD1 group, and Clostridia, Fusobacteriia and Bacilli predominated in the AD2, AD3 and AD5 groups (Figure 14a). Compared to the AD1 group, the AD2, AD3 and AD5 groups exhibited higher percentages of Fusobacteriia and Bacilli and lower percentages of unidentified Cyanobacteria, Gammaproteobacteria and Alphaproteobacteria. The relative abundance of Stenotrophomonas in the AD2 and AD3 groups was significantly lower than that in the AD1 group (p < 0.05; Figure 14b).

4. Discussion

A large number of documents have shown that herbs and natural plants improved growth performance, enhanced immunity and increased disease resistance in aquaculture [43,44,45]. The present study demonstrated that diets supplemented with 75–150 mg/kg andrographolide increased growth and decreased the feed conversion rate in M. albus. The fish growth is closely related to intestinal digestion and absorption capacity [46,47]. The intestinal morphological characteristics of fish include villus length, muscular thickness and goblet cell numbers. Villus length and muscular thickness are important indicators for measuring the efficiency of intestinal digestion and absorption [48]. In the present study, dietary andrographolide increased villus length, muscular thickness and the number of goblet cells. Another indicator that can reflect the ability to digest and absorb nutrients is intestinal digestive enzyme activities [49]. Our results showed that adding andrographolide to the feed enhanced the activity of digestive enzymes in the intestinal tract of M. albus. These data demonstrated that andrographolide improved the intestinal digestive and absorptive capacity, paralleled with the increased weight gain rate.
Unexpectedly, the weight gain rate of M. albus was lower than that of the control group when the content of andrographolide was over 150 mg/kg, although this difference was not significant. Consistent with the results of the present experiment, weight gain rate of Hamilton (L. rohita) [22] first increased and then decreased with increasing amounts of andrographolide. Because of the degeneration of the eel eye, the fish mainly depends on their sensitive sense of smell to find food [50]. Because andrographolide has a bitter odor [51], adding high concentrations of andrographolide to the diet will affect the feed intake of M. albus, leading to the decline in the growth performance.
Normally, ROS are produced during the metabolic progress [52]. When the ROS accumulate beyond the body scavenging ability, oxidative stress occurs [53]. To alleviate the oxidative stress of the body, fish have developed evolutionarily complete antioxidant enzyme systems (such as SOD, CAT, GPx, GR and GST), and antioxidants (such as GSH) to reduce the body’s redox [54,55]. Our results demonstrated that the addition of andrographolide enhanced the antioxidant ability, manifested by the decrease contents of ROS and MDA and the increased activities of SOD, CAT, GPx, GST, GSH, GPx and GR in the liver. A similar result was found that andrographolide can reduce the production of ROS in RAW264.7 cells [15]. In addition, andrographolide is used to counteract the damage to chondrocytes caused by H2O2. It has been found that andrographolide can reduce the oxidative stress injury of chondrocytes by increasing antioxidant enzyme activities (i.e., SOD and CAT) and reducing ROS in articular cartilage cells [56]. It is well known that the Nrf2/Keap1 signaling pathway regulates the mRNA expression levels of antioxidant enzymes genes [28,57]. In this study, it was found that the appropriate level of andrographolide significantly upregulated the mRNA levels of Nrf2 and its targeted genes SOD1, GSTK and GSTO in the liver. Keap1 inhibits nuclear translocation by binding to Nrf2, thereby inhibiting the antioxidant gene expression [58]. In this study, 150–225 mg/kg andrographolide significantly downregulated the mRNA levels of Keap1 in the liver, suggesting that the upregulated expressions of antioxidant genes of andrographolide may be related to the promotion of Nrf2 nuclear transposition through the reduction in Keap1 expression. However, how andrographolide affects the expression of these signaling molecules has not been reported, and further studies are needed.
Intestinal inflammation is a biological response, which is usually triggered by exogenous substances and products of tissue damage and characterized by the production of proinflammatory cytokines and the recruitment and activation of immune cells [59]. In turn, the produced cytokines play an important role in regulating intestinal inflammation in fish. The cytokines in aquatic animals mainly include proinflammatory cytokines (such as IL-1β and IL-12β, etc.) and anti-inflammatory cytokines (such as IL-10 and TGF-β, etc.) [60]. The upregulation of the proinflammatory factors (such as IL-1β), aggravated intestinal inflammation [61]. Studies have shown that andrographolide presents strong anti-inflammatory activity in mice [62]. In the present study, optimal andrographolide supplementation upregulated the mRNA expression levels of IL-10, TGF-β1, TGF-β2 and TGF-β3 and downregulated the mRNA expression levels of IL-1β and IL-12β in the intestine of M. albus, indicating the anti-inflammatory activity. Previous studies have demonstrated that TLRs convert the recognition of intestinal pathogen-associated molecules into signals involved in normal intestine maintaining inflammation under control [63]. TLRs are crucial pathogen recognition receptors in vertebrates. In this study, optimal andrographolide supplementation downregulated the mRNA expression levels of TLR-3, TLR-7 and TLR-8 in the intestine of M. albus. Previous studies have demonstrated that the activation of the TLR signaling pathway leads to increased proinflammatory cytokines (such as IL-1β) and decreased anti-inflammatory cytokines (such as IL-10) [64]. Therefore, this study indicated that the downregulation of proinflammatory cytokines by andrographolide might occur via suppression of the TLR pathway in the intestine.
The reduction in inflammatory response may be related to the improvement of the intestinal physical barrier and the prevention of pathogen invasion by andrographolide. The close junction of the fish intestinal tract is the first physical barrier to prevent pathogen invasion, which is very important to ensure the intestinal health of fish [65]. The tight junction proteins between fish cells are mainly divided into two major categories: cytoplasmic proteins (such as ZOs) and transmembrane proteins (such as Occludin and Claudins) [66]. Studies in fish have found that upregulation of occludin, ZO-1 and ZO-2 mRNA levels stabilize intercellular structural integrity, while upregulation of Claudin-12 and Claudin-15 mRNA levels disrupts the structural integrity of cells [67]. In this study, the addition of andrographolide significantly upregulated Occludin mRNA level and downregulated Claudin-15 mRNA level in the intestine of M. albus. Among other plant extracts, it has been found that the addition of sanguinarine upregulated Claudin, Occludin and ZO-1 mRNA levels in the intestine, and improved the barrier function of the tightly connected gut of Ctenopharyngodon idellus [38]. Therefore, these results indicated that andrographolide improved the intestine physical barrier by upregulating tight junction protein gene expression in M. albus.
The fish intestinal microbioma plays a crucial role in host health by stimulating the development of the immune system, enhancing in nutrient acquisition and competitively inhibiting opportunistic pathogens [68]; therefore, the microbioma is critical for intestinal health. Studies have shown that intestinal health is determined by complex microbial interactions and the interaction between the microbioma and the host intestinal system [69]. In addition, the establishment of a healthy intestinal microbioma is helpful for improving the production performance of aquatic animals. In this study, the control and experimental groups of M. albus shared the same dominant intestinal microbioma (including Firmicutes, Fusobacteria, Cyanobacteria and Proteobacteria). This result is similar to previous research in M. Albus [70]. Nevertheless, the addition of andrographolide was shown to distinctly increase the percentages of Fusobacteria and Firmicutes, concurrent with a significant decrease in those of Cyanobacteria and Proteobacteria. An increased proportion of Fusobacteria and Firmicutes is beneficial to intestinal health [71]. Proteobacteria are Gram-negative bacteria, and the outer membrane is mainly composed of lipopolysaccharides. Studies have shown that Proteobacteria represent a microbial signature of dysbiosis in the intestinal microbioma [72]. In addition, it was found at the genus level that the addition of andrographolide significantly inhibited the abundance of Stenotrophomonas. Stenotrophomonas are Gram-negative bacteria that are conditional pathogens [73]. These uncommon bacteria are highly antibiotic-resistant. The above results indicate that andrographolide has a certain improvement effect on the intestinal microbial composition of M. albus. In addition, studies have shown that high diversity and complex microbial communities contribute to the health of human and animal hosts [28,74]. However, compared with the AD1 group, the experimental groups (AD2, AD3 and AD5) showed significant decreases in the observed species Chao1, ACE and Shannon indices, which indicated that andrographolide can reduce the diversity of the intestinal microbioma. A possible reason for this finding is that andrographolide has a strong antibacterial effect that reduces the types of harmful bacteria in the intestinal tract of the fish and increases the richness of the dominant microbioma, thereby reducing species diversity [75]. Therefore, the addition of andrographolide to feed can increase the dominant microbioma and, thus, enhance the homeostasis of the intestinal microbioma.

5. Conclusions

Our results showed that the diets supplemented with andrographolide significantly improved growth performance, enhanced antioxidant capacity, regulated the intestinal physical barrier and microbioma of M. albus. Additionally, adding low-dose andrographolide (75 and 150 mg/kg) is more effective. In addition, dietary supplementation of andrographolide upregulated anti-inflammatory cytokines and downregulated proinflammatory cytokines in the intestine. The anti-inflammatory function of andrographolide may be related to the suppression of the TLR signaling pathway. These results can provide the valuable data for future rice field eel feeds.

Author Contributions

Conceptualization, Y.S. and L.Z.; methodology, Y.L. (Yanli Liu); software, Y.S.; validation, Y.L. (Yanli Liu); formal analysis, J.Z.; investigation, Z.L.; resources, Y.L. (Yao Li); data curation, Y.S. and L.Z.; writing—original draft preparation, Y.S.; writing—review and editing, Y.H.; visualization, L.Z.; supervision, Y.H.; project administration, Y.H.; funding acquisition, Y.H. All authors have read and agreed to the published version of the manuscript.

Funding

This study was supported by the “National Natural Science Foundation of China (No. 31572626)” and “Key Research and Development Project of Hunan Province (2017NK2302)”.

Acknowledgments

We thank Bo Zhu, Changbao Che, Xiaoli Cao, Ziqin Wang and Bin Geng for their help in diet production and sampling.

Conflicts of Interest

The authors declare no conflict of interest.

References

  1. Ma, X.; Hu, Y.; Wang, X.Q.; Ai, Q.H.; He, Z.G.; Feng, F.X.; Lu, X.Y. Effects of practical dietary protein to lipid levels on growth, digestive enzyme activities and body composition of juvenile rice field eel (Monopterus albus). Aquacult. Int. 2014, 22, 749–760. [Google Scholar] [CrossRef]
  2. Casewell, M.; Friis, C.; Marco, E.; McMullin, P.; Phillips, I. The European ban on growth-promoting antibiotics and emerging consequences for human and animal health. J. Antimicrob. Chemother. 2003, 52, 159–161. [Google Scholar] [CrossRef] [PubMed] [Green Version]
  3. Defoirdt, T.; Boon, N.; Sorgeloos, P.; Verstraete, W.; Bossier, P. Alternatives to antibiotics to control bacterial infections: Luminescent vibriosis in aquaculture as an example. Trends Biotechnol. 2007, 25, 472–479. [Google Scholar] [CrossRef] [PubMed] [Green Version]
  4. Parisien, A.; Allain, B.; Zhang, J.; Mandeville, R.; Lan, C.Q. Novel alternatives to antibiotics: Bacteriophages, bacterial cell wall hydrolases, and antimicrobial peptides. J. Appl. Microbiol. 2008, 104, 1–13. [Google Scholar] [CrossRef]
  5. Liu, B.; Ge, X.; Xie, J.; Xu, P.; He, Y.; Cui, Y.; Ming, J.; Zhou, Q.; Pan, L. Effects of anthraquinone extract from Rheum officinale Bail on the physiological responses and HSP70 gene expression of Megalobrama amblycephala under Aeromonas hydrophila infection. Fish Shellfish Immunol. 2012, 32, 1–7. [Google Scholar] [CrossRef] [PubMed]
  6. Ojha, M.L.; Chadha, N.K.; Saini, V.P.; Damroy, S.; Chandraprakash, G.; Sawant, P.B. Effect of ethanolic extract of Mucuna pruriens on growth, metabolism and immunity of Labeo rohita (Hamilton, 1822) fingerlings. Int. J. Fauna Biol. Stud. 2014, 1, 1–9. [Google Scholar]
  7. Sharma, A.; Deo, A.D.; Riteshkumar, S.T.; Ibemcha Chanu, T.; Das, A. Effect of Withania somnifera (L. Dunal) root as a feed additive on immunological parameters and disease resistance to Aeromonas hydrophila in Labeo rohita (Hamilton) fingerlings. Fish Shellfish Immunol. 2010, 29, 508–512. [Google Scholar] [CrossRef]
  8. Zhang, R.; Wan, X.W.; Zhu, J.Y.; Liu, L.L.; Liu, Y.C.; Zhu, H. Dietary sanguinarine affected immune response, digestive enzyme activity and intestinal microbiota of Koi carp (Cryprinus carpiod). Aquaculture 2019, 502, 72–79. [Google Scholar] [CrossRef]
  9. Chang, Z.Q.; Ge, Q.Q.; Sun, M.; Wang, Q. Immune responses by dietary supplement with Astragalus polysaccharides in the Pacific white shrimp, Litopenaeus vannamei. Aquacult. Nutr. 2018, 24, 702–711. [Google Scholar] [CrossRef]
  10. Zanuzzo, F.S.; Sabioni, R.E.; Montoya, L.N.F.; Favero, G.; Urbinati, E.C. Aloe vera, enhances the innate immune response of pacu (Piaractus mesopotamicus) after transport stress and combined heat killed, Aeromonas hydrophila, infection. Fish Shellfish Immunol. 2017, 65, 198–205. [Google Scholar] [CrossRef] [Green Version]
  11. Samad, A.P.A.; Santoso, U.; Lee, M.C.; Nan, F.H. Effects of dietary katuk (Sauropus androgynus L. Merr.) on growth, non-specific immune and diseases resistance against Vibrio alginolyticus infection in grouper Epinephelus coioides. Fish Shellfish Immunol. 2014, 36, 582–589. [Google Scholar] [CrossRef] [PubMed]
  12. Yang, X.; Gao, H.; Zhang, Y.; Yang, Y.; Wang, D.; Ma, H. Research progress in pharmacological action of andrographolide. J. Trop. Med. 2019, 19, 518–522. [Google Scholar]
  13. Rajani, M.; Shrivastava, N.; Ravishankara, M.N. A rapid method for isolation of andrographolide from (Andrographis paniculata) Nees Kalmegh. Pharm. Biol. 2000, 38, 204–209. [Google Scholar] [CrossRef]
  14. Sheeja, K.; Kuttan, G. Activation of cytotoxic T lymphocyte responses and attenuation of tumor growth in vivo by andrographis paniculata extract and andrographolide. Immunopharmacol. Immunotoxicol. 2007, 29, 81–93. [Google Scholar] [CrossRef] [PubMed]
  15. Wu, T.; Peng, Y.; Yan, S.; Li, N.; Chen, Y.; Lan, T. Andrographolide ameliorates atherosclerosis by suppressing pro-inflammation and ROS generation-mediated foam cell formation. Inflammation 2018, 41, 1681–1689. [Google Scholar] [CrossRef]
  16. Gupta, S.; Mishra, K.P.; Singh, S.B.; Ganju, L. Inhibitory effects of andrographolide on activated macrophages and adjuvant-induced arthritis. Inflammopharmacology 2018, 26, 447–456. [Google Scholar] [CrossRef]
  17. Fu, S.; Sun, C.; Tao, X.; Ren, Y. Anti-inflammatory effects of active constituents extracted from Chinese medicinal herbs against Propionibacterium acnes. Nat. Prod. Res. 2012, 26, 1746–1749. [Google Scholar] [CrossRef]
  18. Deng, Y.; Bi, R.; Guo, H.; Yang, J.; Du, Y.; Wang, C.; Wei, W. Andrographolide enhances TRAIL-induced apoptosis via p53-mediated death receptors up-regulation and suppression of the NF-кB pathway in bladder cancer cells. Int. J. Biol. Sci. 2019, 15, 688–700. [Google Scholar] [CrossRef] [Green Version]
  19. Chinnasri, P.; Ramphan, S.; Khongwichit, S.; Smith, D. Activity of andrographolide against dengue virus. Antivir. Res. 2016, 139, 69–78. [Google Scholar]
  20. Thisoda, P.; Rangkadilok, N.; Pholphana, N.; Worasuttayangkurn, L.; Ruchirawat, S.; Satayavivad, J. Inhibitory effect of Andrographis paniculata extract and its active diterpenoids on platelet aggregation. Eur. J. Pharmacol. 2006, 553, 39–45. [Google Scholar] [CrossRef]
  21. Chen, C.C.; Chuang, W.T.; Lin, A.H.; Tsai, C.W.; Huang, C.S.; Chen, Y.T.; Chen, H.W.; Lii, C.K. Andrographolide inhibits adipogenesis of 3T3-L1 cells by suppressing C/EBPβ expression and activation. Toxicol. Appl. Pharmacol. 2016, 307, 115–122. [Google Scholar] [CrossRef] [PubMed]
  22. Basha, K.A.; Raman, R.P.; Prasad, K.P.; Kumar, K.; Nilavan, E.; Kumar, S. Effect of dietary supplemented andrographolide on growth, non-specific immune parameters and resistance against Aeromonas hydrophila in Labeo rohita (Hamilton). Fish Shellfish Immunol. 2013, 35, 1433–1441. [Google Scholar] [CrossRef] [PubMed]
  23. Ministry of Agriculture Fisheries and Fisheries Administration. China Fisheries Statistical Yearbook; China Agriculture Press: Beijing, China, 2020; pp. 32–33.
  24. Ou, T.; Zhu, R.; Chen, Z.; Zhang, Q. Isolation and identification of a lethal rhabdovirus from farmed rice field eels Monopterus albus. Dis. Aquat. Organ. 2013, 106, 197–206. [Google Scholar] [CrossRef] [PubMed] [Green Version]
  25. Zhang, J.; Fu, L.; Huan, Z.; Liu, Z.; Hu, Y.; Wang, P.; Xie, J. Effects of fish meal replacement by different proportions of extruded soybean meal on growth performance, body composition, intestinal digestive enzyme activities and serum biochemical indices of rice filed eel (Monopterus albus). Chin. J. Anim. Nutr. 2015, 27, 3567–3576. [Google Scholar]
  26. Kwmar, H.; Kuwai, T.; Akwa, S. Toll-like receptors and innate immunity. Biochem. Biophys. Res. Commun. 2009, 388, 621–625. [Google Scholar] [CrossRef]
  27. Xavier, R.; Podolsky, D. Unravelling the pathogenesis of inflammatory bowel disease. Nature 2007, 448, 427–434. [Google Scholar] [CrossRef]
  28. Valdes, A.M.; Walter, J.; Segal, E.; Spector, T.D. Role of the gut microbiota in nutrition and health. BMJ. 2018, 361, k2179. [Google Scholar] [CrossRef] [Green Version]
  29. Shi, Y.; Zhong, L.; Ma, X.; Liu, Y.; Tang, T.; Hu, Y. Effect of replacing fishmeal with stickwater hydrolysate on the growth, serum biochemical indexes, immune indexes, intestinal histology and microbiota of rice field eel (Monopterus albus). Aquacult. Rep. 2019, 15, 100223. [Google Scholar] [CrossRef]
  30. Zhang, J.; Zhong, L.; Chi, S.; Chu, W.; Liu, Y.; Hu, Y. Sodium butyrate supplementation in high-soybean meal diets for juvenile rice field eel (Monopterus albus): Effects on growth, immune response and intestinal health. Aquaculture 2020, 520, 734952. [Google Scholar] [CrossRef]
  31. Li, H.; Pan, Y.; Liu, L.; Li, Y.; Huang, X.; Zhong, Y.; Tang, T.; Zhang, J.; Chu, W.; Shen, Y. Effects of high-fat diet on muscle textural properties, antioxidant status and autophagy of Chinese soft-shelled turtle (Pelodiscus sinensis). Aquaculture 2019, 511, 734228. [Google Scholar] [CrossRef]
  32. Ramos, M.A.; Batista, S.; Pires, M.A.; Silva, A.P.; Pereira, L.F.; Saavedra, M.J.; Ozorio, R.O.A.; Rema, P. Dietary probiotic supplementation improves growth and the intestinal morphology of Nile tilapia. Animal 2017, 11, 1259–1269. [Google Scholar] [CrossRef] [PubMed]
  33. Zheng, X.; Duan, Y.; Dong, H.; Zhang, J. Effects of dietary Lactobacillus plantarum in different treatments on growth performance and immune gene expression of white shrimp Litopenaeus vannamei under normal condition and stress of acute low salinity. Fish Shellfish Immunol. 2017, 62, 195–201. [Google Scholar] [CrossRef] [PubMed]
  34. Tang, T.; Peng, M.; Chu, W.; Hu, Y.; Zhong, L. Effects of high-fat diet on growth performance, lipid accumulation and lipid metabolism-related MicroRNA/gene expression in the liver of grass carp (Ctenopharyngodon idella). Comp. Biochem. Phys. B 2019, 234, 34–40. [Google Scholar] [CrossRef] [PubMed]
  35. Livak, K.J.; Schmittgen, T.D. Analysis of relative gene expression data using real-time quantitative pcr and the 2−ΔΔCT Method. Methods 2001, 25, 402–408. [Google Scholar] [CrossRef]
  36. Ni, J.J.; Li, X.J.; Chen, F.; Wu, H.H.; Xu, M.Y. Community structure and potential nitrogen metabolisms of subtropical aquaculture pond microbiota. Appl. Ecol. Environ. Res. 2018, 16, 7687–7697. [Google Scholar] [CrossRef]
  37. Jiang, H.; Liu, S.; Xiao, T.Y.; Cao, Y.K.; Xie, M.; Yin, Z.F. Cellular biological and eumelanin-related gene expressional bases of pigment deviation of Leptobotia taeniops. Appl. Ecol. Environ. Res. 2019, 17, 12181–12189. [Google Scholar] [CrossRef]
  38. Liu, Y.L.; Zhong, L.; Chen, T.; Shi, Y.; Hu, Y.; Zeng, J.G.; Liu, H.Y.; Xu, S.D. Dietary sanguinarine supplementation on the growth performance, immunity and intestinal health of grass carp fed cottonseed and rapeseed meal diets. Aquaculture 2020, 528, 735521. [Google Scholar] [CrossRef]
  39. Caporaso, J.G.; Kuczynski, J.; Stombaugh, J.; Bittinger, K.; Bushman, F.D.; Costello, E.K.; Fierer, N.; Peña, A.G.; Goodrich, J.K.; Gordon, J.I.; et al. QIIME allows analysis of high-throughput community sequencing data. Nat. Methods 2010, 7, 335–336. [Google Scholar] [CrossRef] [Green Version]
  40. Lozupone, C.; Knight, R. UniFrac: A New Phylogenetic Method for Comparing Microbial Communities. Appl. Environ. Microbiol. 2005, 71, 8228–8235. [Google Scholar] [CrossRef] [Green Version]
  41. Zar, J.H. Biostatistical analysis. Q. Rev. Biol. 1999, 18, 797–799. [Google Scholar]
  42. Clarke, K.R. Non-parametric multivariate analyses of changes in community structure. Austral. Ecol. 1993, 18, 117–143. [Google Scholar] [CrossRef]
  43. Aftabuddin, S.; Siddique, M.A.M.; Romkey, S.S.; Shelton, W.L. Antibacterial function of herbal extracts on growth, survival and immunoprotection in the black tiger shrimp, Penaeus monodon. Fish Shellfish Immunol. 2017, 65, 52–58. [Google Scholar] [CrossRef]
  44. Kim, H.S.; Lee, K.W.; Jung, H.S.; Kim, J. Effects of dietary inclusion of yacon, ginger and blueberry on growth, body composition and challenge test of juvenile rockfish (Sebastes schlegeli) against Edwardsiella tarda. Aquacult. Nutr. 2017, 24, 1048–1055. [Google Scholar] [CrossRef]
  45. Hassanin, M.E.; Hakim, Y.; Badawi, M.E. Dietary effect of ginger (Zingiber officinale Roscoe) on growth performance, immune response of Nile tilapia (Oreochromis niloticus) and disease resistance against Aeromonas hydrophila. Abbassa Int. J. Aqua. 2014, 7, 35–52. [Google Scholar]
  46. Ribeiro, L.; Zambonino-Infante, J.; Cahu, C.; Dinis, M. Development of digestive enzymes in larvae of Solea senegalensis, Kaup 1858. Aquaculture 1999, 179, 465–473. [Google Scholar] [CrossRef]
  47. Khosravi, S.; Rahimnejad, S.; Herault, M.; Fournier, V.; Lee, C.R.; Dio Bui, H.T.; Jeong, J.B.; Lee, K.J. Effects of protein hydrolysates supplementation in low fish meal diets on growth performance, innate immunity and disease resistance of red sea bream Pagrus major. Fish Shellfish Immunol. 2015, 45, 858–868. [Google Scholar] [CrossRef]
  48. Pirarat, N.; Pinpimai, K.; Endo, M.; Katagiri, T.; Ponpornpisit, A.; Chansue, N.; Maita, M. Modulation of intestinal morphology and immunity in nile tilapia (Oreochromis niloticus) by Lactobacillus rhamnosus GG. Res. Vet. Sci. 2011, 91, e92–e97. [Google Scholar] [CrossRef]
  49. Hidalgo, M.C.; Urea, E.; Sanz, A. Comparative study of digestive enzymes in fish with different nutritional habits. Proteolytic and amylase activities. Aquaculture 1999, 170, 267–283. [Google Scholar] [CrossRef]
  50. Zeng, C.; Xie, C.X.; Chen, X.M.; Fu, H.; Li, Q.; Lin, C.; Liu, X.X. Periphery olfactory system in rice field eel, Monopterus Albus (pisces: Synbranchidae), a new model in anatomy in vertebrate. Acta Hydrob. Sin. 2012, 36, 220–228. [Google Scholar]
  51. Ye, L.; Wang, T.; Tang, L.; Liu, W.; Yang, Z.; Zhou, J.; Zheng, Z.; Cai, Z.; Hu, M.; Liu, Z. Poor oral bioavailability of a promising anticancer agent andrographolide is due to extensive metabolism and efflux by P-glycoprotein. J. Pharm. Sci. 2011, 100, 5007–5017. [Google Scholar] [CrossRef]
  52. Olesen, J.M.; Bascompte, J.; Dupont, Y.L.; Jordano, P. The modularity of pollination networks. Proc. Natl. Acad. Sci. USA 2007, 104, 19891–19896. [Google Scholar] [CrossRef] [PubMed] [Green Version]
  53. Sies, H. Oxidative stress: From basic research to clinical application. Am. J. Med. 1991, 91, 31–38. [Google Scholar] [CrossRef]
  54. Rudneva, I.I. Blood antioxidant system of Black Sea elas-mobranch and teleost. Comp. Biochem. Physiol. C Pharmacol. Toxicol. 1997, 118, 255–260. [Google Scholar]
  55. Martínez-Álvarez, R.M.; Morales, A.E.; Sanz, A. Antioxidant defenses in fish: Biotic and abiotic factors. Rev. Fish. Biol. Fish. 2005, 15, 75–88. [Google Scholar] [CrossRef]
  56. Li, B.; Jiang, T.; Liu, H.; Miao, Z.; Fang, D.; Zheng, L.; Zhao, J. Andrographolide protects chondrocytes from oxidative stress injury by activation of the Keap1-Nrf2-Are signaling pathway. J. Cell Physiol. 2019, 234, 561–571. [Google Scholar] [CrossRef] [Green Version]
  57. Giuliani, M.E.; Regoli, F. Identification of the Nrf2-Keap1 pathway in the European eel Anguilla anguilla: Role for a transcriptional regulation of antioxidant genes in aquatic organisms. Aquat. Toxicol. 2014, 150, 117–123. [Google Scholar] [CrossRef]
  58. Jung, K.A.; Kwak, M.K. The Nrf2 system as a potential target for the development of indirect antioxidants. Molecules 2010, 15, 7266–7291. [Google Scholar] [CrossRef] [Green Version]
  59. Karin, M.; Clevers, H. Reparative inflammation takes charge of tissue regeneration. Nature 2016, 529, 307–315. [Google Scholar] [CrossRef]
  60. Rymuszka, A.; Adaszek, Ł. Pro- and anti-inflammatory cytokine expression in carp blood and head kidney leukocytes exposed to cyanotoxin stress-an in vitro study. Fish Shellfish Immunol. 2012, 33, 382–388. [Google Scholar] [CrossRef]
  61. Papadakis, K.A.; Targan, S.R. Role of cytokines in the pathogenesis of inflammatory bowel disease. Annu. Rev. Med. 2000, 51, 289–298. [Google Scholar] [CrossRef]
  62. Wang, Y.J.; Wang, J.T.; Fan, Q.X.; Geng, J.G. Andrographolide inhibits NF-κB activation and attenuates neointimal hyperplasia in arterial restenosis. Cell Res. 2007, 17, 933–941. [Google Scholar] [CrossRef] [PubMed] [Green Version]
  63. Abreu, M.T.; Fukata, M.; Arditi, M. TLR signaling in the gut in health and disease. J. Immunol. 2005, 174, 4453–4460. [Google Scholar] [CrossRef] [PubMed] [Green Version]
  64. Li, X.; Ji, R.; Cui, K.; Chen, Q.; Chen, Q.; Fang, W.; Mai, K.; Zhang, Y.; Xu, W.; Ai, Q. High percentage of dietary palm oil suppressed growth and antioxidant capacity and induced the inflammation by activation of TLR-NF-κB signaling pathway in large yellow croaker (Larimichthys crocea). Fish Shellfish Immunol. 2019, 87, 600–608. [Google Scholar] [CrossRef] [PubMed]
  65. Cario, E.; Gerken, G.; Podolsky, D.K. Toll-like receptor 2 controls mucosal inflammation by regulating epithelial barrier function. Gastroenterology 2007, 132, 1359–1374. [Google Scholar] [CrossRef] [PubMed]
  66. Chasiotis, H.; Kolosov, D.; Bui, P.; Kelly, S.P. Tight junctions, tight junction proteins and paracellular permeability across the gill epithelium of fishes: A review. Respir. Physiol. Neurobiol. 2012, 184, 269–281. [Google Scholar] [CrossRef]
  67. Xu, H.J.; Jiang, W.D.; Feng, L.; Liu, Y.; Wu, P.; Jiang, J.; Kuang, S.Y.; Tang, L.; Tang, W.N.; Zhang, Y.A.; et al. Dietary vitamin C deficiency depresses the growth, head kidney and spleen immunity and structural integrity by regulating NF-κB, TOR, Nrf2, apoptosis and MLCK signaling in young grass carp (Ctenopharyngodon idella). Fish Shellfish Immunol. 2016, 52, 111–138. [Google Scholar]
  68. Tarnecki, A.M.; Burgos, F.A.; Ray, C.L.; Arias, C.R. Fish intestinal microbiome: Diversity and symbiosis unraveled by metagenomics. J. Appl. Microbiol. 2017, 123, 2–17. [Google Scholar] [CrossRef] [Green Version]
  69. Yang, G.; Jian, S.Q.; Cao, H.; Wen, C.; Hu, B.; Peng, M.; Peng, L.S.; Yuan, J.G.; Liang, L.F. Changes in microbiota along the intestine of grass carp (Ctenopharyngodon idella): Community, interspecific interactions, and functions. Aquaculture 2019, 498, 151–161. [Google Scholar] [CrossRef]
  70. Peng, M.; Xue, J.J.; Hu, Y.; Wen, C.G.; Hu, B.Q.; Jian, S.Q.; Liang, L.F.; Yang, G. Disturbance in the homeostasis of intestinal microbiota by a high-fat diet in the rice field eel (Monopterus albus). Aquaculture 2019, 502, 347–355. [Google Scholar] [CrossRef]
  71. Yang, X.; Xu, M.; Huang, G.; Zhang, C.; Pang, Y.; Cheng, Y. Effect of dietary L-tryptophan on the survival, immune response and gut microbiota of the Chinese mitten crab, Eriocheir sinensis. Fish Shellfish Immunol. 2018, 84, 1007–1017. [Google Scholar] [CrossRef]
  72. Shin, N.R.; Whon, T.W.; Bae, J.W. Proteobacteria: Microbial signature of dysbiosis in gut microbiota. Trends Biotechnol. 2015, 33, 496–503. [Google Scholar] [CrossRef] [PubMed]
  73. Wladis, E.J. Dacryocystitis secondary to Stenotrophomonas maltophilia infection. Ophthal. Plast. Reconstr. Surg. 2011, 27, e116. [Google Scholar] [CrossRef] [PubMed]
  74. Delzenne, N.; Knudsen, C.; Beaumont, M.; Rodriguez, J.; Neyrinck, A.; Bindels, L. Contribution of the gut microbiota to the regulation of host metabolism and energy balance: A focus on the gut–liver axis. Proc. Nutr. Soc. 2019, 78, 319–328. [Google Scholar] [CrossRef]
  75. Singha, P.K.; Roy, S.; Dey, S. Antimicrobial activity of Andrographis paniculata. Fitoterapia 2003, 74, 692–694. [Google Scholar] [CrossRef]
Figure 1. Effects of dietary andrographolide on growth performance of rice field eel, Monopterus albus. (a), (b), (c), (d), (e), (f) and (g) are final weight, weight gain rate (WGR), feed conversion rate (FCR), survival rate (SR), viserosomatic index (VSI), hepatosomatic index (HSI) and condition factor (CF), respectively. Note: * p < 0.05.
Animals 10 01744 g001aAnimals 10 01744 g001b
Figure 2. Effects of dietary andrographolide on intestinal digestive enzymes of rice field eel, Monopterus albus. (a), (b) and (c) are lipase, trylase and amylase, respectively. Note: * p < 0.05.
Animals 10 01744 g002
Figure 3. Effects of dietary andrographolide on reactive oxygen species (ROS) (a) and malondialdehyde (MDA) (b) in the liver of rice field eel, Monopterus albus. Note: * p < 0.05.
Animals 10 01744 g003
Figure 4. Effects of dietary andrographolide on antioxidant indexes in the liver of rice field eel, Monopterus albus. (a), (b), (c), (d), (e) and (f) are superoxide dismutase (SOD), catalase (CAT), glutathione reductase (GR), glutathione (GSH), glutathione S-transferase (GST) and glutathione peroxidase (GPx), respectively. Note: * p < 0.05.
Animals 10 01744 g004
Figure 5. Relative expression levels of Nrf2 (a) and Keap1 (b) in the liver of rice field eel (Monopterus albus) fed diets containing graded levels of andrographolide. Note: * p < 0.05.
Animals 10 01744 g005
Figure 6. Relative expression levels of SOD1 (a), CAT (b), GPx1 (c), GPx4 (d), GSTT1 (e), GSTK (f) and GSTO (g) in the liver of rice field eel (Monopterus albus) fed diets containing graded levels of andrographolide. Note: * p < 0.05.
Animals 10 01744 g006aAnimals 10 01744 g006b
Figure 7. Effects of dietary andrographolide on intestinal morphology of rice field eel, Monopterus albus. (a), (b) and (c) are villi length, muscular thickness and goblet cell quantity, respectively. Note: * p < 0.05.
Animals 10 01744 g007
Figure 8. Effects of dietary andrographolide on intestinal histological structure of rice field eel (Monopterus albus). (a), (b), (c), (d) and (e) are AD1, AD2, AD3, AD4 and AD5, respectively (Magnification × 50). The magnification of (f) was 400. The red arrow indicates the villi length, the blue arrow indicates the muscular thickness and the yellow arrow indicates the goblet cell. The upper left is the scale bar.
Animals 10 01744 g008
Figure 9. Relative expression levels of Occludin (a), ZO-1 (b), ZO-2 (c), Claudin-12 (d) and Claudin-15 (e) of rice field eel (Monopterus albus) fed diets containing graded levels of andrographolide. Note: * p < 0.05.
Animals 10 01744 g009
Figure 10. Relative expression levels of IL-10 (a), TGF-β1 (b), TGF-β2 (c), TGF-β3 (d), IL-1β (e) and IL-12β (f) of rice field eel (Monopterus albus) fed diets containing graded levels of andrographolide. Note: * p < 0.05.
Animals 10 01744 g010
Figure 11. Relative expression levels of TLR-3 (a), TLR-7 (b) and TLR-8 (c) of rice field eel (Monopterus albus) fed diets containing graded levels of andrographolide. Note: * p < 0.05.
Animals 10 01744 g011aAnimals 10 01744 g011b
Figure 12. Principal coordinates analysis (PCoA) of the intestinal microbial community. Note: AD1 vs. AD2: R = 0.313, p = 0.009; AD1 vs. AD3: R = 0.313, p = 0.009; AD1 vs. AD5: R = 0.372, p = 0.005; AD2 vs. AD3: R = −0.042, p = 0.509; AD2 vs. AD5: R = 0.057, p = 0.293; AD3 vs. AD5: R = −0.115, p = 0.910.
Animals 10 01744 g012
Figure 13. Relative abundance (a) of different bacterial phylum (Top 10) and box plots (b) showing significant variations of relative abundances of intestinal microbioma. Note: * p < 0.05, ** p < 0.01.
Animals 10 01744 g013aAnimals 10 01744 g013b
Figure 14. Relative abundance (a) of different bacterial classes (Top 10) and box plots (b) showing significant variations of relative abundances of intestinal microbioma. Note: * p < 0.05.
Animals 10 01744 g014aAnimals 10 01744 g014b
Table 1. Formulation and proximate composition of the experimental diets (dry weight).
Ingredientsg/kgProximate Compositiong/kg
Fish meal360.0Crude protein 4431.6
Soybean meal200.0Crude lipid 451.6
Corn gluten meal80.0Ash 4111.4
Soy protein concentrate50.0
Beer yeast50.0
Fish oil20.0
Choline chloride5.0
Premix 110.0
Monocalcium phosphate15.0
α-starch209.6
Antioxidants 20.1
Mold inhibitor 30.3
1 Provided by Qingdao Master Biotechnology Co., Ltd. (Qingdao, Shandong, China). Vitamin and Mineral Premix composition (mg/kg diet): KCl 200 mg, KI (1%) 60 mg, CoCl2·6H2O (1%) 50 mg, CuSO4 5H2O 30 mg, FeSO4·H2O 400 mg, ZnSO4·H2O 400 mg, MnSO4·H2O 150 mg, Na2SeO3·5H2O (1%) 65 mg, MgSO4·H2O 2000 mg, zeolite power 3645.85 mg, VB1 12 mg, riboflavin 12 mg, VB6 8 mg, VB12 0.05 mg, VK3 8 mg, inositol 100 mg, pantothenic acid 40 mg, niacin acid 50 mg, folic acid 5 mg, biotin 0.8 mg, VA 25 mg, VD 35 mg, VE 50 mg, VC 100 mg, ethoxyquin 150 mg and flour 2434.15 mg. 2 The antioxidant was butyl hydroxymethoxybenzene. 3 The mold inhibitor was sodium diacetate. 4 Crude protein, crude lipid and ash were measured values. Crude protein was determined using the Kjeldahl method and estimated by multiplying nitrogen by 6.25. Crude lipids were measured by ether extraction using the Soxhlet method. The crude ash assay was carried out by combustion in a muffle furnace at 550 °C for 16 h.
Table 2. Primers used for mRNA quantitative real-time PCR.
GeneForward Sequences (5′–3′)Reverse Sequences (5′–3′)Accession No. 1PCR Efficiency (%)Product Length
OccludinTGTCGGGGAGTGGGTAAATCCAGGCAAATAAAGAGGCTXM_020599328.197130
ZO-1GGCATCATCCCCAACAAAGCGAAGACCACGGAACCTXM_020621576.196111
ZO-2AGCCGAGGTCGCACTTTAGCTTTGCTTCTGTGGTTGATXM_020615114.198246
Claudin-12TCACCTTCAATCGCAACGATGTCTGGCTCAGGCTTATCTXM_020607277.199250
Claudin-15CTCGCTGCTTGCTTTGACTTTGAAGGCGTACCAGGACAXM_020611334.196225
IL-10TTTGCCTGCCAAGTTATGAGCATTTGGTGACATCGCTCTTXM_020593225.1100158
IL-1βGAGATGTGGAGCCCAAACTTCTGCCTCTGACCTTCTGGACTTKM113037.197127
IL-12βCAAGTCAGTTGCCAAAATCCCCAAGCAGCTCAGGGTCTXM_020594580.199103
TGF-β1AACCCACTACCTCACTACCCGGCCGAAGTTGGAAACCCTXM_020605575.196128
TGF-β2ATTACGCCAAGGAGGTGCGGGTTTTGAAGACGGAAGATXM_020622328.198178
TGF-β3AGTTTGTCGCTATCCACTTGCGATGAGTTCCTTGGTGCTGTTAXM_020590885.195180
TLR-3TATTTAGAGCCATACAGGGCACAATCAAGAACGCACAXM_020614353.1100244
TLR-7ATCCTCACGACTTCCCTCTTTCTTTCATCACCCACTXM_020596482.197205
TLR-8AAGTGAAGCAGGATGAAGAAGTCCCAGATTGAGTGAXM_020596483.196139
Nrf2CTTCAGACAGCGGTGACAGGGCCTCATTCAGTTGGTGCTTXM_020596409.196260
Keap1AGCCTGGGTGCGATACGACAAGAAATGACTTTGGTGGGXM_020597068.198198
SOD1AGCTGGCTAAGTTCTCATTCACGCAGTAACATTGCCCAAGTCTXM_020598413.199227
CATGTCCAAGTCTAAGGCATCTCCCTCCTCTTCGTTCAGCACCXM_020624985.196106
GPx1GTTCACCGCCAAACTCTTTTCCCATTCACATCTACCTTXM_020607739.198303
GPx4ATTTATGACTTCTCAGCGACAGCCTTCAGCCACTTCCACAXM_020612291.1100325
GSTKTTGATGTTCCCCTGCGTTATCACCTGCTCTACCTGCTTGTCXM_020610780.197131
GSTOGGGAGAAATAAAGGTGAGGATGCAGATGAGTTGACAAGGCAGTTXM_020600427.199199
RPL-17GTTGTAGCGACGGAAAGGGACGACTAAATCATGCAAGTCGAGGGXM_020587712.198160
1 The accession numbers come from National Center for Biotechnology Information (NCBI).
Table 3. Effects of dietary andrographolide on alpha-diversity in the intestinal microbial of rice field eel, Monopterus albus.
IndexAD1AD2AD3AD5
Observed species453.33 ± 58.21 b276.67 ± 35.79 a195.5 ± 44.83 a279.83 ± 59.10 a
Shannon4.45 ± 0.37 b3.02 ± 0.54 a2.83 ± 0.39 a3.46 ± 0.49 ab
Chao1478.56 ± 64.49 b308.9 ± 30.79 a218.57 ± 48.57 a296.75 ± 58.01 a
ACE478.4 ± 66.62 b318.77 ± 29.11 a228.69 ± 46.86 a302.55 ± 57.53 a
PD whole tree55.86 ± 6.65 b38.71 ± 4.34 a28.13 ± 4.74 a37.39 ± 6.08 a
Values are means ± SE of six replicates. Mean values with a different superscript within a row for a parameter are significantly different, (p < 0.05).

