
Helicobacter pylori and Human Immunodeficiency Virus Co-Infection: Potential Implications for Future Gastric Cancer Risk


Abstract
:1. Introduction
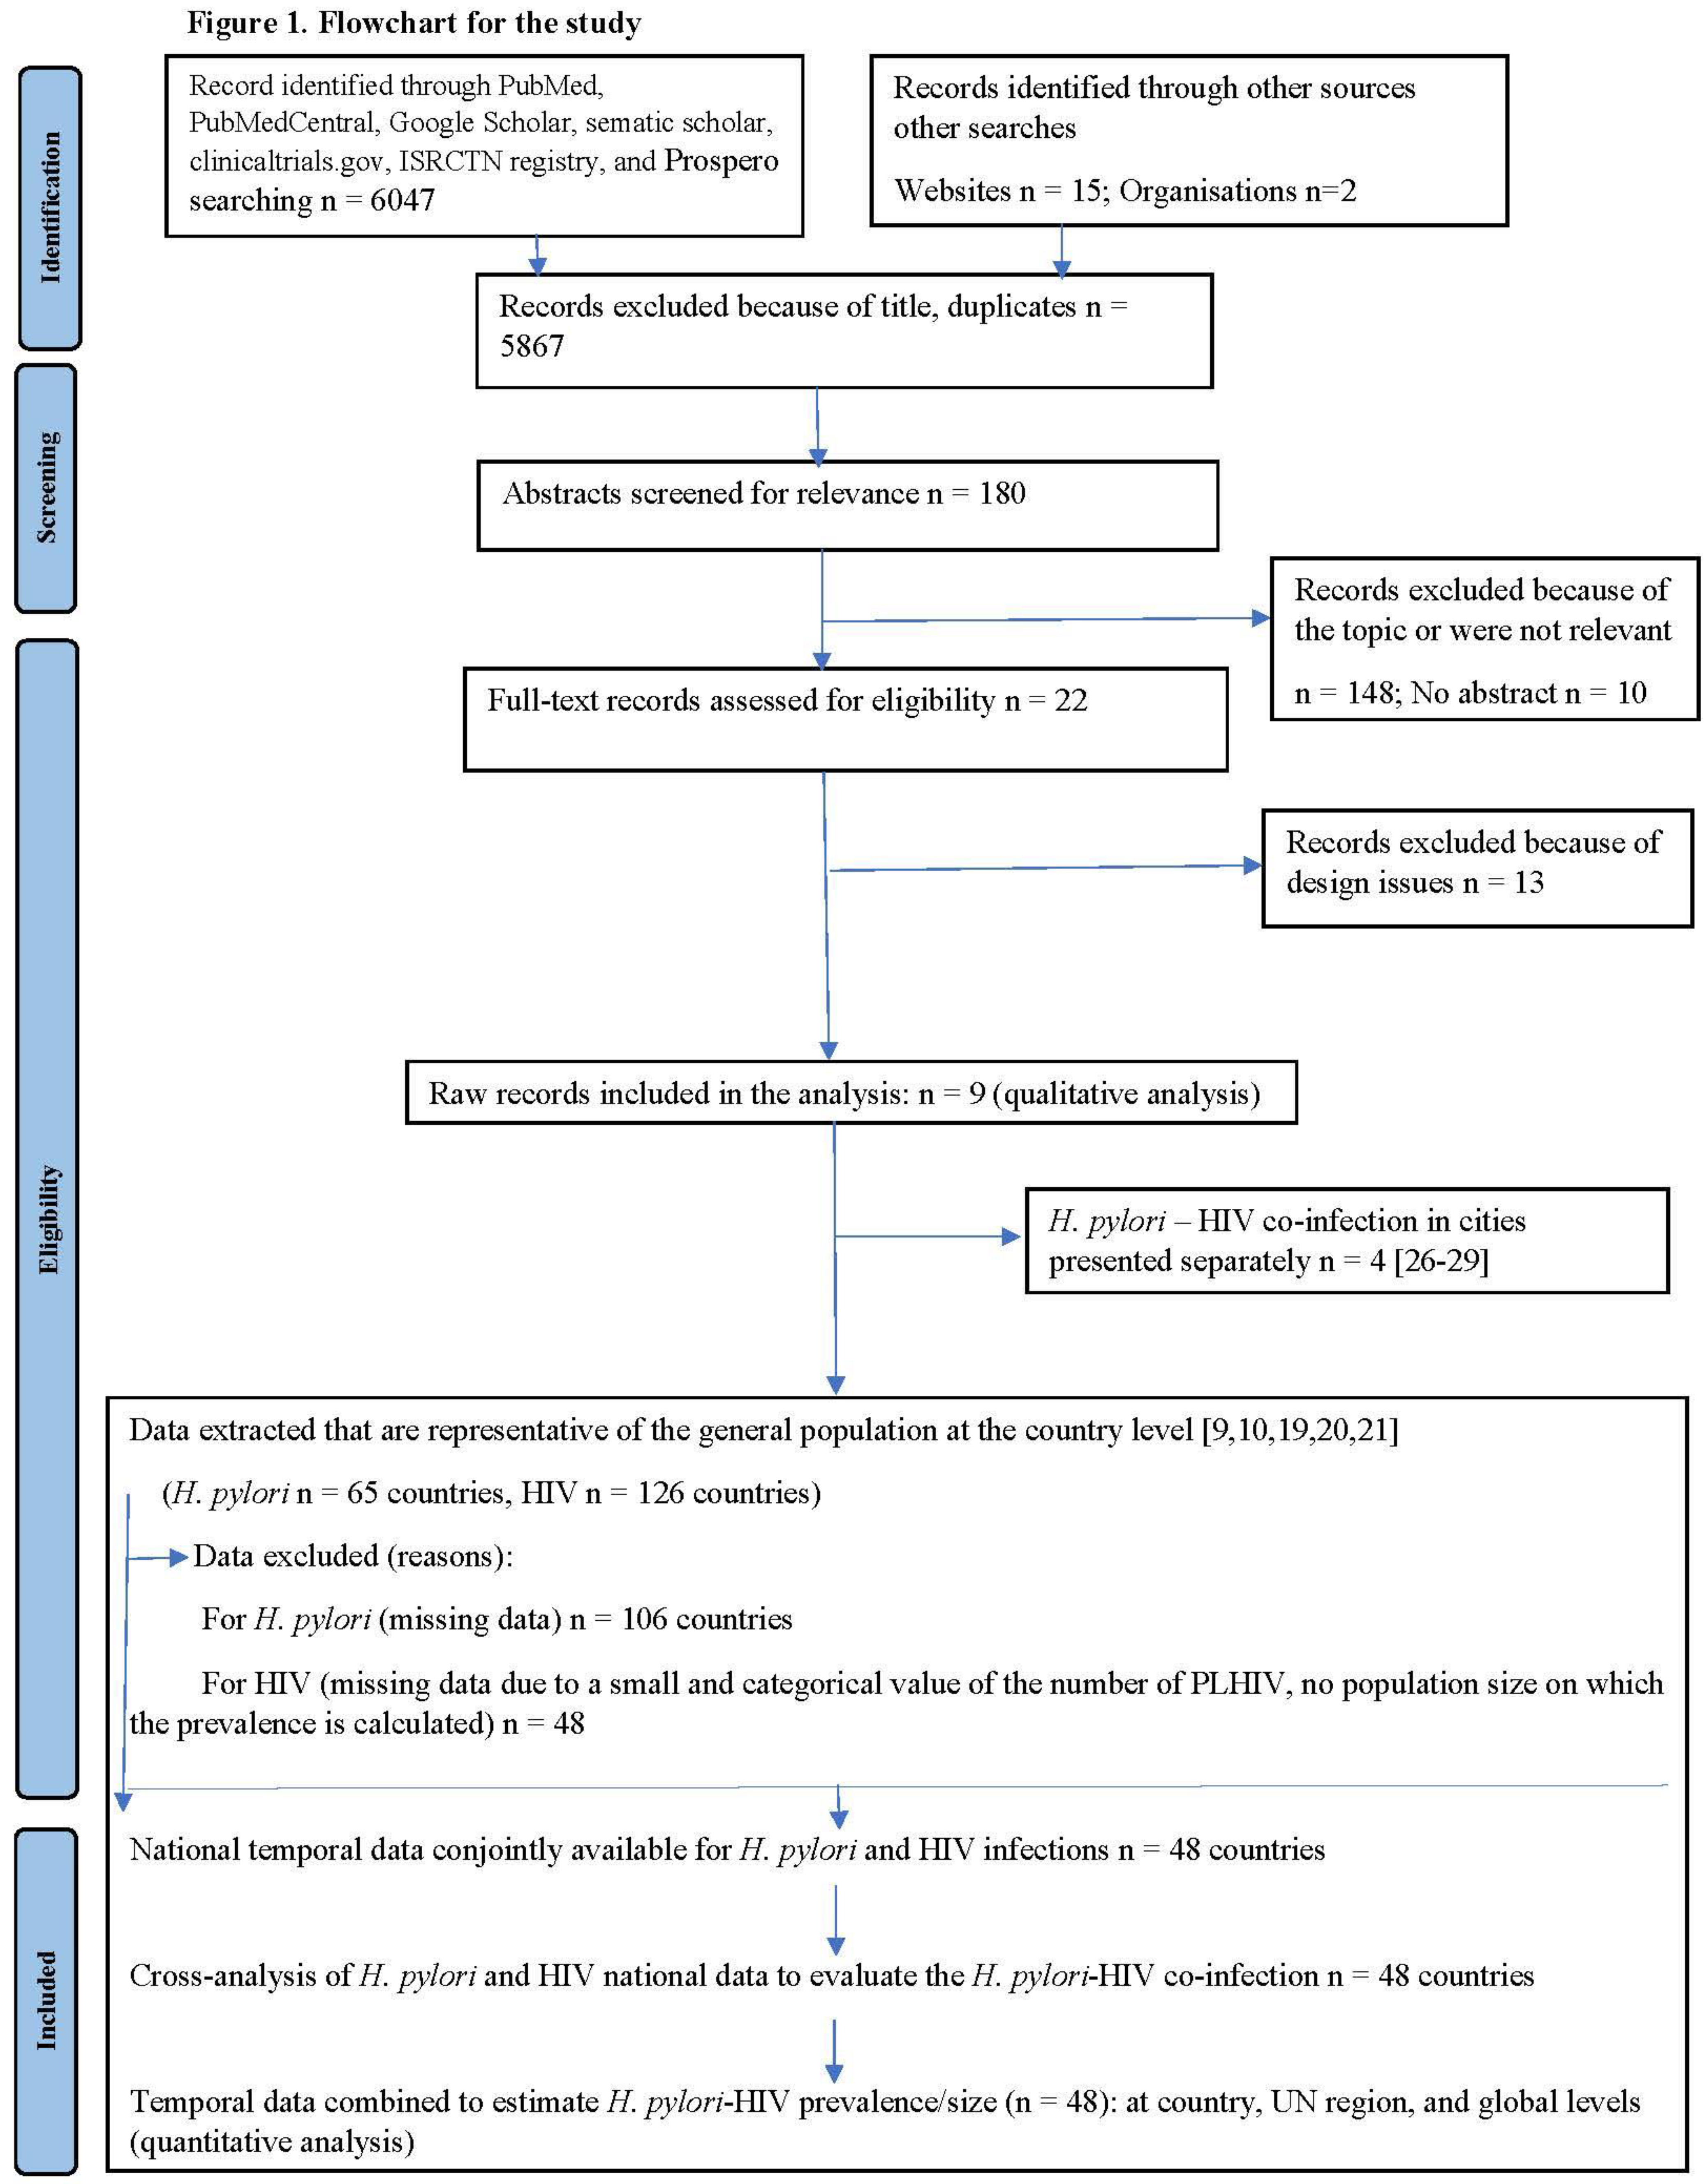
2. Methods
2.1. Search Strategy
2.2. Study Selection and Eligibility Criteria
2.3. Main Outcomes
2.4. Data Extraction
2.5. Determination of H. pylori Prevalence
2.6. Exclusion Criteria
2.7. Determination of HIV Prevalence
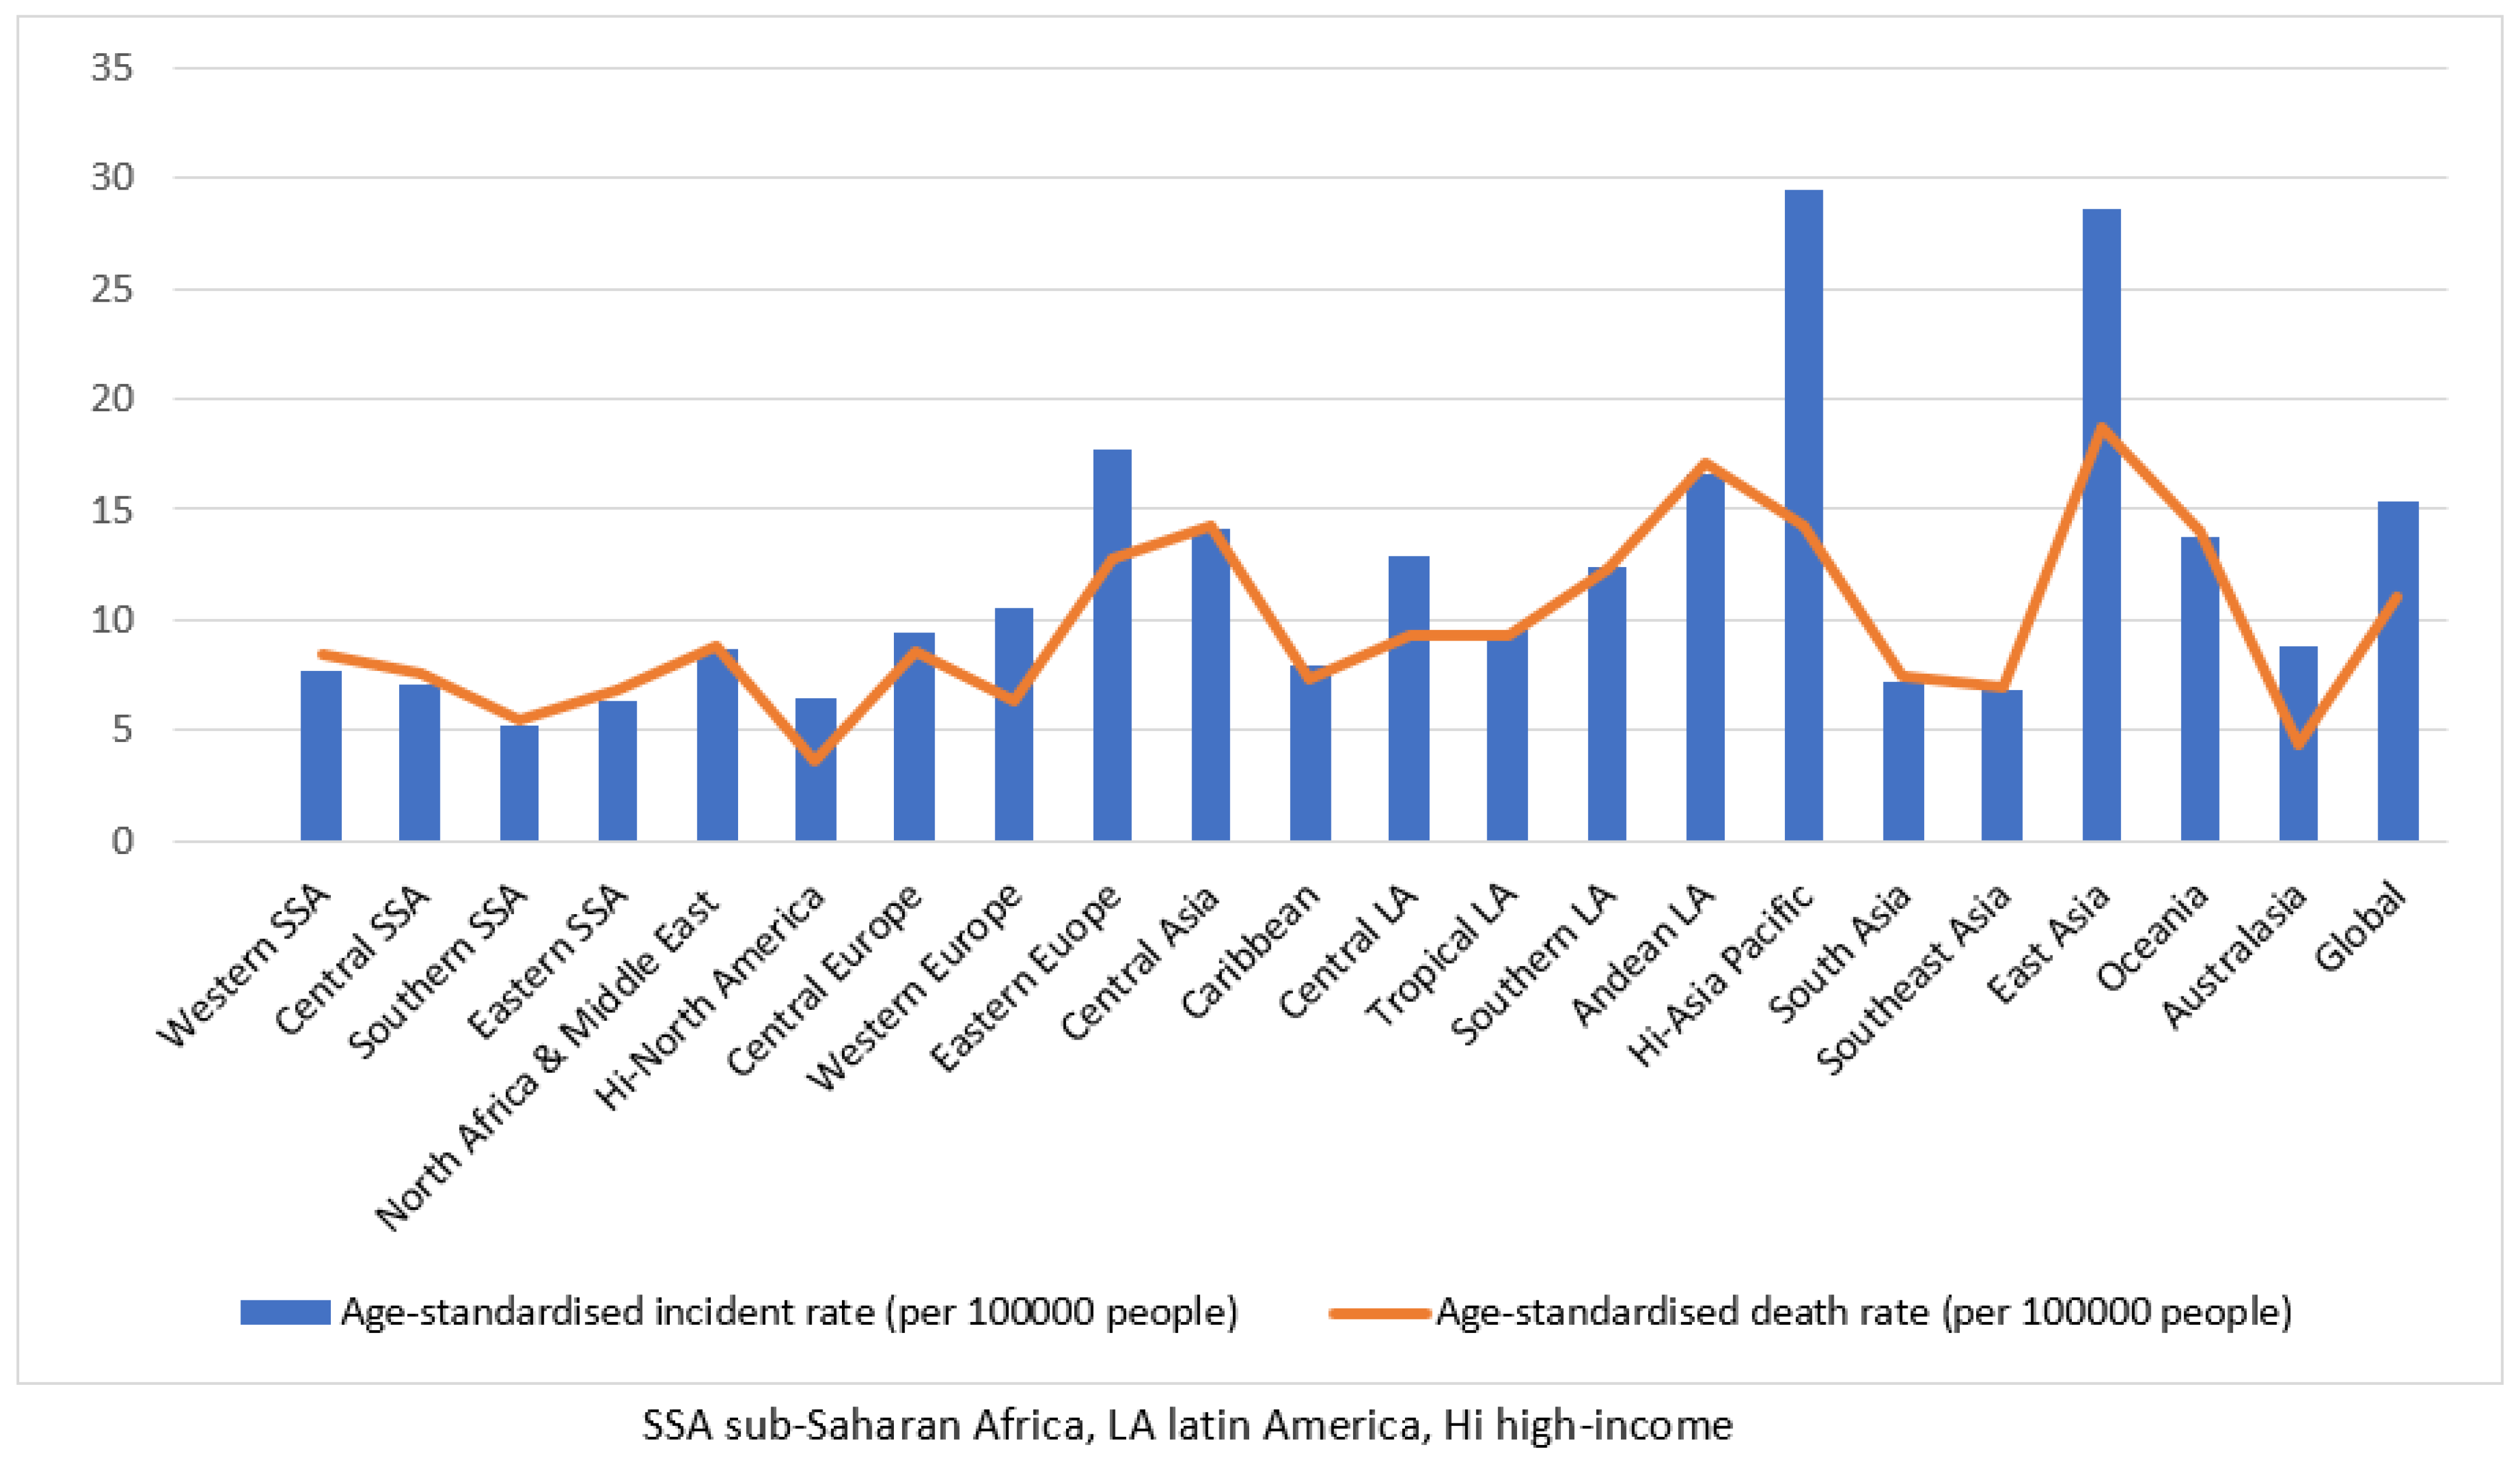
2.8. Gastric Cancer Incidence and Mortality
2.9. Statistics
2.10. Data by Country for H. pylori and HIV Infections
2.11. H. pylori–HIV Co-Infection Data
- Country H. pylori–HIV co-infection prevalence was estimated by multiplying country HIV prevalence by country H. pylori prevalence.
- Country H. pylori–HIV co-infection size was estimated by multiplying the country (H. pylori size by HIV infection size) divided by the country population size.
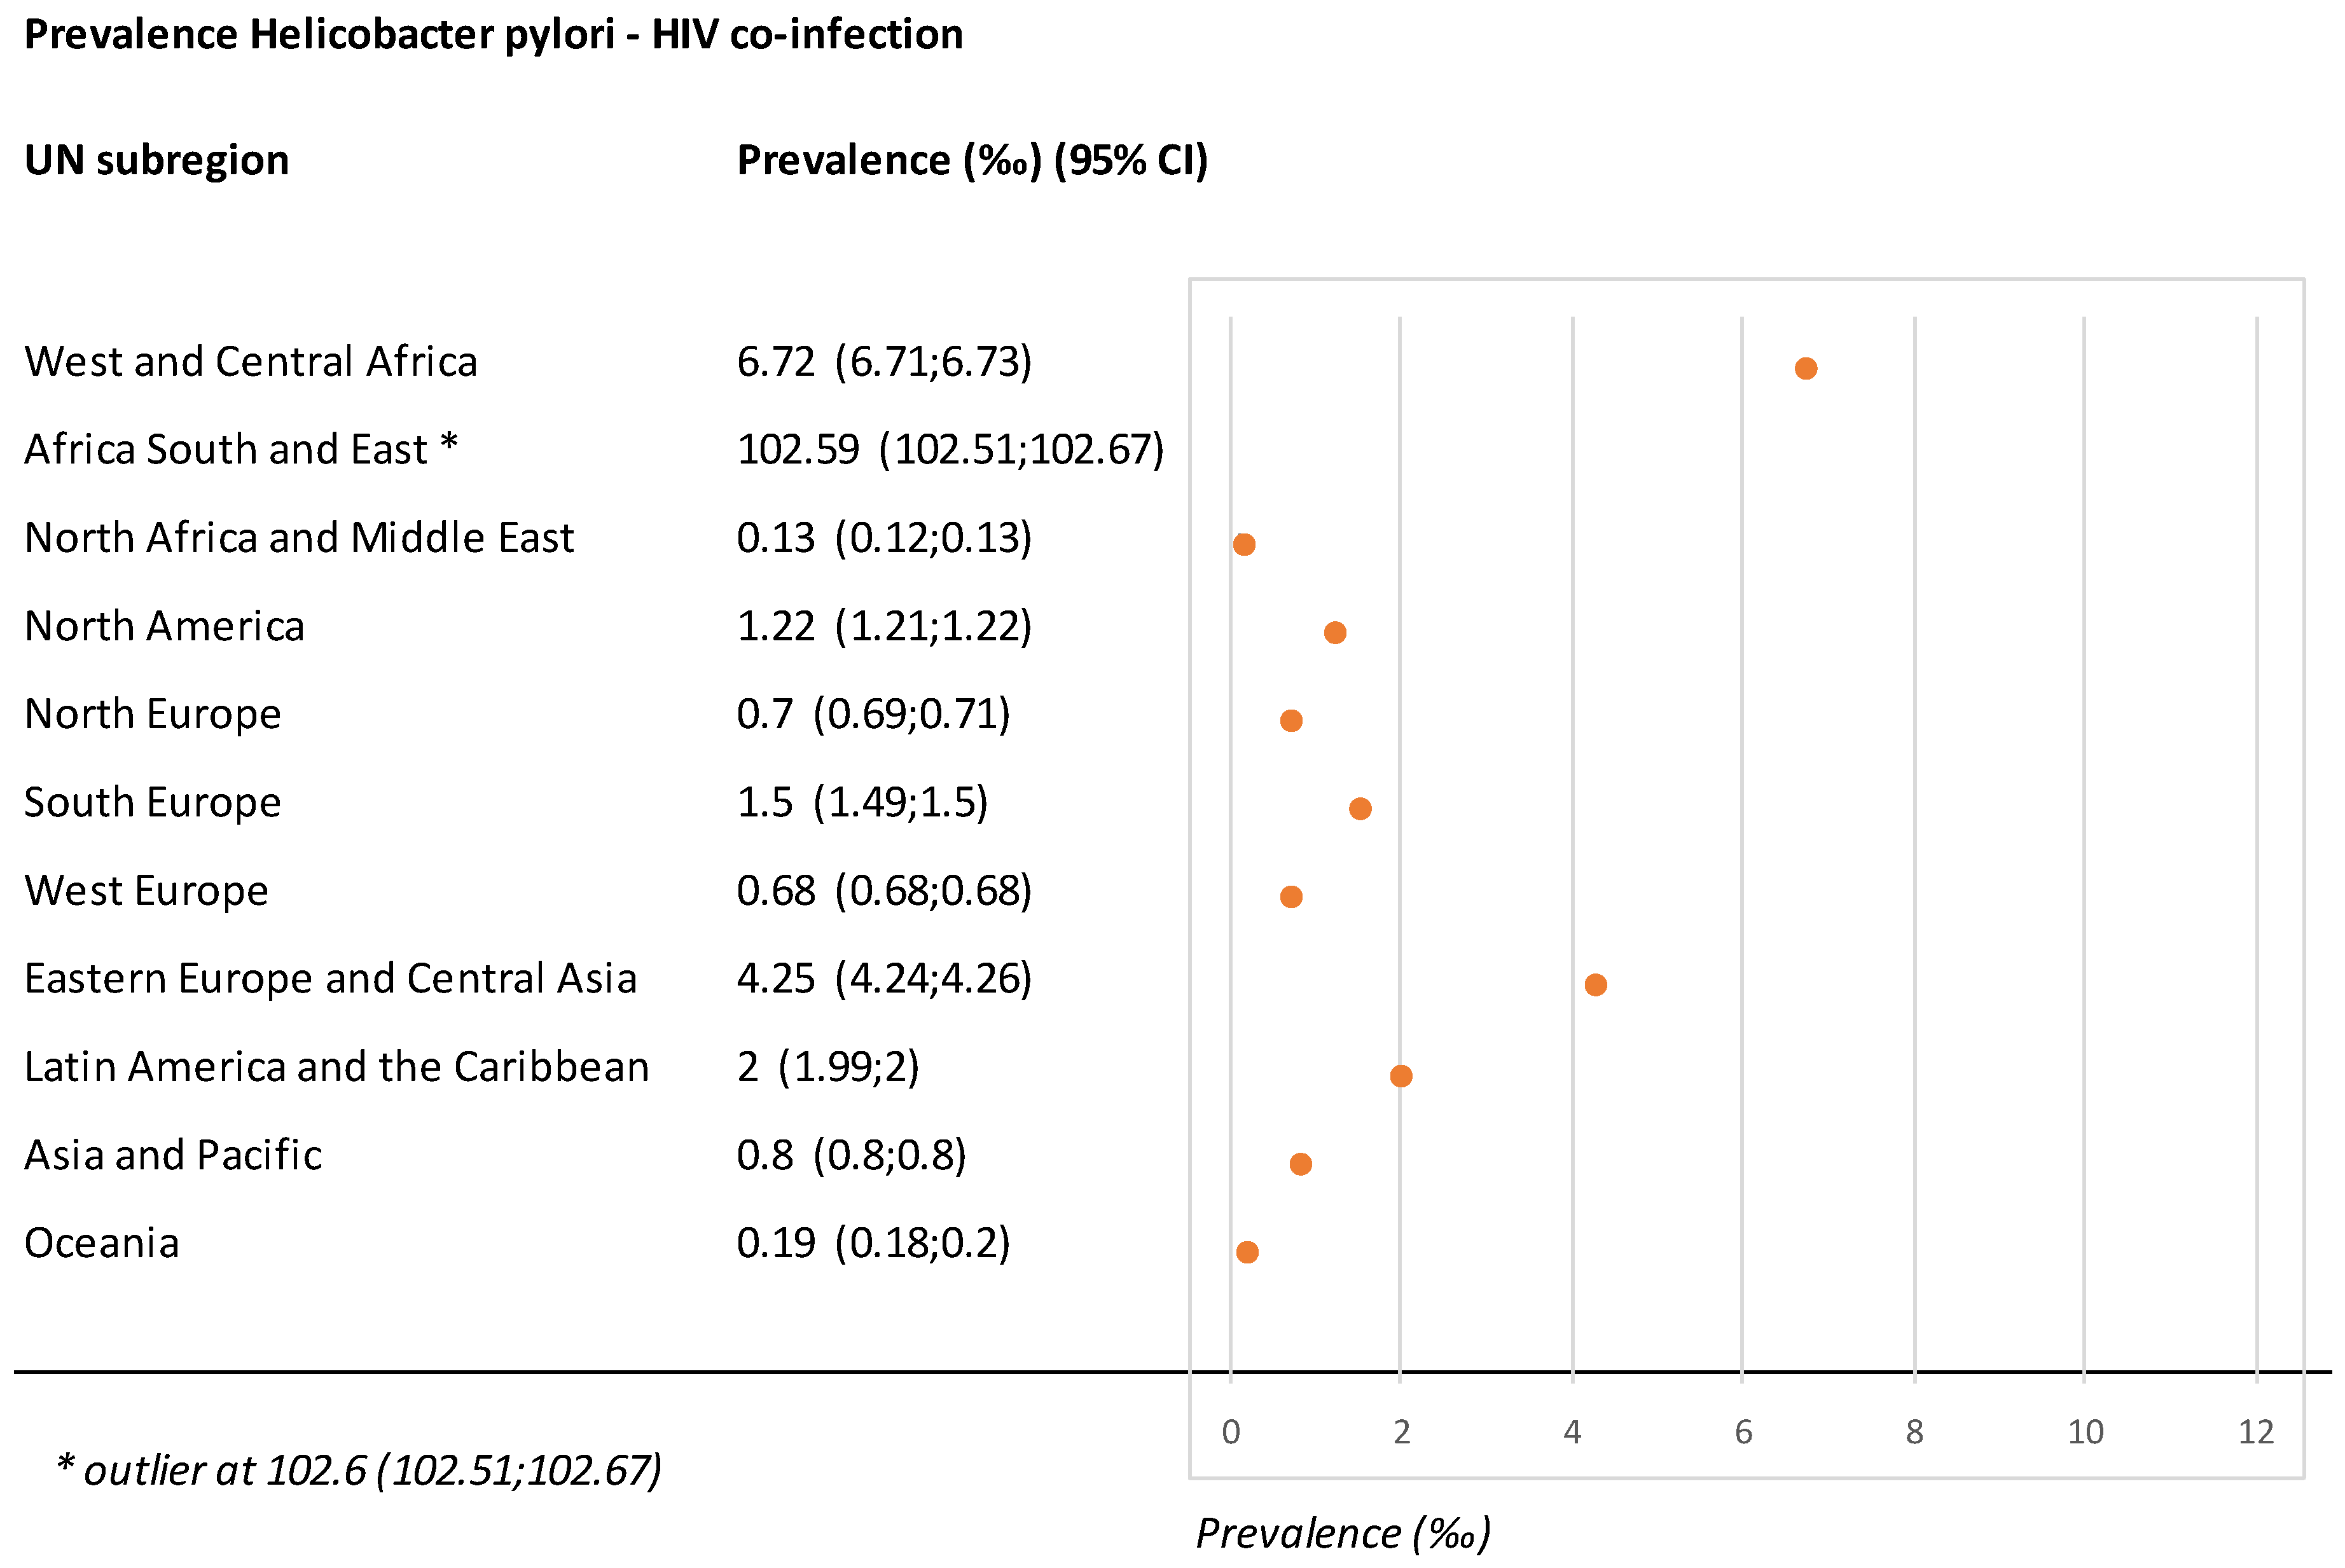
- Co-infection data by region or on a global scale.
3. Results
4. Discussion
Supplementary Materials
Author Contributions
Funding
Data Availability Statement
Acknowledgments
Conflicts of Interest
References
- Marshall, B.J.; Warren, J.R. Unidentified curved bacilli in the stomach of patients with gastritis and peptic ulceration. Lancet 1984, 1, 1311–1315. [Google Scholar] [CrossRef] [PubMed]
- Crowe, S.E. Helicobacter pylori Infection. N. Engl. J. Med. 2019, 380, 1158–1165. [Google Scholar] [CrossRef] [PubMed]
- Burgard, M.; Kotilea, K.; Mekhael, J.; Miendje-Deyi, V.Y.; De Prez, C.; Vanderpas, J.; Cadranel, S.; Bontems, P. Evolution of Helicobacter pylori associated with gastroduodenal ulcers or erosions in children over the past 23 years: Decline or steady state? Helicobacter 2019, 24, e12629. [Google Scholar] [CrossRef] [PubMed]
- Choi, I.J.; Kim, C.G.; Lee, J.Y.; Kim, Y.I.; Kook, M.C.; Park, B.; Joo, J. Family History of Gastric Cancer and Helicobacter pylori Treatment. N. Engl. J. Med. 2020, 382, 427–436. [Google Scholar] [CrossRef] [PubMed]
- Conteduca, V.; Sansonno, D.; Lauletta, G.; Russi, S.; Ingravallo, G.; Dammacco, F.H. Pylori infection and gastric cancer: State of the art (review). Int. J. Oncol. 2013, 42, 5–18. [Google Scholar] [CrossRef] [PubMed]
- Venneman, K.; Huybrechts, I.; Gunter, M.J.; Vandendaele, L.; Herrero, R.; Van Herck, K. The epidemiology of Helicobacter pylori infection in Europe and the impact of lifestyle on its natural evolution toward stomach cancer after infection: A systematic review. Helicobacter 2018, 23, e12483. [Google Scholar] [CrossRef]
- Lu, Y.; Xiao, F.; Wang, Y.; Wang, Z.; Liu, D.; Hong, F. Prevalence of Helicobacter pylori in Non-Cardia Gastric Cancer in China: A Systematic Review and Meta-Analysis. Front. Oncol. 2022, 12, 850389. [Google Scholar] [CrossRef]
- Smith, S.I.; Ajayi, A.; Jolaiya, T.; Onyekwere, C.; Setshedi, M.; Schulz, C.; Otegbayo, J.A.; Ndip, R.; Dieye, Y.; Alboraie, M.; et al. Helicobacter pylori Infection in Africa: Update of the Current Situation and Challenges. Dig. Dis. 2022, 40, 535–544. [Google Scholar] [CrossRef]
- Hooi, J.K.Y.; Lai, W.Y.; Ng, W.K.; Suen, M.M.Y.; Underwood, F.E.; Tanyingoh, D.; Malfertheiner, P.; Graham, D.Y.; Wong, V.W.S.; Wu, J.C.Y.; et al. Global Prevalence of Helicobacter pylori Infection: Systematic Review and Meta-Analysis. Gastroenterology 2017, 153, 420–429. [Google Scholar] [CrossRef]
- UNAIDS. HIV_Estimates_from_1990-to-Present. Available online: http://www.unaids.org/sites/default/files/media_asset/HIV_estimates_from_1990-to-present.xlsx (accessed on 2 October 2018).
- Deyi, V.M.; Vanderpas, J.; Bontems, P.; Van den Borre, C.; De Koster, E.; Cadranel, S.; Burette, A. Marching cohort of Helicobacter pylori infection over two decades (1988–2007): Combined effects of secular trend and population migration. Epidemiol. Infect. 2011, 139, 572–580. [Google Scholar] [CrossRef]
- Maartens, G.; Celum, C.; Lewin, S.R. HIV infection: Epidemiology, pathogenesis, treatment, and prevention. Lancet 2014, 384, 258–271. [Google Scholar] [CrossRef] [PubMed]
- Lv, F.J.; Luo, X.L.; Meng, X.; Jin, R.; Ding, H.G.; Zhang, S.T. A low prevalence of H pylori and endoscopic findings in HIV-positive Chinese patients with gastrointestinal symptoms. World J. Gastroenterol. 2007, 13, 5492–5496. [Google Scholar] [CrossRef] [PubMed]
- Kang, J.S.; Lee, S.H.; Lee, S.; Kim, G.H.; Park, Y.J.; Han, I.S.; Lee, J.E.; Lee, S.O.; Moon, C. Role of Upper Gastrointestinal Endoscopy in Patients with Human Immunodeficiency Virus Infection in the Era of Combination Antiretroviral Therapy. Infect. Chemother. 2019, 51, 35–44. [Google Scholar] [CrossRef]
- Nkuize, M.; De Wit, S.; Muls, V.; Arvanitakis, M.; Buset, M. Upper gastrointestinal endoscopic findings in the era of highly active antiretroviral therapy. HIV Med. 2010, 11, 412–417. [Google Scholar] [CrossRef] [PubMed]
- Chehter, E.Z.; Catapani, W.R.; Margeotto, F.B.; Germini, D.; Henriques, A.C. Helicobacter pylori in the Era of Highly Active Antiretroviral Therapy (HAART): A Review. JSM Gastroenterol. Hepatol. 2014, 2, 10. [Google Scholar]
- Nevin, D.T.; Morgan, C.J.; Graham, D.Y.; Genta, R.M. Helicobacter pylori gastritis in HIV-infected patients: A review. Helicobacter 2014, 19, 323–329. [Google Scholar] [CrossRef]
- Arya, S.; Kaji, A.H.; Boermeester, M.A. PRISMA Reporting Guidelines for Meta-analyses and Systematic Reviews. JAMA Surg. 2021, 156, 789–790. [Google Scholar] [CrossRef]
- Sasse, A.; Deblonde, J.; Jamine, D.; Ost, C.; Van Beckhoven, D. Epidémiologie du SIDA et de L’infection à VIH en Belgique. Situation au 31 Décembre 2016. Available online: https://www.sciensano.be/sites/default/files/rapport_vih_sida_2016_web.pdf (accessed on 10 February 2020).
- Central Intelligence Agency. The World Factbook. Available online: https://www.cia.gov/library/publications/the-world-factbook/fields/363rank.html (accessed on 11 November 2020).
- Be in the KNOW. HIV and AIDS in Asia & the Pacific Regional Overview. Updated 9 January 2020. Available online: https://www.beintheknow.org/understanding-hiv-epidemic/data (accessed on 31 October 2020).
- Syam, A.F.; Miftahussurur, M.; Makmun, D.; Nusi, I.A.; Zain, L.H.; Zulkhairi; Akil, F.; Uswan, W.B.; Simanjuntak, D.; Uchida, T.; et al. Risk Factors and Prevalence of Helicobacter pylori in Five Largest Islands of Indonesia: A Preliminary Study. PLoS ONE 2015, 10, e0140186. [Google Scholar] [CrossRef]
- Lee, J.E.; Lee, S.O.; Sim, Y.K.; Lee, S.; Kim, G.H.; Kang, J.S.; Lee, S.H. Seroprevalence of Helicobacter pylori in human immunodeficiency virus-infected patients in a tertiary care hospital in Busan, South Korea. J. Infect. Chemother. 2022, 28, 1143–1147. [Google Scholar] [CrossRef]
- Kafil, H.S.; Jahromi, F.F.; Hajikhani, B.; Shahin, N.P.; Aghazadeh, M. Screening for the presence of Helicobacter pylori in stool of HIV-positive patients. J. AIDS HIV Res. 2011, 3, 85–87. [Google Scholar]
- Mesfun, M.G.; Gliga, S.; Fuchs, A.; Orth, H.M.; Schönfeld, A.; Luedde, T.; Feldt, T. Prevalence of H. pylori among asymptomatic HIV-positive and negative individuals in Central Ethiopia and efficacy of eradication therapy. IJID Reg. 2022, 2, 169–174. [Google Scholar] [CrossRef] [PubMed]
- Vaira, D.; Miglioli, M.; Menegatti, M.; Holton, J.; Boschini, A.; Vergura, M.; Ricci, C.; Azzarone, P.; Mulè, P.; Barbara, L.; et al. Helicobacter pylori status, endoscopic findings, and serology in HIV-1-positive patients. Dig. Dis. Sci. 1995, 40, 1622–1626. [Google Scholar] [CrossRef] [PubMed]
- Mc Loughlin, R.M.; Sebastian, S.S.; O’Connor, H.J.; Buckley, M.; O’Morain, C.A. Review article: Test and treat or test and scope for Helicobacter pylori infection. Any change in gastric cancer prevention? Aliment. Pharmacol. Ther. 2003, 17 (Suppl. S2), 82–88. [Google Scholar] [CrossRef] [PubMed]
- UNAIDS. Annex on Methods. Part I Methods for Deriving UNAIDS HIV Estimates. UNAIDS DATA 2019. Available online: https://www.unaids.org/sites/default/files/media_asset/2019-UNAIDS-data_en.pdf (accessed on 7 January 2020).
- GBD 2017 Stomach Cancer Collaborators. The global, regional, and national burden of stomach cancer in 195 countries, 1990–2017: A systematic analysis for the Global Burden of Disease study 2017. Lancet Gastroenterol. Hepatol. 2020, 5, 42–54. [Google Scholar] [CrossRef]
- Graham, D.Y.; Malaty, H.M.; Evans, D.G.; Evans, D.J., Jr.; Klein, P.D.; Adam, E. Epidemiology of Helicobacter pylori in an asymptomatic population in the United States. Effect of age, race, and socioeconomic status. Gastroenterology 1991, 100, 1495–1501. [Google Scholar] [CrossRef]
- Mungazi, S.G.; Chihaka, O.B.; Muguti, G.I. Prevalence of Helicobacter pylori in asymptomatic patients at surgical outpatient department: Harare hospitals. Ann. Med. Surg. 2018, 35, 153–157. [Google Scholar] [CrossRef]
- Bakka, A.S.; El-Gariani, A.B.; AbouGhrara, F.M.; Salih, B.A. Frequency of Helicobacter pylori infection in dyspeptic patients in Libya. Saudi Med. J. 2002, 23, 1261–1265. [Google Scholar]
- Malfertheiner, P.; Megraud, F.; O’Morain, C.A.; Gisbert, J.P.; Kuipers, E.J.; Axon, A.T.; Bazzoli, F.; Gasbarrini, A.; Atherton, J.; Grahamet, D.Y.; et al. Management of Helicobacter pylori infection-the Maastricht V/Florence Consensus Report. Gut 2017, 66, 6–30. [Google Scholar] [CrossRef]
- Nkuize, M.; Vanderpas, J.; Buset, M.; Gomez-Galdon, M.; Delforge, M.; Miendje-Deyi, V.Y.; Muls, V.; De Wit, S. Primary antibiotic resistance of Helicobacter pylori isolates is twofold more frequent in HIV-positive than HIV-negative individuals: A descriptive observational study. Microbiologyopen 2021, 10, e1184. [Google Scholar] [CrossRef]
- Cacciarelli, A.G.; Marano, B.J., Jr.; Gualtieri, N.M.; Zuretti, A.R.; Torres, R.A.; Starpoli, A.A.; Robilotti, J.G. Lower Helicobacter pylori infection and peptic ulcer disease prevalence in patients with AIDS and suppressed CD4 counts. Am. J. Gastroenterol. 1996, 91, 1783–1784. [Google Scholar]
- Lionetti, P.; Amarri, S.; Silenzi, F.; Galli, L.; Cellini, M.; de Martino, M.; Vierucci, A. Prevalence of Helicobacter pylori infection detected by serology and 13C-urea breath test in HIV-1 perinatally infected children. J. Pediatr. Gastroenterol. Nutr. 1999, 28, 301–306. [Google Scholar] [CrossRef] [PubMed]
- Aceti, A.; Celestino, D.; Pennica, A.; Leri, O.; Caferro, M. Antibodies to Helicobacter pylori in HIV infection. Lancet 1990, 336, 571. [Google Scholar] [CrossRef] [PubMed]
- Greenland, S. Meta-analysis. In Modern Epidemiology, 2nd ed.; Rothman, K.J., Greenland, S., Eds.; 19106-3780; Lippincott Williams & Wilkins: Philadelphia, PA, USA, 1998; pp. 643–674. [Google Scholar]
- Nagata, N.; Nishijima, T.; Niikura, R.; Yokoyama, T.; Matsushita, Y.; Watanabe, K.; Teruya, K.; Kikuchi, Y.; Akiyama, J.; Yanase, M.; et al. Increased risk of non-AIDS-defining cancers in Asian HIV-infected patients: A long-term cohort study. BMC Cancer 2018, 18, 1066. [Google Scholar] [CrossRef]
- de Vries, A.C.; van Grieken, N.C.; Looman, C.W.; Casparie, M.K.; de Vries, E.; Meijer, G.A.; Kuipers, E.J. Gastric cancer risk in patients with premalignant gastric lesions: A nationwide cohort study in the Netherlands. Gastroenterology 2008, 134, 945–952. [Google Scholar] [CrossRef]
- IARC Lyon. Schistosomes, liver flukes and Helicobacter pylori. In IARC Monographs on the Evalutaion of Carcinogenic Risks to Humans; IARC: Lyon, France, 1994; Volume 61, pp. 1–241. [Google Scholar]
- Grulich, A.E.; van Leeuwen, M.T.; Falster, M.O.; Vajdic, C.M. Incidence of cancers in people with HIV/AIDS compared with immunosuppressed transplant recipients: A meta-analysis. Lancet 2007, 370, 59–67. [Google Scholar] [CrossRef] [PubMed]
- Sung, H.; Ferlay, J.; Siegel, R.L.; Laversanne, M.; Soerjomataram, I.; Jemal, A.; Bray, F. Global Cancer Statistics 2020: GLOBOCAN Estimates of Incidence and Mortality Worldwide for 36 Cancers in 185 Countries. CA Cancer J. Clin. 2021, 71, 209–249. [Google Scholar] [CrossRef]
- UNAIDS. AIDS-Related Deaths. All Ages Regional Datasheet. Available online: https://aidsinfo.unaids.org/ (accessed on 12 November 2020).
- Ford, A.C.; Yuan, Y.; Forman, D.; Hunt, R.; Moayyedi, P. Helicobacter pylori eradication for the prevention of gastric neoplasia. Cochrane Database Syst. Rev. 2020, 7, Cd005583. [Google Scholar]
- Kowada, A. Cost-effectiveness of Helicobacter pylori test and eradication versus upper gastrointestinal series versus endoscopy for gastric cancer mortality and outcomes in high prevalence countries. Scand. J. Gastroenterol. 2019, 54, 685–689. [Google Scholar] [CrossRef]
- Pimentel-Nunes, P.; Libânio, D.; Marcos-Pinto, R.; Areia, M.; Leja, M.; Esposito, G.; Garrido, M.; Kikuste, I.; Megraud, F.; Matysiak-Budnik, T.; et al. Management of epithelial precancerous conditions and lesions in the stomach (MAPS II): European Society of Gastrointestinal Endoscopy (ESGE), European Helicobacter and Microbiota Study Group (EHMSG), European Society of Pathology (ESP), and Sociedade Portuguesa de Endoscopia Digestiva (SPED) guideline update 2019. Endoscopy 2019, 51, 365–388. [Google Scholar]
- Huang, H.-L.; Leung, C.Y.; Saito, E.; Katanoda, K.; Hur, C.; Kong, C.Y.; Nomura, S.; Shibuya, K. Effect and cost-effectiveness of national gastric cancer screening in Japan: A microsimulation modeling study. BMC Med. 2020, 18, 257. [Google Scholar] [CrossRef]
- Laszkowska, M.; Oh, A.; Hur, C. Screening for Upper Gastrointestinal Malignancies in the United States-Which Immigrant Groups Should Be Considered High-Risk? Gastroenterology 2020, 158, 4–8. [Google Scholar] [CrossRef] [PubMed]
- Karimi, P.; Islami, F.; Anandasabapathy, S.; Freedman, N.D.; Kamangar, F. Gastric cancer: Descriptive epidemiology, risk factors, screening, and prevention. Cancer Epidemiol. Biomark. Prev. 2014, 23, 700–713. [Google Scholar] [CrossRef] [PubMed]


| Population | HIV | Helicobacter pylori | Estimated Helicobacter pylori HIV Co-Infection | |||||
|---|---|---|---|---|---|---|---|---|
| UN region and country | Size | Size | Prevalence ‰ | Size | Prevalence % | Size | Preva lence ‰ | 95% confidence interval lower and upper limits |
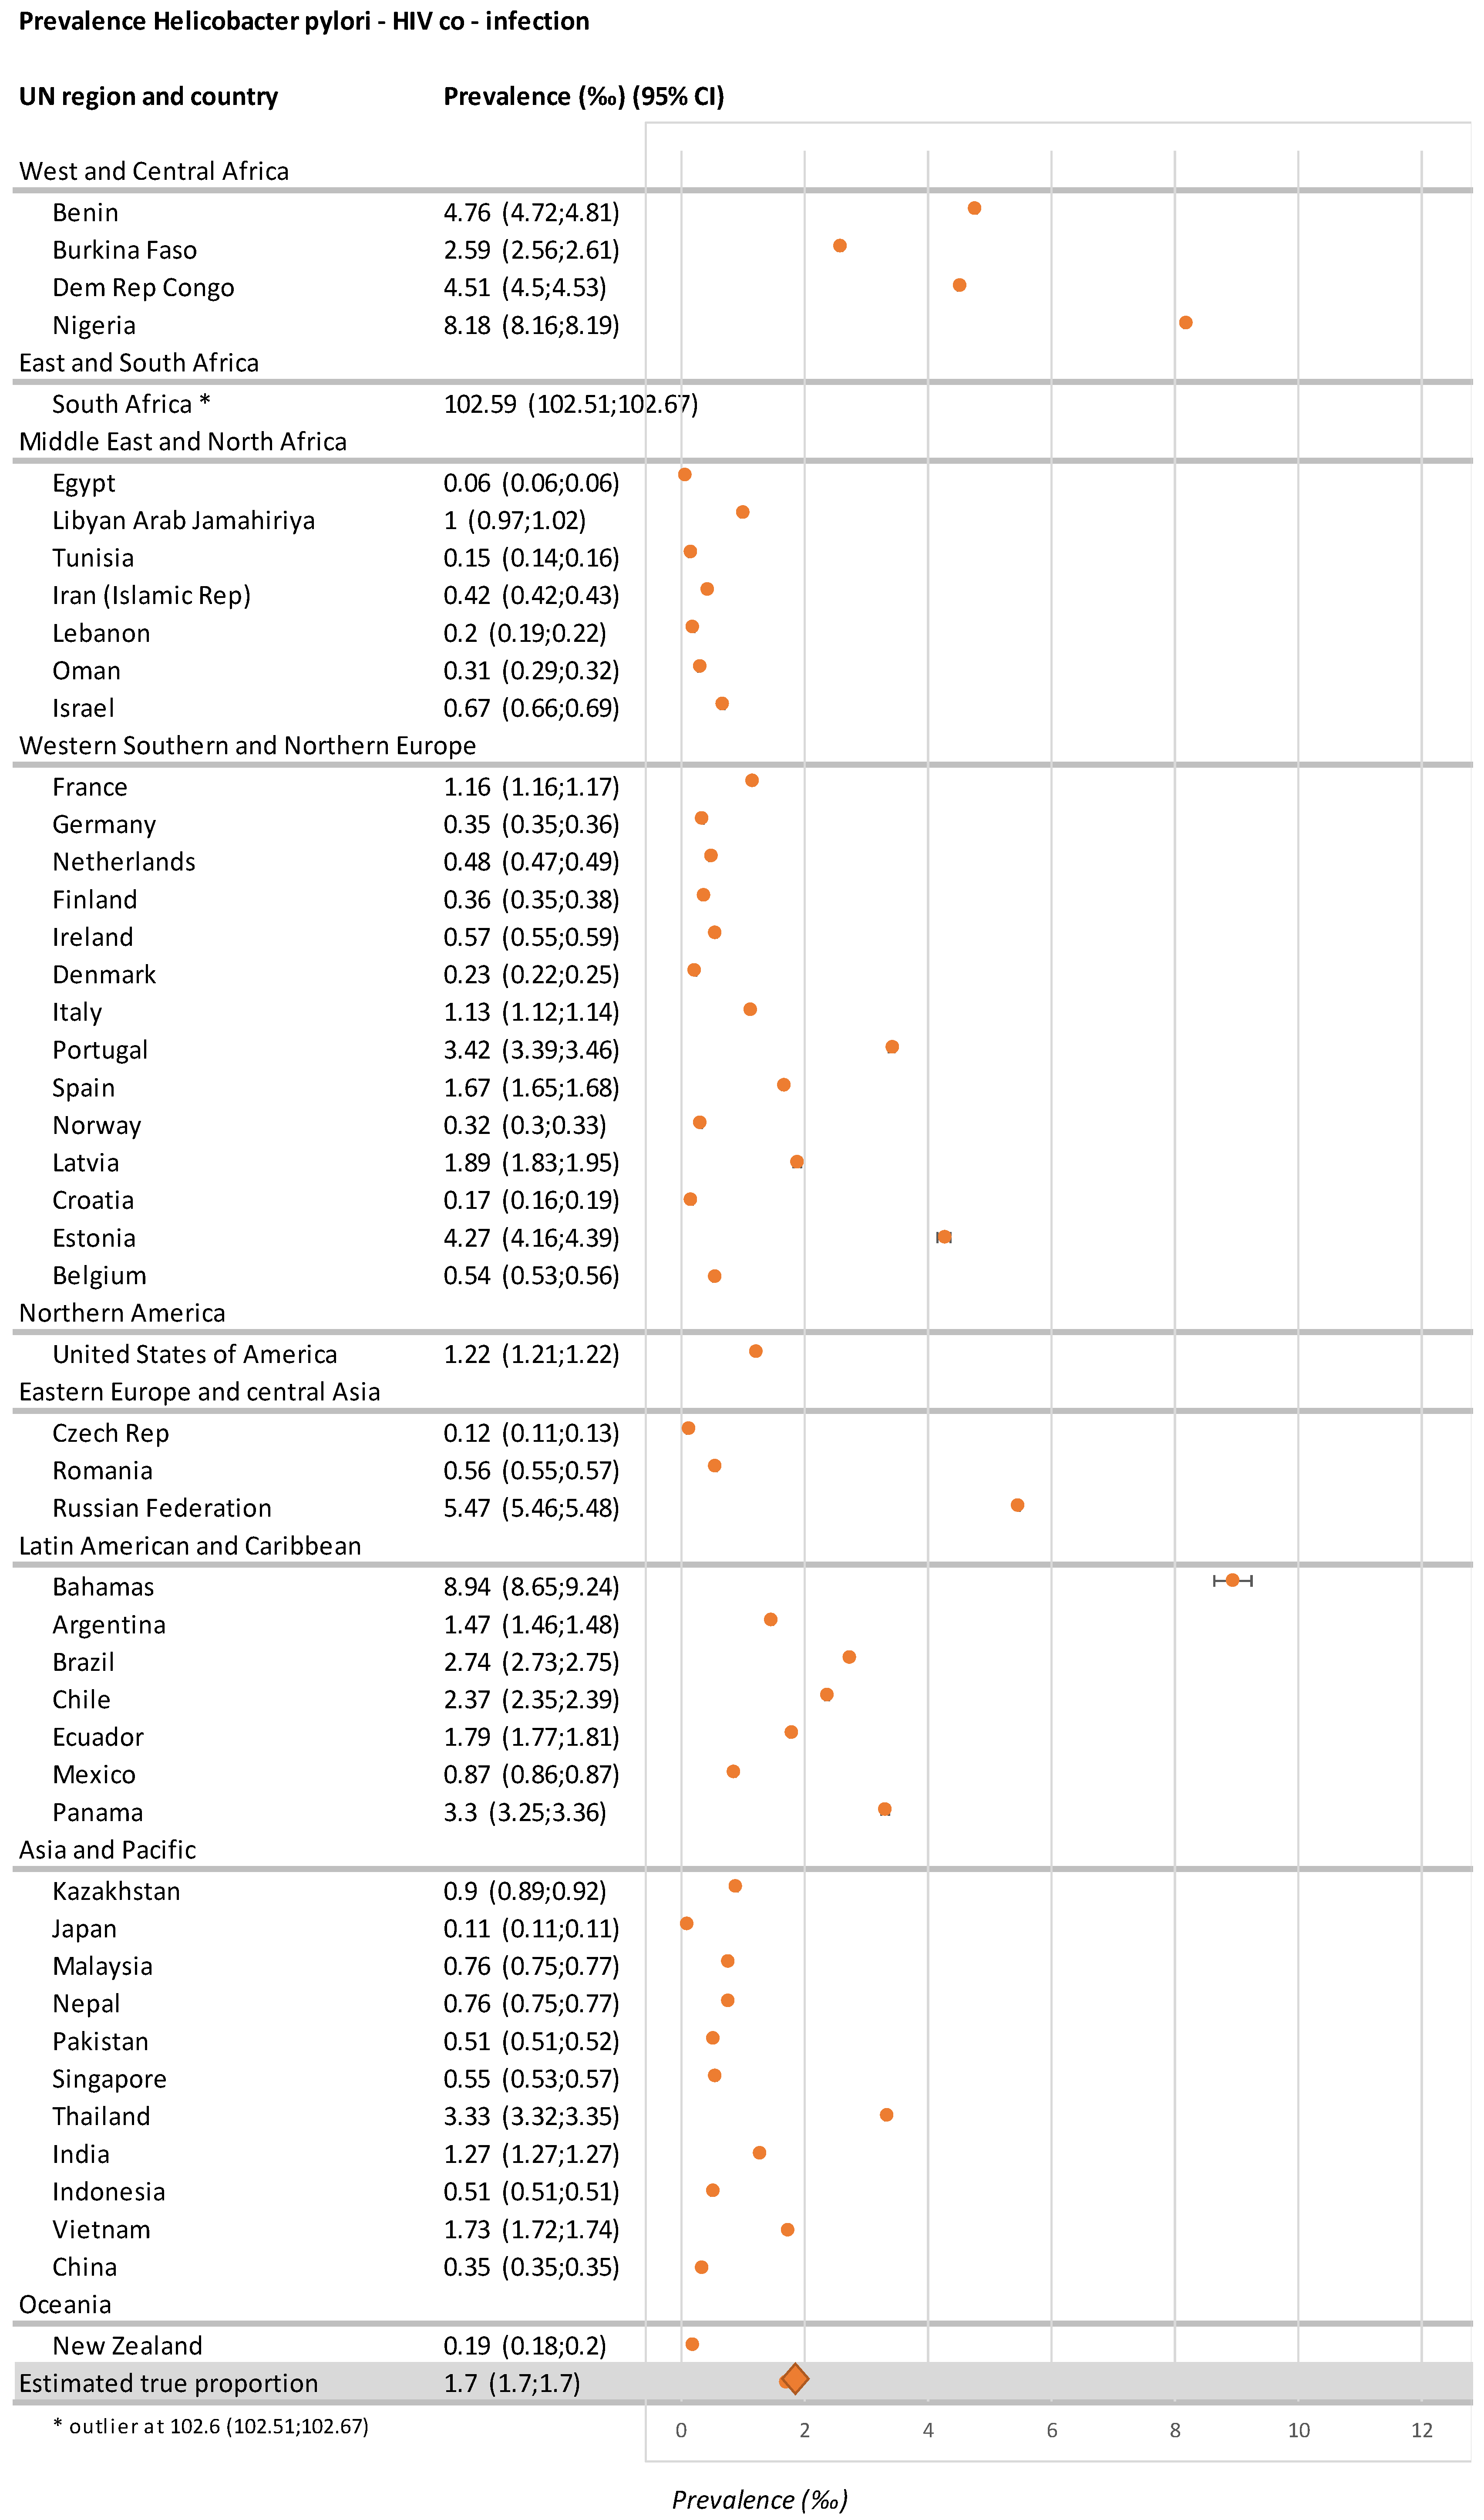
| West and Central Africa | ||||||||
| Benin | 10,880,000 | 70,000 | 6.4 | 8,056,640 | 74.05 | 51,835 | 4.8 | 4.72; 4.81 |
| Burkina Faso | 18,106,000 | 100,000 | 5.5 | 8,475,419 | 46.81 | 46,810 | 2.6 | 2.56; 2.61 |
| Dem Rep Congo | 77,267,000 | 450,000 | 5.8 | 59,835,565 | 77.44 | 348,480 | 4.5 | 4.51; 4.53 |
| Nigeria | 182,202,000 | 1,700,000 | 9.3 | 159,700,053 | 87.65 | 1,490,050 | 8.2 | 8.16; 8.19 |
| East and South Africa | ||||||||
| South Africa | 54,490,000 | 7,200,000 | 132.1 | 42,306,036 | 77.64 | 5,590,080 | 102.6 | 102.51; 102.67 |
| Middle East and North Africa | ||||||||
| Egypt | 91,508,000 | 14,000 | 0.2 | 37,435,923 | 40.91 | 5727 | 0.1 | 0.06; 0.06 |
| Libyan Arab Jamahiriya | 6,278,000 | 8200 | 1.3 | 4,795,764 | 76.39 | 6264 | 1.0 | 0.97; 1.02 |
| Tunisia | 11,254,000 | 2300 | 0.2 | 8,191,787 | 72.79 | 1674 | 0.2 | 0.14; 0.16 |
| Iran (Islamic Rep) | 79,109,000 | 57,000 | 0.7 | 46,658,488 | 58.98 | 33,619 | 0.4 | 0.42; 0.43 |
| Lebanon | 5,851,000 | 2300 | 0.4 | 3,039,595 | 51.95 | 1195 | 0.2 | 0.19; 0.22 |
| Oman | 4,491,000 | 2800 | 0.6 | 2,205,081 | 49.10 | 1375 | 0.3 | 0.29; 0.32 |
| Israel | 8,064,000 | 7900 | 0.1 | 5,555,290 | 68.89 | 5442 | 0.7 | 0.66; 0.69 |
| Western, Southern, and Northern Europe | ||||||||
| France | 64,395,000 | 160,000 | 2.5 | 30,188,376 | 46.88 | 75,008 | 1.2 | 1.16; 1.17 |
| Germany | 80,689,000 | 81,000 | 1.0 | 28,483,217 | 35.30 | 28,593 | 0.4 | 0.35; 0.36 |
| Netherlands | 16,925,000 | 23,000 | 1.4 | 6,011,760 | 35.52 | 8170 | 0.5 | 0.47; 0.49 |
| Finland | 5,503,000 | 3500 | 0.6 | 3,124,603 | 56.78 | 1987 | 0.4 | 0.35; 0.38 |
| Ireland | 4,688,000 | 6200 | 1.3 | 2,015,840 | 43.00 | 2666 | 0.6 | 0.55; 0.59 |
| Denmark | 5,669,000 | 6000 | 1.1 | 1,254,550 | 22.13 | 1328 | 0.2 | 0.22; 0.25 |
| Italy | 59,798,000 | 120,000 | 2.0 | 33,606,476 | 56.20 | 67,440 | 1.1 | 1.12; 1.14 |
| Portugal | 10,350,000 | 41,000 | 4.0 | 8,942,400 | 86.4 | 35,424 | 3.4 | 3.39; 3.46 |
| Spain | 46,122,000 | 140,000 | 3.0 | 25,307,141 | 54.87 | 76,818 | 1.7 | 1.65; 1.68 |
| Norway | 5,211,000 | 5400 | 1.0 | 1,597,772 | 30.66 | 1656 | 0.3 | 0.3; 0.33 |
| Latvia | 1,971,000 | 4700 | 2.4 | 1,561,229 | 79.21 | 3723 | 1.9 | 1.83; 1.95 |
| Croatia | 4,240,000 | 1400 | 0.3 | 2,234,056 | 52.69 | 738 | 0.2 | 0.16; 0.19 |
| Estonia | 1,313,000 | 6800 | 5.2 | 1,083,356 | 82.51 | 5611 | 4.3 | 4.16; 4.39 |
| Belgium [19] | 11,299,000 | 18,758 | 1.7 | 3,694,773 | 32.70 | 6134 | 0.5 | 0.53; 0.56 |
| Northern America | ||||||||
| United States of America | 321,774,000 | 1,100,000 | 3.4 | 114,552,012 | 35.60 | 391,602 | 1.2 | 1.21; 1.22 |
| Eastern Europe and Central Asia | ||||||||
| Czech Rep | 10,543,000 | 3100 | 0.3 | 4,342,662 | 41.19 | 1277 | 0.1 | 0.11; 0.13 |
| Romania | 19,511,000 | 16,000 | 0.8 | 13,372,839 | 68.54 | 10,966 | 0.6 | 0.55; 0.57 |
| Russian Federation [20] | 143,457,000 | 1,000,000 | 12.0 | 112,585,054 | 78.48 | 784,800 | 5.5 | 5.46; 5.48 |
| Latin American and Caribbean | ||||||||
| Bahamas | 388,000 | 6000 | 15.5 | 224,419 | 57.84 | 3470 | 8.9 | 8.65; 9.24 |
| Argentina | 43,417,000 | 130,000 | 3.0 | 21,313,406 | 49.09 | 63,817 | 1.5 | 1.46; 1.48 |
| Brazil | 207,848,000 | 800,000 | 3.8 | 147,946,206 | 71.18 | 569,440 | 2.7 | 2.73; 2.75 |
| Chile | 17,948,000 | 57,000 | 3.2 | 13,382,824 | 74.56 | 42,502 | 2.4 | 2.35; 2.39 |
| Ecuador | 16,144,000 | 40,000 | 2.5 | 11,659,197 | 72.22 | 28,888 | 1.8 | 1.77; 1.81 |
| Mexico | 127,017,000 | 210,000 | 1.7 | 66,709,328 | 52.52 | 110,292 | 0.9 | 0.86; 0.87 |
| Panama | 3,929,000 | 24,000 | 6.1 | 2,123,625 | 54.05 | 12,972 | 3.3 | 3.25; 3.36 |
| Asia and Pacific | ||||||||
| Kazakhstan | 17,625,000 | 20,000 | 1.1 | 14,013,638 | 79.51 | 15,902 | 0.9 | 0.89; 0.92 |
| Japan | 126,573,000 | 27,000 | 0.2 | 65,387,612 | 51.66 | 13,948 | 0.1 | 0.11; 0.11 |
| Malaysia | 30,331,000 | 81,000 | 2.7 | 8,674,699 | 28.60 | 23,166 | 0.8 | 0.75; 0.77 |
| Nepal | 28,514,000 | 31,000 | 1.1 | 19,974,057 | 70.05 | 21,716 | 0.8 | 0.75; 0.77 |
| Pakistan | 188,925,000 | 120,000 | 0.6 | 152,991,465 | 80.98 | 97,176 | 0.5 | 0.51; 0.52 |
| Singapore | 5,604,000 | 7600 | 1.4 | 2,287,553 | 40.82 | 3102 | 0.6 | 0.53; 0.57 |
| Thailand | 67,959,000 | 520,000 | 7.7 | 29,616,532 | 43.58 | 226,616 | 3.3 | 3.32; 3.35 |
| India ‡ | 1,311,051,000 | 2,622,102 | 2.0 | 831,8618,60 | 63.45 | 1,663,724 | 1.3 | 1.27; 1.27 |
| Indonesia § | 268,000,000 | 620,000 | 2.3 | 59,228,000 | 22.10 * | 137,020 | 0.5 | 0.51; 0.51 |
| Vietnam | 93,448,000 | 230,000 | 2.5 | 65,712,734 | 70.32 | 161,736 | 1.7 | 1.72; 1.74 |
| China | 1,376,049,000 | 850,000 | 0.6 | 768,452,328 | 55.84 | 476,399 | 0.35 | 0.35; 0.35 |
| Oceania | ||||||||
| New Zealand | 4,259,000 | 3200 | 0.8 | 1,085,148 | 25.48 | 815 | 0.2 | 0.18; 0.2 |
| All cited countries | 5,297,987,000 | 18,750,260 | 3.5 | 3,062,858,388 | 57.81 | 5,206,859 | 1.7 # | 1.7; 1.7 |
Disclaimer/Publisher’s Note: The statements, opinions and data contained in all publications are solely those of the individual author(s) and contributor(s) and not of MDPI and/or the editor(s). MDPI and/or the editor(s) disclaim responsibility for any injury to people or property resulting from any ideas, methods, instructions or products referred to in the content. |
© 2023 by the authors. Licensee MDPI, Basel, Switzerland. This article is an open access article distributed under the terms and conditions of the Creative Commons Attribution (CC BY) license (https://creativecommons.org/licenses/by/4.0/).
Share and Cite
Nkuize, M.; De Wit, S.; Demetter, P.; Eisendrath, P.; Vanderpas, J. Helicobacter pylori and Human Immunodeficiency Virus Co-Infection: Potential Implications for Future Gastric Cancer Risk. Microorganisms 2023, 11, 887. https://doi.org/10.3390/microorganisms11040887
Nkuize M, De Wit S, Demetter P, Eisendrath P, Vanderpas J. Helicobacter pylori and Human Immunodeficiency Virus Co-Infection: Potential Implications for Future Gastric Cancer Risk. Microorganisms. 2023; 11(4):887. https://doi.org/10.3390/microorganisms11040887
Chicago/Turabian StyleNkuize, Marcel, Stéphane De Wit, Pieter Demetter, Pierre Eisendrath, and Jean Vanderpas. 2023. "Helicobacter pylori and Human Immunodeficiency Virus Co-Infection: Potential Implications for Future Gastric Cancer Risk" Microorganisms 11, no. 4: 887. https://doi.org/10.3390/microorganisms11040887