

Improving Grapevine Heat Stress Resilience with Marine Plant Growth-Promoting Rhizobacteria Consortia
 ,
,  , , , , , , , , , , ,
  and
and 
Abstract
:1. Introduction
2. Materials and Methods
2.1. Plant and Growing Conditions
2.2. Rhizobacteria Used for Inoculation in This Study

| Consortium Number | Bacterial Strains | Biofilm Production | P-Solubilization (mm halo) | Siderophore Production (mm halo) | ACC Deaminase (µmoles α-cetog/h/mg Protein) | IAA Production (mg/mL) | N-Fixation | Reference |
|---|---|---|---|---|---|---|---|---|
| C1 | Pseudomonas composti SDT3 | − | + | 32 | − | − | − | [34] |
| Bacillus zhangzhouensis HPJ40 | + | 11 | 15 | − | − | + | [35] | |
| Pseudarthrobacter oxydans SRT15 | − | 9 | − | − | 20.99 | + | ||
| C2 | Aeromonas aquariorum SDT13 | − | + | 15 | − | 3.40 | − | [34] |
| Bacillus methylotrophicus SMT38 | + | − | 10 | − | − | + | [36] | |
| Bacillus aryabhattai SMT48 | − | 2.5 | 7 | − | 3.25 | + |
2.3. Preparation of Bacterial Inoculants
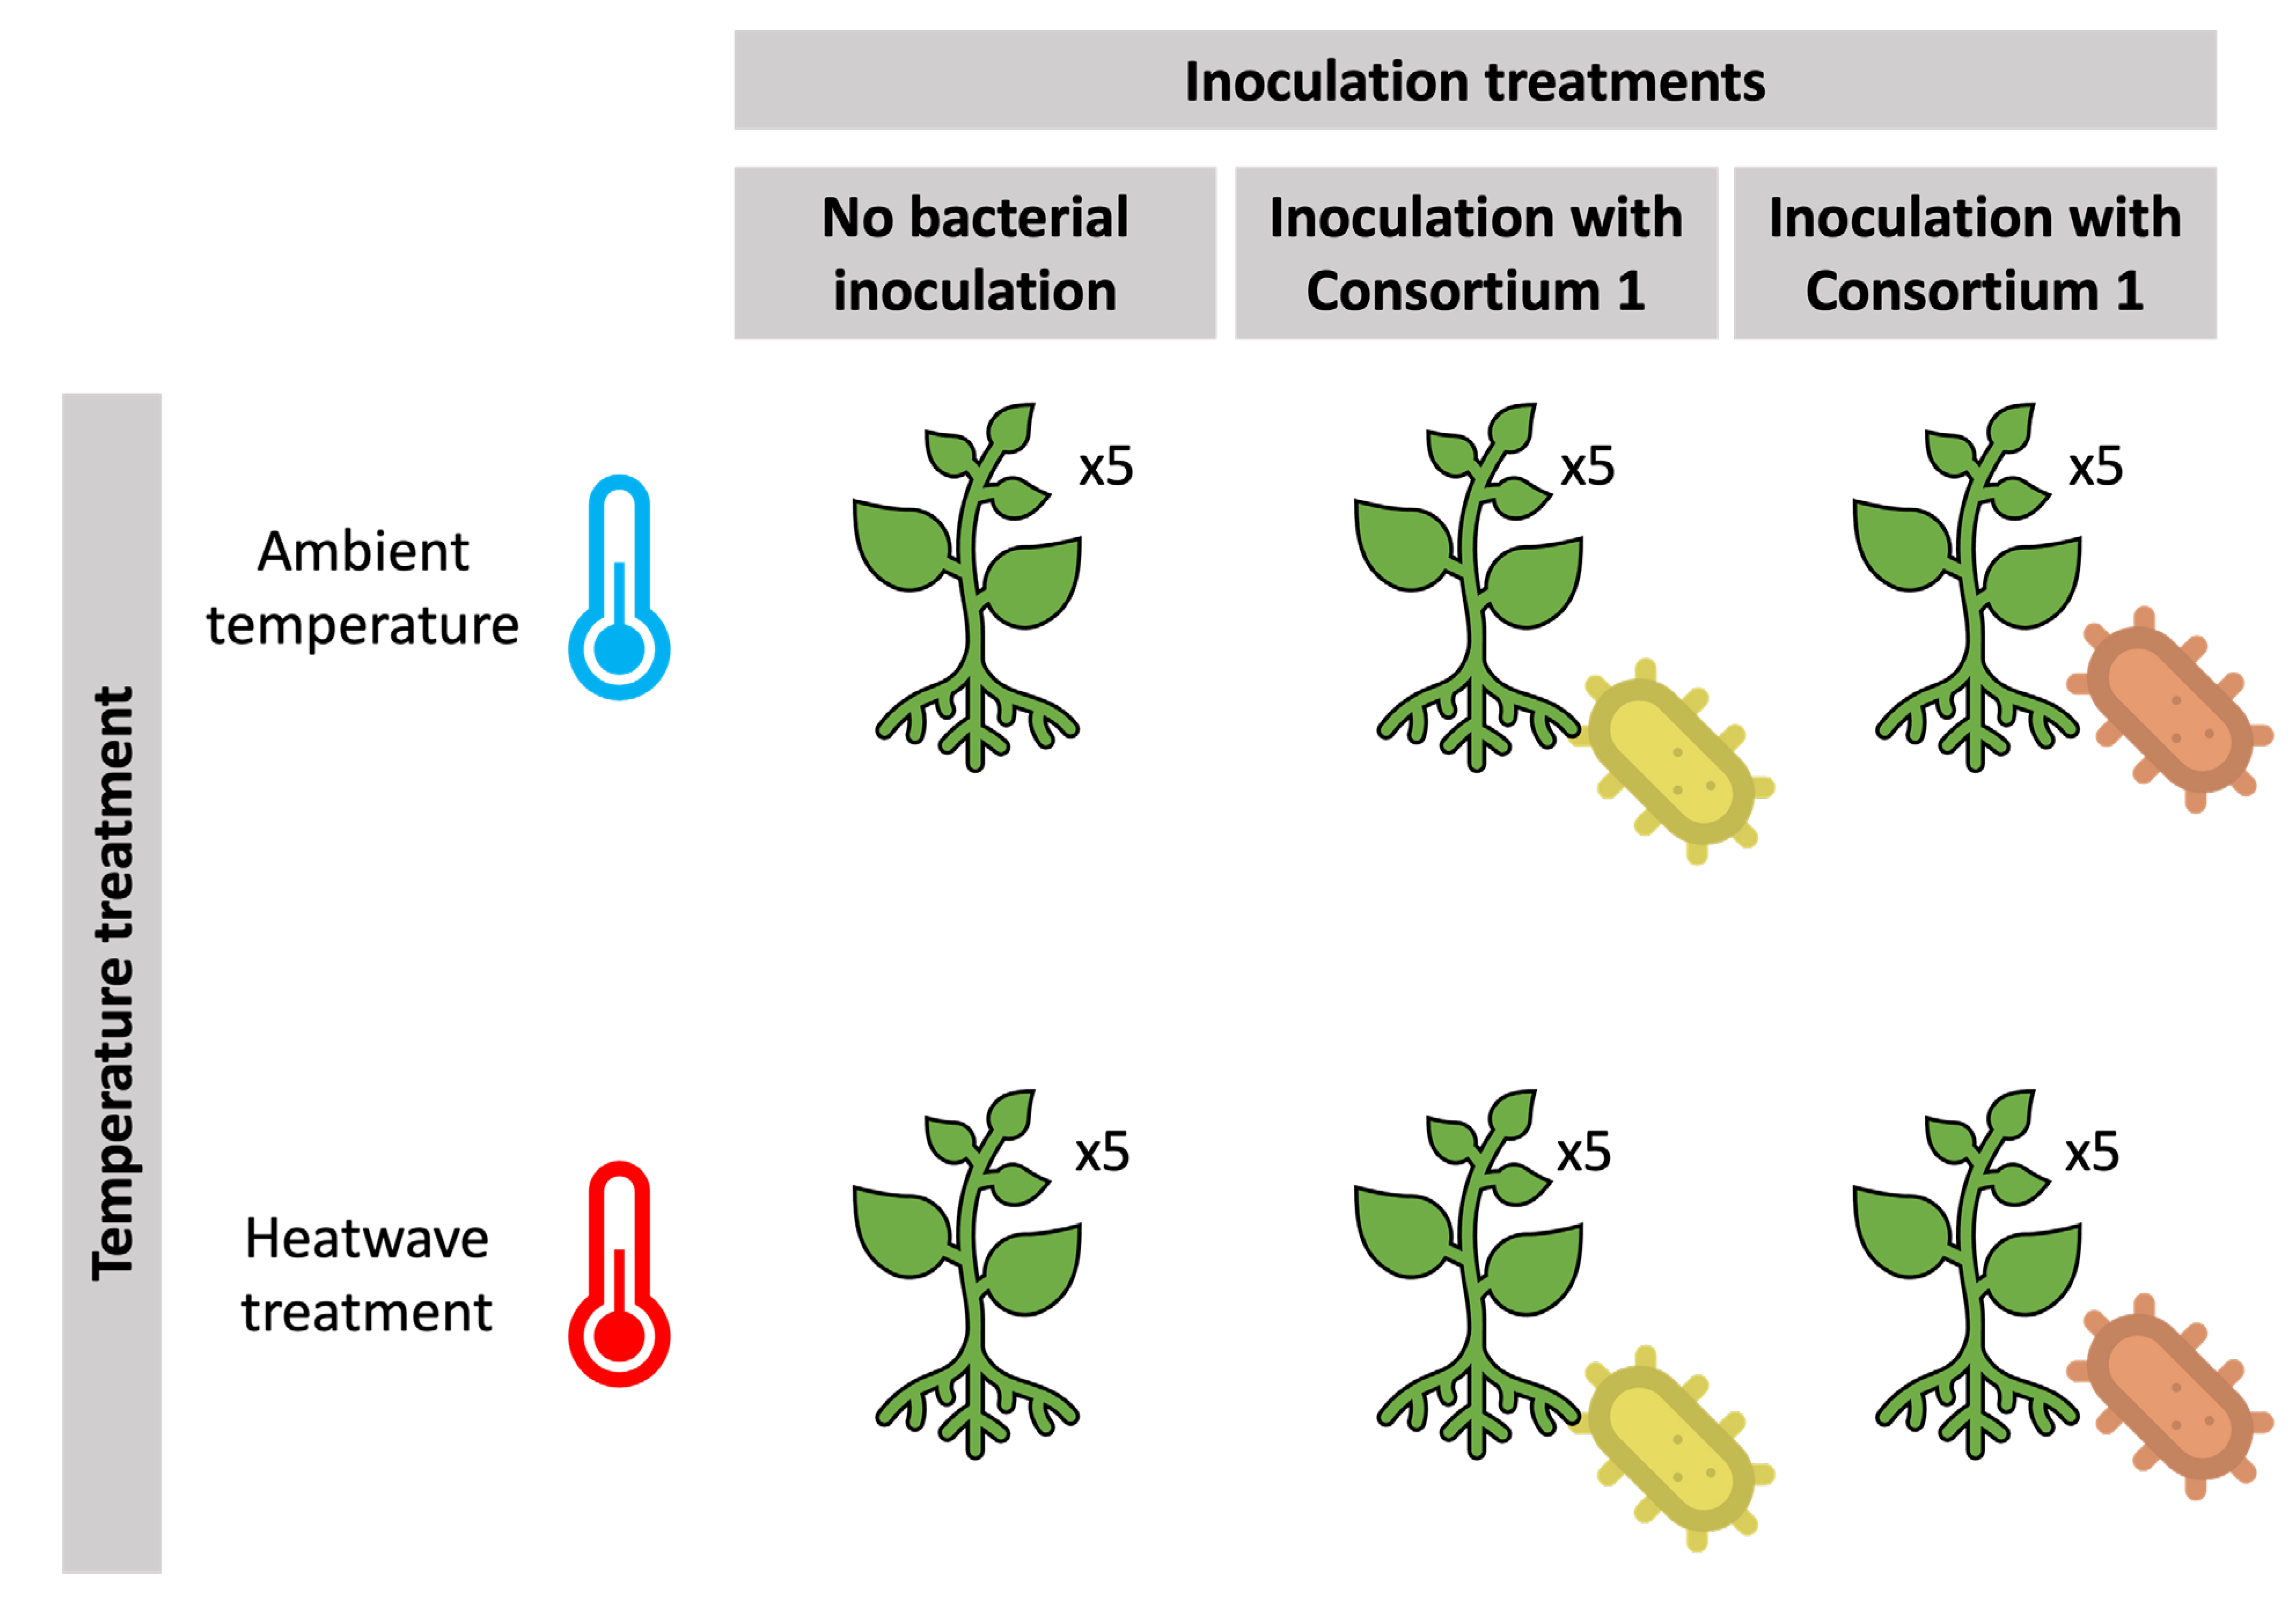
2.4. Experimental Setup and Root Inoculation
2.5. Leaf Infrared Thermography
2.6. Imaging Pulse Amplitude Modulated Fluorometry (iPAM)
2.7. Pigment Profiling
2.8. Proline Content
2.9. Oxidative Stress Biomarkers
2.10. Fatty Acid Profiles
2.11. Statistical Analysis
3. Results
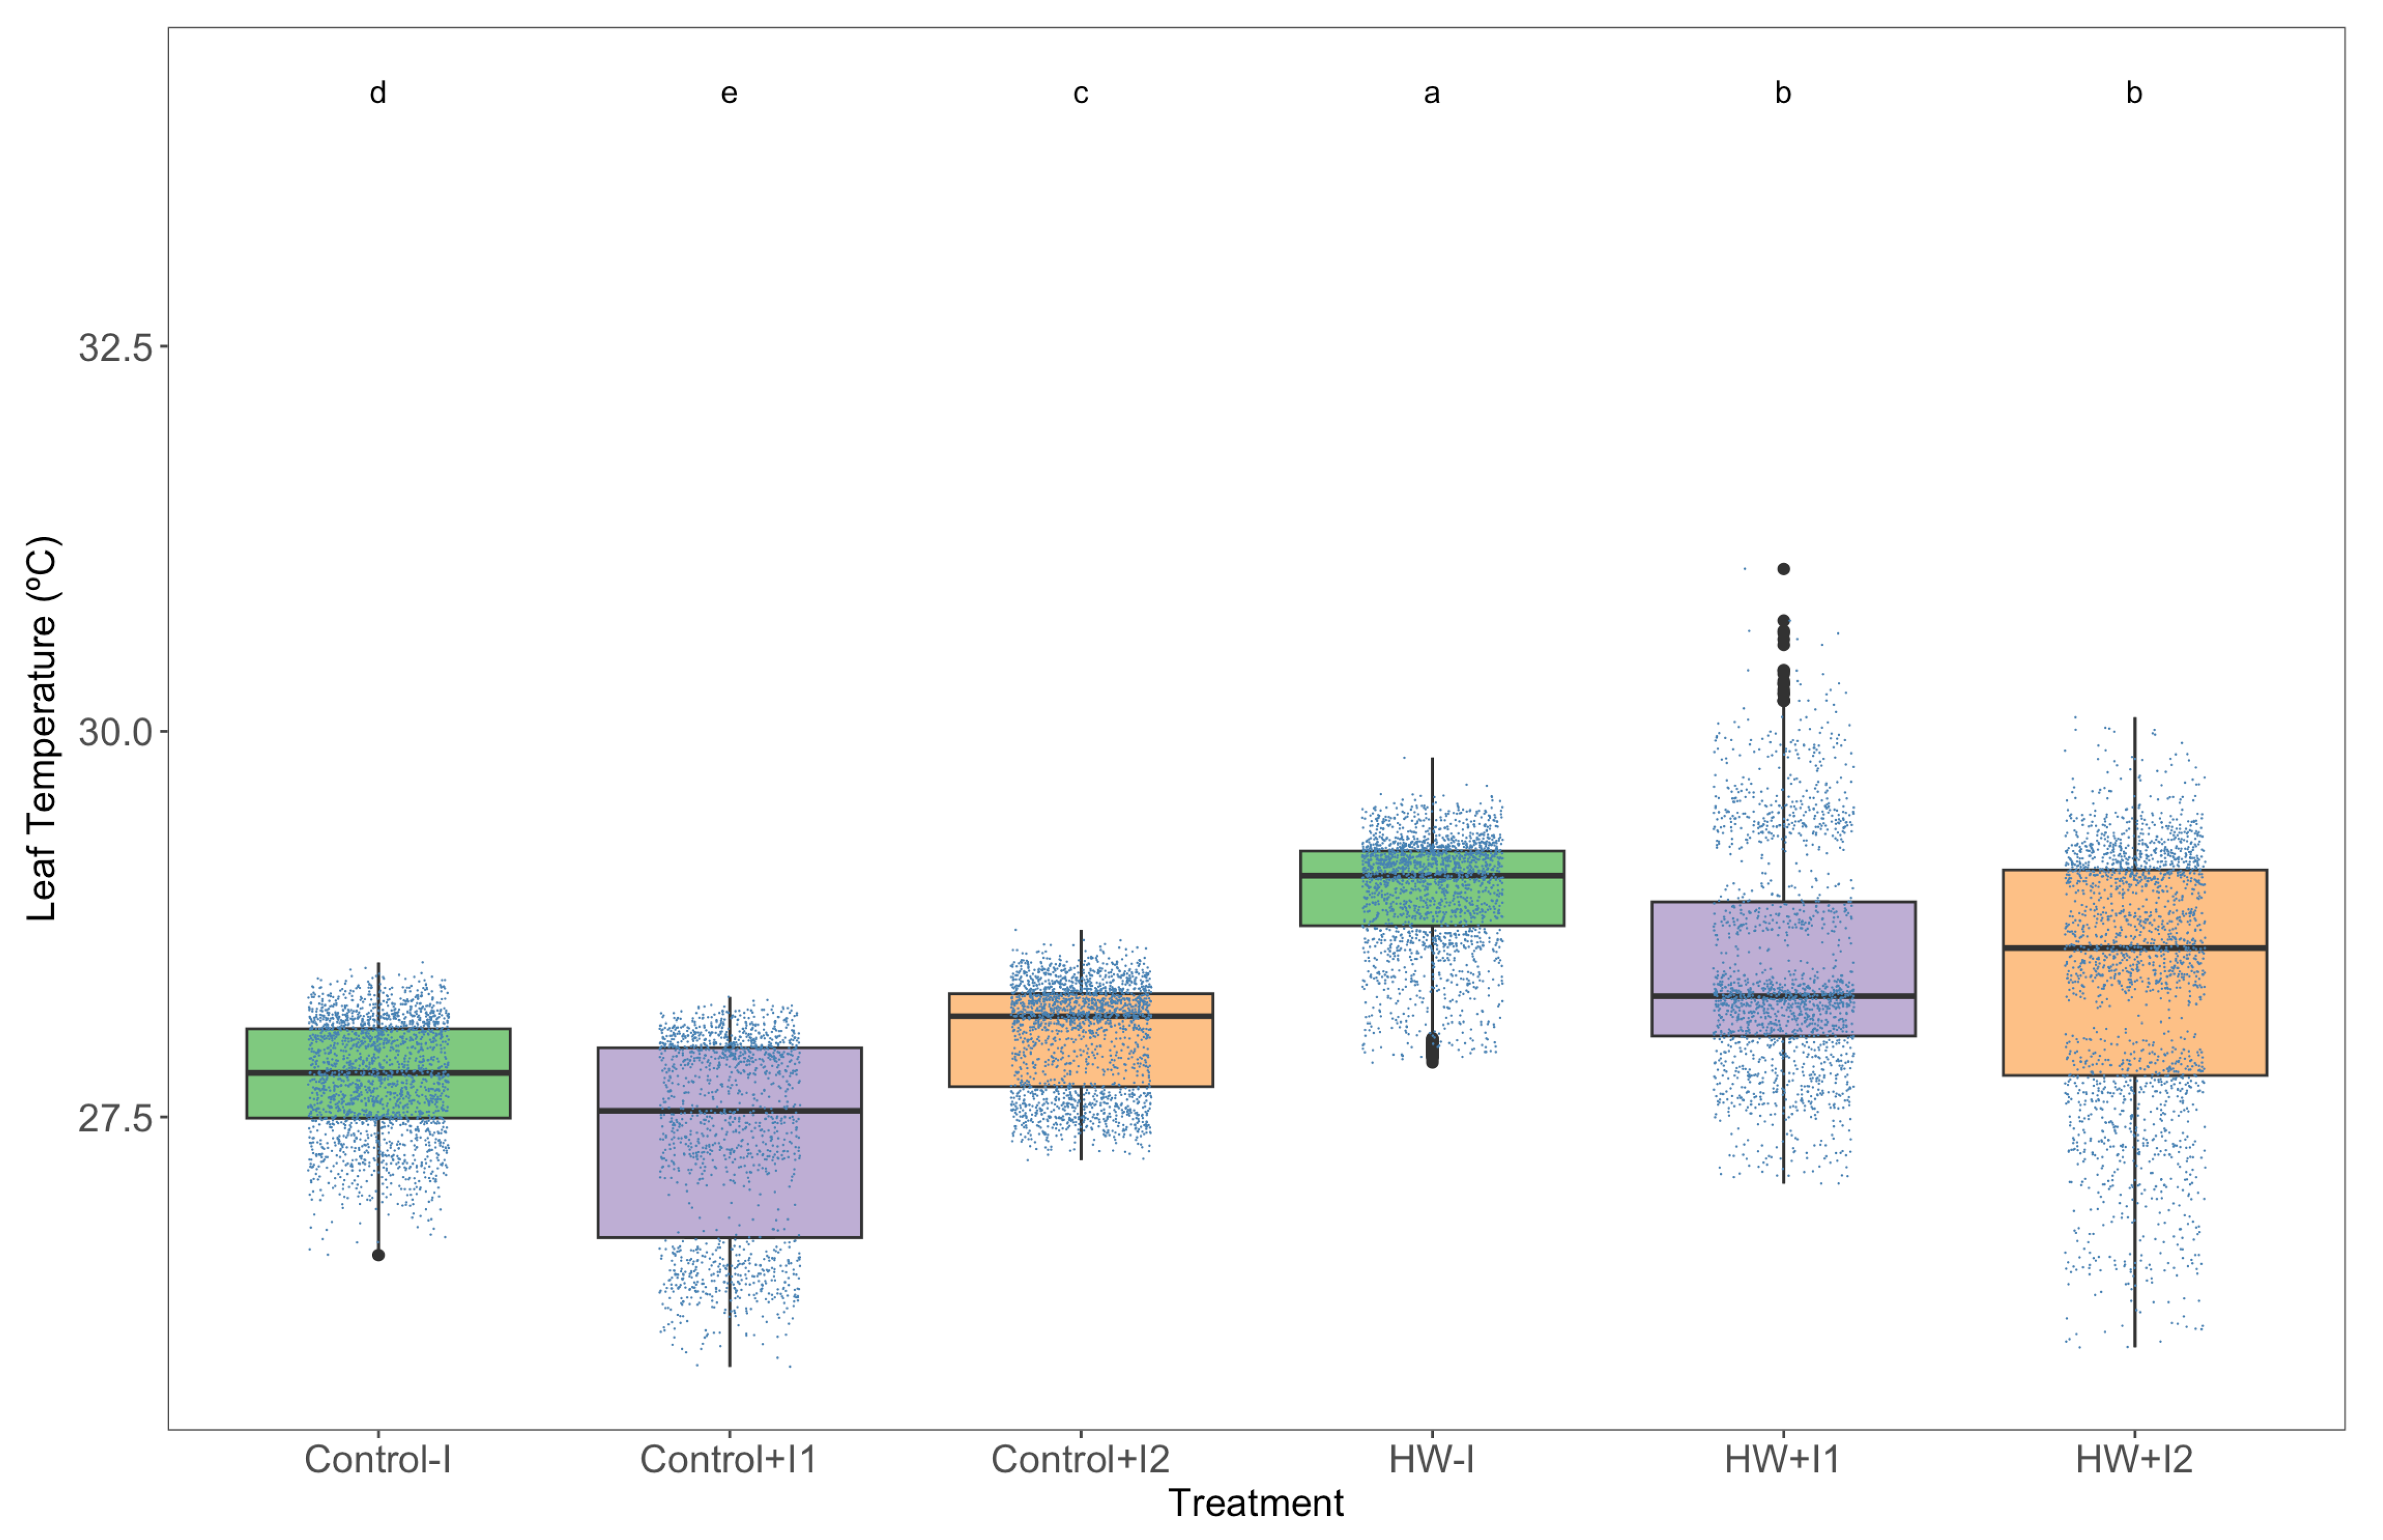
3.1. Thermography
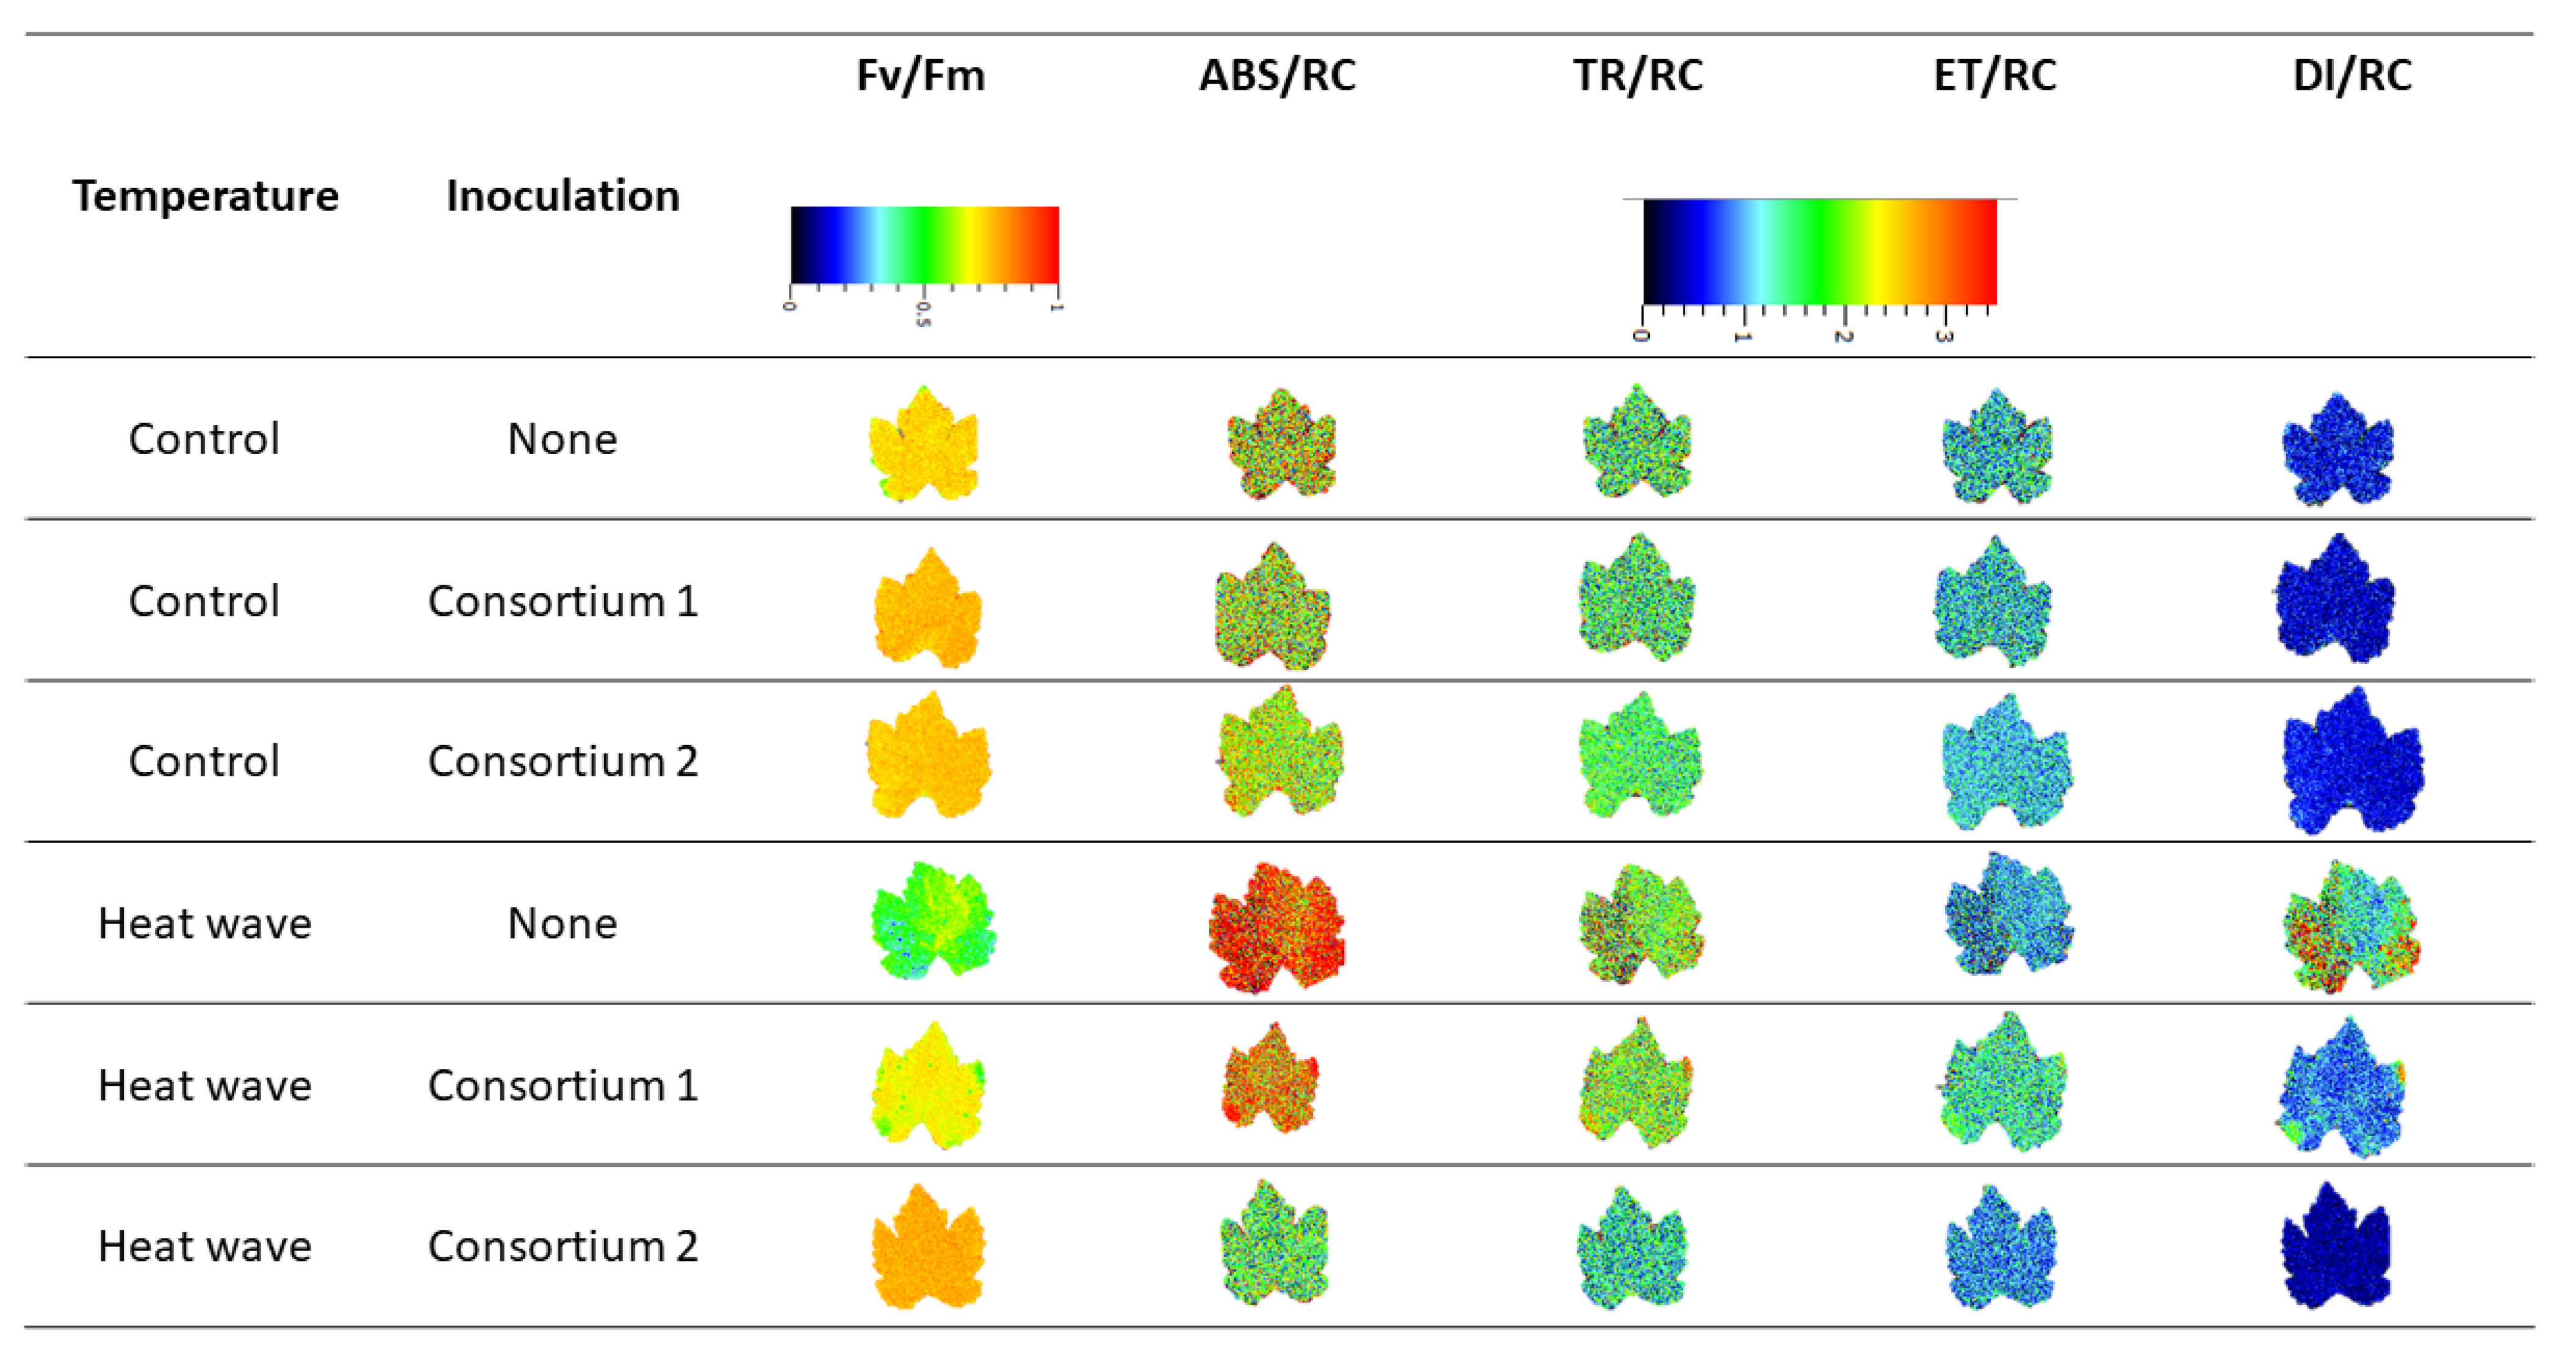
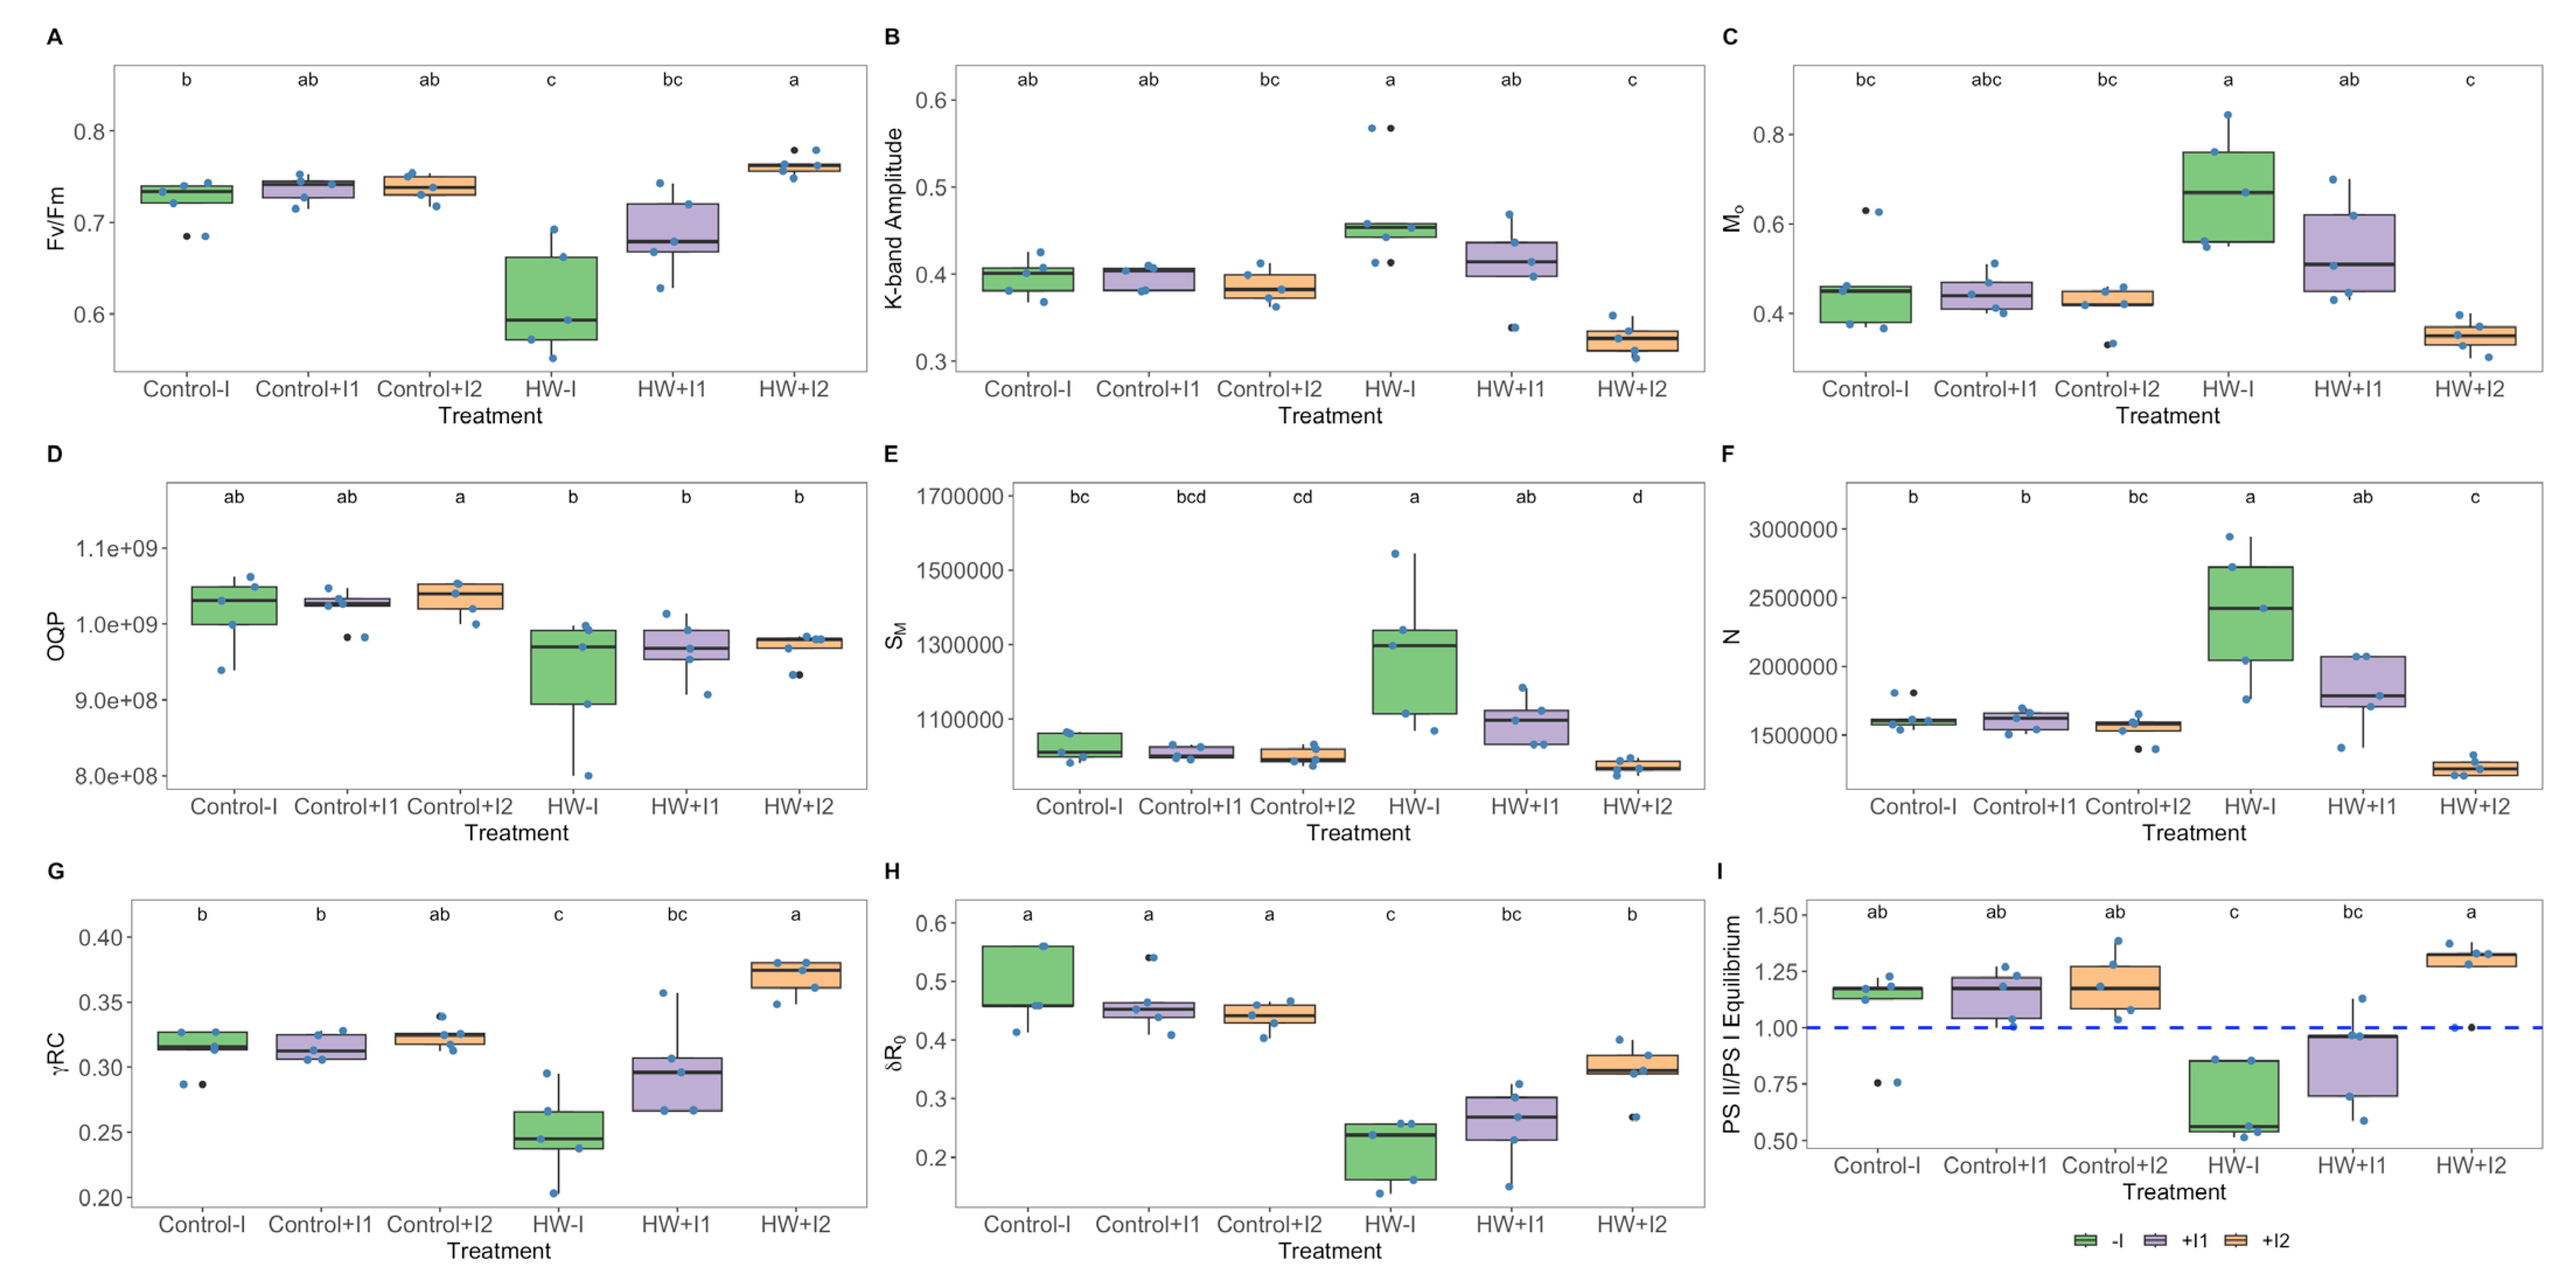
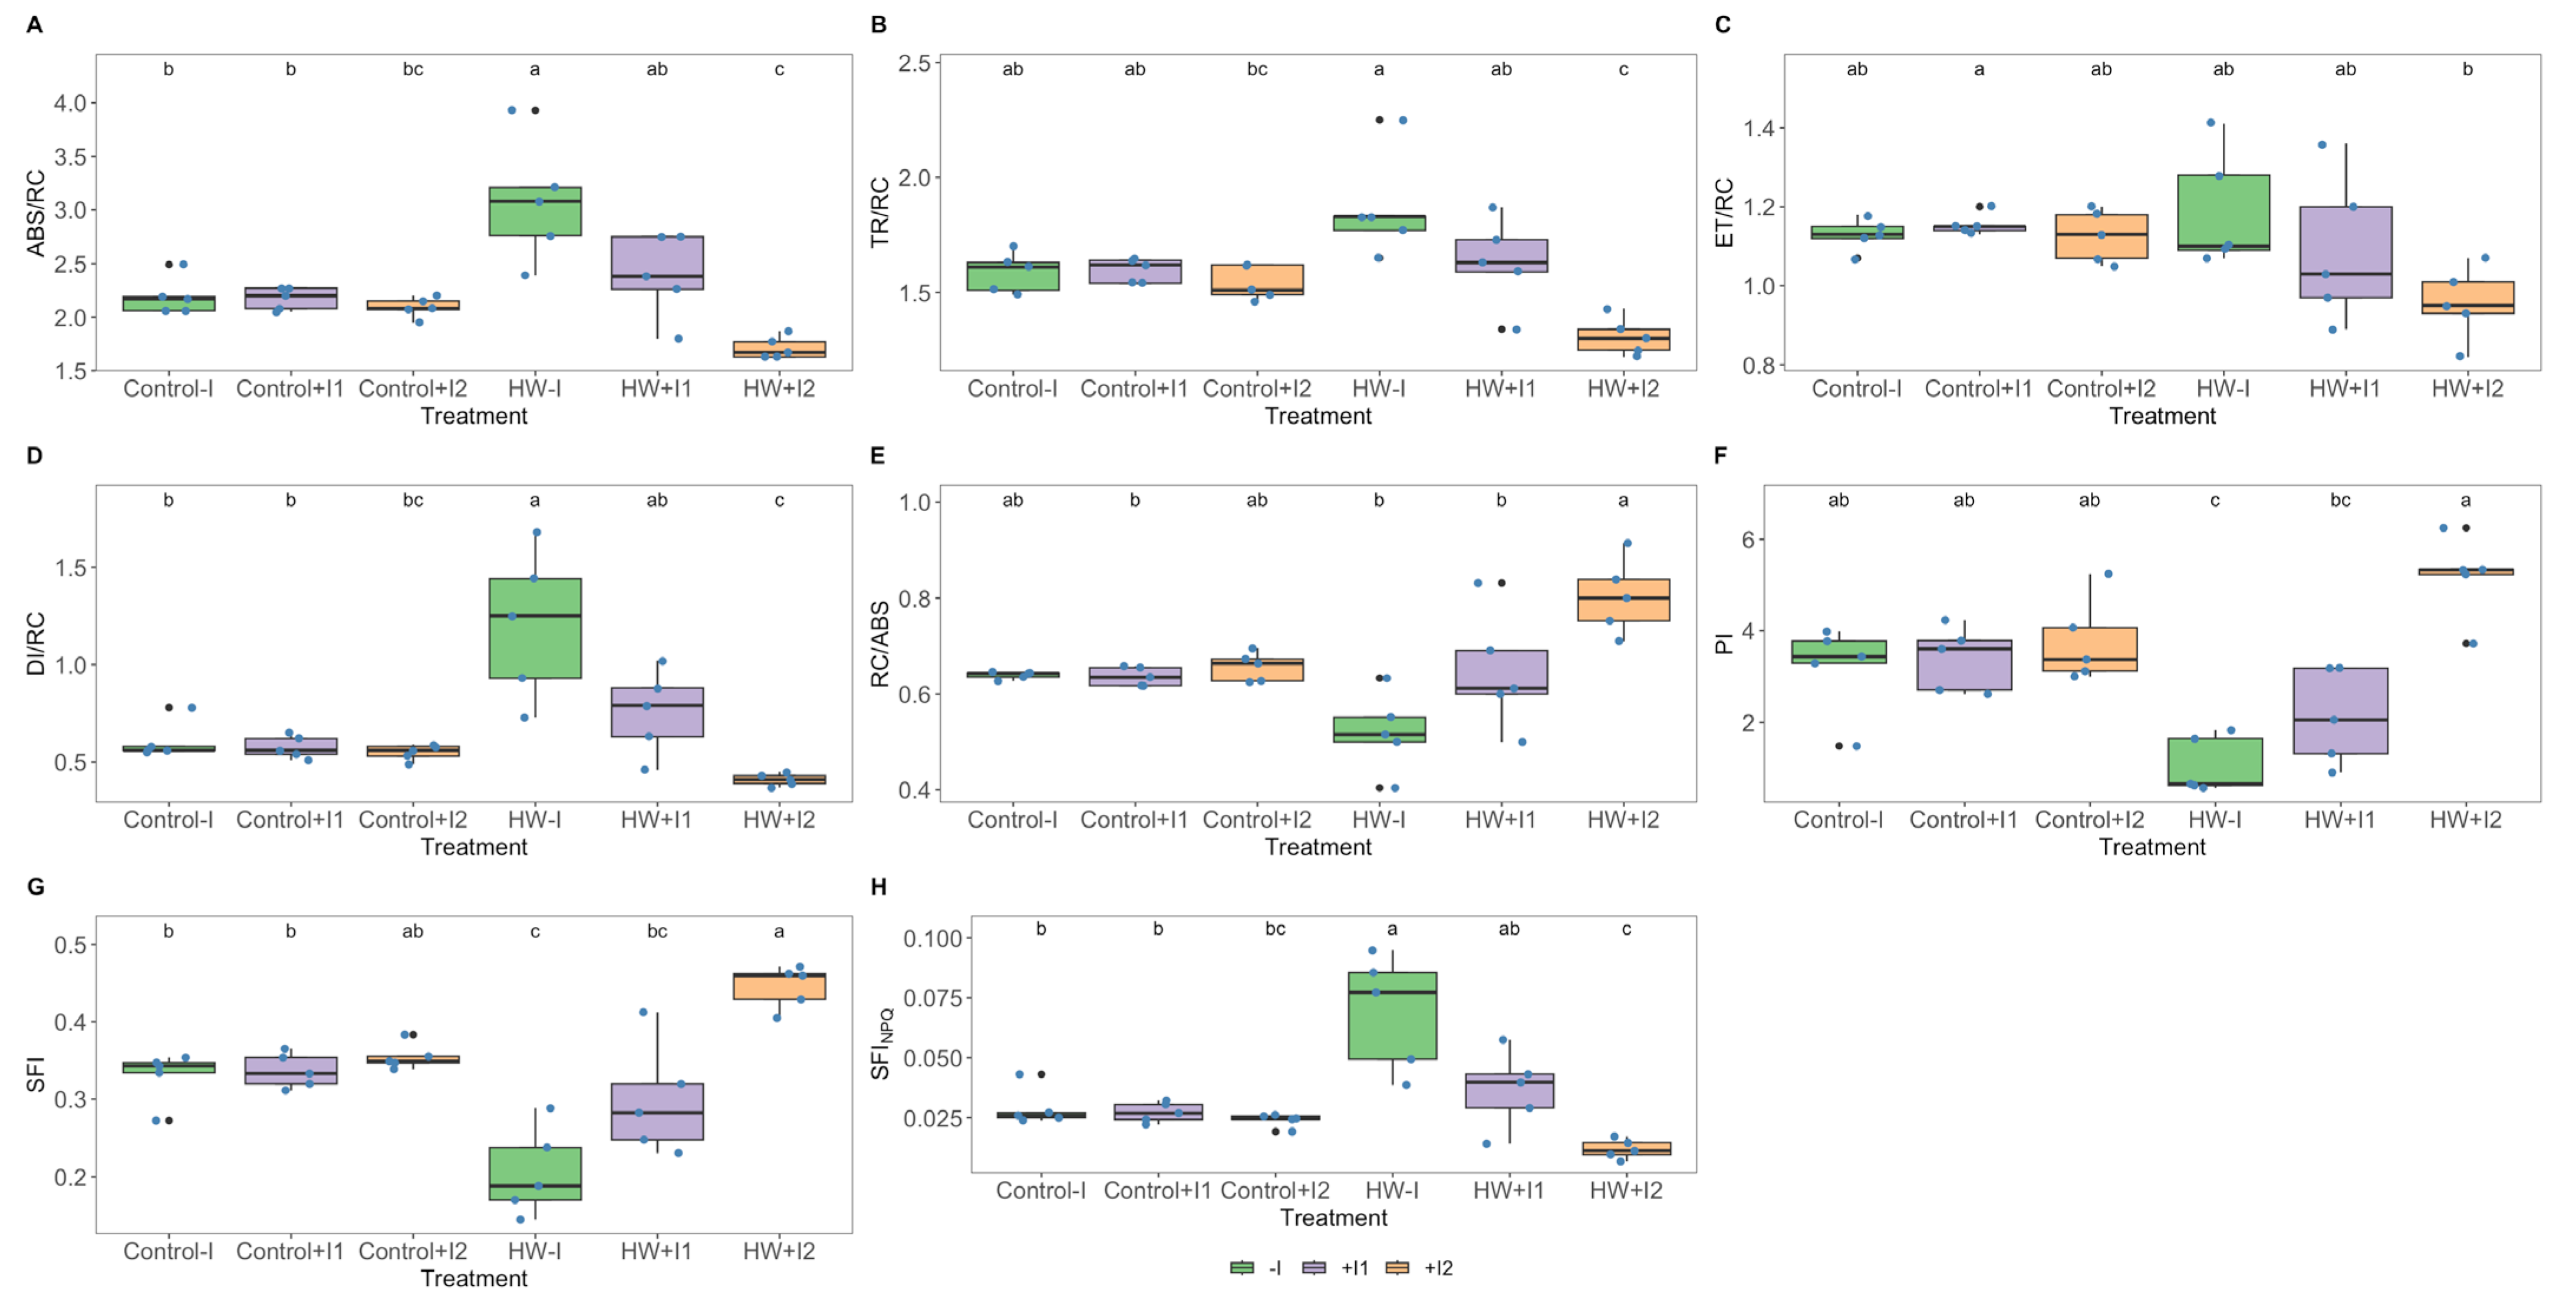
3.2. Photochemical Processes
3.3. Leaf Pigment Profile
3.4. Water and Proline Quantification
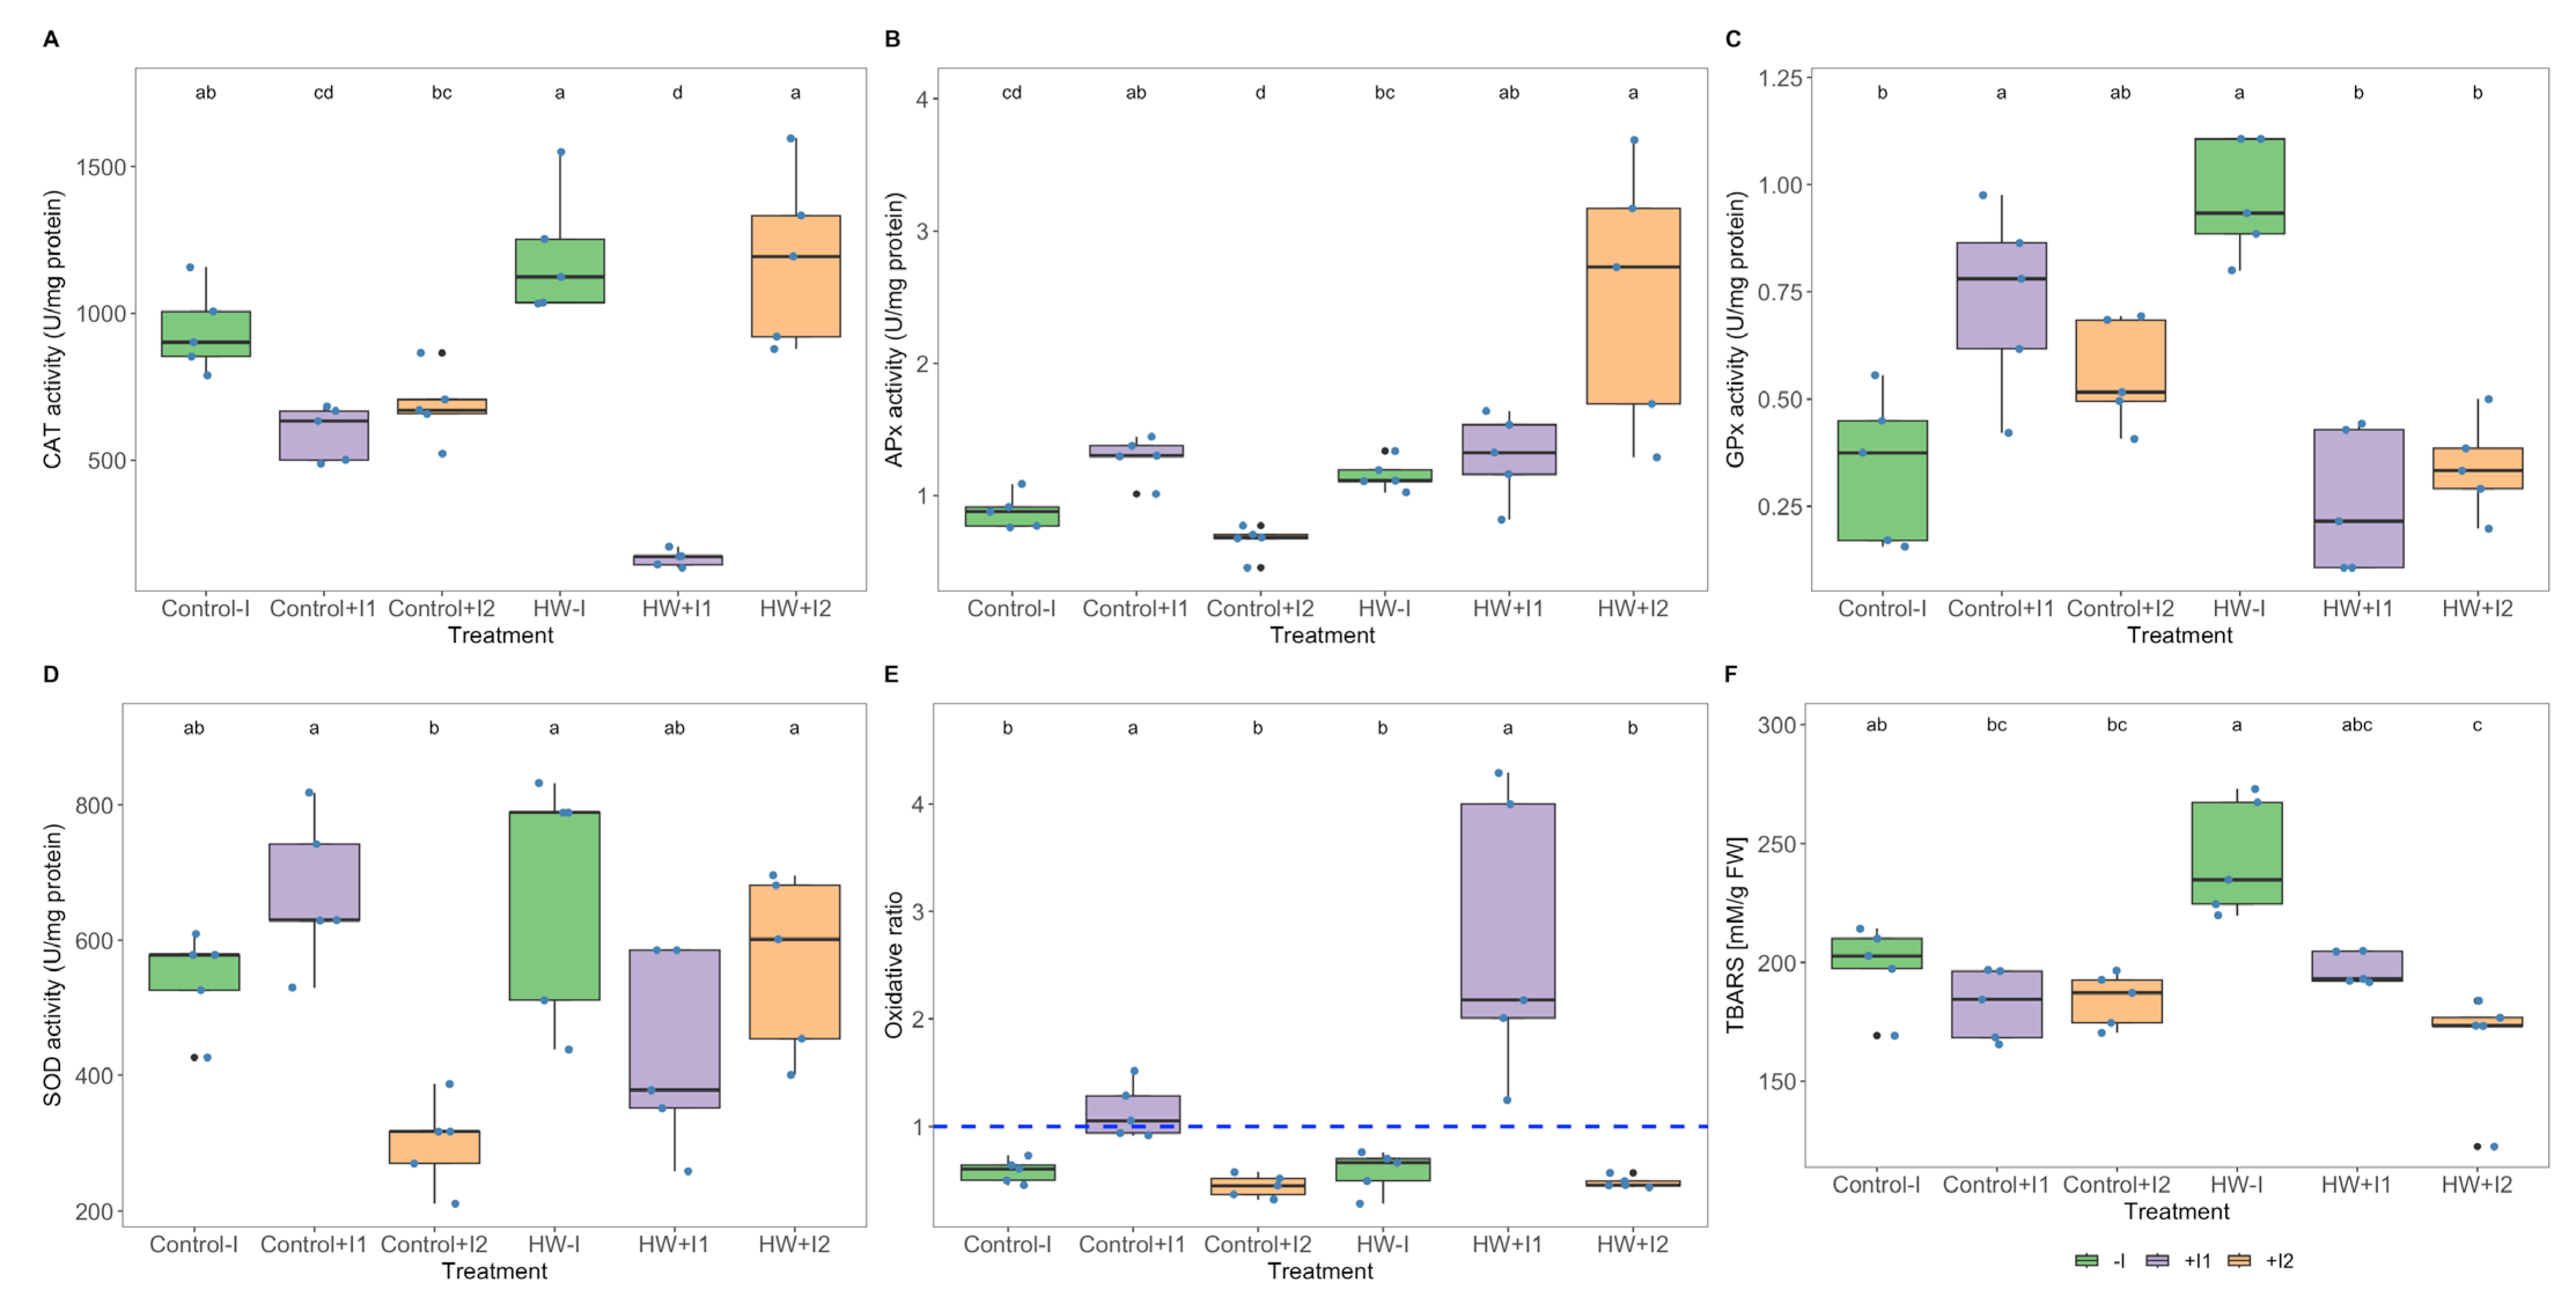
3.5. Antioxidant Enzymatic Activities
3.6. Fatty Acid Profiles
3.7. Multivariate Physiological Profiles
4. Discussion
5. Conclusions
Supplementary Materials
Author Contributions
Funding
Institutional Review Board Statement
Informed Consent Statement
Data Availability Statement
Conflicts of Interest
References
- FAO/OIV. Annual Assessment of the World Vine and Wine Sector in 2021 International Organisation of Vine and Wine Intergovernmental Organisation. Available online: https://www.oiv.int/sites/default/files/documents/OIV_Annual_Assessment_of_the_World_Vine_and_Wine_Sector_in_2021.pdf (accessed on 30 January 2023).
- Jones, G.V.; Edwards, E.J.; Bonada, M.; Sadras, V.O.; Krstic, M.P.; Herderich, M.J. Climate Change and Its Consequences for Viticulture. Manag. Wine Qual. Vol. One Vitic. Wine Qual. 2022, 1, 727–778. [Google Scholar] [CrossRef]
- Coombe, B.G. Influence of temperature on composition and quality of grapes. Acta Hortic. 1987, 206, 23–36. [Google Scholar] [CrossRef] [Green Version]
- Fraga, H.; Molitor, D.; Leolini, L.; Santos, J.A. What Is the Impact of Heatwaves on European Viticulture? A Modelling Assessment. Appl. Sci. 2020, 10, 3030. [Google Scholar] [CrossRef]
- Moutinho-Pereira, J.M.; Correia, C.M.; Gonçalves, B.M.; Bacelar, E.A.; Torres-Pereira, J.M. Leaf Gas Exchange and Water Relations of Grapevines Grown in Three Different Conditions. Photosynthetica 2004, 42, 81–86. [Google Scholar] [CrossRef]
- Greer, D.H.; Weston, C.; Greer, D.H.; Weston, C. Heat Stress Affects Flowering, Berry Growth, Sugar Accumulation and Photosynthesis of Vitis Vinifera Cv. Semillon Grapevines Grown in a Controlled Environment. Funct. Plant Biol. 2010, 37, 206–214. [Google Scholar] [CrossRef]
- World Meteorological Organization. WMO Statement on the Status of the Global Climate in 2003; WMO: Geneva, Switzerland, 2004. [Google Scholar]
- Marchin, R.M.; Backes, D.; Ossola, A.; Leishman, M.R.; Tjoelker, M.G.; Ellsworth, D.S. Extreme Heat Increases Stomatal Conductance and Drought-Induced Mortality Risk in Vulnerable Plant Species. Glob. Chang. Biol. 2022, 28, 1133–1146. [Google Scholar] [CrossRef]
- Masson-Delmotte, V.; Zhai, P.; Chen, Y.; Goldfarb, L.; Gomis, M.I.; Matthews, J.B.R.; Berger, S.; Huang, M.; Yelekçi, O.; Yu, R.; et al. Working Group I Contribution to the Sixth Assessment Report of the Intergovernmental Panel on Climate Change; IPCC: Geneva, Switzerland, 2021. [Google Scholar]
- Reluy, N.P.; Baghdadi, N.; Simonneau, T.; Bazzi, H.; El Hajj, M.M.; Pret, V.; Amin, G.; Daret, E. Can We Detect the Damage of a Heatwave on Vineyards Using Sentinel-2 Optical Remote Sensing Data? OENO ONE 2022, 56, 145–159. [Google Scholar] [CrossRef]
- Duarte, B.; Goessling, J.W.; Marques, J.C.; Caçador, I. Ecophysiological Constraints of Aster Tripolium under Extreme Thermal Events Impacts: Merging Biophysical, Biochemical and Genetic Insights. Plant Physiol. Biochem. 2015, 97, 217–228. [Google Scholar] [CrossRef]
- Duarte, B.; Santos, D.; Marques, J.C.; Caçador, I. Impact of Heat and Cold Events on the Energetic Metabolism of the C3 Halophyte Halimione Portulacoides. Estuar. Coast. Shelf Sci. 2015, 167, 166–177. [Google Scholar] [CrossRef]
- Duarte, B.; Marques, J.C.; Caçador, I. Ecophysiological Response of Native and Invasive Spartina Species to Extreme Temperature Events in Mediterranean Marshes. Biol. Invasions 2016, 18, 2189–2205. [Google Scholar] [CrossRef]
- Carreiras, J.; Alberto Pérez-Romero, J.; Mateos-Naranjo, E.; Redondo-Gómez, S.; Rita Matos, A.; Caçador, I.; Duarte, B. The Effect of Heavy Metal Contamination Pre-Conditioning in the Heat Stress Tolerance of Native and Invasive Mediterranean Halophytes. Ecol. Indic. 2020, 111, 106045. [Google Scholar] [CrossRef]
- Naulleau, A.; Gary, C.; Prévot, L.; Hossard, L. Evaluating Strategies for Adaptation to Climate Change in Grapevine Production–A Systematic Review. Front. Plant Sci. 2021, 11, 607859. [Google Scholar] [CrossRef] [PubMed]
- Sandrini, M.; Nerva, L.; Sillo, F.; Balestrini, R.; Chitarra, W.; Zampieri, E. Abiotic Stress and Belowground Microbiome: The Potential of Omics Approaches. Int. J. Mol. Sci. 2022, 23, 1091. [Google Scholar] [CrossRef] [PubMed]
- Basu, A.; Prasad, P.; Das, S.N.; Kalam, S.; Sayyed, R.Z.; Reddy, M.S.; El Enshasy, H. Plant Growth Promoting Rhizobacteria (PGPR) as Green Bioinoculants: Recent Developments, Constraints, and Prospects. Sustainability 2021, 13, 1140. [Google Scholar] [CrossRef]
- Mierek-Adamska, A.; Nowak, A.; Antoszewski, M.; Zyna, G. The Importance of Microorganisms for Sustainable Agriculture—A Review. Metabolites 2022, 12, 1100. [Google Scholar] [CrossRef]
- Schütz, L.; Gattinger, A.; Meier, M.; Müller, A.; Boller, T.; Mäder, P.; Mathimaran, N. Improving Crop Yield and Nutrient Use Efficiency via Biofertilization—A Global Meta-Analysis. Front. Plant Sci. 2018, 8, 2204. [Google Scholar] [CrossRef] [Green Version]
- Martínez-Viveros, O.; Jorquera, M.A.; Crowley, D.E.; Gajardo, G.; Mora, M.L. Mechanisms and practical considerations involved in plant growth promotion by rhizobacteria. J. Soil Sci. Plant Nutr. 2010, 10, 293–319. [Google Scholar] [CrossRef] [Green Version]
- Gupta, A.; Mishra, R.; Rai, S.; Bano, A.; Pathak, N.; Fujita, M.; Kumar, M.; Hasanuzzaman, M. Mechanistic Insights of Plant Growth Promoting Bacteria Mediated Drought and Salt Stress Tolerance in Plants for Sustainable Agriculture. Int. J. Mol. Sci. 2022, 23, 3741. [Google Scholar] [CrossRef]
- Notununu, I.; Moleleki, L.; Roopnarain, A.; Adeleke, R. Effects of Plant Growth-Promoting Rhizobacteria on the Molecular Responses of Maize under Drought and Heat Stresses: A Review. Pedosphere 2022, 32, 90–106. [Google Scholar] [CrossRef]
- Ferreira, M.J.; Cunha, A.; Figueiredo, S.; Faustino, P.; Patinha, C.; Silva, H.; Sierra-Garcia, I.N. The Root Microbiome of Salicornia Ramosissima as a Seedbank for Plant-Growth Promoting Halotolerant Bacteria. Appl. Sci. 2021, 11, 2233. [Google Scholar] [CrossRef]
- Pajuelo, E.; Arjona, S.; Rodríguez-Llorente, I.D.; Mateos-Naranjo, E.; Redondo-Gómez, S.; Merchán, F.; Navarro-Torre, S. Coastal Ecosystems as Sources of Biofertilizers in Agriculture: From Genomics to Application in an Urban Orchard. Front. Mar. Sci. 2021, 8, 1162. [Google Scholar] [CrossRef]
- Valle-Romero, P.; García-López, J.V.; Redondo-Gómez, S.; Flores-Duarte, N.J.; Rodríguez-Llorente, I.D.; Idaszkin, Y.L.; Pajuelo, E.; Mateos-Naranjo, E. Biofertilization with PGP Bacteria Improve Strawberry Plant Performance under Sub-Optimum Phosphorus Fertilization. Agronomy 2023, 13, 335. [Google Scholar] [CrossRef]
- Carreiras, J.; Caçador, I.; Duarte, B. Bioaugmentation Improves Phytoprotection in Halimione Portulacoides Exposed to Mild Salt Stress: Perspectives for Salinity Tolerance Improvement. Plants 2022, 11, 1055. [Google Scholar] [CrossRef] [PubMed]
- Redondo-Gómez, S.; Romano-Rodríguez, E.; Mesa-Marín, J.; Sola-Elías, C.; Mateos-Naranjo, E. Consortia of Plant-Growth-Promoting Rhizobacteria Isolated from Halophytes Improve the Response of Swiss Chard to Soil Salinization. Agronomy 2022, 12, 468. [Google Scholar] [CrossRef]
- Redondo-Gómez, S.; García-López, J.V.; Mesa-Marín, J.; Pajuelo, E.; Rodriguez-Llorente, I.D.; Mateos-Naranjo, E. Synergistic Effect of Plant-Growth-Promoting Rhizobacteria Improves Strawberry Growth and Flowering with Soil Salinization and Increased Atmospheric CO2 Levels and Temperature Conditions. Agronomy 2022, 12, 2082. [Google Scholar] [CrossRef]
- Pérez-Romero, J.A.; Barcia-Piedras, J.M.; Redondo-Gómez, S.; Mateos-Naranjo, E. Impact of Short-Term Extreme Temperature Events on Physiological Performance of Salicornia Ramosissima J. Woods under Optimal and Sub-Optimal Saline Conditions. Sci. Rep. 2019, 9, 659. [Google Scholar] [CrossRef] [Green Version]
- Mesa-Marín, J.; Mateos-Naranjo, E.; Rodríguez-Llorente, I.D.; Pajuelo, E.; Redondo-Gómez, S. Synergic Effects of Rhizobacteria: Increasing Use of Halophytes in a Changing World. Halophytes Clim. Chang. Adapt. Mech. Potential Uses 2019, 1, 240–254. [Google Scholar] [CrossRef]
- Santos, M.; Fonseca, A.; Fraga, H.; Jones, G.V.; Santos, J.A. Bioclimatic Conditions of the Portuguese Wine Denominations of Origin under Changing Climates. Int. J. Climatol. 2020, 40, 927–941. [Google Scholar] [CrossRef]
- Catarino, S.; Madeira, M.; Manuel, F.; Monteiro, G.; Caldeira, I.; Monteiro, F.; Rosa, T.; Martins, P.; Bruno De Sousa, R.; Curvelo-Garcia, A. Multi-Elemental Analysis throughout Soil-Wine System as a Generator of Information on Geographic Origin Portuguese-Swedish Research Project on the Ecology of Blue Gum (Eucalyptus Globulus) View Project Analytical Innovations in Wine Production-Foods Special Issue View Project Multi-Elemental Analysis throughout Soil-Wine System as a Generator of Information on Geographic Origin. In Proceedings of the 37th World Congress of Vine and Wine, Mendoza, Argentina, 9–14 November 2014. [Google Scholar] [CrossRef]
- Figueiredo, A.; Monteiro, F.; Fortes, A.M.; Bonow-Rex, M.; Zyprian, E.; Sousa, L.; Pais, M.S. Cultivar-Specific Kinetics of Gene Induction during Downy Mildew Early Infection in Grapevine. Funct. Integr. Genom. 2012, 12, 379–386. [Google Scholar] [CrossRef]
- Andrades-Moreno, L.; del Castillo, I.; Parra, R.; Doukkali, B.; Redondo-Gómez, S.; Pérez-Palacios, P.; Caviedes, M.A.; Pajuelo, E.; Rodríguez-Llorente, I.D. Prospecting Metal-Resistant Plant-Growth Promoting Rhizobacteria for Rhizoremediation of Metal Contaminated Estuaries Using Spartina Densiflora. Environ. Sci. Pollut. Res. Int. 2014, 21, 3713–3721. [Google Scholar] [CrossRef]
- Mesa-Marín, J.; Pérez-Romero, J.A.; Mateos-Naranjo, E.; Bernabeu-Meana, M.; Pajuelo, E.; Rodríguez-Llorente, I.D.; Redondo-Gómez, S. Effect of Plant Growth-Promoting Rhizobacteria on Salicornia Ramosissima Seed Germination under Salinity, CO2 and Temperature Stress. Agronomy 2019, 9, 655. [Google Scholar] [CrossRef] [Green Version]
- Mesa, J.; Mateos-Naranjo, E.; Caviedes, M.A.; Redondo-Gómez, S.; Pajuelo, E.; Rodríguez-Llorente, I.D. Scouting Contaminated Estuaries: Heavy Metal Resistant and Plant Growth Promoting Rhizobacteria in the Native Metal Rhizoaccumulator Spartina Maritima. Mar. Pollut. Bull. 2015, 90, 150–159. [Google Scholar] [CrossRef]
- Parente, J.; Pereira, M.G.; Amraoui, M.; Fischer, E.M. Heat Waves in Portugal: Current Regime, Changes in Future Climate and Impacts on Extreme Wildfires. Sci. Total Environ. 2018, 631–632, 534–549. [Google Scholar] [CrossRef]
- Beniston, M.; Diaz, H.F. The 2003 Heat Wave as an Example of Summers in a Greenhouse Climate? Observations and Climate Model Simulations for Basel, Switzerland. Glob. Planet. Chang. 2004, 44, 73–81. [Google Scholar] [CrossRef] [Green Version]
- Zhu, X.G.; Baker, N.R.; DeSturler, E.; Ort, D.R.; Long, S.P. Chlorophyll a Fluorescence Induction Kinetics in Leaves Predicted from a Model Describing Each Discrete Step of Excitation Energy and Electron Transfer Associated with Photosystem II. Planta 2005, 223, 114–133. [Google Scholar] [CrossRef]
- Küpper, H.; Seibert, S.; Parameswaran, A. Fast, Sensitive, and Inexpensive Alternative to Analytical Pigment HPLC: Quantification of Chlorophylls and Carotenoids in Crude Extracts by Fitting with Gauss Peak Spectra. Anal. Chem. 2007, 79, 7611–7627. [Google Scholar] [CrossRef]
- Bates, L.S.; Waldren, R.P.; Teare, I.D. Rapid Determination of Free Proline for Water-Stress Studies. Plant Soil 1973, 39, 205–207. [Google Scholar] [CrossRef]
- Tiryakioglu, M.; Eker, S.; Ozkutlu, F.; Husted, S.; Cakmak, I. Antioxidant Defense System and Cadmium Uptake in Barley Genotypes Differing in Cadmium Tolerance. J. Trace Elem. Med. Biol. 2006, 20, 181–189. [Google Scholar] [CrossRef] [PubMed]
- Teranishi, Y.; Tanaka, A.; Osumi, M.; Fukui, S. Catalase Activities of Hydrocarbon-Utilizing Candida Yeasts. Agric. Biol. Chem. 1974, 38, 1213–1220. [Google Scholar] [CrossRef]
- Bergmeyer, H.U.; Gawehn, K.; Grassl, M. Lactatedehydrogenase, UV-Assay with Pyruvate and NADH. Methods Enzym. Anal. 1974, 2, 574–579. [Google Scholar]
- Marklund, S.; Marklund, G. Involvement of the Superoxide Anion Radical in the Autoxidation of Pyrogallol and a Convenient Assay for Superoxide Dismutase. Eur. J. Biochem. 1974, 47, 469–474. [Google Scholar] [CrossRef]
- Bradford, M.M. A Rapid and Sensitive Method for the Quantitation of Microgram Quantities of Protein Utilizing the Principle of Protein-Dye Binding. Anal. Biochem. 1976, 72, 248–254. [Google Scholar] [CrossRef] [PubMed]
- Heath, R.L.; Packer, L. Photoperoxidation in Isolated Chloroplasts. I. Kinetics and Stoichiometry of Fatty Acid Peroxidation. Arch. Biochem. Biophys. 1968, 125, 189–198. [Google Scholar] [CrossRef]
- Duarte, B.; Caçador, I.; Matos, A.R. Lipid Landscape Remodelling in Sarcocornia Fruticosa Green and Red Physiotypes. Plant Physiol. Biochem. 2020, 157, 128–137. [Google Scholar] [CrossRef] [PubMed]
- Mendiburu, F.; Simon, R.; De Mendiburu, F. Agricolae-Ten Years of an Open Source Statistical Tool for Experiments in Breeding, Agriculture and Biology. PeerJ PrePrints 2015. [Google Scholar] [CrossRef]
- Clarke, K.; Gorley, R.N. Primer v6: User Manual/Tutorial; PRIMER-E Ltd.: Plymouth, UK, 2006. [Google Scholar]
- Duarte, B.; Santos, D.; Marques, J.C.; Caçador, I. Biophysical Probing of Spartina Maritima Photo-System II Changes during Prolonged Tidal Submersion Periods. Plant Physiol. Biochem. 2014, 77, 122–132. [Google Scholar] [CrossRef] [Green Version]
- Bussotti, F.; Gerosa, G.; Digrado, A.; Pollastrini, M. Selection of Chlorophyll Fluorescence Parameters as Indicators of Photosynthetic Efficiency in Large Scale Plant Ecological Studies. Ecol. Indic. 2020, 108, 105686. [Google Scholar] [CrossRef]
- Wen, X.; Qiu, N.; Lu, Q.; Lu, C. Enhanced Thermotolerance of Photosystem II in Salt-Adapted Plants of the Halophyte Artemisia Anethifolia. Planta 2005, 220, 486–497. [Google Scholar] [CrossRef]
- Krüger, G.H.J.; De Villiers, M.F.; Strauss, A.J.; de Beer, M.; van Heerden, P.D.R.; Maldonado, R.; Strasser, R.J. Inhibition of Photosystem II Activities in Soybean (Glycine Max) Genotypes Differing in Chilling Sensitivity. S. Afr. J. Bot. 2014, 95, 85–96. [Google Scholar] [CrossRef] [Green Version]
- Duarte, B.; Matos, A.R.; Caçador, I. Photobiological and Lipidic Responses Reveal the Drought Tolerance of Aster Tripolium Cultivated under Severe and Moderate Drought: Perspectives for Arid Agriculture in the Mediterranean. Plant Physiol. Biochem. 2020, 154, 304–315. [Google Scholar] [CrossRef]
- Montgomery, B.L. The Regulation of Light Sensing and Light-Harvesting Impacts the Use of Cyanobacteria as Biotechnology Platforms. Front. Bioeng. Biotechnol. 2014, 2, 22. [Google Scholar] [CrossRef] [Green Version]
- Duarte, B.; Cabrita, M.T.; Gameiro, C.; Matos, A.R.; Godinho, R.; Marques, J.C.; Caçador, I. Disentangling the Photochemical Salinity Tolerance in Aster Tripolium, L.: Connecting Biophysical Traits with Changes in Fatty Acid Composition. Plant Biol. 2017, 19, 239–248. [Google Scholar] [CrossRef]
- Cruz de Carvalho, R.; Feijão, E.; Duarte, I.; Pinto, V.; Silva, M.; Matos, A.R.; da Silva, A.B.; Caçador, I.; Reis-Santos, P.; Fonseca, V.F.; et al. Ecoengineering Solutions for the Impairment of Spreading and Growth of Invasive Spartina Patens in Mediterranean Salt Marshes. Front. Mar. Sci. 2021, 8, 1220. [Google Scholar] [CrossRef]
- Duarte, B.; Feijão, E.; de Carvalho, R.C.; Duarte, I.A.; Silva, M.; Matos, A.R.; Cabrita, M.T.; Novais, S.C.; Lemos, M.F.L.; Marques, J.C.; et al. Effects of Propranolol on Growth, Lipids and Energy Metabolism and Oxidative Stress Response of Phaeodactylum Tricornutum. Biology 2020, 9, 478. [Google Scholar] [CrossRef] [PubMed]
- Murata, N.; Takahashi, S.; Nishiyama, Y.; Allakhverdiev, S.I. Photoinhibition of Photosystem II under Environmental Stress. Biochim. Biophys. Acta-Bioenerg. 2007, 1767, 414–421. [Google Scholar] [CrossRef] [PubMed] [Green Version]
- Kulundžić, A.M.; Vuletić, M.V.; Kočar, M.M.; Mijić, A.; Varga, I.; Sudarić, A.; Cesar, V.; Lepeduš, H. The Combination of Increased Temperatures and High Irradiation Causes Changes in Photosynthetic Efficiency. Plants 2021, 10, 2076. [Google Scholar] [CrossRef]
- Vuletić, M.V.; Mihaljević, I.; Tomaš, V.; Horvat, D.; Zdunić, Z.; Vuković, D. Physiological Response to Short-Term Heat Stress in the Leaves of Traditional and Modern Plum (Prunus domestica L.) Cultivars. Horticulturae 2022, 8, 72. [Google Scholar] [CrossRef]
- Strasser, B.J. Donor Side Capacity of Photosystem II Probed by Chlorophyll a Fluorescence Transients. Photosynth. Res. 1997, 52, 147–155. [Google Scholar] [CrossRef]
- Diner, B.A.; Wollman, F.-A. Biosynthesis of Photosystem II Reaction Centers, Antenna and Plastoquinone Pool in Greening Cells of Cyanidium Caldarium Mutant III-C. Plant Physiol. 1979, 63, 26. [Google Scholar] [CrossRef] [Green Version]
- Clarke, S.J.; Lamont, K.J.; Pan, H.Y.; Barry, L.A.; Hall, A.; Rogiers, S.Y. Spring Root-Zone Temperature Regulates Root Growth, Nutrient Uptake and Shoot Growth Dynamics in Grapevines. Aust. J. Grape Wine Res. 2015, 21, 479–489. [Google Scholar] [CrossRef]
- Verdenal, T.; Dienes-Nagy, Á.; Spangenberg, J.E.; Zufferey, V.; Spring, J.L.; Viret, O.; Marin-Carbonne, J.; van Leeuwen, C. Understanding and Managing Nitrogen Nutrition in Grapevine: A Review. OENO ONE 2021, 55, 1–43. [Google Scholar] [CrossRef]
- Chapman, A.R.O.; Craigie, J.S. Seasonal Growth in Laminaria Longicruris: Relations with Dissolved Inorganic Nutrients and Internal Reserves of Nitrogen. Mar. Biol. 1977, 40, 197–205. [Google Scholar] [CrossRef]
- Imai, K.; Suzuki, Y.; Mae, T.; Makino, A. Changes in the Synthesis of Rubisco in Rice Leaves in Relation to Senescence and N Influx. Ann. Bot. 2008, 101, 135. [Google Scholar] [CrossRef]
- Allakhverdiev, S.I.; Kreslavski, V.D.; Klimov, V.V.; Los, D.A.; Carpentier, R.; Mohanty, P. Heat Stress: An Overview of Molecular Responses in Photosynthesis. Photosynth. Res. 2008, 98, 541–550. [Google Scholar] [CrossRef]
- Sharkey, T.D. Effects of Moderate Heat Stress on Photosynthesis: Importance of Thylakoid Reactions, Rubisco Deactivation, Reactive Oxygen Species, and Thermotolerance Provided by Isoprene. Plant Cell Environ. 2005, 28, 269–277. [Google Scholar] [CrossRef]
- Sakuraba, Y. Molecular Basis of Nitrogen Starvation-Induced Leaf Senescence. Front. Plant Sci. 2022, 13, 3729. [Google Scholar] [CrossRef]
- Keren, N.; Berg, A.; Van Kan, P.J.M.; Levanon, H.; Ohad, I. Mechanism of Photosystem II Photoinactivation and D1 Protein Degradation at Low Light: The Role of Back Electron Flow. Proc. Natl. Acad. Sci. USA 1997, 94, 1579–1584. [Google Scholar] [CrossRef] [Green Version]
- Jahns, P.; Holzwarth, A.R. The Role of the Xanthophyll Cycle and of Lutein in Photoprotection of Photosystem II. Biochim. Biophys. Acta 2012, 1817, 182–193. [Google Scholar] [CrossRef] [Green Version]
- Demmig-Adams, B. Carotenoids and Photoprotection in Plants: A Role for the Xanthophyll Zeaxanthin. Biochim. Biophys. Acta-Bioenerg. 1990, 1020, 1–24. [Google Scholar] [CrossRef]
- Demmig-Adams, B.; Adams, W.W. Photoprotection and Other Responses of Plants to High Light Stress. Annu. Rev. Plant Physiol. Plant Mol. Biol. 1992, 43, 599–626. [Google Scholar] [CrossRef]
- Duarte, B.; Santos, D.; Marques, J.C.; Caçador, I. Ecophysiological Adaptations of Two Halophytes to Salt Stress: Photosynthesis, PS II Photochemistry and Anti-Oxidant Feedback—Implications for Resilience in Climate Change. Plant Physiol. Biochem. 2013, 67, 178–188. [Google Scholar] [CrossRef]
- Tiwari, M.; Kumar, R.; Min, D.; Jagadish, S.V.K. Genetic and Molecular Mechanisms Underlying Root Architecture and Function under Heat Stress—A Hidden Story. Plant Cell Environ. 2022, 45, 771–788. [Google Scholar] [CrossRef] [PubMed]
- Rojas-Tapias, D.; Moreno-Galván, A.; Pardo-Díaz, S.; Obando, M.; Rivera, D.; Bonilla, R. Effect of Inoculation with Plant Growth-Promoting Bacteria (PGPB) on Amelioration of Saline Stress in Maize (Zea Mays). Appl. Soil Ecol. 2012, 61, 264–272. [Google Scholar] [CrossRef]
- Venios, X.; Korkas, E.; Nisiotou, A.; Banilas, G. Grapevine Responses to Heat Stress and Global Warming. Plants 2020, 9, 1754. [Google Scholar] [CrossRef] [PubMed]
- Rienth, M.; Torregrosa, L.; Luchaire, N.; Chatbanyong, R.; Lecourieux, D.; Kelly, M.T.; Romieu, C. Day and Night Heat Stress Trigger Different Transcriptomic Responses in Green and Ripening Grapevine (Vitis Vinifera) Fruit. BMC Plant Biol. 2014, 14, 108. [Google Scholar] [CrossRef] [Green Version]
- Ojuederie, O.B.; Olanrewaju, O.S.; Babalola, O.O. Plant Growth Promoting Rhizobacterial Mitigation of Drought Stress in Crop Plants: Implications for Sustainable Agriculture. Agronomy 2019, 9, 712. [Google Scholar] [CrossRef] [Green Version]
- Hayat, S.; Hayat, Q.; Alyemeni, M.N.; Wani, A.S.; Pichtel, J.; Ahmad, A. Role of Proline under Changing Environments: A Review. Plant Signal. Behav. 2012, 7, 1456. [Google Scholar] [CrossRef] [Green Version]
- Verbruggen, N.; Hermans, C. Proline Accumulation in Plants: A Review. Amino Acids 2008, 35, 753–759. [Google Scholar] [CrossRef]
- Lugtenberg, B.J.J.; Malfanova, N.; Kamilova, F.; Berg, G. Plant Growth Promotion by Microbes. Mol. Microb. Ecol. Rhizosphere 2013, 2, 559–573. [Google Scholar] [CrossRef]
- Shaffique, S.; Khan, M.A.; Wani, S.H.; Pande, A.; Imran, M.; Kang, S.M.; Rahim, W.; Khan, S.A.; Bhatta, D.; Kwon, E.H.; et al. A Review on the Role of Endophytes and Plant Growth Promoting Rhizobacteria in Mitigating Heat Stress in Plants. Microorganisms 2022, 10, 1286. [Google Scholar] [CrossRef]
- Rajput, V.D.; Harish; Singh, R.K.; Verma, K.K.; Sharma, L.; Quiroz-Figueroa, F.R.; Meena, M.; Gour, V.S.; Minkina, T.; Sushkova, S.; et al. Recent Developments in Enzymatic Antioxidant Defence Mechanism in Plants with Special Reference to Abiotic Stress. Biology 2021, 10, 267. [Google Scholar] [CrossRef] [PubMed]
- Alves Da Costa, P.H.; De Azevedo Neto, A.D.; Bezerra, M.A.; Prisco, J.T.; Gomes-Filho, E. Antioxidant-Enzymatic System of Two Sorghum Genotypes Differing in Salt Tolerance. Brazilian J. Plant Physiol. 2005, 17, 353–362. [Google Scholar] [CrossRef]
- Duarte, B.; Feijão, E.; Cruz de Carvalho, R.; Matos, A.R.; Cabrita, M.T.; Novais, S.C.; Moutinho, A.; Lemos, M.F.L.; Marques, J.C.; Caçador, I.; et al. Effect Biomarkers of the Widespread Antimicrobial Triclosan in a Marine Model Diatom. Antioxidants 2022, 11, 1442. [Google Scholar] [CrossRef] [PubMed]
- Feijão, E.; Cruz de Carvalho, R.; Duarte, I.A.; Matos, A.R.; Cabrita, M.T.; Novais, S.C.; Lemos, M.F.L.; Caçador, I.; Marques, J.C.; Reis-Santos, P.; et al. Fluoxetine Arrests Growth of the Model Diatom Phaeodactylum Tricornutum by Increasing Oxidative Stress and Altering Energetic and Lipid Metabolism. Front. Microbiol. 2020, 11, 1803. [Google Scholar] [CrossRef] [PubMed]
- Mitra, D.; Díaz Rodríguez, A.M.; Parra Cota, F.I.; Khoshru, B.; Panneerselvam, P.; Moradi, S.; Sagarika, M.S.; Anđelković, S.; de los Santos-Villalobos, S.; Das Mohapatra, P.K. Amelioration of Thermal Stress in Crops by Plant Growth-Promoting Rhizobacteria. Physiol. Mol. Plant Pathol. 2021, 115, 101679. [Google Scholar] [CrossRef]
- Ilangumaran, G.; Smith, D.L. Plant Growth Promoting Rhizobacteria in Amelioration of Salinity Stress: A Systems Biology Perspective. Front. Plant Sci. 2017, 8, 1768. [Google Scholar] [CrossRef] [Green Version]
- Goellner, K.; Conrath, U. Priming: It’s All the World to Induced Disease Resistance. Eur. J. Plant Pathol. 2008, 121, 233–242. [Google Scholar] [CrossRef]
- Akhtar, M.S.; Siddiqui, Z.A. Role of Plant Growth Promoting Rhizobacteria in Biocontrol of Plant Diseases and Sustainable Agriculture. Plant Growth Health Promot. Bact. 2010, 18, 157–195. [Google Scholar] [CrossRef]
- Bejarano, A.; Sauer, U.; Preininger, C. Design and Development of a Workflow for Microbial Spray Formulations Including Decision Criteria. Appl. Microbiol. Biotechnol. 2017, 101, 7335–7346. [Google Scholar] [CrossRef]
- Vuolo, F.; Novello, G.; Bona, E.; Gorrasi, S.; Gamalero, E. Impact of Plant-Beneficial Bacterial Inocula on the Resident Bacteriome: Current Knowledge and Future Perspectives. Microorganisms 2022, 10, 2462. [Google Scholar] [CrossRef]
- Afanador-Barajas, L.N.; Navarro-Noya, Y.E.; Luna-Guido, M.L.; Dendooven, L. Impact of a Bacterial Consortium on the Soil Bacterial Community Structure and Maize (Zea mays L.) Cultivation. Sci. Rep. 2021, 11, 13092. [Google Scholar] [CrossRef]
- Nuzzo, A.; Satpute, A.; Albrecht, U.; Strauss, S.L. Impact of Soil Microbial Amendments on Tomato Rhizosphere Microbiome and Plant Growth in Field Soil. Microb. Ecol. 2020, 80, 398–409. [Google Scholar] [CrossRef]
- Sharma, R.; Paliwal, J.S.; Chopra, P.; Dogra, D.; Pooniya, V.; Bisaria, V.S.; Swarnalakshmi, K.; Sharma, S. Survival, Efficacy and Rhizospheric Effects of Bacterial Inoculants on Cajanus Cajan. Agric. Ecosyst. Environ. 2017, 240, 244–252. [Google Scholar] [CrossRef]


| Chl a | Chl b | TChl | Pheo a | Tcarot | βcarot | Anthe | Lutein | Viola | Zea | DES | Chl a/b | Tcar/TChl | CDI | ||
|---|---|---|---|---|---|---|---|---|---|---|---|---|---|---|---|
| C | −I | 851.8 ± 159.4 bc | 367.1 ± 130.1 ab | 1219.0 ± 286.1 bc | 147.1 ± 105.1 a | 359.6 ± 62.9 ab | 51.1 ± 9.4 ab | 42.3 ± 7.53 a | 62.6 ± 9.1 ab | 61.0 ± 14.8 a | 114.0 ± 38.3 ab | 0.482 ± 0.065 a | 2.420 ± 0.364 ab | 0.298 ± 0.018 a | 0.163 ± 0.082 a |
| +I1 | 702.4 ± 131.0 c | 261.0 ± 47.0 b | 963.4 ± 172.1 c | 104.9 ± 56.7 a | 255.7 ± 35.4 b | 38.5 ± 9.4 b | 28.7 ± 9.93 a | 52.4 ± 10.8 b | 32.8 ± 12.3 a | 56.6 ± 9.9 b | 0.519 ± 0.071 a | 2.700 ± 0.267 a | 0.268 ± 0.024 a | 0.129 ± 0.058 a | |
| +I2 | 923.2 ± 140.5 abc | 340.1 ± 80.2 ab | 1263.3 ± 220.5 abc | 70.6 ± 37.5 a | 363.9 ± 75.3 ab | 46.7 ± 7.0 ab | 44.3 ± 6.43 a | 66.7 ± 13.2 ab | 58.0 ± 32.8 a | 119.2 ± 28.5 ab | 0.452 ± 0.068 a | 2.756 ± 0.228 a | 0.287 ± 0.012 ab | 0.070 ± 0.028 a | |
| HW | −I | 1083.3 ± 287.6 ab | 492.0 ± 127.7 a | 1575.3 ± 413.3 ab | 151.8 ± 72.6 a | 445.4 ± 112.0 a | 55.5 ± 11.6 ab | 45.9 ± 9.33 a | 77.9 ± 26.3 ab | 56.6 ± 30.5 a | 165.1 ± 25.4 a | 0.374 ± 0.062 a | 2.203 ± 0.136 b | 0.284 ± 0.024 ab | 0.119 ± 0.048 a |
| +I1 | 1024.9 ± 65.2 ab | 505.7 ± 46.3 a | 1530.5 ± 89.5 ab | 152.1 ± 32.2 a | 396.1 ± 33.3 a | 44.4 ± 9.2 ab | 40.9 ± 6.03 a | 77.3 ± 11.7 ab | 71.2 ± 25.4 a | 137.7 ± 26.6 a | 0.447 ± 0.080 a | 2.039 ± 0.215 b | 0.259 ± 0.012 ab | 0.129 ± 0.026 a | |
| +I2 | 1325.7 ± 273.5 a | 554.5 ± 144.2 a | 1880.2 ± 417.2 a | 132.8 ± 25.1 a | 461.4 ± 95.5 a | 56.7 ± 11.3 a | 48.3 ± 9.33 a | 90.4 ± 22.73 a | 76.7 ± 27.0 a | 165.9 ± 42.2 a | 0.427 ± 0.046 a | 2.417 ± 0.131 ab | 0.246 ± 0.010 c | 0.093 ± 0.017 a |
Disclaimer/Publisher’s Note: The statements, opinions and data contained in all publications are solely those of the individual author(s) and contributor(s) and not of MDPI and/or the editor(s). MDPI and/or the editor(s) disclaim responsibility for any injury to people or property resulting from any ideas, methods, instructions or products referred to in the content. |
© 2023 by the authors. Licensee MDPI, Basel, Switzerland. This article is an open access article distributed under the terms and conditions of the Creative Commons Attribution (CC BY) license (https://creativecommons.org/licenses/by/4.0/).
Share and Cite
Carreiras, J.; Cruz-Silva, A.; Fonseca, B.; Carvalho, R.C.; Cunha, J.P.; Proença Pereira, J.; Paiva-Silva, C.; A. Santos, S.; Janeiro Sequeira, R.; Mateos-Naranjo, E.; et al. Improving Grapevine Heat Stress Resilience with Marine Plant Growth-Promoting Rhizobacteria Consortia. Microorganisms 2023, 11, 856. https://doi.org/10.3390/microorganisms11040856
Carreiras J, Cruz-Silva A, Fonseca B, Carvalho RC, Cunha JP, Proença Pereira J, Paiva-Silva C, A. Santos S, Janeiro Sequeira R, Mateos-Naranjo E, et al. Improving Grapevine Heat Stress Resilience with Marine Plant Growth-Promoting Rhizobacteria Consortia. Microorganisms. 2023; 11(4):856. https://doi.org/10.3390/microorganisms11040856
Chicago/Turabian StyleCarreiras, João, Ana Cruz-Silva, Bruno Fonseca, Ricardo C. Carvalho, Jorge P. Cunha, João Proença Pereira, Catarina Paiva-Silva, Soraia A. Santos, Rodrigo Janeiro Sequeira, Enrique Mateos-Naranjo, and et al. 2023. "Improving Grapevine Heat Stress Resilience with Marine Plant Growth-Promoting Rhizobacteria Consortia" Microorganisms 11, no. 4: 856. https://doi.org/10.3390/microorganisms11040856