
Addressing the Joint Impact of Temperature and pH on Vibrio harveyi Adaptation in the Time of Climate Change
 , , , and
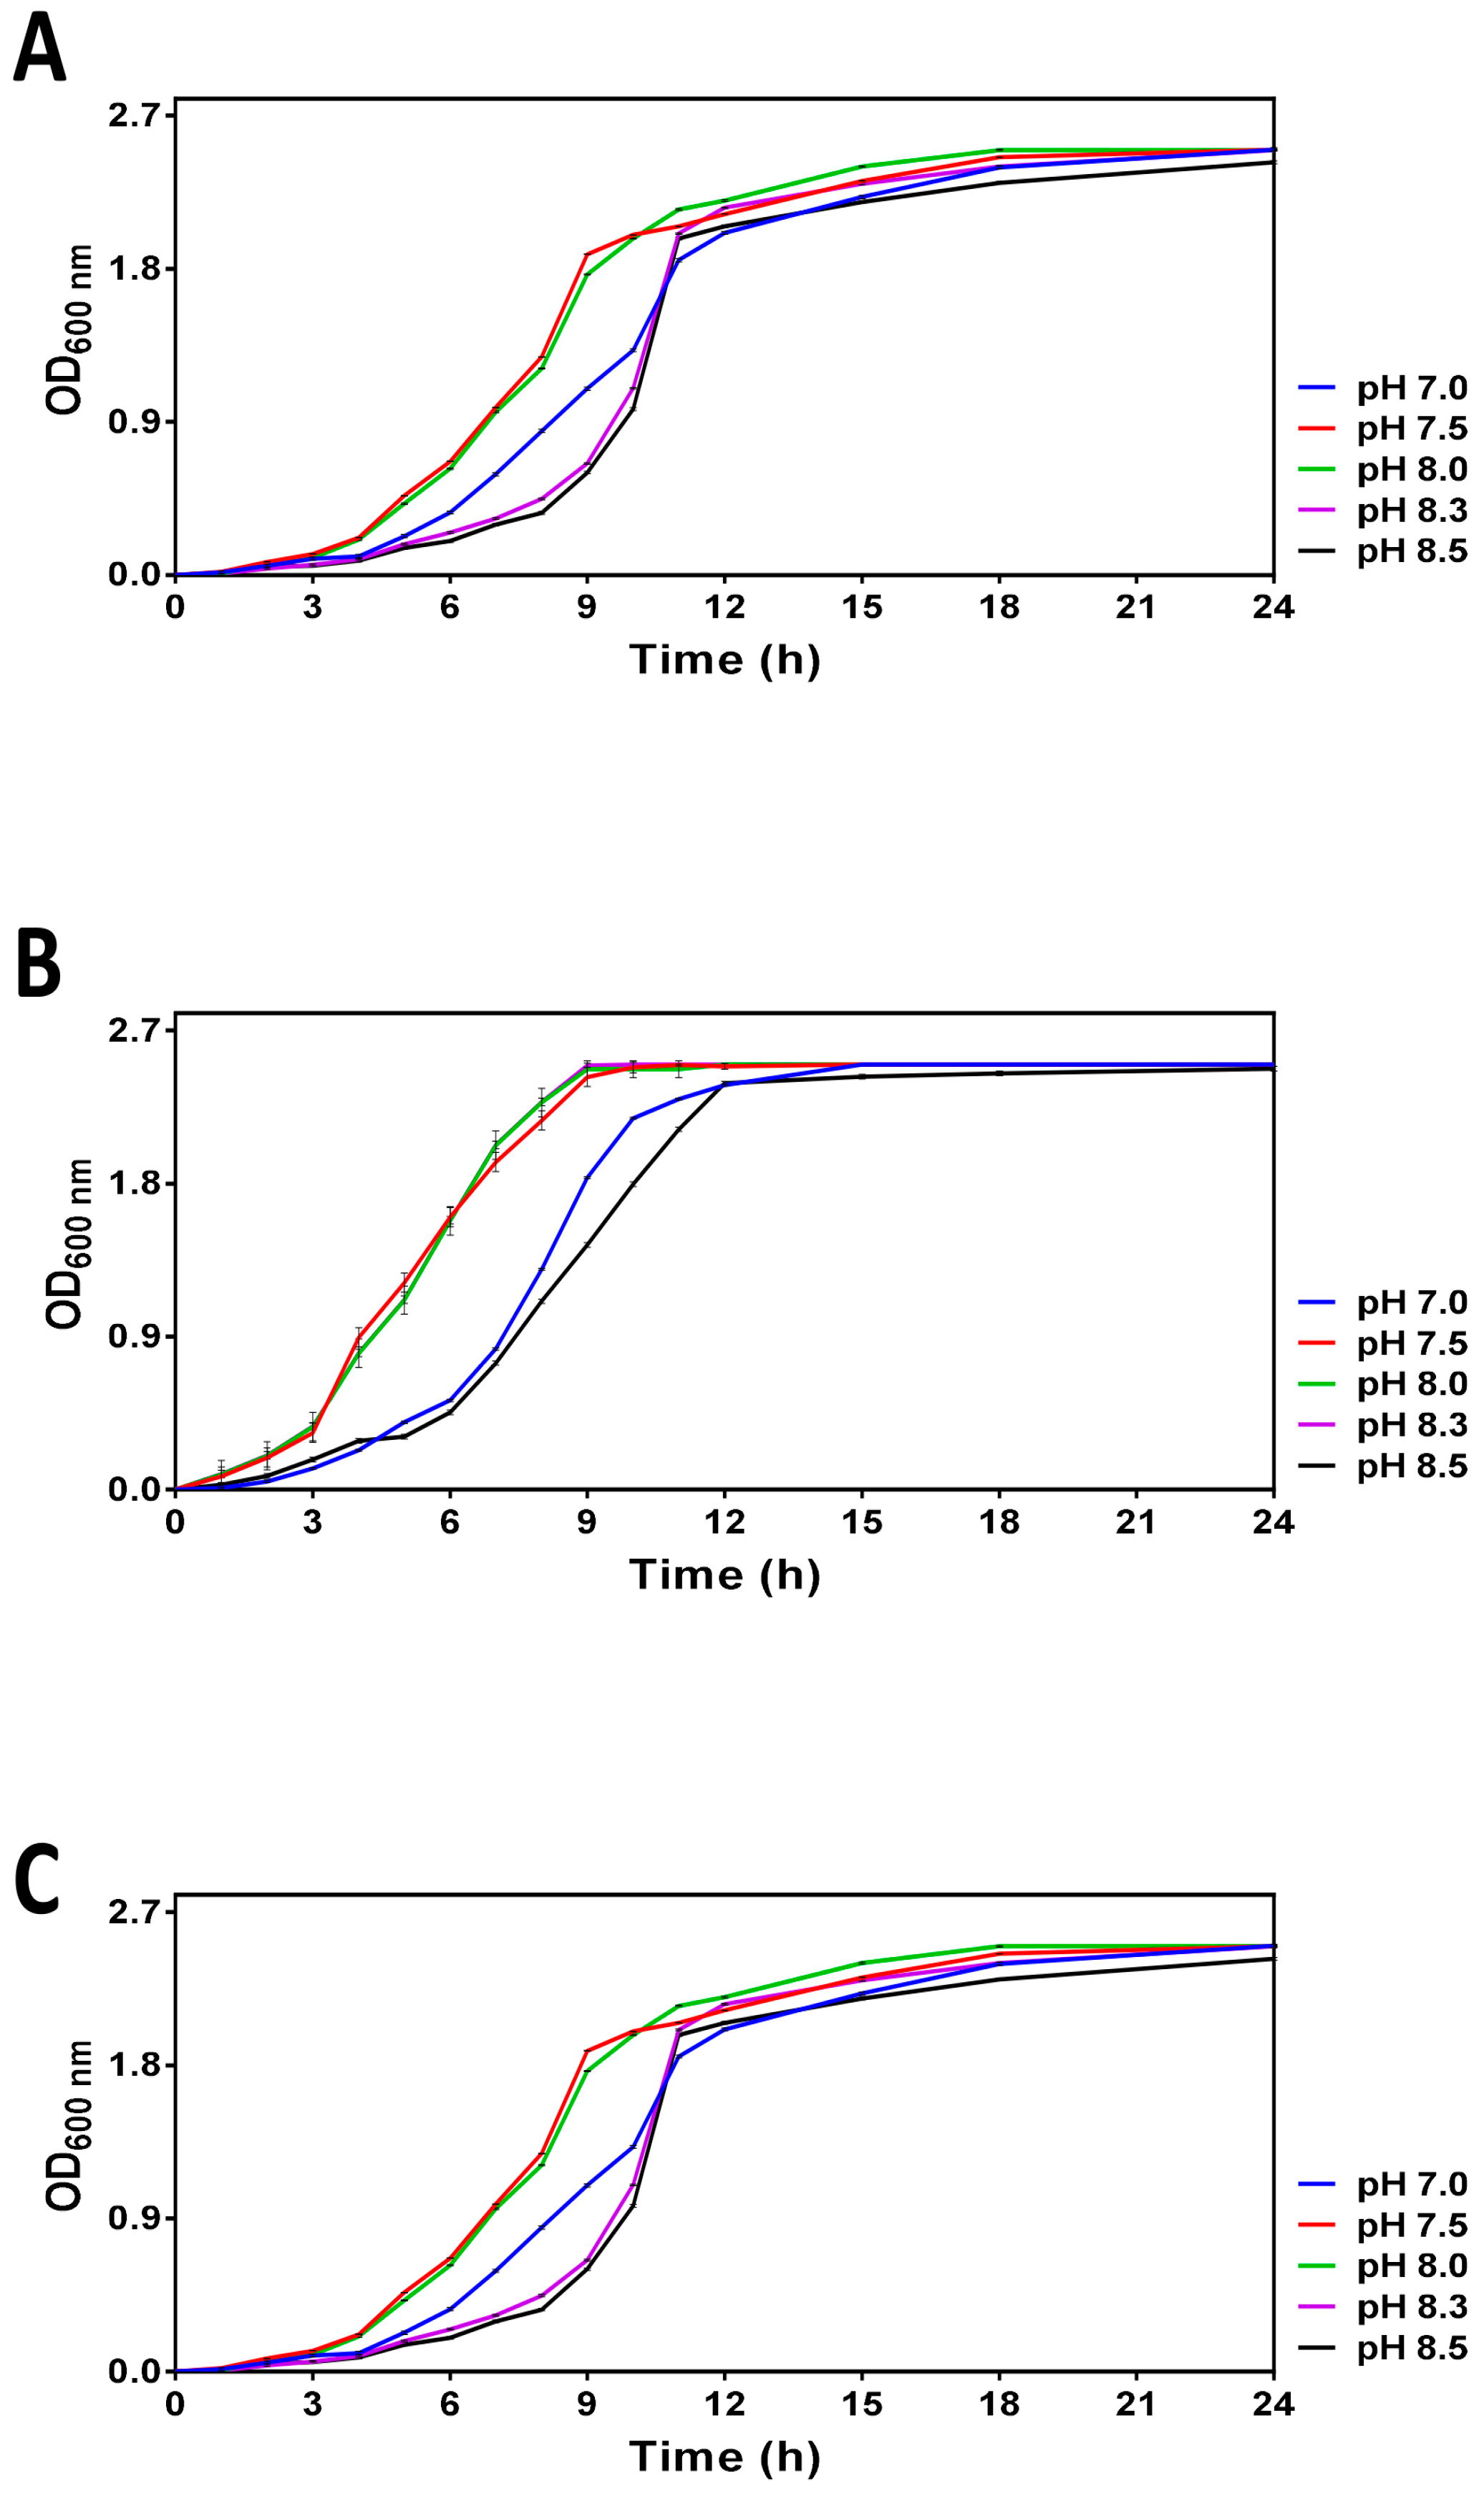
Abstract
:1. Introduction
2. Materials and Methods
2.1. Bacterial Strain and Media
2.2. Growth Curves
2.3. Survival Assays
2.4. Enumeration of Cells and Estimation of Cell Size
2.5. Statistical Analysis
3. Results
3.1. Analysis of V. harveyi Growth at Different pH
3.2. Assessing the Impact of pH on V. harveyi Adaptation under Limitation of Nutrients
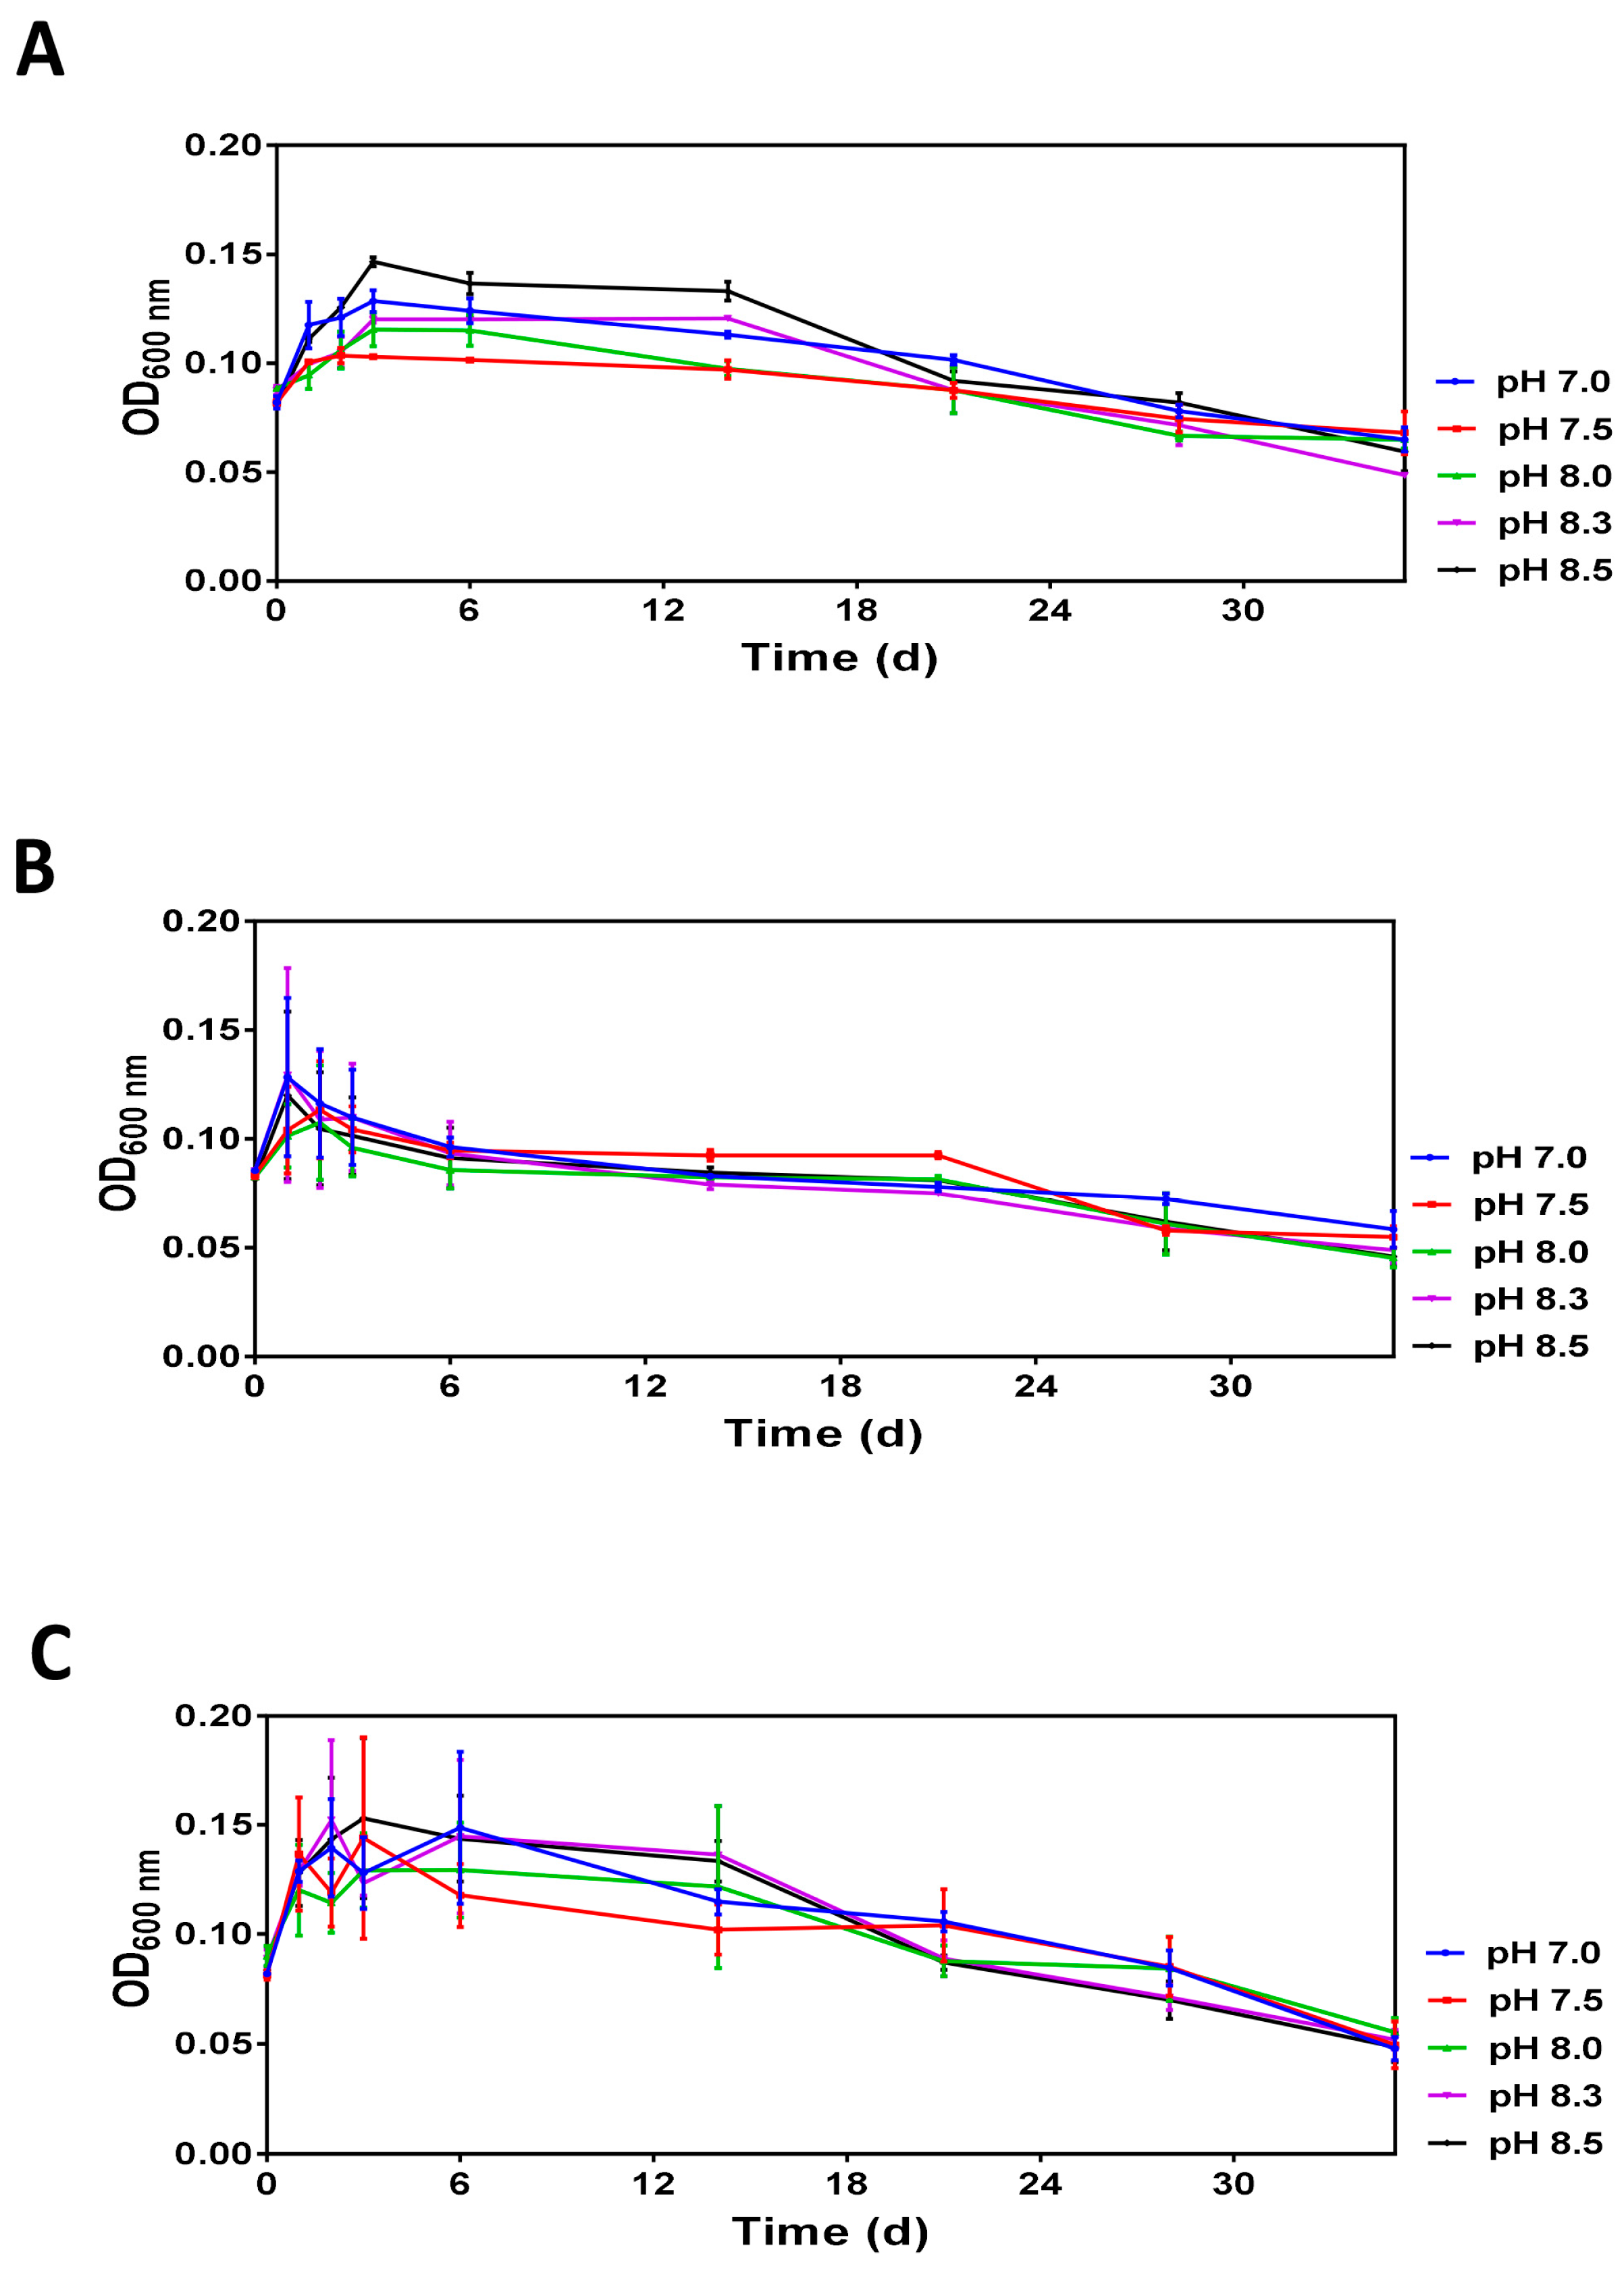
3.2.1. Monitoring of Optical Density
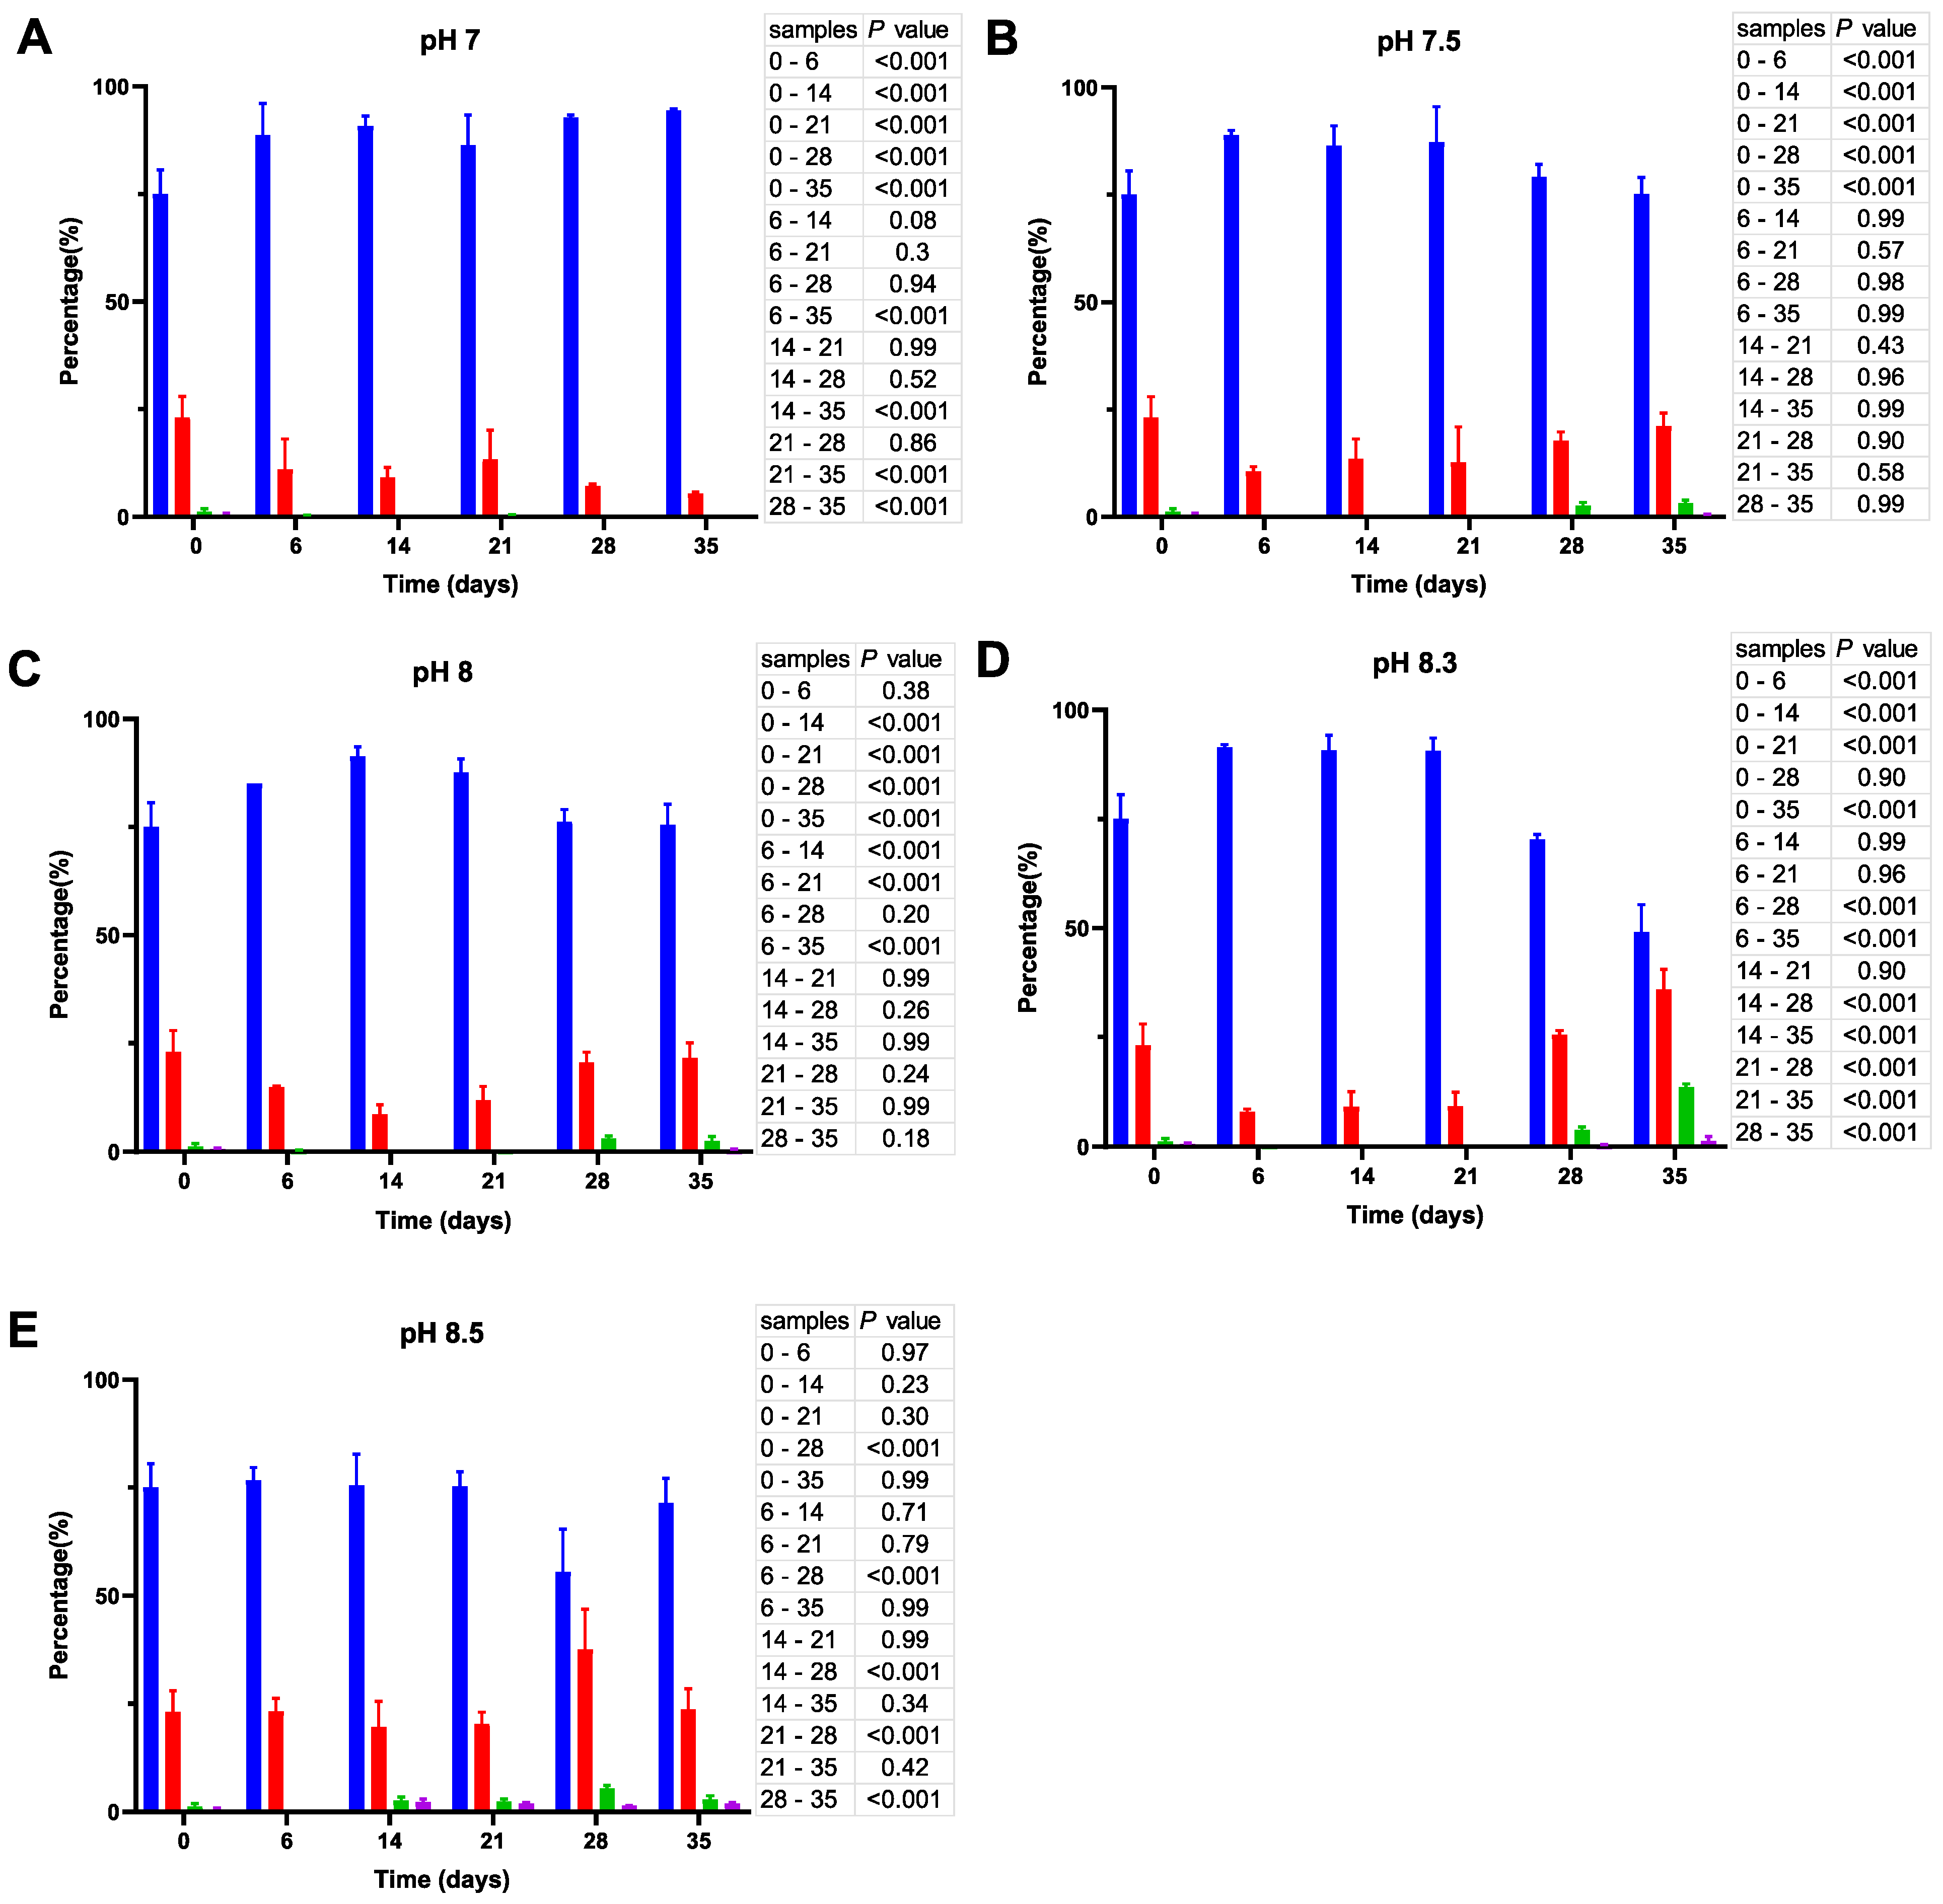
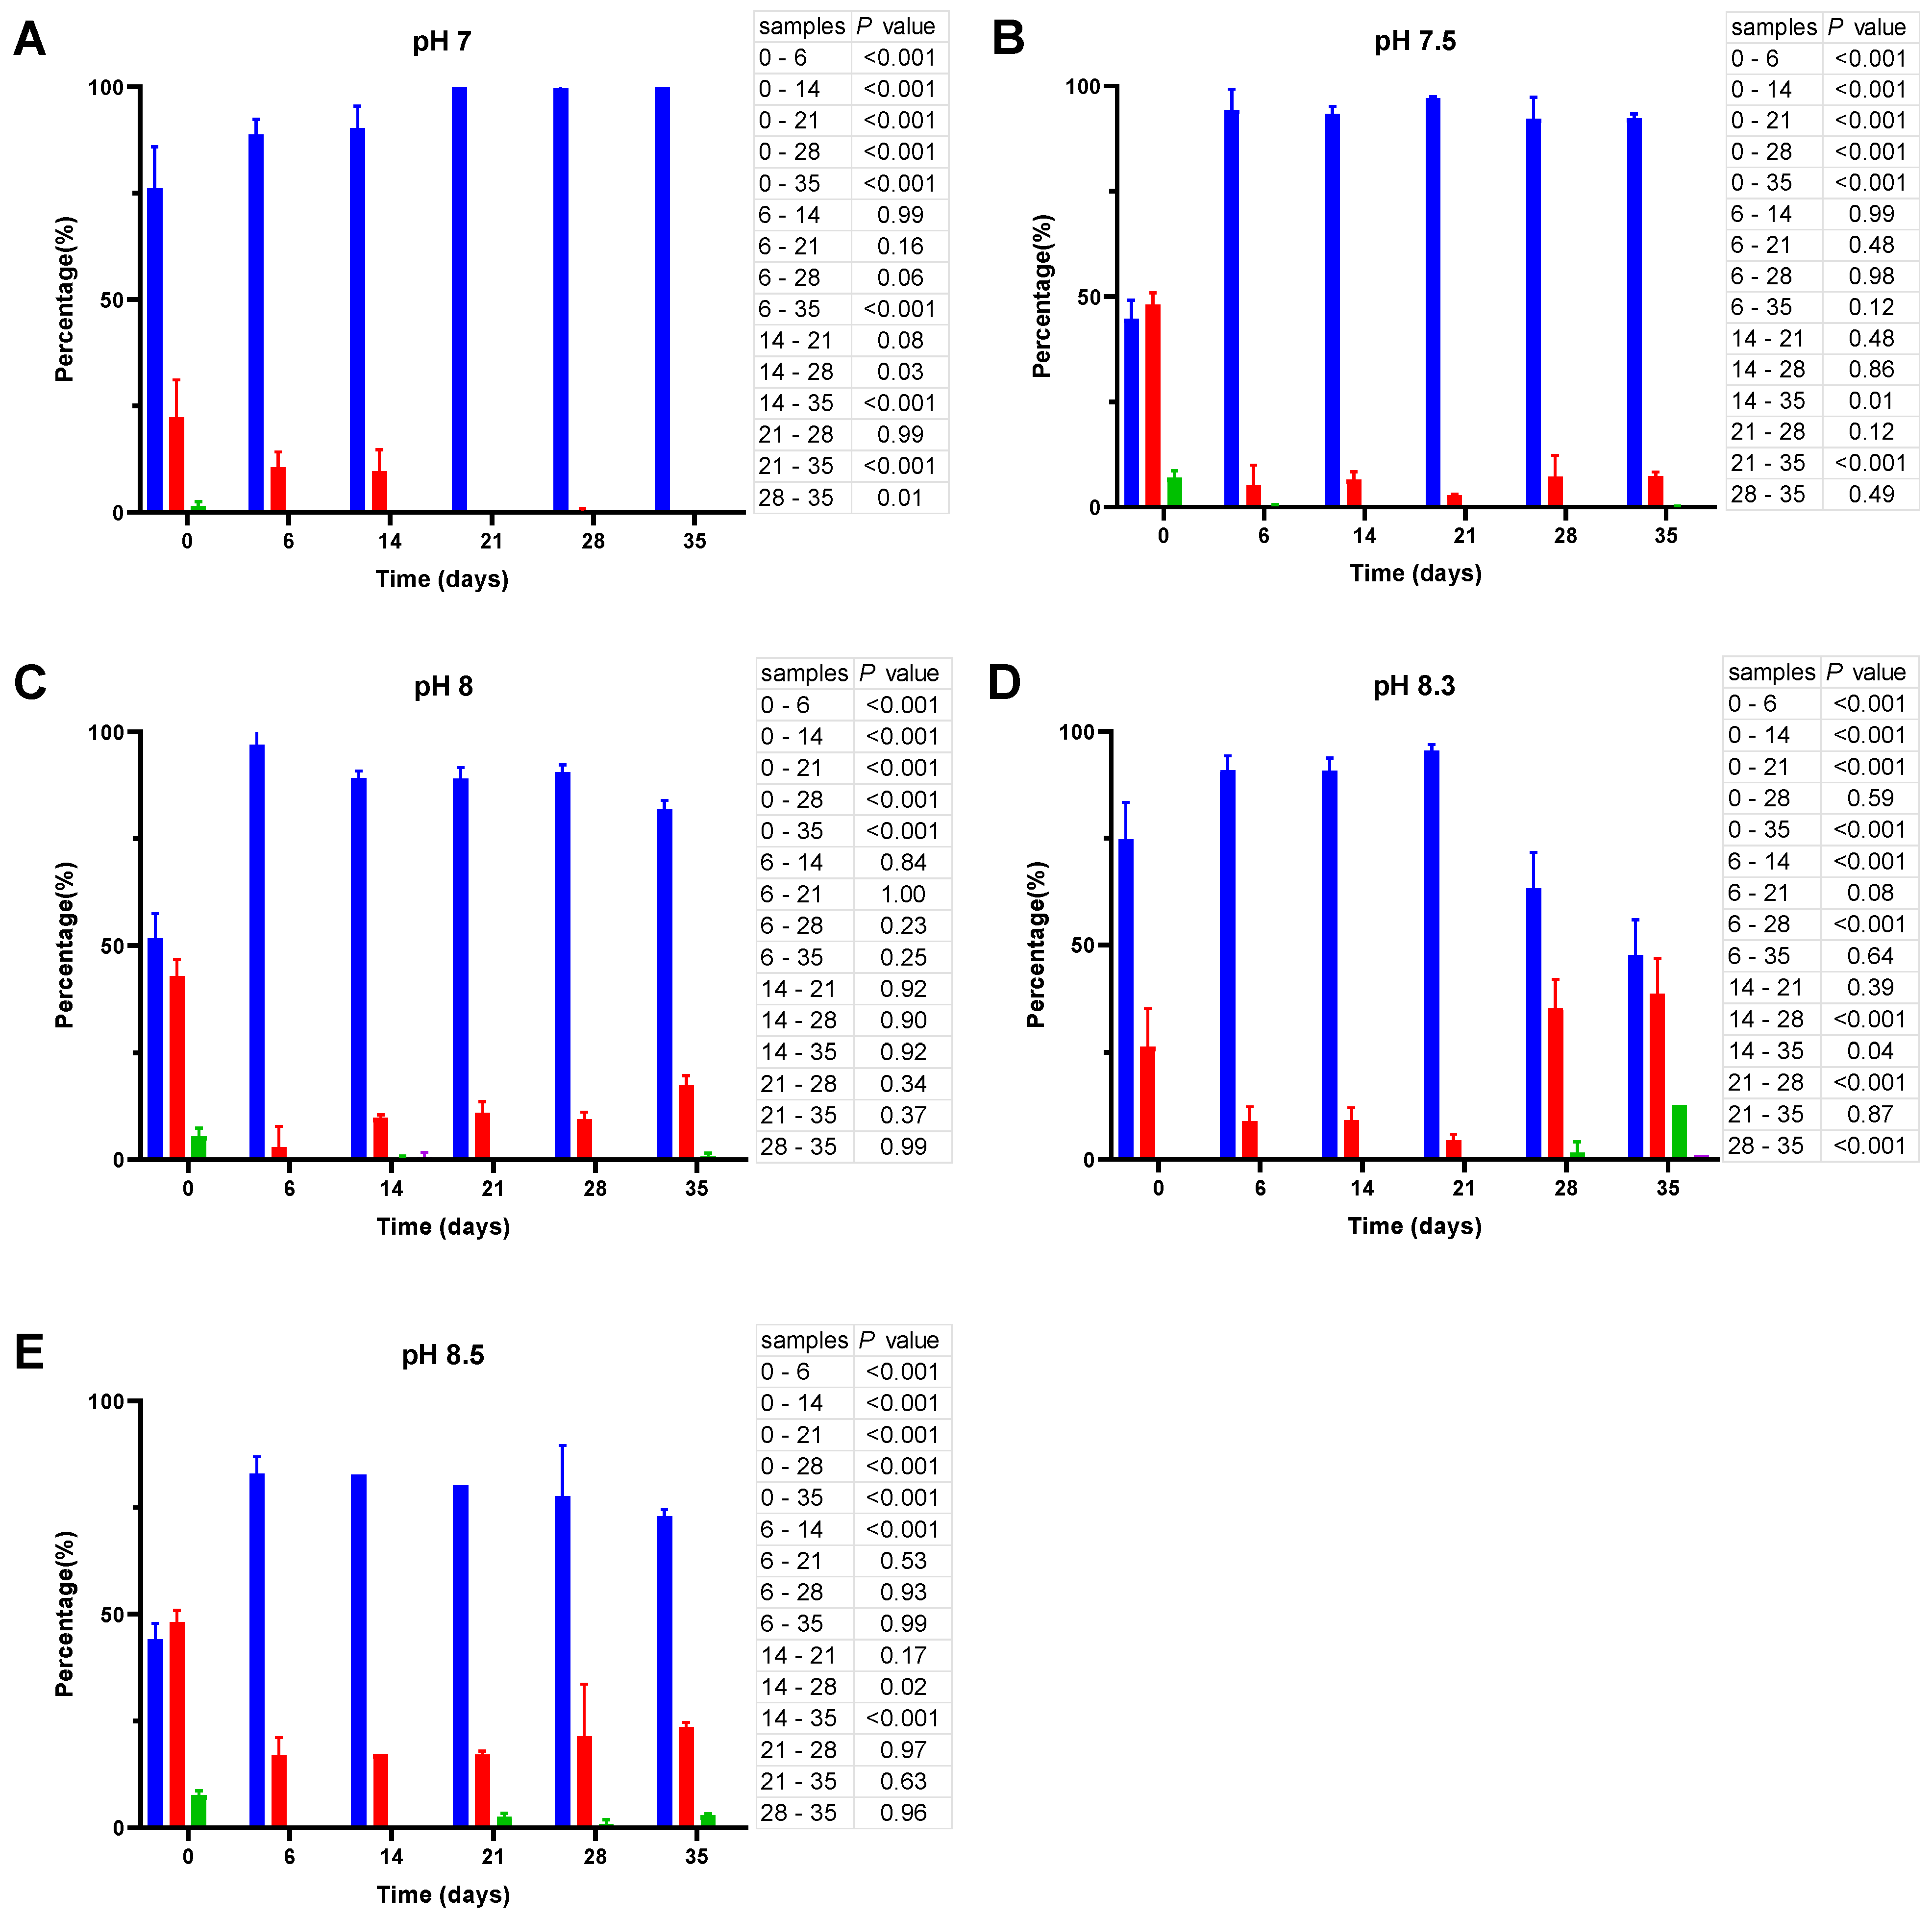
3.2.2. Enumeration of Total Bacteria and Their Culturable Fraction
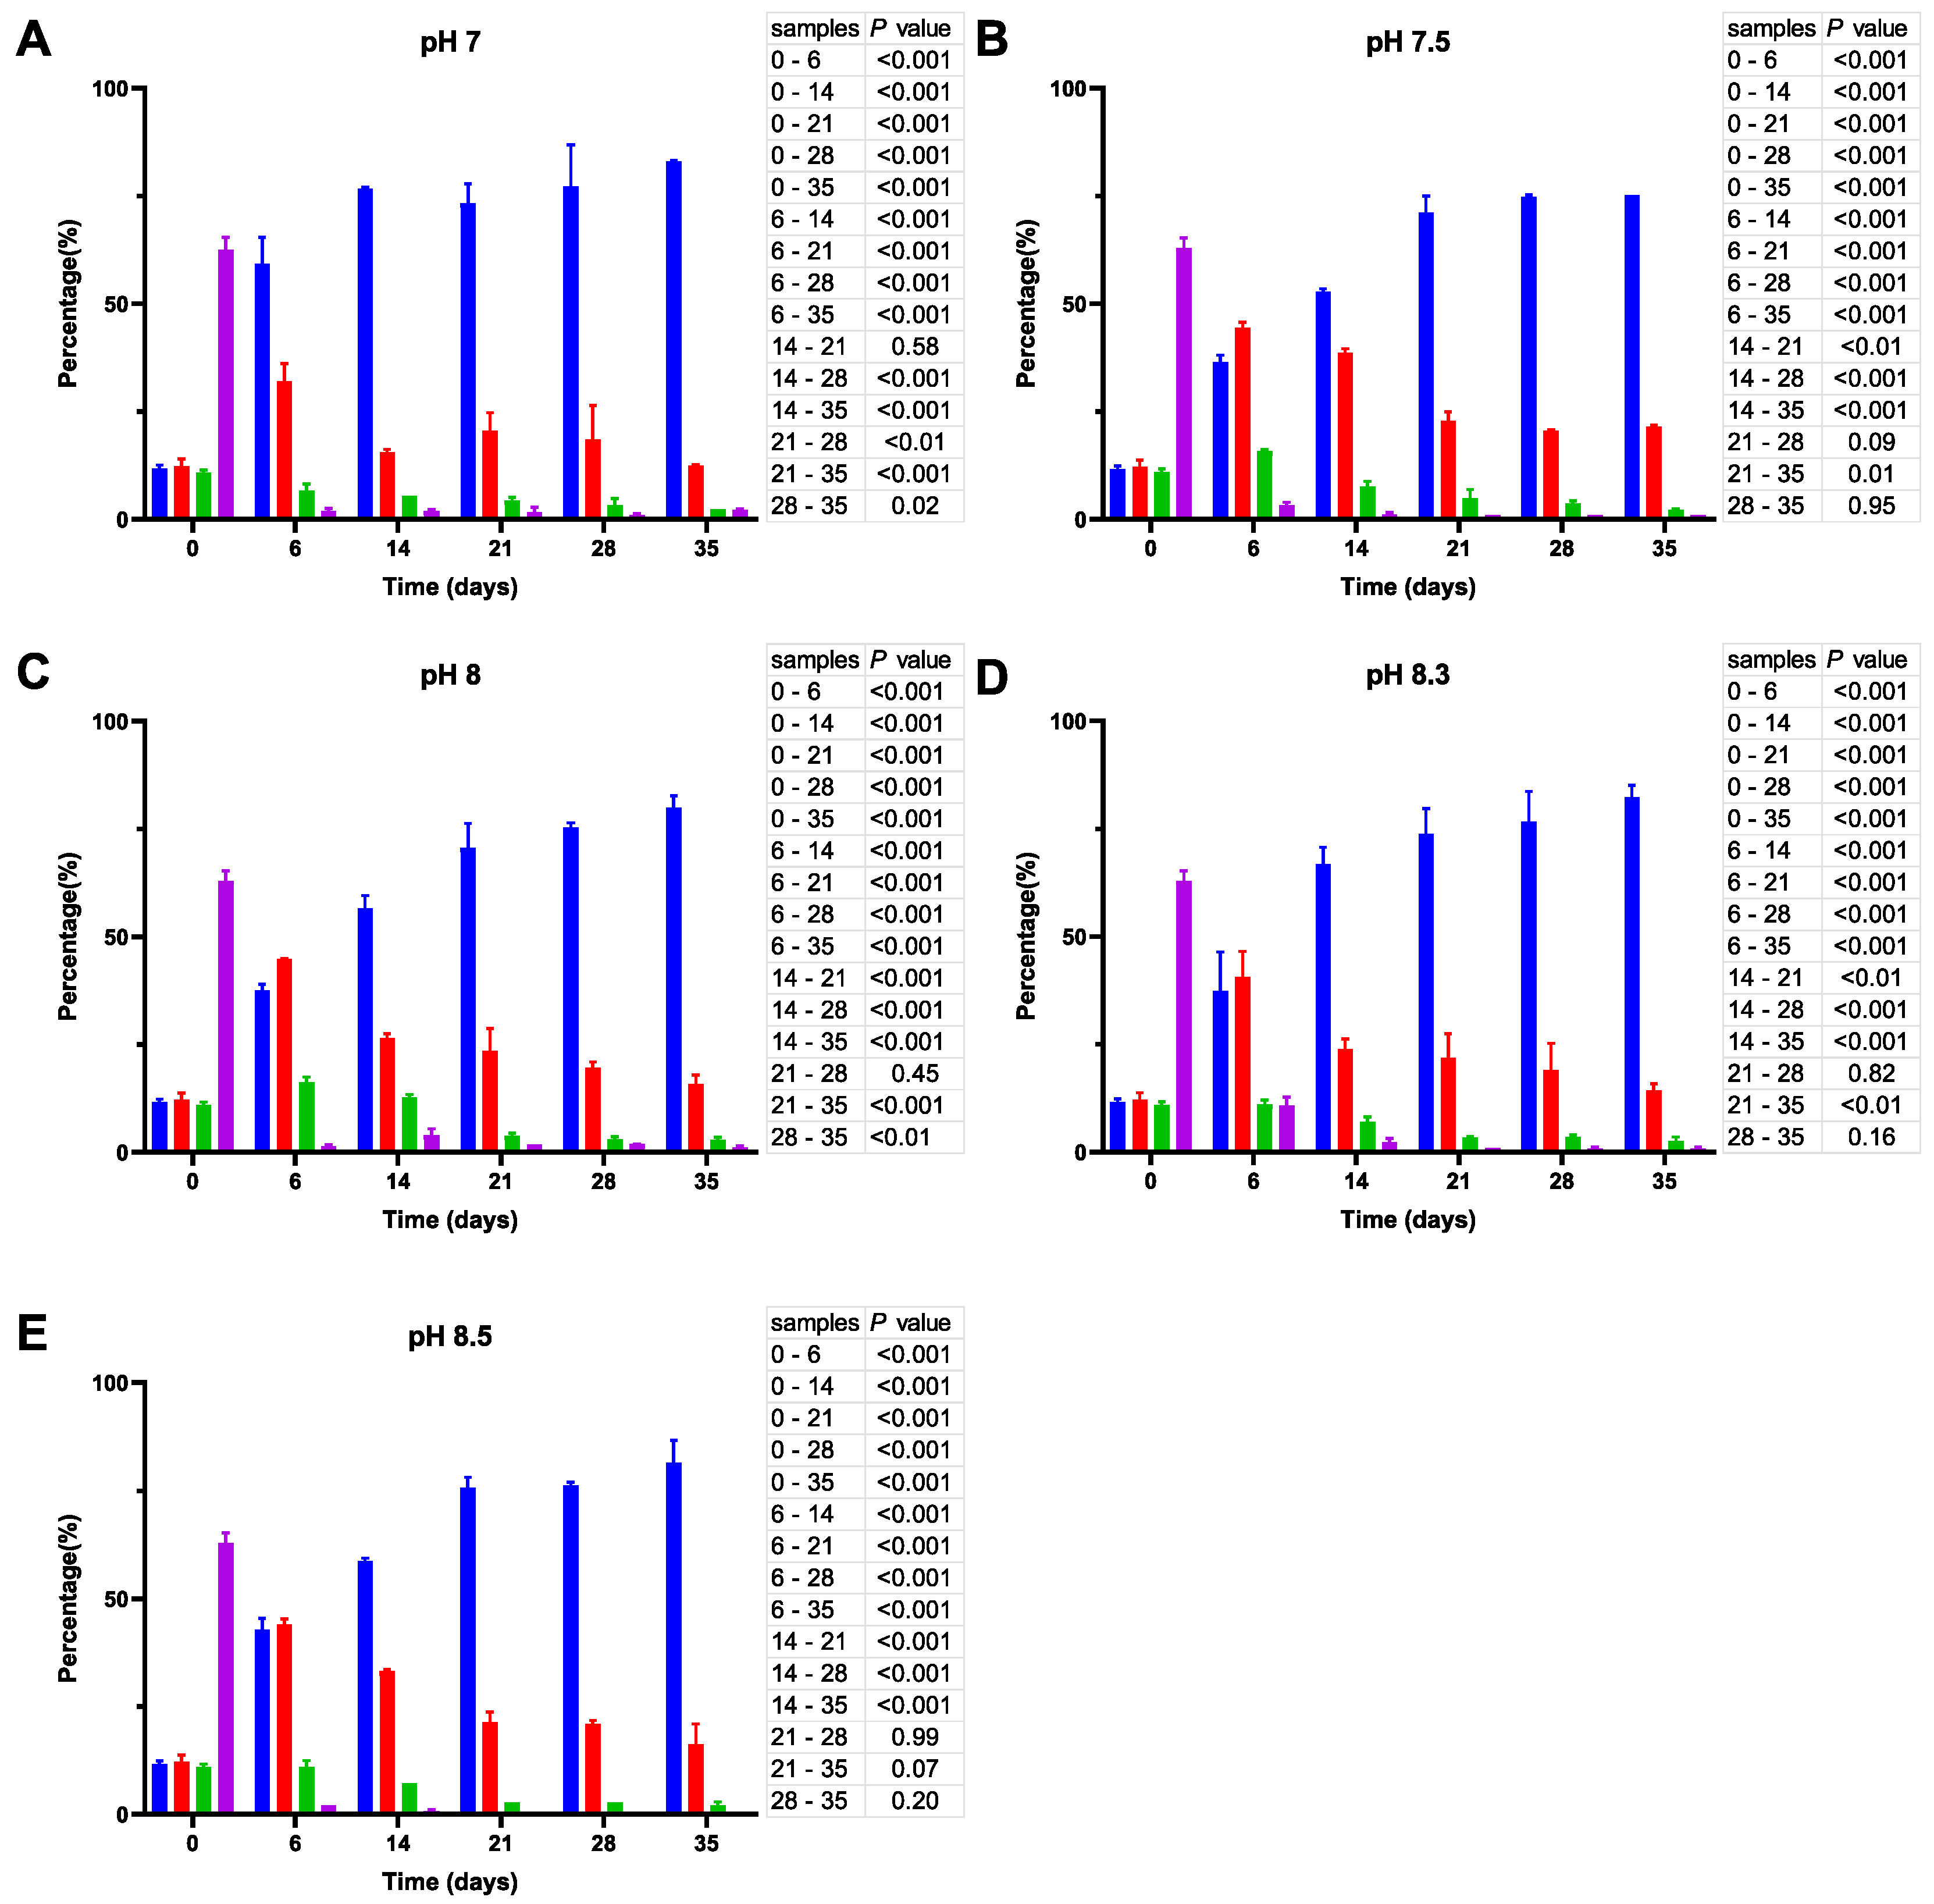
3.2.3. Analysis of Cell Size and Morphology
4. Discussion
Supplementary Materials
Author Contributions
Funding
Data Availability Statement
Acknowledgments
Conflicts of Interest
References
- Mora, C.; Tittensor, D.P.; Adl, S.; Simpson, A.G.B.; Worm, B. How Many Species Are There on Earth and in the Ocean? PLoS Biol. 2011, 9, e1001127. [Google Scholar] [CrossRef]
- NASAs Jet Propulsion Laboratory Global Warming vs. Climate Change. Available online: https://climate.nasa.gov/global-warming-vs-climate-change/ (accessed on 15 December 2022).
- Gattuso, J.-P.; Magnan, A.; Billé, R.; Cheung, W.W.L.; Howes, E.L.; Joos, F.; Allemand, D.; Bopp, L.; Cooley, S.R.; Eakin, C.M.; et al. Contrasting Futures for Ocean and Society from Different Anthropogenic CO2 Emissions Scenarios. Science 2015, 349, aac4722. [Google Scholar] [CrossRef]
- NOAA National Centers for Environmental Information Climate at a Glance: Global Time Series. Available online: https://www.ncei.noaa.gov/access/monitoring/climate-at-a-glance/ (accessed on 15 December 2022).
- Schwaner, C.; Barbosa, M.; Connors, P.; Park, T.-J.; de Silva, D.; Griffith, A.; Gobler, C.J.; Pales Espinosa, E.; Allam, B. Experimental Acidification Increases Susceptibility of Mercenaria Mercenaria to Infection by Vibrio Species. Mar. Environ. Res. 2020, 154, 104872. [Google Scholar] [CrossRef]
- Moberg, F.; Folke, C. Ecological Goods and Services of Coral Reef Ecosystems. Ecol. Econ. 1999, 29, 215–233. [Google Scholar] [CrossRef]
- De Marchi, L.; Pretti, C.; Chiellini, F.; Morelli, A.; Neto, V.; Soares, A.M.V.M.; Figueira, E.; Freitas, R. Impacts of Ocean Acidification on Carboxylated Carbon Nanotube Effects Induced in the Clam Species Ruditapes Philippinarum. Environ. Sci. Pollut. Res. 2019, 26, 20742–20752. [Google Scholar] [CrossRef] [PubMed]
- Zhang, T.; Qu, Y.; Zhang, Q.; Tang, J.; Cao, R.; Dong, Z.; Wang, Q.; Zhao, J. Risks to the Stability of Coral Reefs in the South China Sea: An Integrated Biomarker Approach to Assess the Physiological Responses of Trochus Niloticus to Ocean Acidification and Warming. Sci. Total. Environ. 2021, 782, 146876. [Google Scholar] [CrossRef]
- Zha, S.; Liu, S.; Su, W.; Shi, W.; Xiao, G.; Yan, M.; Liu, G. Laboratory Simulation Reveals Significant Impacts of Ocean Acidification on Microbial Community Composition and Host-Pathogen Interactions between the Blood Clam and Vibrio Harveyi. Fish Shellfish. Immunol. 2017, 71, 393–398. [Google Scholar] [CrossRef]
- Guo, X.; Huang, M.; Luo, X.; You, W.; Ke, C. Effects of One-Year Exposure to Ocean Acidification on Two Species of Abalone. Sci. Total. Environ. 2022, 852, 158144. [Google Scholar] [CrossRef] [PubMed]
- Hernroth, B.; Baden, S.; Tassidis, H.; Hörnaeus, K.; Guillemant, J.; Bergström Lind, S.; Bergquist, J. Impact of Ocean Acidification on Antimicrobial Activity in Gills of the Blue Mussel (Mytilus edulis). Fish Shellfish. Immunol. 2016, 55, 452–459. [Google Scholar] [CrossRef]
- Huang, X.; Leung, J.Y.S.; Hu, M.; Xu, E.G.; Wang, Y. Microplastics Can Aggravate the Impact of Ocean Acidification on the Health of Mussels: Insights from Physiological Performance, Immunity and Byssus Properties. Environ. Pollut. 2022, 308, 119701. [Google Scholar] [CrossRef] [PubMed]
- Chatterjee, S.; Haldar, S. Vibrio Related Diseases in Aquaculture and Development of Rapid and Accurate Identification Methods. J. Mar. Sci. Res. Dev. 2012, s1, 002. [Google Scholar] [CrossRef]
- Meseck, S.L.; Alix, J.H.; Swiney, K.M.; Long, W.C.; Wikfors, G.H.; Foy, R.J. Ocean Acidification Affects Hemocyte Physiology in the Tanner Crab (Chionoecetes bairdi). PLoS ONE 2016, 11, e0148477. [Google Scholar] [CrossRef] [PubMed]
- Leite Figueiredo, D.A.; Branco, P.C.; dos Santos, D.A.; Emerenciano, A.K.; Iunes, R.S.; Shimada Borges, J.C.; Machado Cunha da Silva, J.R. Ocean Acidification Affects Parameters of Immune Response and Extracellular PH in Tropical Sea Urchins Lytechinus Variegatus and Echinometra Luccunter. Aquat. Toxicol. 2016, 180, 84–94. [Google Scholar] [CrossRef]
- Deeb, R.; Tufford, D.; Scott, G.I.; Moore, J.G.; Dow, K. Impact of Climate Change on Vibrio Vulnificus Abundance and Exposure Risk. Estuaries Coasts 2018, 41, 2289–2303. [Google Scholar] [CrossRef]
- Montánchez, I.; Kaberdin, V.R. Vibrio Harveyi: A Brief Survey of General Characteristics and Recent Epidemiological Traits Associated with Climate Change. Mar. Environ. Res. 2020, 154, 104850. [Google Scholar] [CrossRef]
- Vezzulli, L.; Colwell, R.R.; Pruzzo, C. Ocean Warming and Spread of Pathogenic Vibrios in the Aquatic Environment. Microb. Ecol. 2013, 65, 817–825. [Google Scholar] [CrossRef]
- Vezzulli, L.; Grande, C.; Reid, P.C.; Hélaouët, P.; Edwards, M.; Höfle, M.G.; Brettar, I.; Colwell, R.R.; Pruzzo, C. Climate Influence on Vibrio and Associated Human Diseases during the Past Half-Century in the Coastal North Atlantic. Proc. Natl. Acad. Sci. USA 2016, 113, E5062-71. [Google Scholar] [CrossRef] [PubMed]
- Harrison, J.; Nelson, K.; Morcrette, H.; Morcrette, C.; Preston, J.; Helmer, L.; Titball, R.W.; Butler, C.S.; Wagley, S. The Increased Prevalence of Vibrio Species and the First Reporting of Vibrio Jasicida and Vibrio Rotiferianus at UK Shellfish Sites. Water Res. 2022, 211, 117942. [Google Scholar] [CrossRef]
- Orruño, M.; Kaberdin, V.R.; Arana, I. Survival Strategies of Escherichia coli and Vibrio Spp.: Contribution of the Viable but Nonculturable Phenotype to Their Stress-Resistance and Persistence in Adverse Environments. World J. Microbiol. Biotechnol. 2017, 33, 45. [Google Scholar] [CrossRef] [PubMed]
- Kaberdin, V.R.; Montánchez, I.; Parada, C.; Orruño, M.; Arana, I.; Barcina, I. Unveiling the Metabolic Pathways Associated with the Adaptive Reduction of Cell Size During Vibrio Harveyi Persistence in Seawater Microcosms. Microb. Ecol. 2015, 70, 689–700. [Google Scholar] [CrossRef]
- Chen, S.-Y.; Jane, W.-N.; Chen, Y.-S.; Wong, H. Morphological Changes of Vibrio Parahaemolyticus under Cold and Starvation Stresses. Int. J. Food Microbiol. 2009, 129, 157–165. [Google Scholar] [CrossRef]
- Cavallo, R.A.; Stabili, L. Culturable Vibrios Biodiversity in the Northern Ionian Sea (Italian Coasts). Sci. Mar. 2004, 68, 23–29. [Google Scholar] [CrossRef]
- Sun, F.; Chen, J.; Zhong, L.; Zhang, X.; Wang, R.; Guo, Q.; Dong, Y. Characterization and Virulence Retention of Viable but Nonculturable Vibrio Harveyi. FEMS Microbiol. Ecol. 2008, 64, 37–44. [Google Scholar] [CrossRef] [PubMed]
- Rosenberg, M.; Azevedo, N.F.; Ivask, A. Propidium Iodide Staining Underestimates Viability of Adherent Bacterial Cells. Sci. Rep. 2019, 9, 6483. [Google Scholar] [CrossRef]
- Hobbie, J.E.; Daley, R.J.; Jasper, S. Use of Nuclepore Filters for Counting Bacteria by Fluorescence Microscopy. Appl. Environ. Microbiol. 1977, 33, 1225–1228. [Google Scholar] [CrossRef] [PubMed]
- Kuznetsova, A.; Brockhoff, P.B.; Christensen, R.H.B. LmerTest Package: Tests in Linear Mixed Effects Models. J. Stat. Softw. 2017, 82, 1–26. [Google Scholar] [CrossRef]
- Lenth, R.V. Emmeans: Estimated Marginal Means, Aka Least-Squares Means. R Package Version 1.8.5. Available online: https://cran.r-project.org/web/packages/emmeans/index.html (accessed on 10 March 2023).
- Core Writing Team; Pachauri, R.K.; Meyer, L.A. IPCC, 2014: Climate Change 2014: Synthesis Report. Report of the Intergovernmental Panel on Climate Change; IPCC: Geneva, Switzerland, 2014. [Google Scholar]
- Tanaka, Y.; Kimura, B.; Takahashi, H.; Watanabe, T.; Obata, H.; Kai, A.; Morozumi, S.; Fujii, T. Lysine Decarboxylase of Vibrio Parahaemolyticus: Kinetics of Transcription and Role in Acid Resistance. J. Appl. Microbiol. 2008, 104, 1283–1293. [Google Scholar] [CrossRef]
- Yoon, J.-H.; Bae, Y.-M.; Lee, S.-Y. Effects of Varying Concentrations of Sodium Chloride and Acidic Conditions on the Behavior of Vibrio Parahaemolyticus and Vibrio Vulnificus Cold-Starved in Artificial Sea Water Microcosms. Food Sci. Biotechnol. 2017, 26, 829–839. [Google Scholar] [CrossRef] [PubMed]
- Montánchez, I.; Ogayar, E.; Plágaro, A.H.; Esteve-Codina, A.; Gómez-Garrido, J.; Orruño, M.; Arana, I.; Kaberdin, V.R. Analysis of Vibrio Harveyi Adaptation in Sea Water Microcosms at Elevated Temperature Provides Insights into the Putative Mechanisms of Its Persistence and Spread in the Time of Global Warming. Sci. Rep. 2019, 9, 289. [Google Scholar] [CrossRef]
- McDougald, D.; Kjelleberg, S. Adaptive Responses of Vibrios. In The Biology of Vibrios; ASM Press: Washington, DC, USA, 2014; pp. 133–155. [Google Scholar]
- Zhong, L.; Chen, J.; Zhang, X.-h.; Jiang, Y.-a. Entry of Vibrio cincinnatiensis into Viable but Nonculturable State and Its Resuscitation. Lett. Appl. Microbiol. 2009, 48, 247–252. [Google Scholar] [CrossRef]
- Orruño, M.; Parada, C.; Kaberdin, V.R.; Arana, I. The Effect of Visible Light on Cell Envelope Subproteome during Vibrio Harveyi Survival at 20 °C in Seawater. Microorganisms 2021, 9, 594. [Google Scholar] [CrossRef] [PubMed]
- Sun, J.; Gao, X.; Qun, J.; Du, X.; Bi, K.; Zhang, X.; Lin, L. Comparative Analysis of the Survival and Gene Expression of Pathogenic Strains Vibrio harveyi after Starvation. FEMS Microbiol. Lett. 2016, 363, fnw250. [Google Scholar] [CrossRef] [PubMed]
- Orruño, M.; Parada, C.; Ogayar, E.; Kaberdin, V.; Arana, I. Effects of Abiotic and Biotic Factors on Vibrio Harveyi ATCC 14126T Survival Dynamics in Seawater Microcosms. Aquat. Microb. Ecol. 2019, 83, 109–118. [Google Scholar] [CrossRef]
- Wang, X.; Liu, J.; Liang, J.; Sun, H.; Zhang, X. Spatiotemporal Dynamics of the Total and Active Vibrio Spp. Populations throughout the Changjiang Estuary in China. Environ. Microbiol. 2020, 22, 4438–4455. [Google Scholar] [CrossRef] [PubMed]


Disclaimer/Publisher’s Note: The statements, opinions and data contained in all publications are solely those of the individual author(s) and contributor(s) and not of MDPI and/or the editor(s). MDPI and/or the editor(s) disclaim responsibility for any injury to people or property resulting from any ideas, methods, instructions or products referred to in the content. |
© 2023 by the authors. Licensee MDPI, Basel, Switzerland. This article is an open access article distributed under the terms and conditions of the Creative Commons Attribution (CC BY) license (https://creativecommons.org/licenses/by/4.0/).
Share and Cite
Gundogdu, K.; Orus Iturriza, A.; Orruño, M.; Montánchez, I.; Eguiraun, H.; Martinez, I.; Arana, I.; Kaberdin, V.R. Addressing the Joint Impact of Temperature and pH on Vibrio harveyi Adaptation in the Time of Climate Change. Microorganisms 2023, 11, 1075. https://doi.org/10.3390/microorganisms11041075
Gundogdu K, Orus Iturriza A, Orruño M, Montánchez I, Eguiraun H, Martinez I, Arana I, Kaberdin VR. Addressing the Joint Impact of Temperature and pH on Vibrio harveyi Adaptation in the Time of Climate Change. Microorganisms. 2023; 11(4):1075. https://doi.org/10.3390/microorganisms11041075
Chicago/Turabian StyleGundogdu, Kaan, Ander Orus Iturriza, Maite Orruño, Itxaso Montánchez, Harkaitz Eguiraun, Iciar Martinez, Inés Arana, and Vladimir R. Kaberdin. 2023. "Addressing the Joint Impact of Temperature and pH on Vibrio harveyi Adaptation in the Time of Climate Change" Microorganisms 11, no. 4: 1075. https://doi.org/10.3390/microorganisms11041075