

Evaluation of Effectiveness of a Novel Multicomponent Mycotoxins Detoxification Agent in the Presence of AFB1 and T-2 Toxin on Broiler Chicks

 , and
, and
Abstract
:1. Introduction
2. Materials and Methods
2.1. Birds and Diets
Feed Preparation
2.2. Data Collection and Recording
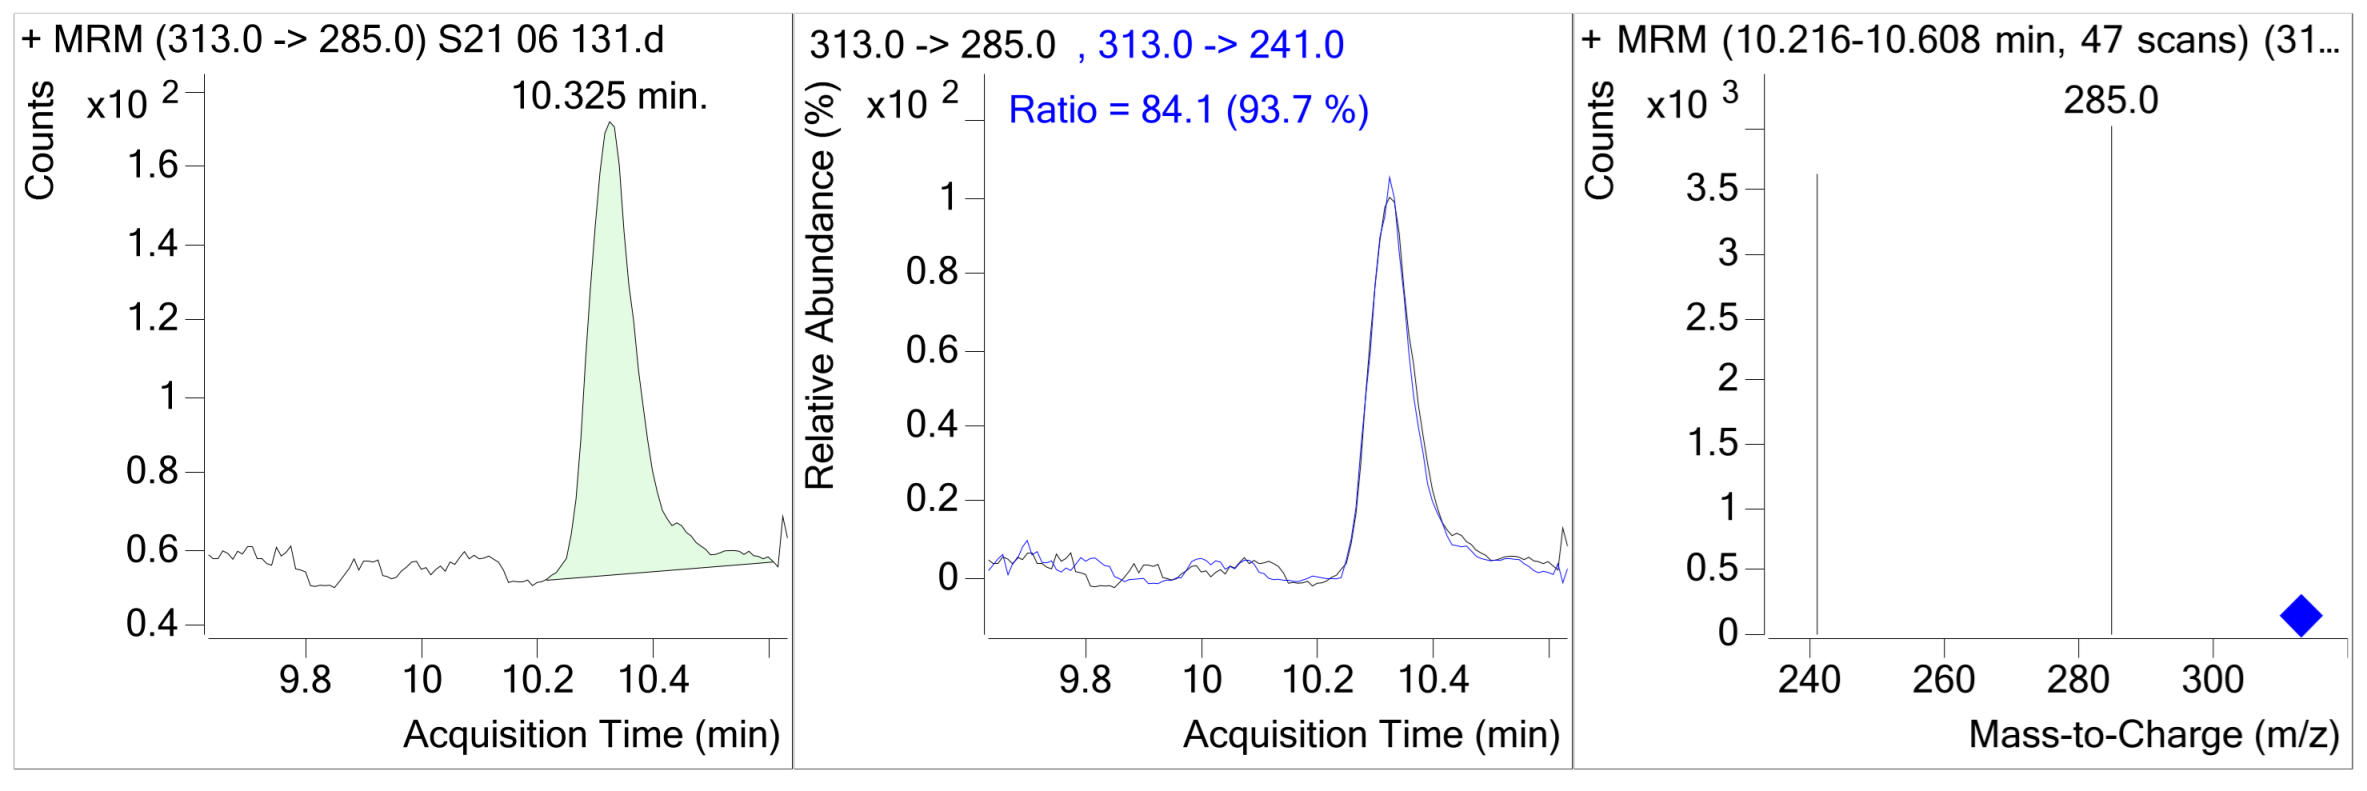
2.2.1. AFB1 and T-2 Toxin and Their Metabolites Analysis
- C—determined concentration of mycotoxin (ng/mL);
- Vr—reconstitution volume (0.5) (mL);
- V—acetonitrile volume (8 mL) in the extraction portion;
- M—amount of sample (g).
2.2.2. Histopathological Examinations in Tissues of Broiler Chicks
2.2.3. Statistical Analysis
3. Results
3.1. The Effect of Novel Detoxification Agent MR on Growth Parameters of Broiler Chicken
3.2. The Effect of MR on Pathomorphological Alterations in Target Organs
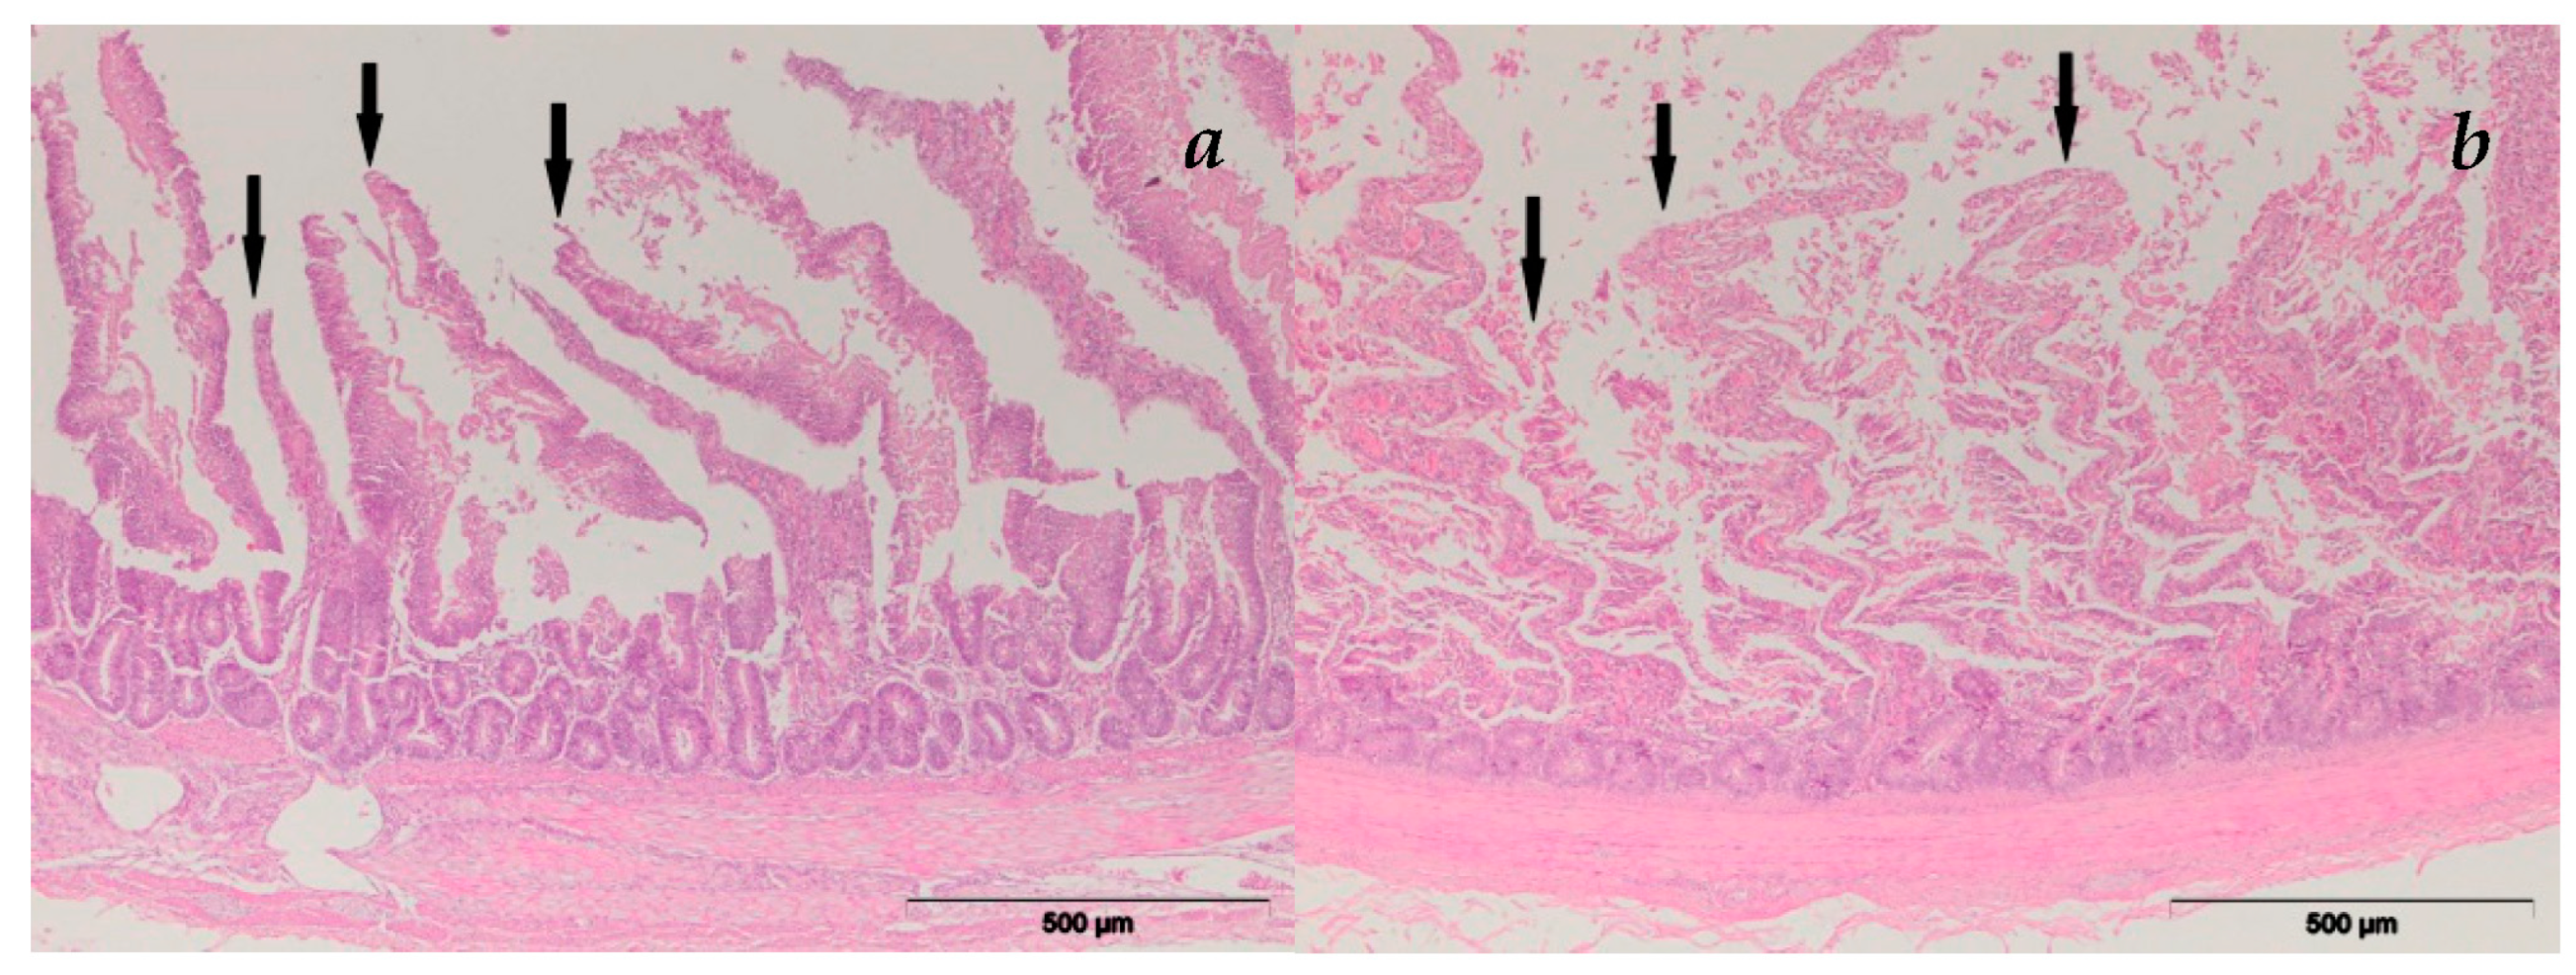
3.2.1. Intestine/Duodenum
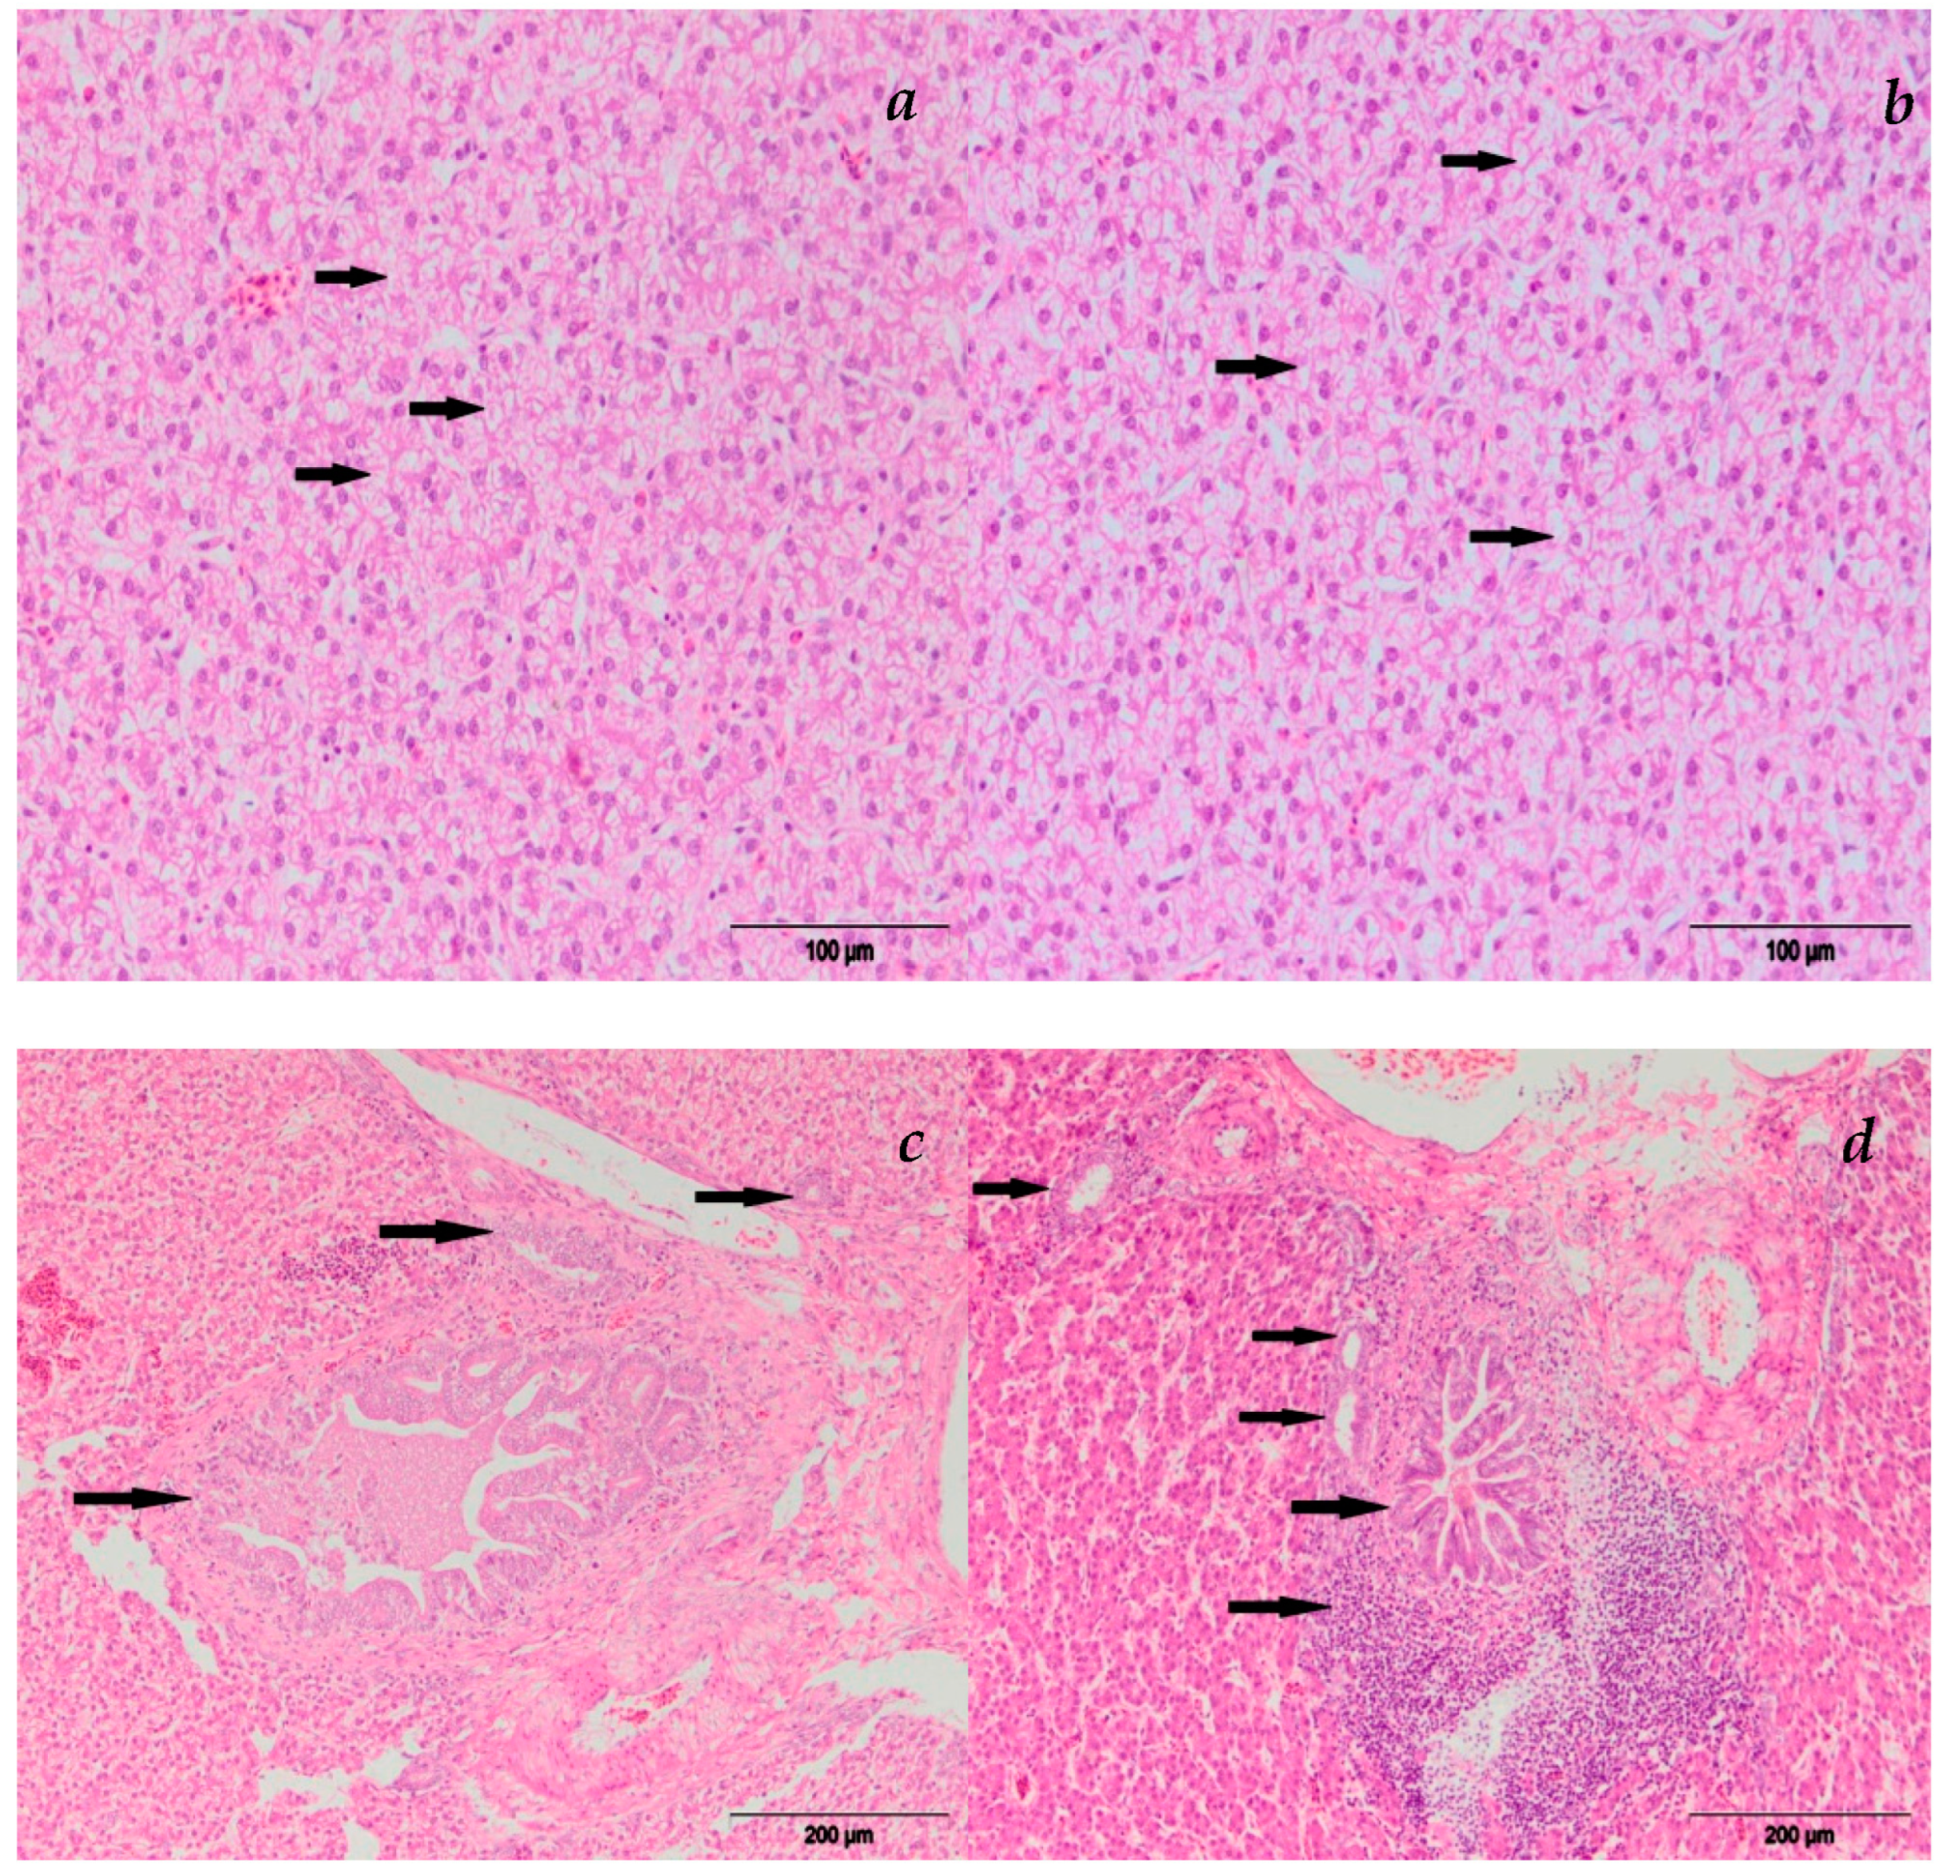
3.2.2. Liver
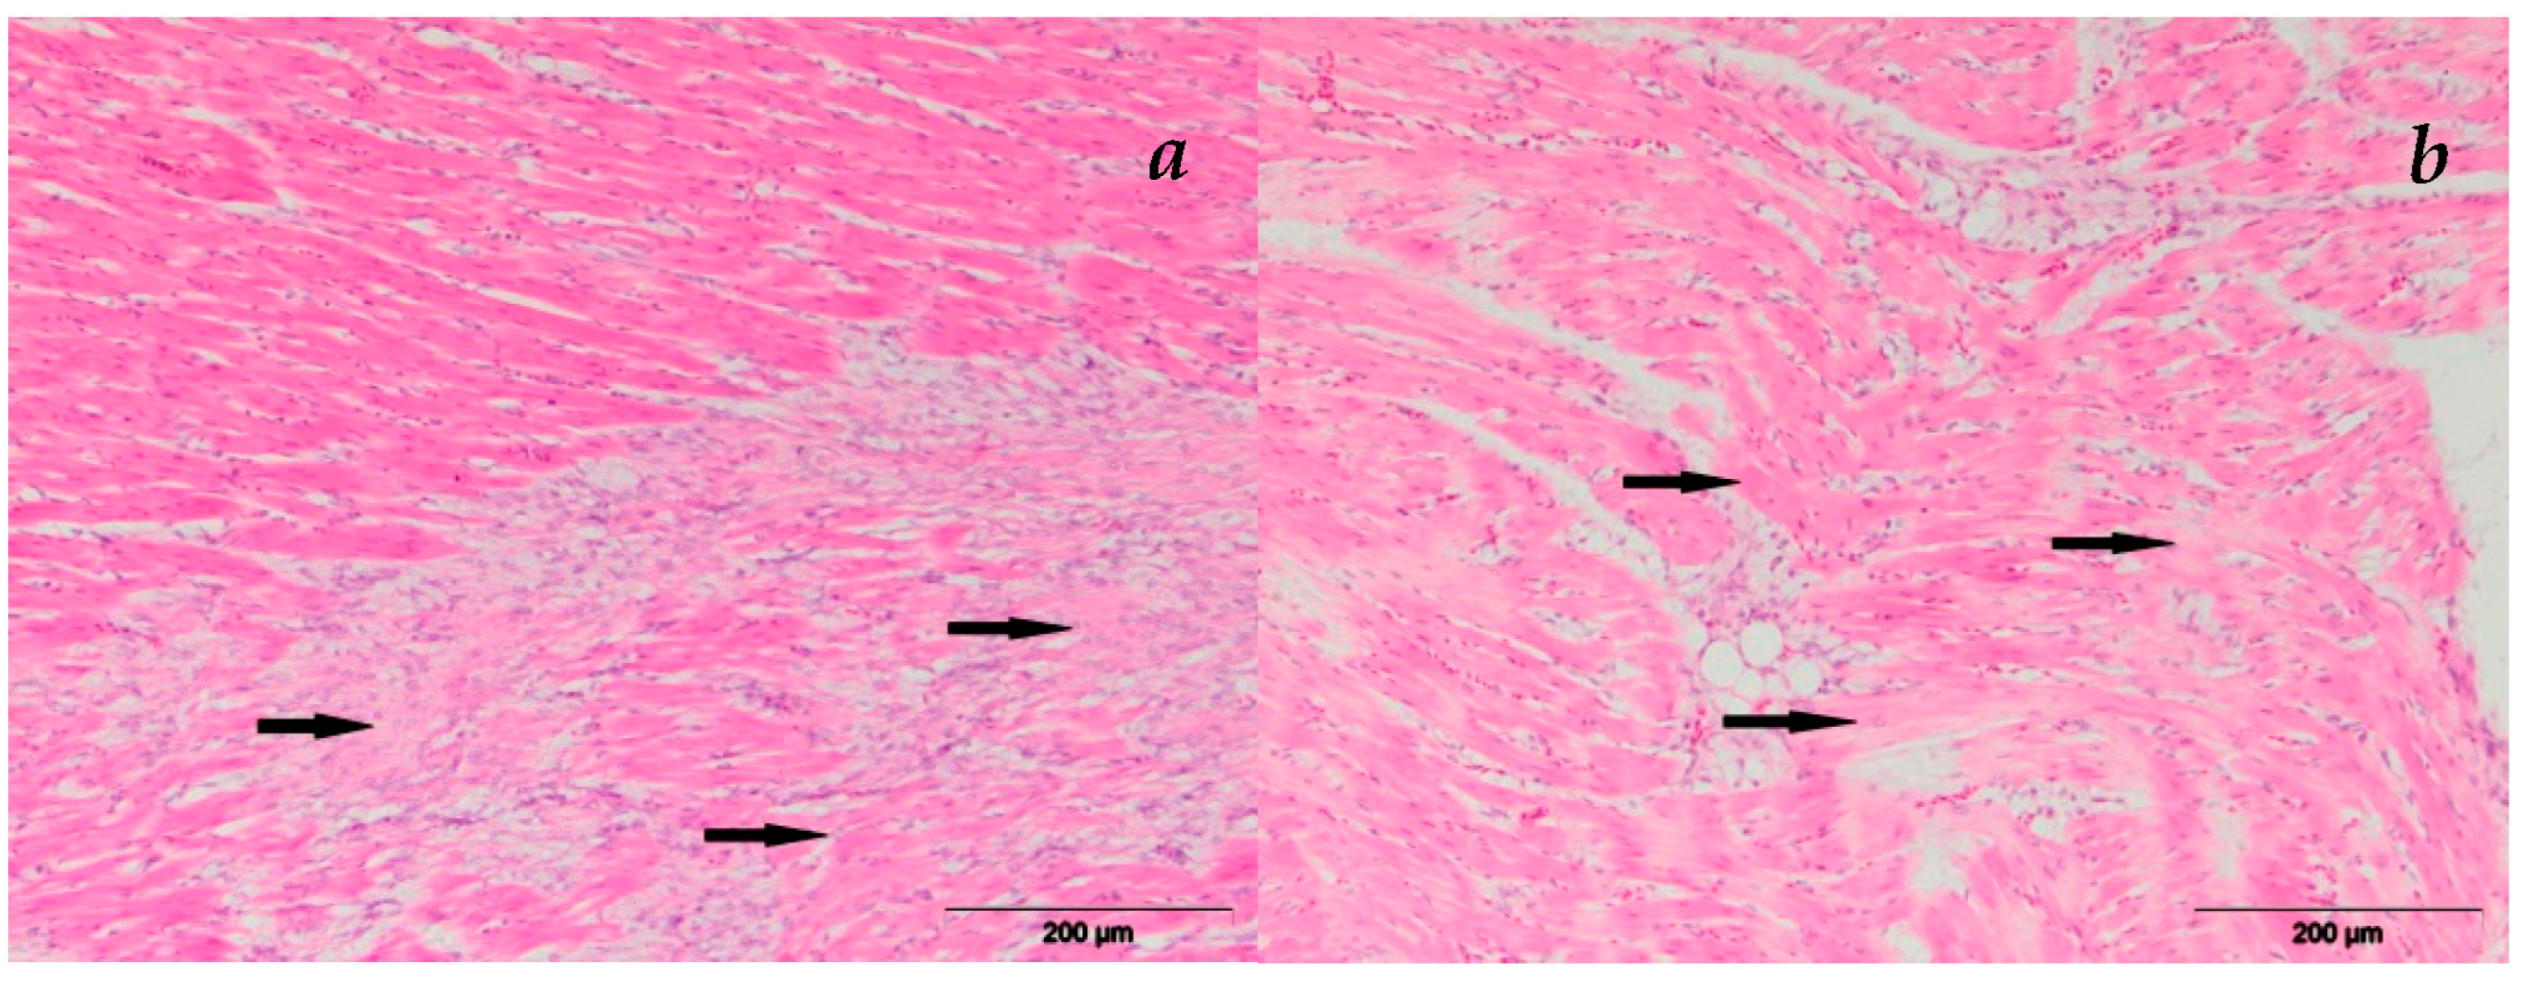
3.2.3. Heart
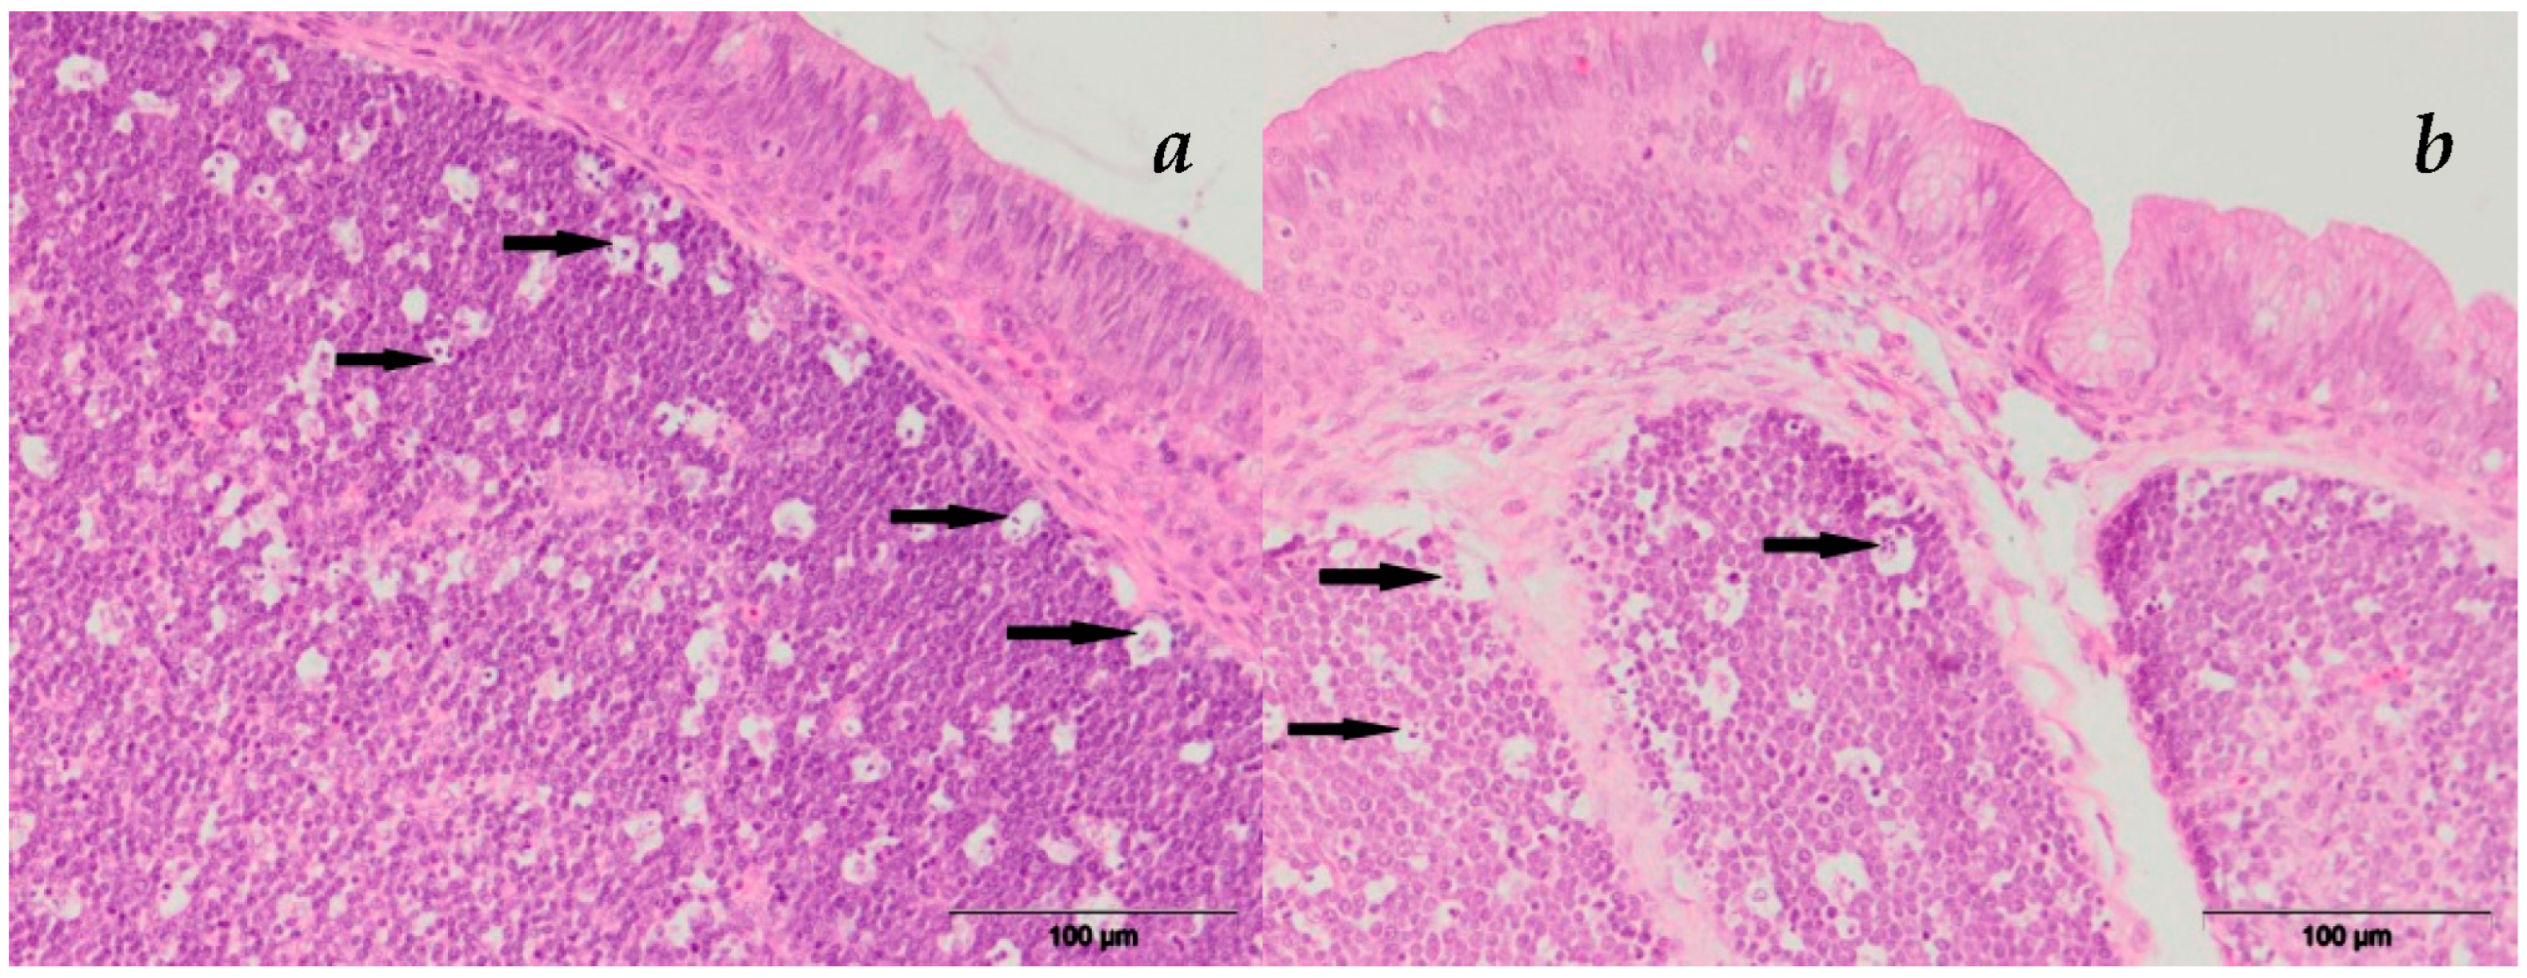
3.2.4. Bursa Fabricii
3.3. Residual Levels of AFB1/T-2 Toxin and Their Metabolites in Broilers’ Tissues
4. Discussion
4.1. The Effect of MR on Growth Parameters of Broiler Chicken
4.2. The Effect of MR on Pathohistological (PH) Alterations in Target Organs
4.3. Residual Levels of AFB1 and T-2 Toxin and Their Metabolites in Broilers’ Tissues
5. Conclusions
Author Contributions
Funding
Institutional Review Board Statement
Data Availability Statement
Conflicts of Interest
References
- Magnoli, A.P.; Poloni, V.L.; Cavaglieri, L. Impact of mycotoxin contamination in the animal feed industry. Curr. Opin. Food Sci. 2019, 29, 99–108. [Google Scholar] [CrossRef]
- Tola, M.; Kebede, B. Occurrence, importance and control of mycotoxins: A review. Cogent Food Agric. 2016, 2, 1191103. [Google Scholar] [CrossRef]
- Marin, S.; Ramos, A.J.; Cano-Sancho, G.; Sanchis, V. Mycotoxins: Occurrence, toxicology, and exposure assessment. Food Chem. Toxicol. 2013, 60, 218–237. [Google Scholar] [CrossRef]
- Mousavi, K.A.; Fakhri, Y.; Gahruie, H.H.; Niakousari, M.; Sant’Ana, A.S.; Anderson, S. Mycotoxins in cereal-based products during 24 years (1983–2017): A global systematic review. Trends Food Sci. Technol. 2019, 91, 95–105. [Google Scholar] [CrossRef]
- Guo, H.; Ji, J.; Wang, J.-S.; Sun, X. Co-contamination and interaction of fungal toxins and other environmental toxins. Trends Food Sci. Technol. 2020, 103, 162–178. [Google Scholar] [CrossRef]
- Grenier, B.; Oswald, I. Mycotoxin co-contamination of food and feed: Meta-analysis of publications describing toxicological interactions. World Mycotoxin J. 2011, 4, 285–313. [Google Scholar] [CrossRef]
- Streit, E.; Naehrer, K.; Rodrigues, I.; Schatzmayr, G. Mycotoxin occurrence in feed and feed raw materials worldwide: Long-term analysis with special focus on Europe and Asia. J. Sci. Food. Agric. 2013, 93, 2892–2899. [Google Scholar] [CrossRef]
- Kolawole, O.; Graham, A.; Donaldson, C.; Owens, B.; Abia, W.A.; Meneely, J.; Alcorn, M.J.; Connolly, L.; Elliott, C.T. Low Doses of Mycotoxin Mixtures below EU Regulatory Limits Can Negatively Affect the Performance of Broiler Chickens: A Longitudinal Study. Toxins 2020, 12, 433. [Google Scholar] [CrossRef]
- Streit, E.; Schatzmayr, G.; Tassis, P.; Tzika, E.; Marin, D.; Taranu, I.; Tabuc, C.; Nicolau, A.; Aprodu, I.; Puel, O.; et al. Current situation of mycotoxin contamination and co-occurrence in animal feed-focus on Europe. Toxins 2012, 4, 788–809. [Google Scholar] [CrossRef] [Green Version]
- Raffa, N.; Keller, N.P. A call to arms: Mustering secondary metabolites for success and survival of an opportunistic pathogen. PLoS Pathog. 2019, 15, e1007606. [Google Scholar] [CrossRef]
- Smith, M.C.; Madec, S.; Coton, E.; Hymery, N. Natural Co-Occurrence of Mycotoxins in Foods and Feeds and Their in vitro Combined Toxicological Effects. Toxins 2016, 8, 94. [Google Scholar] [CrossRef]
- De Ruyck, K.; De Boevre, M.; Huybrechts, I.; De Saeger, S. Dietary mycotoxins, co-exposure, and carcinogenesis in humans: Short review. Mutat. Res. Rev. Mutat. Res. 2015, 766, 32–41. [Google Scholar] [CrossRef] [PubMed] [Green Version]
- Zhou, X.; Gan, F.; Hou, L.; Liu, Z.; Su, J.; Lin, Z.; Le, G.; Huang, K. Aflatoxin B1 Induces Immunotoxicity through the DNA Methyltransferase-Mediated JAK2/STAT3 Pathway in 3D4/21 Cells. J. Agric. Food Chem. 2019, 67, 3772–3780. [Google Scholar] [CrossRef]
- International Agency for Research on Cancer. A Review of Human Carcinogens; International Agency for Research on Cancer: Lyon, France, 2012; Volume 100 F. [Google Scholar]
- Nazarizadeh, H.; Pourreza, J. Evaluation of three mycotoxin binders to prevent the adverse effects of aflatoxin B1 in growing broilers. J. Appl. Anim. Res. 2019, 47, 135–139. [Google Scholar] [CrossRef] [Green Version]
- Sineque, A.R.; Macuamule, C.L.; Dos Anjos, F.R. Aflatoxin B1 Contamination in Chicken Livers and Gizzards from Industrial and Small Abattoirs, Measured by ELISA Technique in Maputo, Mozambique. Int. J. Environ. Res. Public Health 2017, 14, 951. [Google Scholar] [CrossRef] [PubMed] [Green Version]
- Polak-Sliwinska, M.; Paszczyk, B. Trichothecenes in Food and Feed, Relevance to Human and Animal Health and Methods of Detection: A Systematic Review. Molecules 2021, 26, 454. [Google Scholar] [CrossRef] [PubMed]
- Murugesan, G.R.; Ledoux, D.R.; Naehrer, K.; Berthiller, F.; Applegate, T.J.; Grenier, B.; Phillips, T.D.; Schatzmayr, G. Prevalence and effects of mycotoxins on poultry health and performance, and recent development in mycotoxin counteracting strategies. Poult. Sci. 2015, 94, 1298–1315. [Google Scholar] [CrossRef]
- Awad, W.; Ghareeb, K.; Bohm, J.; Zentek, J. The toxicological impacts of the Fusarium mycotoxin, deoxynivalenol, in poultry flocks with special reference to immunotoxicity. Toxins 2013, 5, 912–925. [Google Scholar] [CrossRef] [Green Version]
- Liew, W.P.; Mohd-Redzwan, S. Mycotoxin: Its Impact on Gut Health and Microbiota. Front. Cell. Infect. Microbiol. 2018, 8, 60. [Google Scholar] [CrossRef] [Green Version]
- Osselaere, A.; Santos, R.; Hautekiet, V.; De Backer, P.; Chiers, K.; Ducatelle, R.; Croubels, S. Deoxynivalenol impairs hepatic and intestinal gene expression of selected oxidative stress, tight junction and inflammation proteins in broiler chickens, but addition of an adsorbing agent shifts the effects to the distal parts of the small intestine. PLoS ONE 2013, 8, e69014. [Google Scholar] [CrossRef] [Green Version]
- Wade, M.R.; Sapcota, D.; Verma, U. Ameliorating aflatoxicosis in commercial broiler chickens by dietary Mycosorb: Heamato-Biochemical studies. Indian J. Anim. Res. 2018, 52, 46–50. [Google Scholar] [CrossRef] [Green Version]
- Gruber-Dorninger, C.; Jenkins, T.; Schatzmayr, G. Global Mycotoxin Occurrence in Feed: A Ten-Year Survey. Toxins 2019, 11, 375. [Google Scholar] [CrossRef] [PubMed] [Green Version]
- Lee, H.J.; Ryu, D. Worldwide Occurrence of Mycotoxins in Cereals and Cereal-Derived Food Products: Public Health Perspectives of Their Co-occurrence. J. Agric. Food Chem. 2017, 65, 7034–7051. [Google Scholar] [CrossRef] [PubMed]
- Santos Pereira, C.; C. Cunha, S.; Fernandes, J.O. Prevalent Mycotoxins in Animal Feed: Occurrence and Analytical Methods. Toxins 2019, 11, 290. [Google Scholar] [CrossRef] [PubMed] [Green Version]
- Vila-Donat, P.; Marin, S.; Sanchis, V.; Ramos, A.J. A review of the mycotoxin adsorbing agents, with an emphasis on their multi-binding capacity, for animal feed decontamination. Food Chem. Toxicol. 2018, 114, 246–259. [Google Scholar] [CrossRef] [Green Version]
- Engler, K.H.; Coker, R.D.; Evans, I.H. Uptake of aflatoxin B1 and T-2 toxin by two mycotoxin bioassay microorganisms: Kluyveromyces marxianus and Bacillus megaterium. Arch. Microbiol. 2000, 174, 381–385. [Google Scholar] [CrossRef]
- González Pereyra, M.L.; Martínez, M.P.; Cavaglieri, L.R. Presence of aiiA homologue genes encoding for N-Acyl homoserine lactone-degrading enzyme in aflatoxin B1-decontaminating Bacillus strains with potential use as feed additives. Food Chem. Toxicol. 2019, 124, 316–323. [Google Scholar] [CrossRef]
- Vasiljević, M.; Marinković, D.; Milicević, D.; Pleadin, J.; Stefanović, S.; Trailović, S.; Raj, J.; Petrujkić, B.; Trailović, J.N. Efficacy of a Modified Clinoptilolite Based Adsorbent in Reducing Detrimental Effects of Ochratoxin A in Laying Hens. Toxins 2021, 13, 469. [Google Scholar] [CrossRef] [PubMed]
- Raj, J.; Vasiljevic, M.; Tassis, P.; Farkas, H.; Bosnjak-Neumuller, J.; Manner, K. Effects of a modified clinoptilolite zeolite on growth performance, health status and detoxification of aflatoxin B1 and ochratoxin A in male broiler chickens. Br. Poult. Sci. 2021, 62, 601–610. [Google Scholar] [CrossRef]
- Wei, J.T.; Wu, K.T.; Sun, H.; Khalil, M.M.; Dai, J.F.; Liu, Y.; Liu, Q.; Zhang, N.Y.; Qi, D.S.; Sun, L.H. A Novel Modified Hydrated Sodium Calcium Aluminosilicate (HSCAS) Adsorbent Can Effectively Reduce T-2 Toxin-Induced Toxicity in Growth Performance, Nutrient Digestibility, Serum Biochemistry, and Small Intestinal Morphology in Chicks. Toxins 2019, 11, 199. [Google Scholar] [CrossRef] [Green Version]
- Cobb500 Broiler Performance & Nutrition Supplement (2022). Available online: https://www.cobb-vantress.com/assets/Cobb-Files/product-guides/5502e86566/2022-Cobb500-Broiler-Performance-Nutrition-Supplement.pdf (accessed on 15 November 2022).
- Scheuer, P.J.; Chalk, B.T. Clinical Tests, Histopathology; Wolfe Medical Publications: London, UK, 1986. [Google Scholar]
- Leeman, W.R.; Van Den Berg, K.J.; Houben, G.F. Transfer of chemicals from feed to animal products: The use of transfer factors in risk assessment. Food Addit. Contam. 2007, 24, 1–13. [Google Scholar] [CrossRef] [PubMed] [Green Version]
- Rawal, S.; Kim, J.E.; Coulombe, R., Jr. Aflatoxin B1 in poultry: Toxicology, metabolism and prevention. Res. Vet. Sci. 2010, 89, 325–331. [Google Scholar] [CrossRef] [PubMed]
- Rajput, A.S.; Sun, L.; Zhang, N.; Mohamed Khalil, M.; Gao, X.; Ling, Z.; Zhu, L.; Khan, F.A.; Zhang, J.; Qi, D. Ameliorative Effects of Grape Seed Proanthocyanidin Extract on Growth Performance, Immune Function, Antioxidant Capacity, Biochemical Constituents, Liver Histopathology and Aflatoxin Residues in Broilers Exposed to Aflatoxin B1. Toxins 2017, 9, 371. [Google Scholar] [CrossRef] [Green Version]
- Magnoli, A.P.; Texeira, M.; Rosa, C.A.R.; Miazzo, R.D.; Cavaglieri, L.R.; Magnoli, C.E.; Dalcero, A.M.; Chiacchiera, S.M. Sodium bentonite and monensin under chronic aflatoxicosis in broiler chickens. Poult. Sci. 2011, 90, 352–357. [Google Scholar] [CrossRef]
- Sharghi, Y.; Manafi, M. The Additional Effects of Aflatoxin and T-2 Toxin Combination on Commercial Broilers: I: Effects on Performance Parameters and Internal Organs. Res. J. Fish. Hydrobiol. 2011, 6, 549–553. [Google Scholar]
- Girish, C.K.; Devegowda, G. Efficacy of Glucomannan-containing Yeast Product (Mycosorb짰) and Hydrated Sodium Calcium Aluminosilicate in Preventing the Individual and Combined Toxicity of Aflatoxin and T-2 Toxin in Commercial Broilers. Asian-Australas. J. Anim. Sci. 2006, 19, 877–883. [Google Scholar] [CrossRef]
- Yang, S.; Li, Y.; Cao, X.; Hu, D.; Wang, Z.; Wang, Y.; Shen, J.; Zhang, S. Metabolic pathways of T-2 toxin in in vivo and in vitro systems of Wistar rats. J. Agric. Food Chem. 2013, 61, 9734–9743. [Google Scholar] [CrossRef]
- Guerre, P. Fusariotoxins in Avian Species: Toxicokinetics, Metabolism and Persistence in Tissues. Toxins 2015, 7, 2289–2305. [Google Scholar] [CrossRef] [Green Version]
- Iqbal, S.Z.; Nisar, S.; Asi, M.R.; Jinap, S. Natural incidence of aflatoxins, ochratoxin A and zearalenone in chicken meat and eggs. Food Control 2014, 43, 98–103. [Google Scholar] [CrossRef]
- Sun, Y.X.; Yao, X.; Shi, S.N.; Zhang, G.J.; Xu, L.X.; Liu, Y.J.; Fang, B.H. Toxicokinetics of T-2 toxin and its major metabolites in broiler chickens after intravenous and oral administration. J. Vet. Pharmacol. Ther. 2015, 38, 80–85. [Google Scholar] [CrossRef]
- Herzallah, S. Aflatoxin B1 residues in eggs and flesh of laying hens fed aflatoxin B1 contaminated diet. Am. J. Agric. Biol. Sci. 2013, 8, 156–161. [Google Scholar] [CrossRef] [Green Version]
- Herzallah, S.; Al-ameiri, N.l.; Al dmoor, H.; Masoud, S.; Shawabkeh, K. Meat and organs quality of broiler chickens fed diet contaminated with B1 aflatoxin. Glob. Vet. 2014, 12, 376–380. [Google Scholar] [CrossRef]
- Hussain, Z.; Rehman, H.U.; Manzoor, S.; Tahir, S.; Mukhtar, M. Determination of liver and muscle aflatoxin B1 residues and select serum chemistry variables during chronic aflatoxicosis in broiler chickens. Vet. Clin. Pathol. 2016, 45, 330–334. [Google Scholar] [CrossRef] [PubMed]
- FAO. Worldwide Regulations for Mycotoxins in Food and Feed in 2003; Food and Agriculture Organization of the United Nations: Rome, Italy, 2004. [Google Scholar]
- Zaghini, A.; Martelli, G.; Roncada, P.; Simioli, M.; Rizzi, L. Mannanoligosaccharides and aflatoxin B1 in feed for laying hens: Effects on egg quality, aflatoxins B1 and M1 residues in eggs, and aflatoxin B1 levels in liver. Poult. Sci. 2005, 84, 825–832. [Google Scholar] [CrossRef] [PubMed]
- Hussain, Z.; Khan, M.Z.; Khan, A.; Javed, I.; Saleemi, M.K.; Mahmood, S.; Asi, M.R. Residues of aflatoxin B1 in broiler meat: Effect of age and dietary aflatoxin B1 levels. Food Chem. Toxicol. 2010, 48, 3304–3307. [Google Scholar] [CrossRef]
- Yang, L.; Zhao, Z.; Wu, A.; Deng, Y.; Zhou, Z.; Zhang, J.; Hou, J. Determination of trichothecenes A (T-2 toxin, HT-2 toxin, and diacetoxyscirpenol) in the tissues of broilers using liquid chromatography coupled to tandem mass spectrometry. J. Chromatogr. B 2013, 942–943, 88–97. [Google Scholar] [CrossRef]
- Karović, D.; Djermanović, V.; Mitrović, S.; Radović, V.; Okanović, D.; Filipovic, S.; Djekić, V. The effect of mineral adsorbents in poultry production. World’s Poult. Sci. J. 2013, 69, 335–342. [Google Scholar] [CrossRef]


| Time [Min] | Mobile Phase A [%] | Mobile Phase B [%] | Flow [mL/Min] |
|---|---|---|---|
| 0.00 | 88 | 12 | 0.2 |
| 5.00 | 88 | 12 | 0.2 |
| 5.01 | 50 | 50 | 0.2 |
| 16.00 | 0 | 100 | 0.2 |
| 17.00 | 0 | 100 | 0.2 |
| 17.01 | 88 | 12 | 0.2 |
| Day 1 | Day 7 | Day 14 | Day 21 | Day 28 | Day 35 | Day 42 | |
|---|---|---|---|---|---|---|---|
| E-I | 52.92 ± 0.73 | 130.8 ± 1.87 A | 339.5 ± 2.47 A | 627.8 ± 2.93 A | 935.8 ± 3.08 A | 1326.0 ± 7.52 A | 1826.0 ± 12.64 A |
| E-II | 51.58 ± 0.78 | 172.2 ± 2.7 B | 387.8 ± 2.21 A,B | 690.8 ± 2.61 A,B | 1032.0 ± 7.20 A,B | 1472.0 ± 2.81 A,B | 2055.0 ± 10.26 A,B |
| E-III | 51.83 ± 0.86 | 130.7 ± 1.75 A,C | 339.9 ± 2.69 A,C | 626.6 ± 3.77 A,C | 940.1 ± 3.51 A,C | 1326.0 ± 8.96 A,C | 1828.0 ± 13.31 A,C |
| E-IV | 51.58 ± 0.67 | 167.8 ± 2.15 B,D | 386.7 ± 2.23 A,B,D | 688.5 ± 2.71 A,B,D | 1034.0 ± 8.88 A,B,D | 1472.0 ± 3.57 A,B,D | 2054.0 ± 7.98 A,B,D |
| E-V | 51.58 ± 0.78 | 121.7 ± 2.0 A,C,E | 316.9 ± 1.61 A,B,C,D,E | 589.8 ± 4.35 A,B,C,D,E | 834.2 ± 3.63 A,B,C,D,E | 1215.0 ± 3.95 A,B,C,D,E | 1692.0 ± 1.91 A,B,C,D,E |
| E-VI | 51.50 ± 0.87 | 128.0 ± 1.85 A,C,E | 325.7 ± 3.68 A,b,C,d,E,F | 602.3 ± 2.86 A,B,C,D,E | 869.3 ± 3.34 A,B,C,D,E,F | 1255.0 ± 4.70 A,B,C,D,E,F | 1742.0 ± 4.91 A,B,C,D,E,f |
| C | 51.33 ± 0.89 | 173.9 ± 2.37 | 431.3 ± 2.46 | 791.2 ± 3.24 | 1235.0 ± 3.59 | 1808.0 ± 8.80 | 2336.0 ± 7.35 |
| MR | 51.33 ± 0.68 | 182.6 ± 2.58 B,C,D,E,F,G | 458.4 ± 2.72 A,B,C,D,E,F,G | 831.4 ± 2.50 A,B,C,D,E,F,G | 1304.0 ± 2.68 A,B,C,D,E,F,G | 1898.0 ± 3.03 A,B,C,D,E,F,G | 2542.0 ± 9.36 A,B,C,D,E,F,G |
| Day 1–7 | Day 7–14 | Day 14–21 | Day 21–28 | Day 28–35 | Day 35–42 | Day 1–42 | |
|---|---|---|---|---|---|---|---|
| E-I | 6.48 ± 0.17 A | 17.40 ± 0.11 A | 24.02 ± 0.24 A | 25.45 ± 0.33 A | 32.52 ± 0.61 A | 41.69 ± 1.26 A | 147.83 ± 1.06 |
| E-II | 10.05 ± 0.28 B | 17.96 ± 0.23 A | 25.25 ± 0.19 A | 28.42 ± 0.54 A,bb | 36.65 ± 0.61 A,B | 48.59 ± 0.91 aa,B | 154.15 ± 0.86 |
| E-III | 6.56 ± 0.15 A,C | 17.44 ± 0.25 A,d | 23.89 ± 0.40 A | 26.12 ± 0.52 A,c, | 32.15 ± 0.86 A,C | 41.8 ± 1.12 A,C | 148.0 ± 1.02 |
| E-IV | 9.68 ± 0.21 B,D | 18.24 ± 0.21 A | 25.15 ± 0.34 A | 28.75 ± 0.77 A,B,D | 36.53 ± 0.85 A,bb,D | 44.75 ± 0.77 aa,B,D | 166.83 ± 0.68 |
| E-V | 5.91 ± 0.25 A,C,E | 16.19 ± 0.25 A,C,E | 22.73 ± 0.39 A,C,E | 18.8 ± 0.46 A,B,C,D,E | 31.75 ± 0.46 A,C,E | 39.73 ± 0.28 A,C,E | 126.15 ± 0.14 |
| E-VI | 6.37 ± 0.13 A,C,E | 16.47 ± 0.36 A,cc,E | 23.05 ± 0.43 A,C,ee | 22.25 ± 0.34 A,B,C,D,E | 32.16 ± 0.39 A,C,E | 40.51 ± 0.70 A,C,E | 140.83 ± 0.39 |
| C | 10.21 ± 0.19 | 21.45 ± 0.33 | 29.98 ± 0.29 | 36.98 ± 0.39 | 47.73 ± 0.81 | 44.05 ± 1.03 | 189.08 ± 0.60 |
| MR | 10.94 ± 0.23 B,C, D,ee,F,G | 22.98 ± 0.35 B,C,D,E,F,G | 31.08 ± 0.32 B,C,D,E,F,G | 39.35 ± 0.31 a,B,C,D,E,F,G | 49.55 ± 0.39 B,C,D,E,F,G | 53.61 ± 0.70 A,B,D,F,G | 205.75 ± 0.80 |
| Day 1–7 | Day 7–14 | Day 14–21 | Day 21–28 | Day 28–35 | Day 35–42 | |
|---|---|---|---|---|---|---|
| E-I | 45.23 | 69.59 | 81.88 | 103.88 | 133.72 | 122.27 |
| E-II | 47.58 | 70.07 | 82.28 | 117.76 | 151.58 | 131.71 |
| E-III | 47.64 | 63.53 | 76.48 | 101.85 | 139.83 | 128.76 |
| E-IV | 46.57 | 71.52 | 81.84 | 119.96 | 149.39 | 131.35 |
| E-V | 44.27 | 52.58 | 69.97 | 95.16 | 119.17 | 110.95 |
| E-VI | 45.42 | 57.79 | 71.61 | 95.33 | 120.94 | 115.88 |
| C | 47.82 | 73.67 | 86.32 | 110.92 | 141.83 | 126.97 |
| MR | 50.44 | 74.15 | 87.08 | 112.02 | 153.72 | 127.39 |
| FCR Day 1–21 | FCR Day 21–42 | FCR Day 1–42 | |
|---|---|---|---|
| E-I | 2.4 | 2.1 | 2.2 |
| E-II | 2.2 | 2.0 | 2.1 |
| E-III | 2.3 | 2.1 | 2.2 |
| E-IV | 2.2 | 2.0 | 2.1 |
| E-V | 2.2 | 2.0 | 2.1 |
| E-VI | 2.2 | 2.0 | 2.1 |
| C | 1.9 | 1.7 | 1.8 |
| MR | 1.9 | 1.6 | 1.7 |
| Group | BW | BWG | Correlation (r) |
|---|---|---|---|
| E-I | 1826.0 | 147.83 | 0.857 * |
| E-II | 2055 | 154.15 | 0.879 * |
| E-III | 1828 | 148 | 0.857 * |
| E-IV | 2054 | 166.83 | 0.858 * |
| E-V | 1692 | 126.15 | 0.876 * |
| E-VI | 1742 | 140.83 | 0.865 * |
| C | 2336 | 189.08 | 0.817 * |
| MR | 2542 | 205.75 | 0.845 * |
| PH Change | E-I | E-II | E-III | E-IV | E-V | E-VI |
|---|---|---|---|---|---|---|
| Hyperemia | 6/12 | 2/12 | 11/12 | 5/12 | 6/11 | 2/12 |
| Hemorrhage | 7/12 | 2/12 | 3/12 | 2/12 | 5/11 | 1/12 |
| Mucosal destruction and intestinal villi atrophy | 12/12 | 9/12 | 8/12 | 4/12 | 9/11 | 3/12 |
| Proliferation of goblet cells | 10/12 | 4/12 | 3/12 | 0/12 | 6/11 | 4/12 |
| Karyopicnosis of Lieberkühn crypts | 8/12 | 0/12 | 8/12 | 2/12 | 8/11 | 1/12 |
| Organ | PH Change | E-I | E-II | E-III | E-IV | E-V | E-VI | |
|---|---|---|---|---|---|---|---|---|
| Liver | Hepatocytes | Cloudy swelling | 5/12 | 2/12 | 10/12 | 6/12 | 7/11 | 5/12 |
| Vacuolar degeneration | 9/12 | 6/12 | 5/12 | 4/12 | 7/11 | 1/12 | ||
| Hydrops degeneration | 8/12 | 1/12 | 6/12 | 1/12 | 0/12 | 0/12 | ||
| Necrosis | 3/12 | 2/12 | 7/12 | 4/12 | 2/11 | 2/12 | ||
| Bile ducts | Hyperplasia of bile ductules | 6/12 | 4/12 | 6/12 | 2/12 | 7/11 | 4/12 | |
| Desquamation of bile duct epithelium | 8/12 | 7/12 | 7/12 | 4/12 | 9/11 | 5/12 | ||
| Pericholangitis | 3/12 | 3/12 | 2/12 | 6/12 | 6/11 | 4/12 | ||
| Interstitium | Periportal fibrosis | 3/12 | 1/12 | 1/12 | 0/12 | 2/12 | 0/12 |
| Organ | PH Change | E-I | E-II | E-III | E-IV | E-V | E-VI | |
|---|---|---|---|---|---|---|---|---|
| Heart | Myocardial cells | Degeneration | 11/12 | 6/12 | 9/12 | 8/12 | 10/11 | 9/12 |
| Interstitium | Mononuclear cell infiltration | 4/12 | 3/12 | 9/12 | 3/12 | 5/11 | 2/12 | |
| Hemorrhage | 6/12 | 6/12 | 8/12 | 6/12 | 4/11 | 3/12 | ||
| Bursa Fabricii | Lymphoid follicles | Necrosis | 7/12 | 1/12 | 12/12 | 7/12 | 2/11 | 2/12 |
| Apoptosis | 9/12 | 5/12 | 6/12 | 6/12 | 11/11 | 5/12 |
| Tissue | E-I Group | E-II Group | E-V Group | E-VI Group |
|---|---|---|---|---|
| Liver | 0.235 ± 0.07 aa | 0.12 ± 0.02 bb | <LOD | <LOD |
| Muscle | <LOD | <LOD | <LOD | <LOD |
Disclaimer/Publisher’s Note: The statements, opinions and data contained in all publications are solely those of the individual author(s) and contributor(s) and not of MDPI and/or the editor(s). MDPI and/or the editor(s) disclaim responsibility for any injury to people or property resulting from any ideas, methods, instructions or products referred to in the content. |
© 2023 by the authors. Licensee MDPI, Basel, Switzerland. This article is an open access article distributed under the terms and conditions of the Creative Commons Attribution (CC BY) license (https://creativecommons.org/licenses/by/4.0/).
Share and Cite
Stefanović, D.; Marinković, D.; Trailović, S.; Vasiljević, M.; Farkaš, H.; Raj, J.; Tolimir, N.; Radulović, S.; Nešić, V.; Trailović, J.N.; et al. Evaluation of Effectiveness of a Novel Multicomponent Mycotoxins Detoxification Agent in the Presence of AFB1 and T-2 Toxin on Broiler Chicks. Microorganisms 2023, 11, 574. https://doi.org/10.3390/microorganisms11030574
Stefanović D, Marinković D, Trailović S, Vasiljević M, Farkaš H, Raj J, Tolimir N, Radulović S, Nešić V, Trailović JN, et al. Evaluation of Effectiveness of a Novel Multicomponent Mycotoxins Detoxification Agent in the Presence of AFB1 and T-2 Toxin on Broiler Chicks. Microorganisms. 2023; 11(3):574. https://doi.org/10.3390/microorganisms11030574
Chicago/Turabian StyleStefanović, Darko, Darko Marinković, Saša Trailović, Marko Vasiljević, Hunor Farkaš, Jog Raj, Nataša Tolimir, Stamen Radulović, Vladimir Nešić, Jelena Nedeljković Trailović, and et al. 2023. "Evaluation of Effectiveness of a Novel Multicomponent Mycotoxins Detoxification Agent in the Presence of AFB1 and T-2 Toxin on Broiler Chicks" Microorganisms 11, no. 3: 574. https://doi.org/10.3390/microorganisms11030574