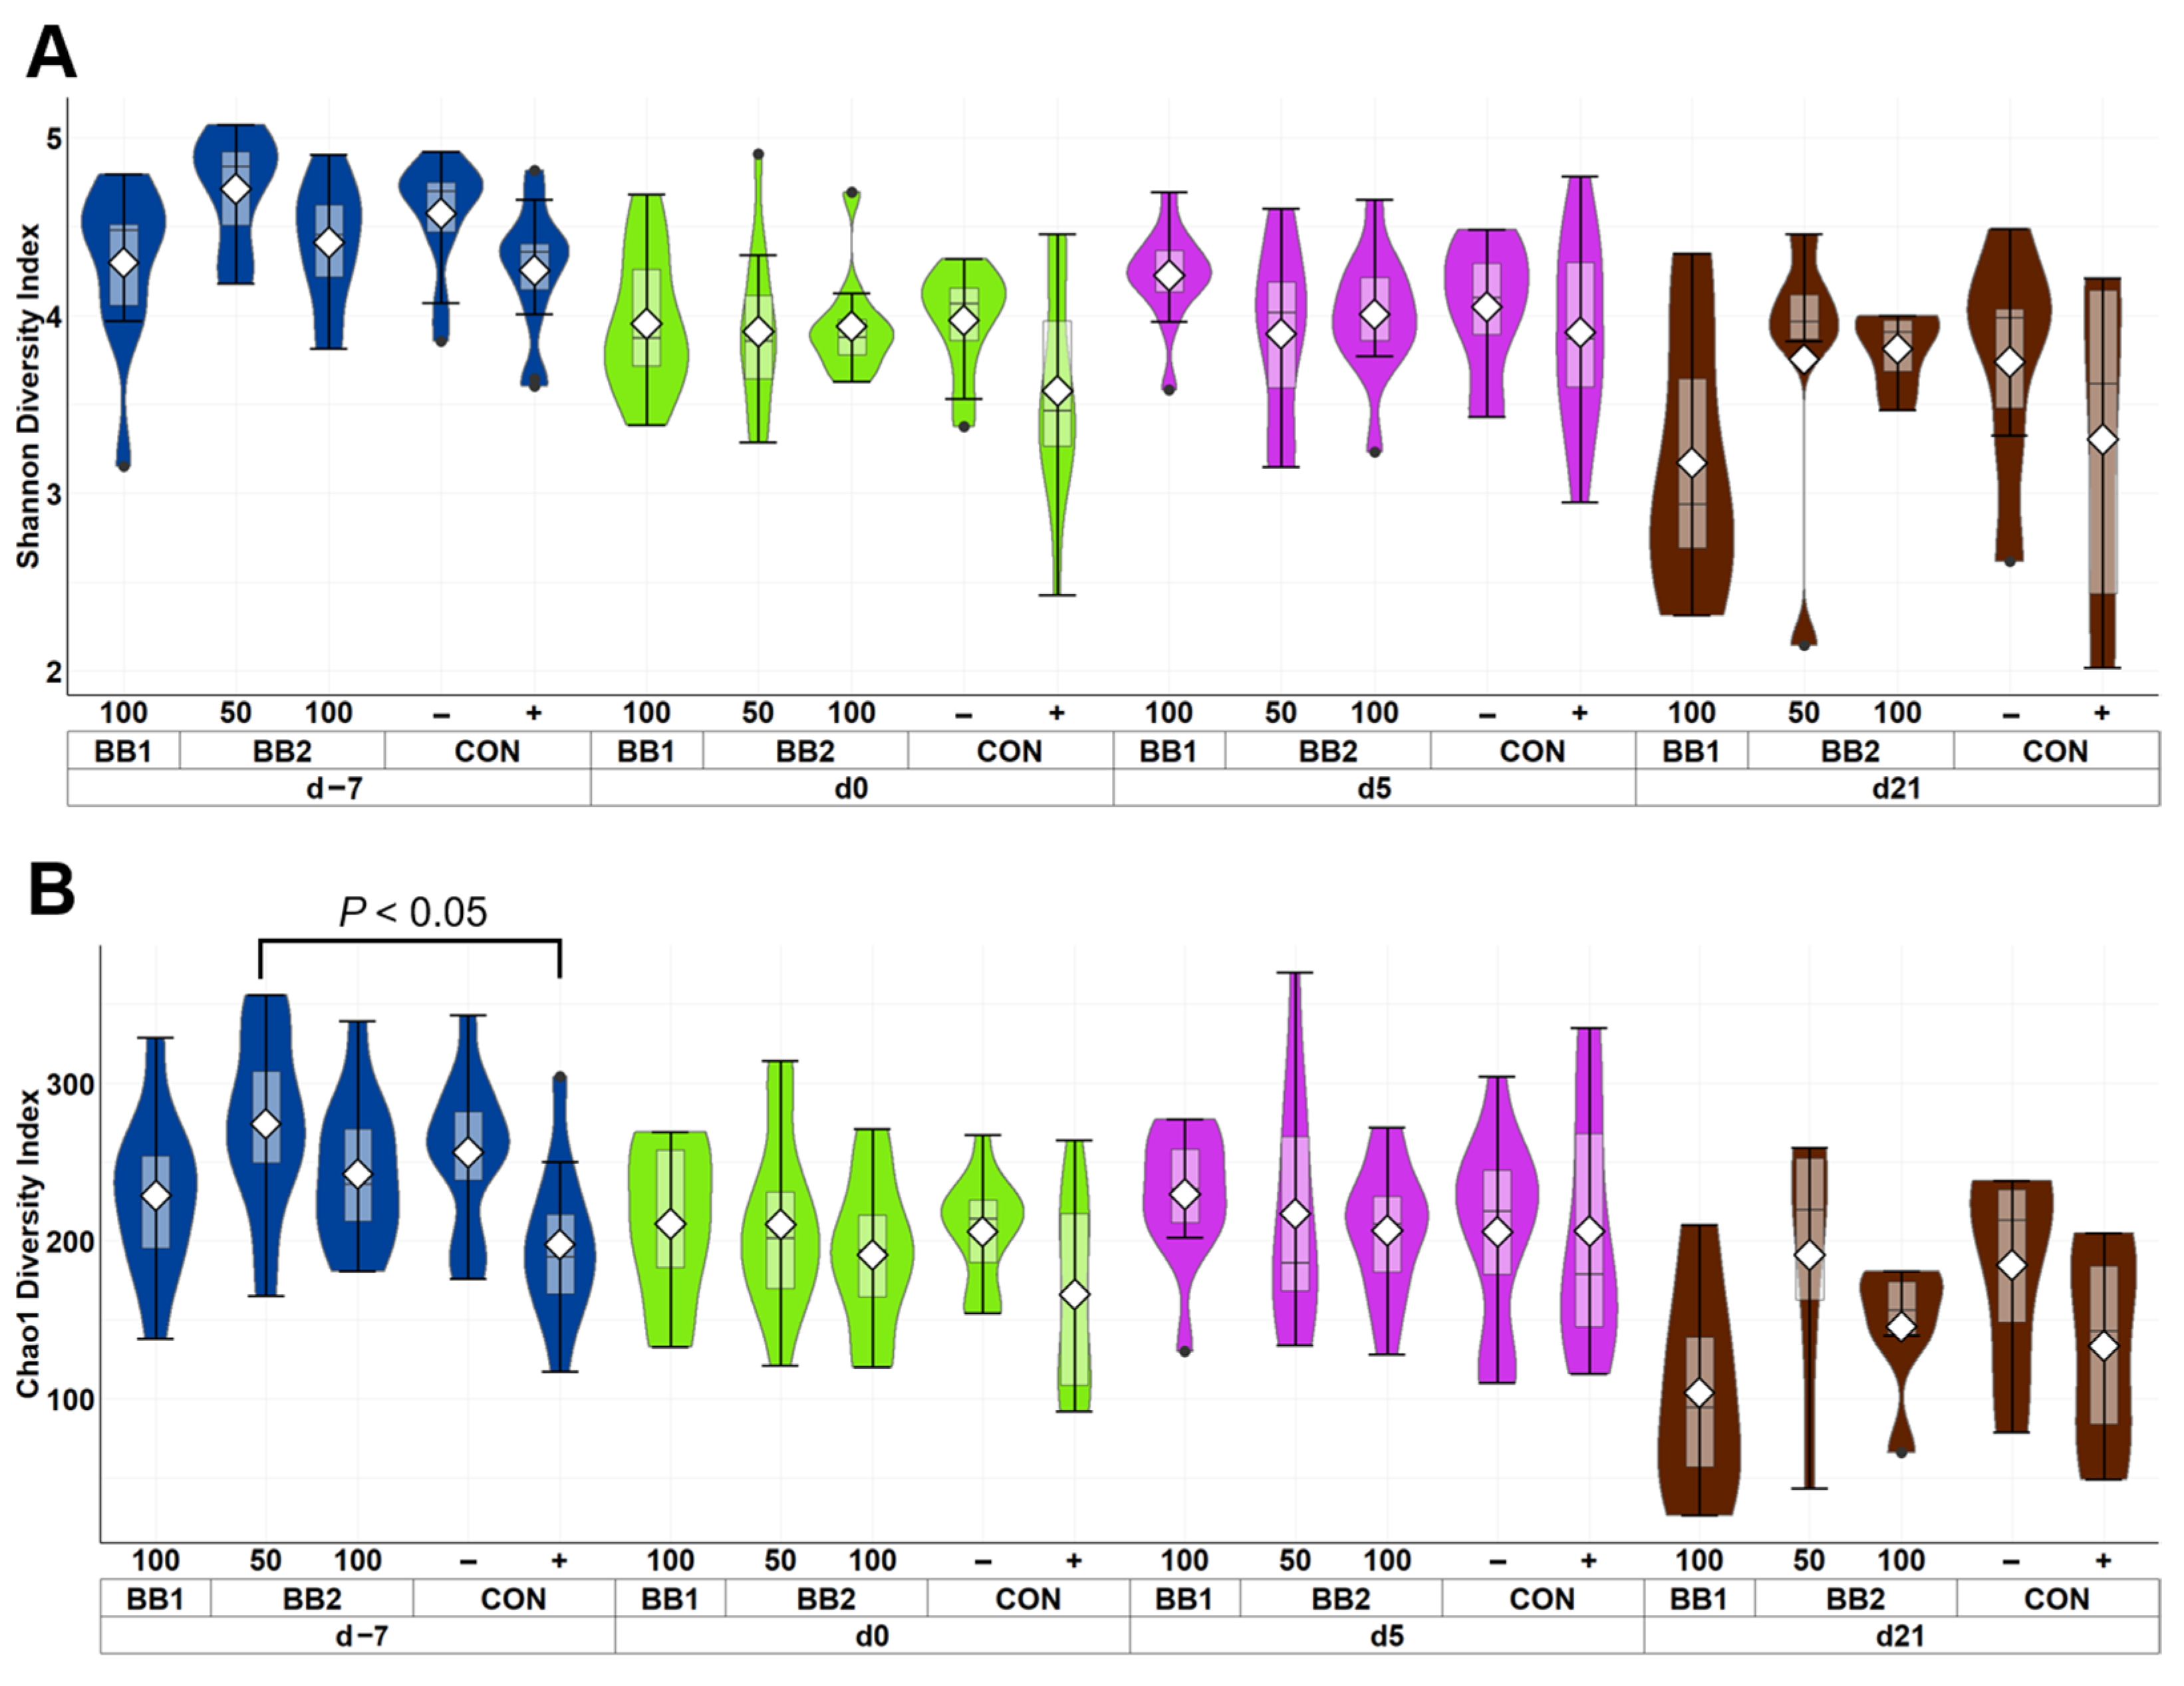
Figure 1.
Alpha diversity as indicated by Shannon (A) and Chao1 (B) indices in feces of weaned pigs fed with control diet (CON), 100 ppm of botanical blend 1 (BB1), or 50 ppm or 100 ppm botanical blend 2 (BB2) at the beginning of the experiment (d −7), first day of F18 ETEC inoculation (d 0), and d 7, 14, and 21 post-inoculation. No difference was observed in Shannon (A) index among treatments. Violin plots are colored by day. Data are expressed as mean (diamond) ± SEM. Each treatment had 11–12 observations.
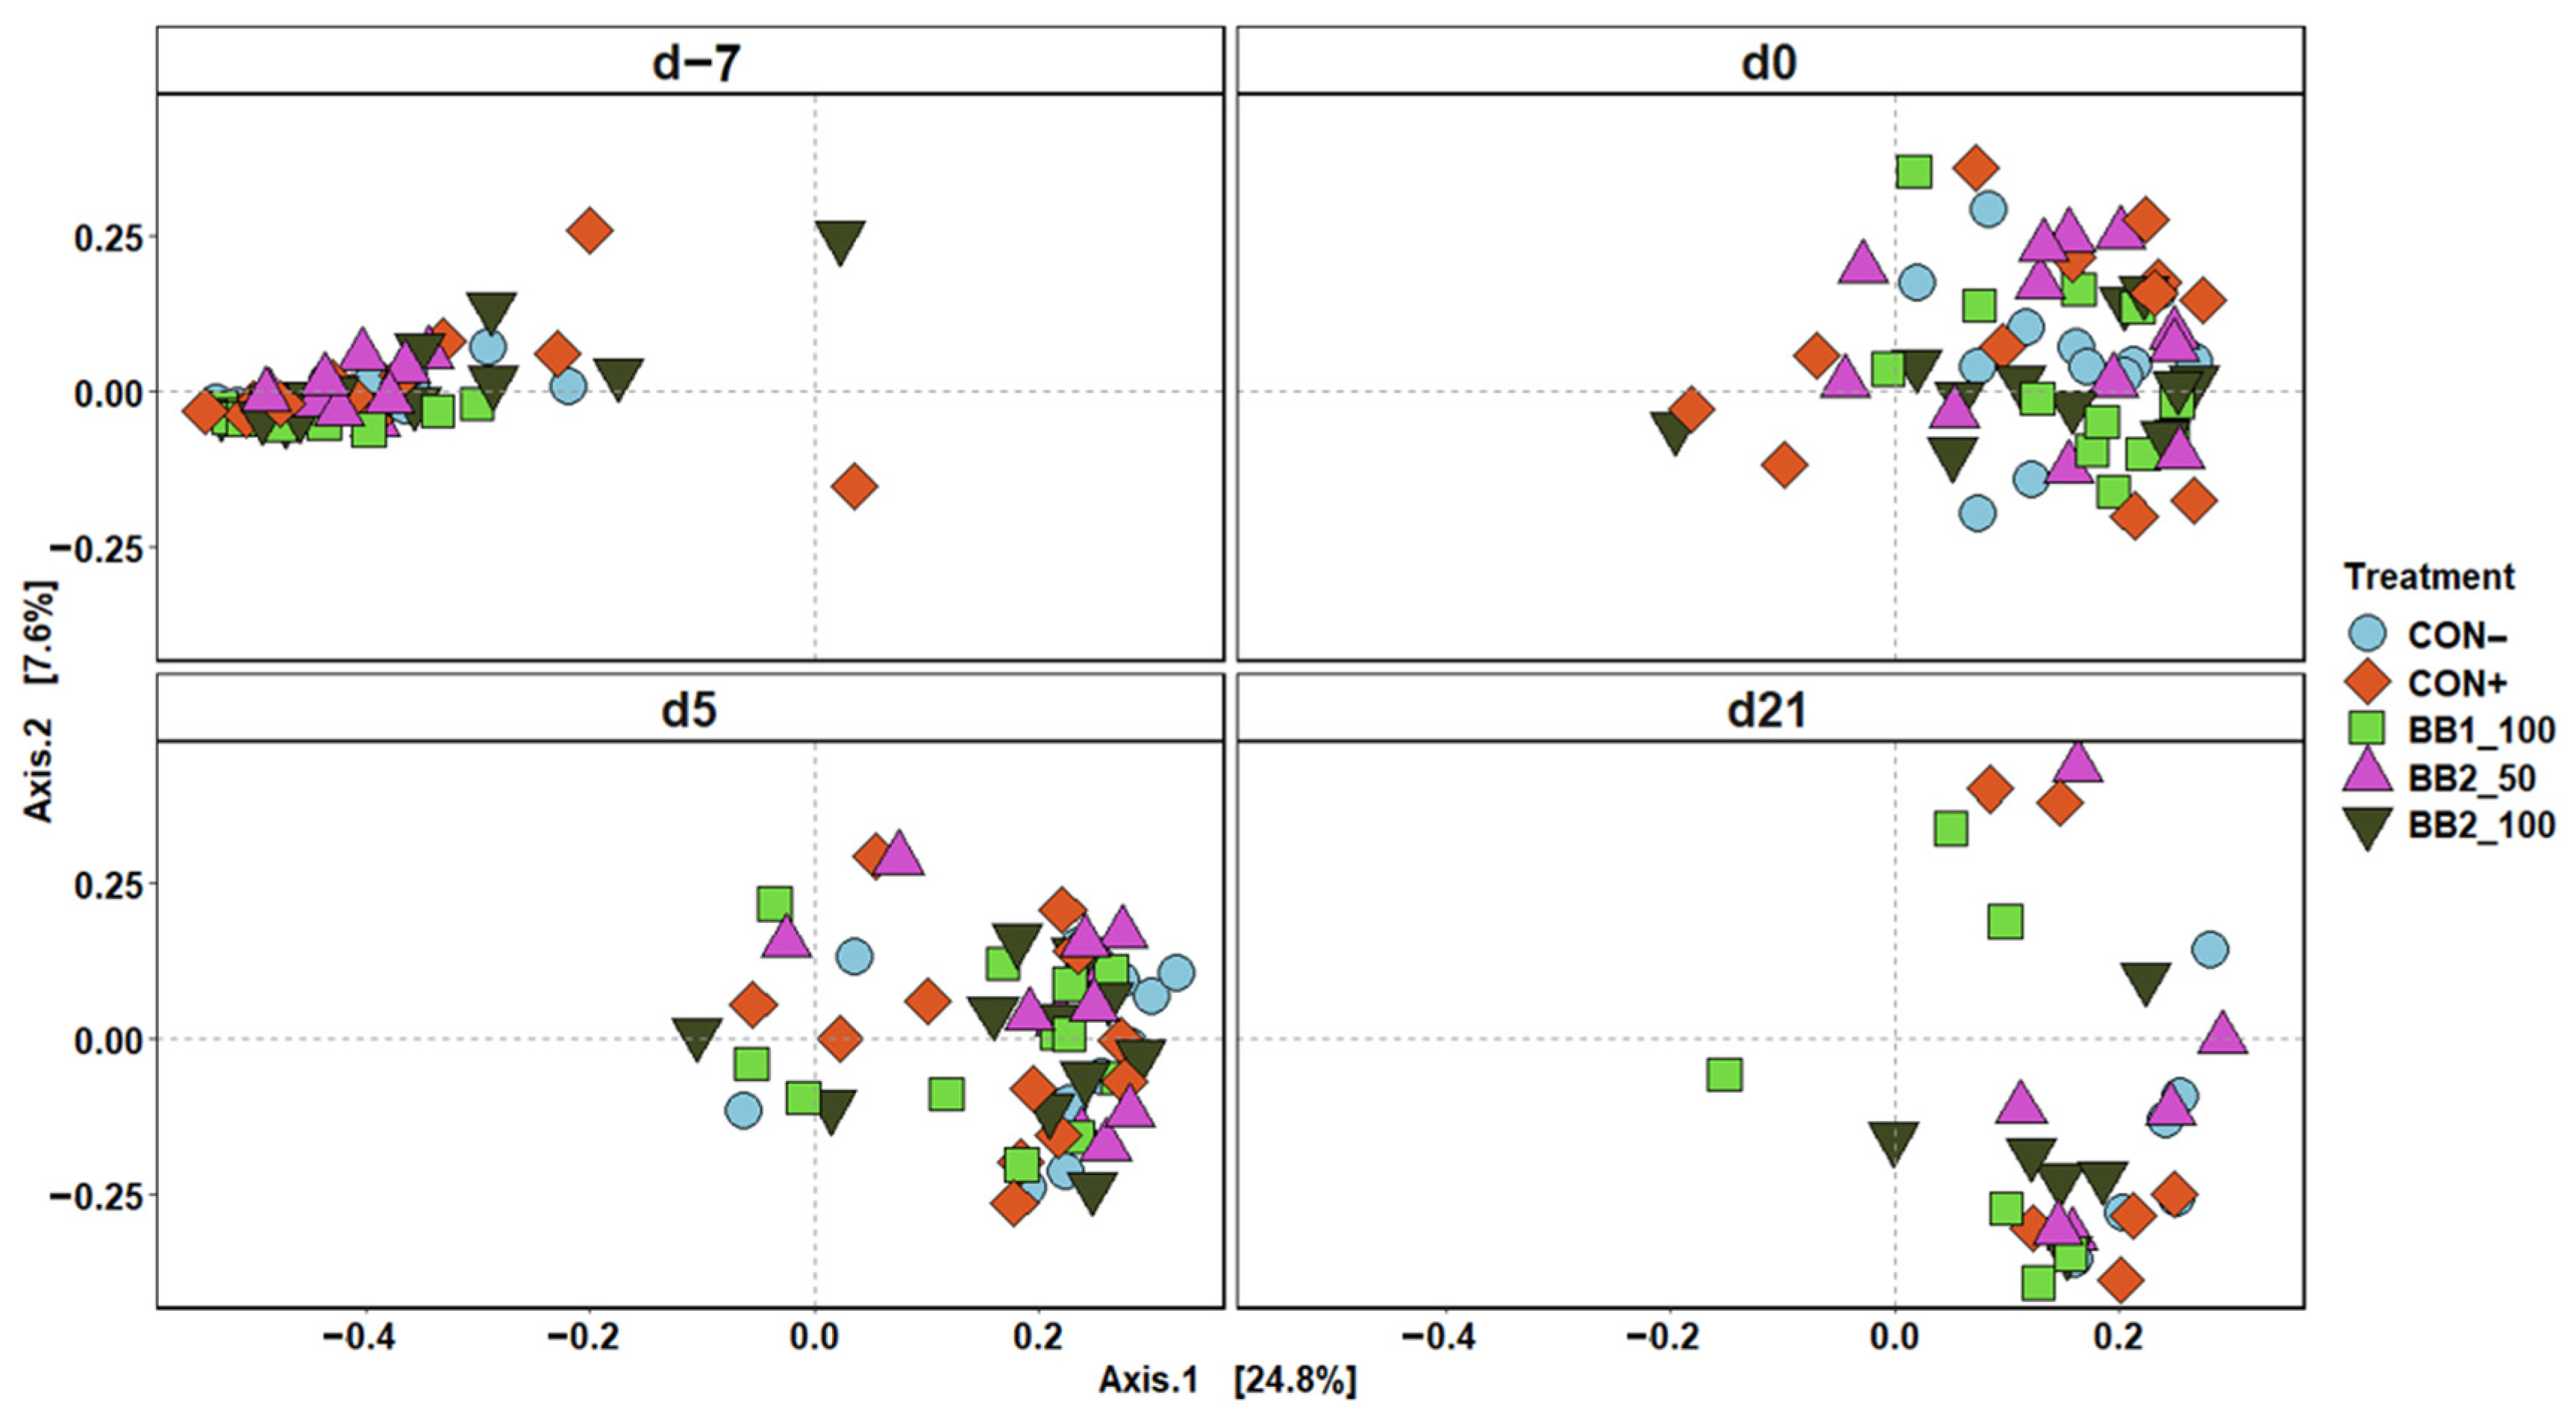
Figure 2.
Principal coordinate analysis (PCoA) based on Bray–Curtis distance for beta diversity of fecal samples of weaned pigs fed with a control (CON) diet, or diets supplemented with two different botanical blends (BB). Different colors and shapes represent treatments. The sampling days included d –7 and 0 before ETEC inoculation and d 5 and 21 post-inoculation. CON− = negative control; CON+ = positive control; BB1_100 = 100 ppm BB1; BB2_50 = 50 ppm BB2; BB2_100 = 100 ppm BB2. Each treatment had 11–12 observations.
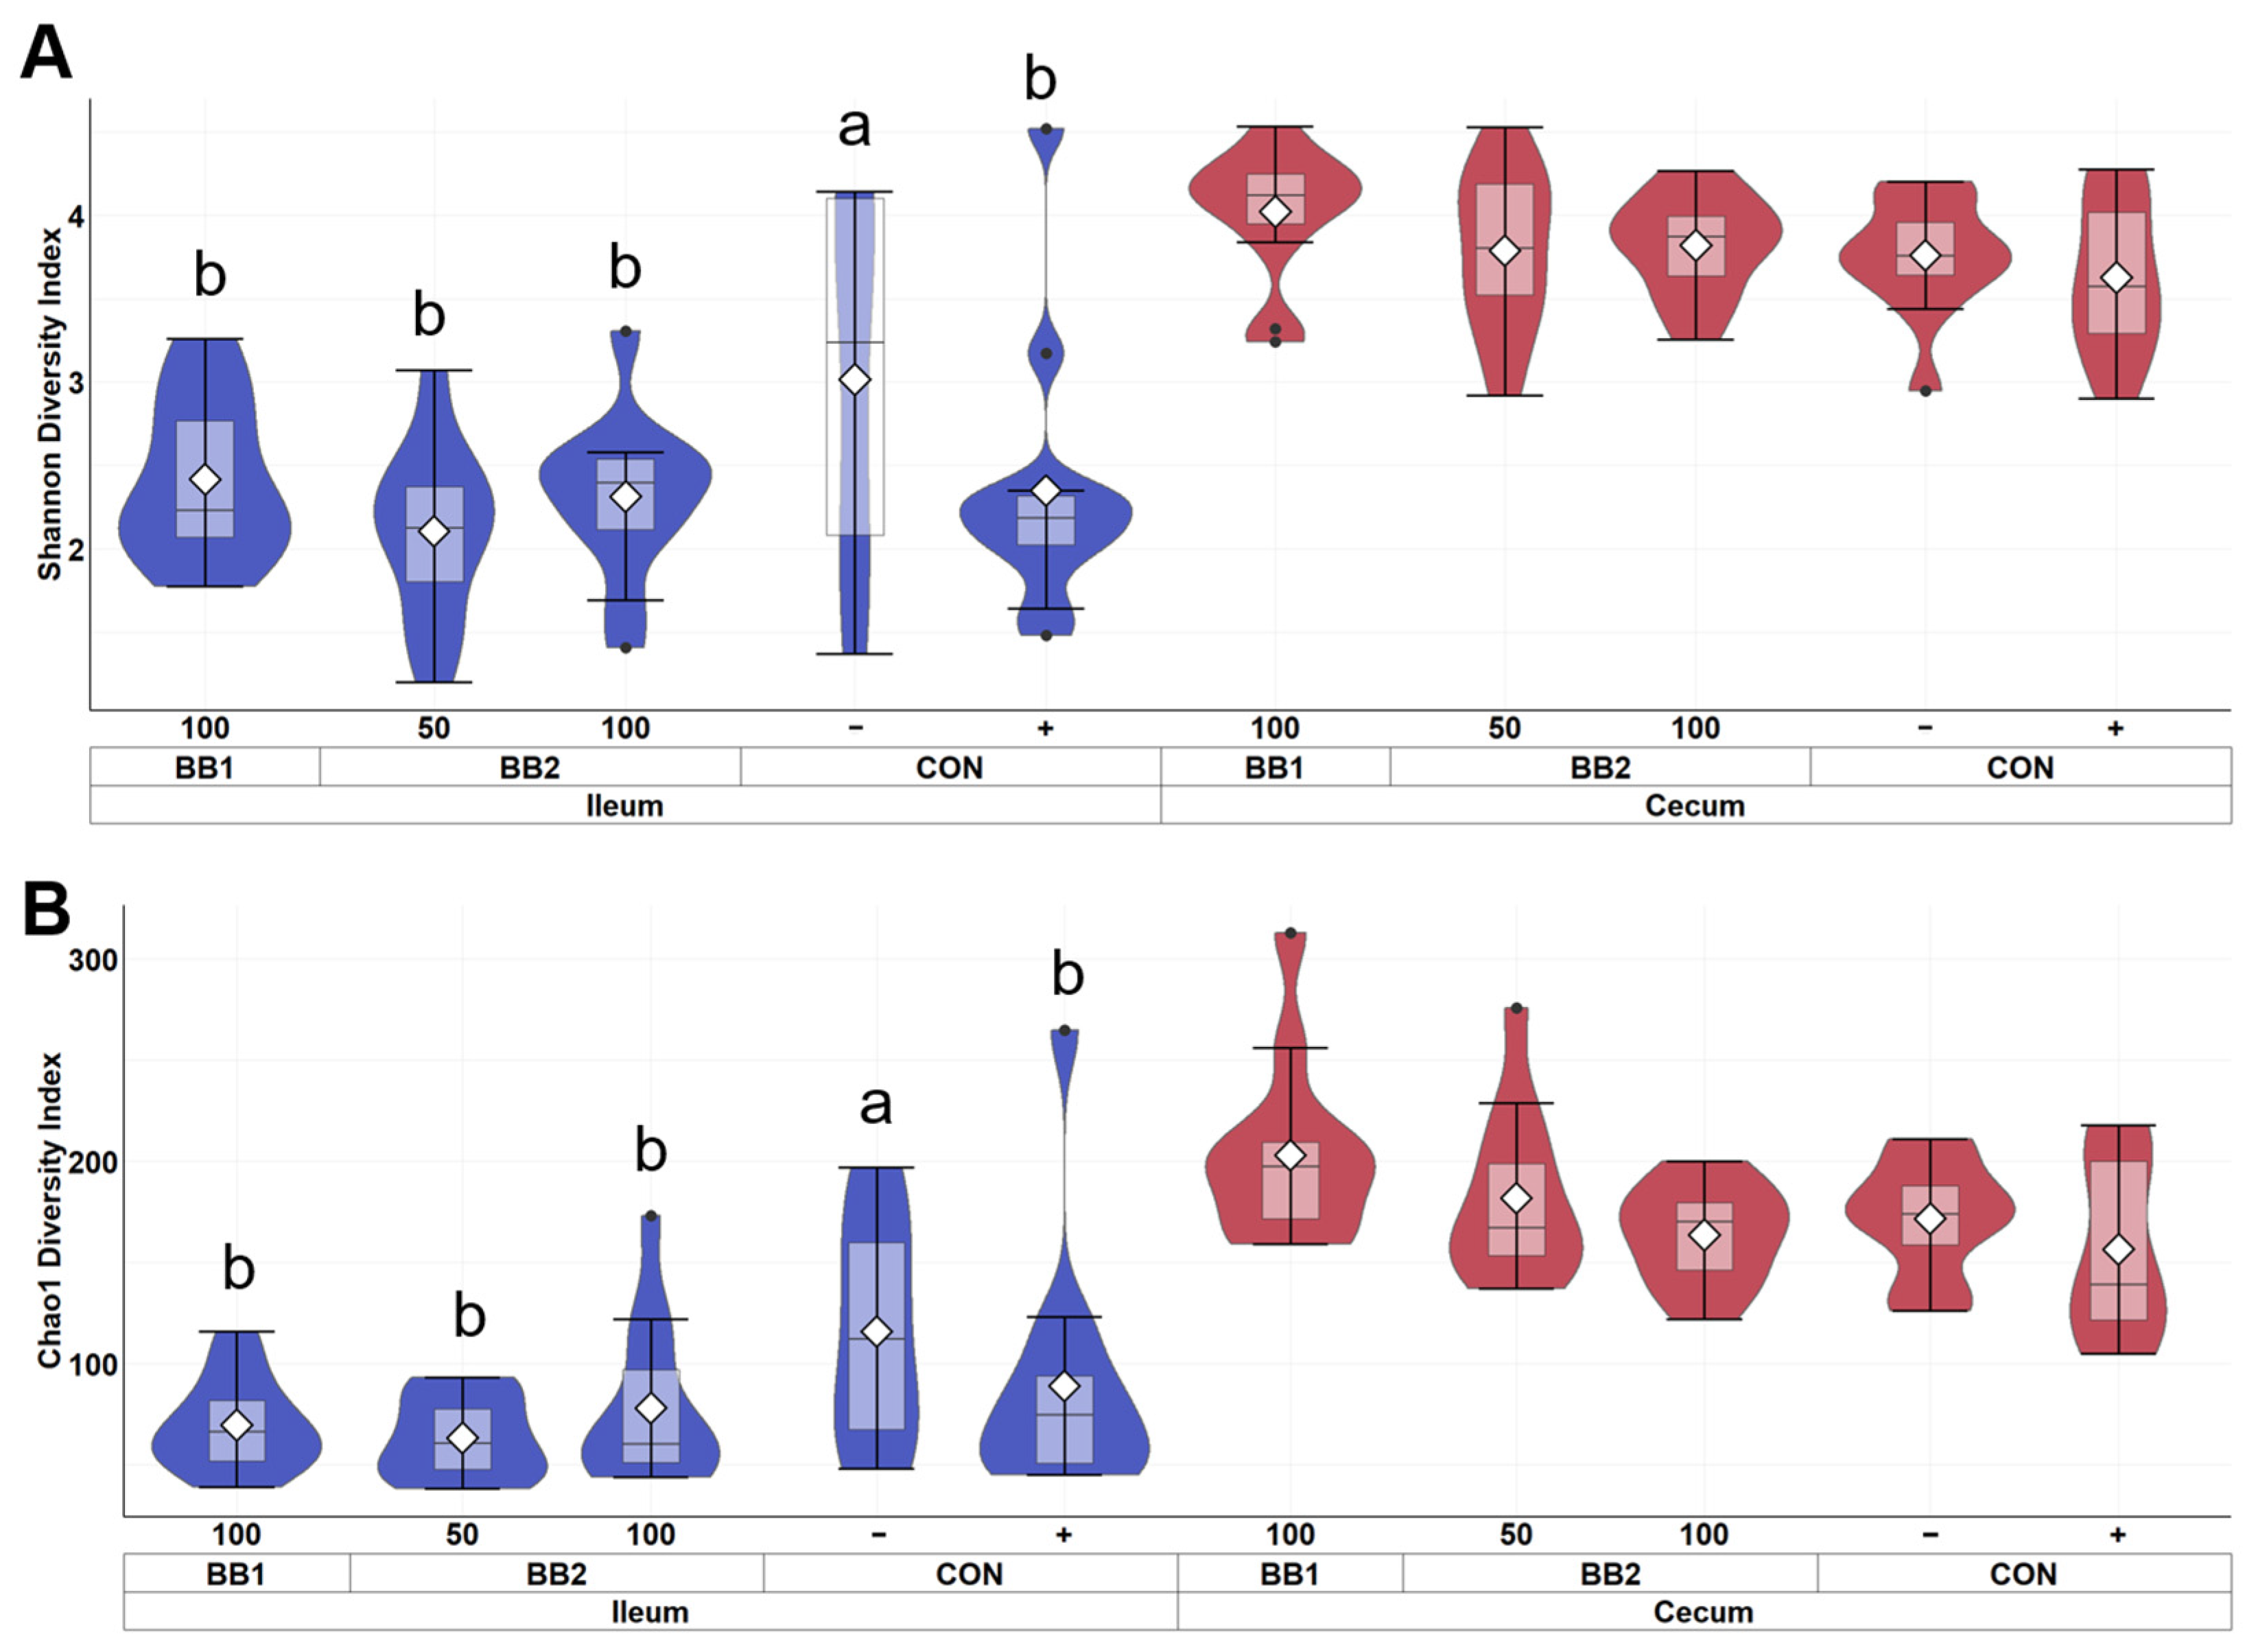
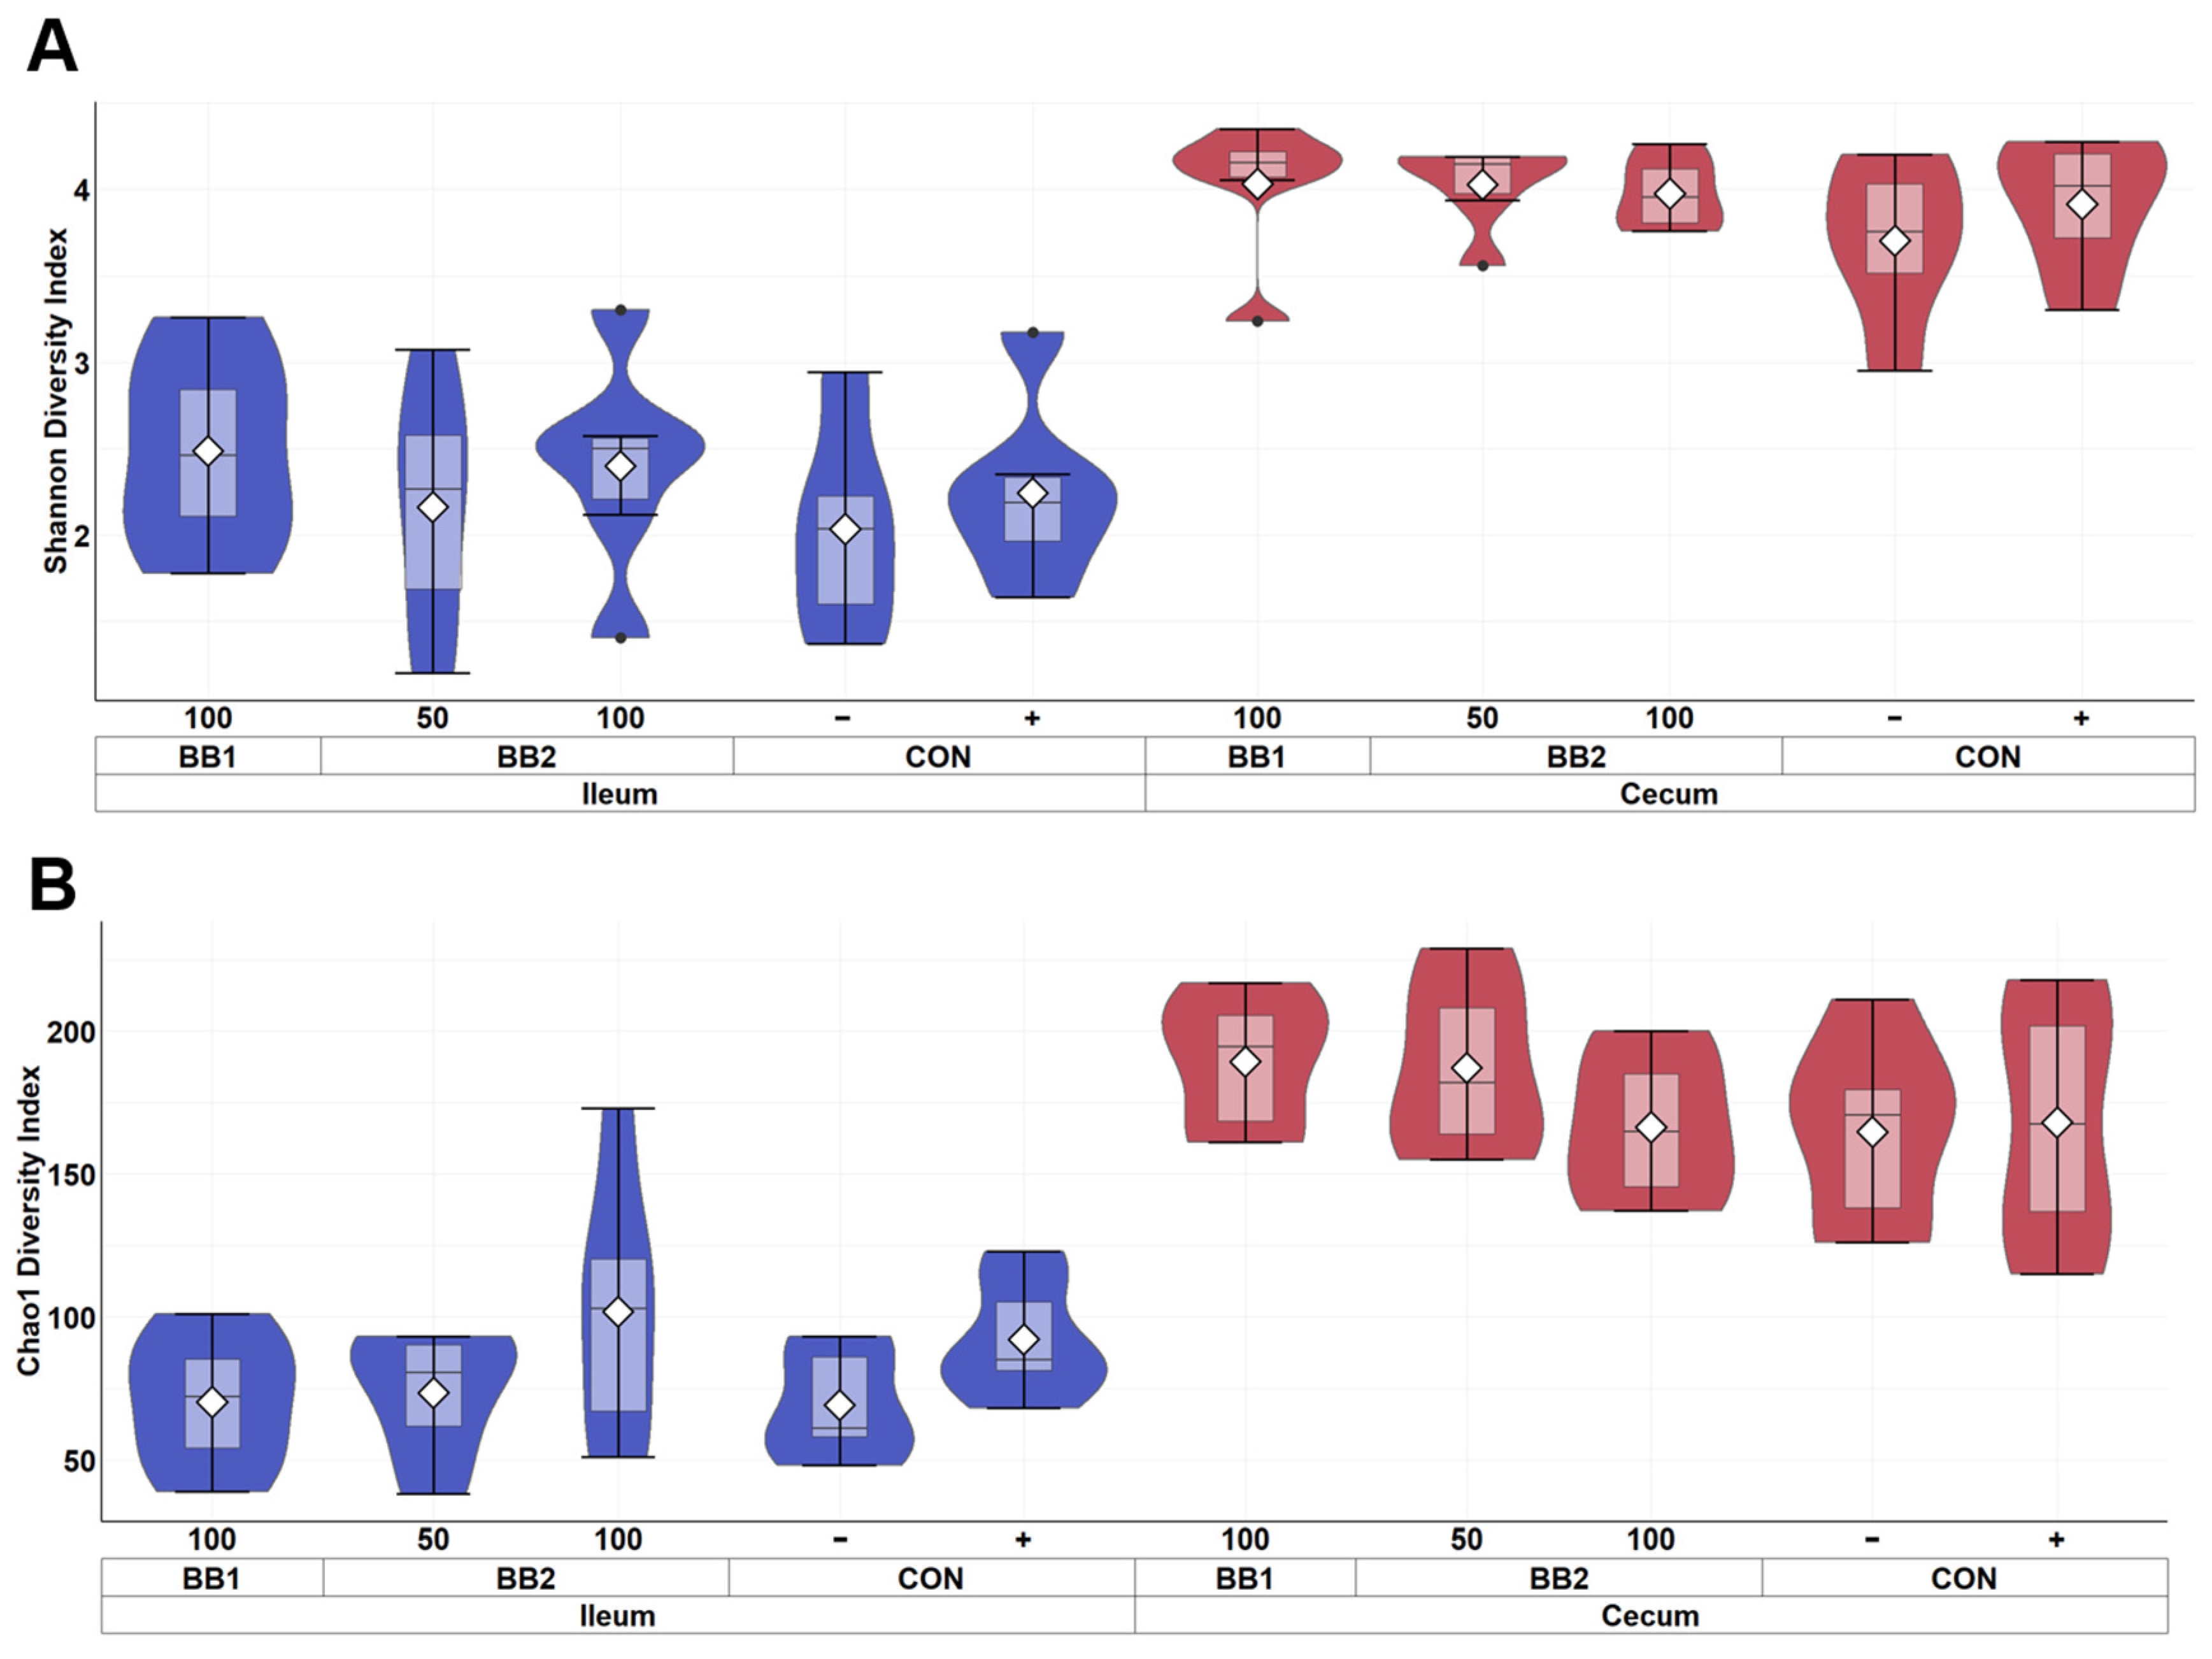
Figure 3.
Alpha diversity as indicated by Shannon (A) and Chao1 (B) indices of ileal and cecal digesta of weaned pigs on d 5 PI fed with control diet (CON), 100 ppm of botanical blend 1 (BB1), or 50 ppm or 100 ppm botanical blend 2 (BB2). Violin plots are colored by site. Data are expressed as mean (diamond) ± SEM. Each treatment had 11–12 observations.
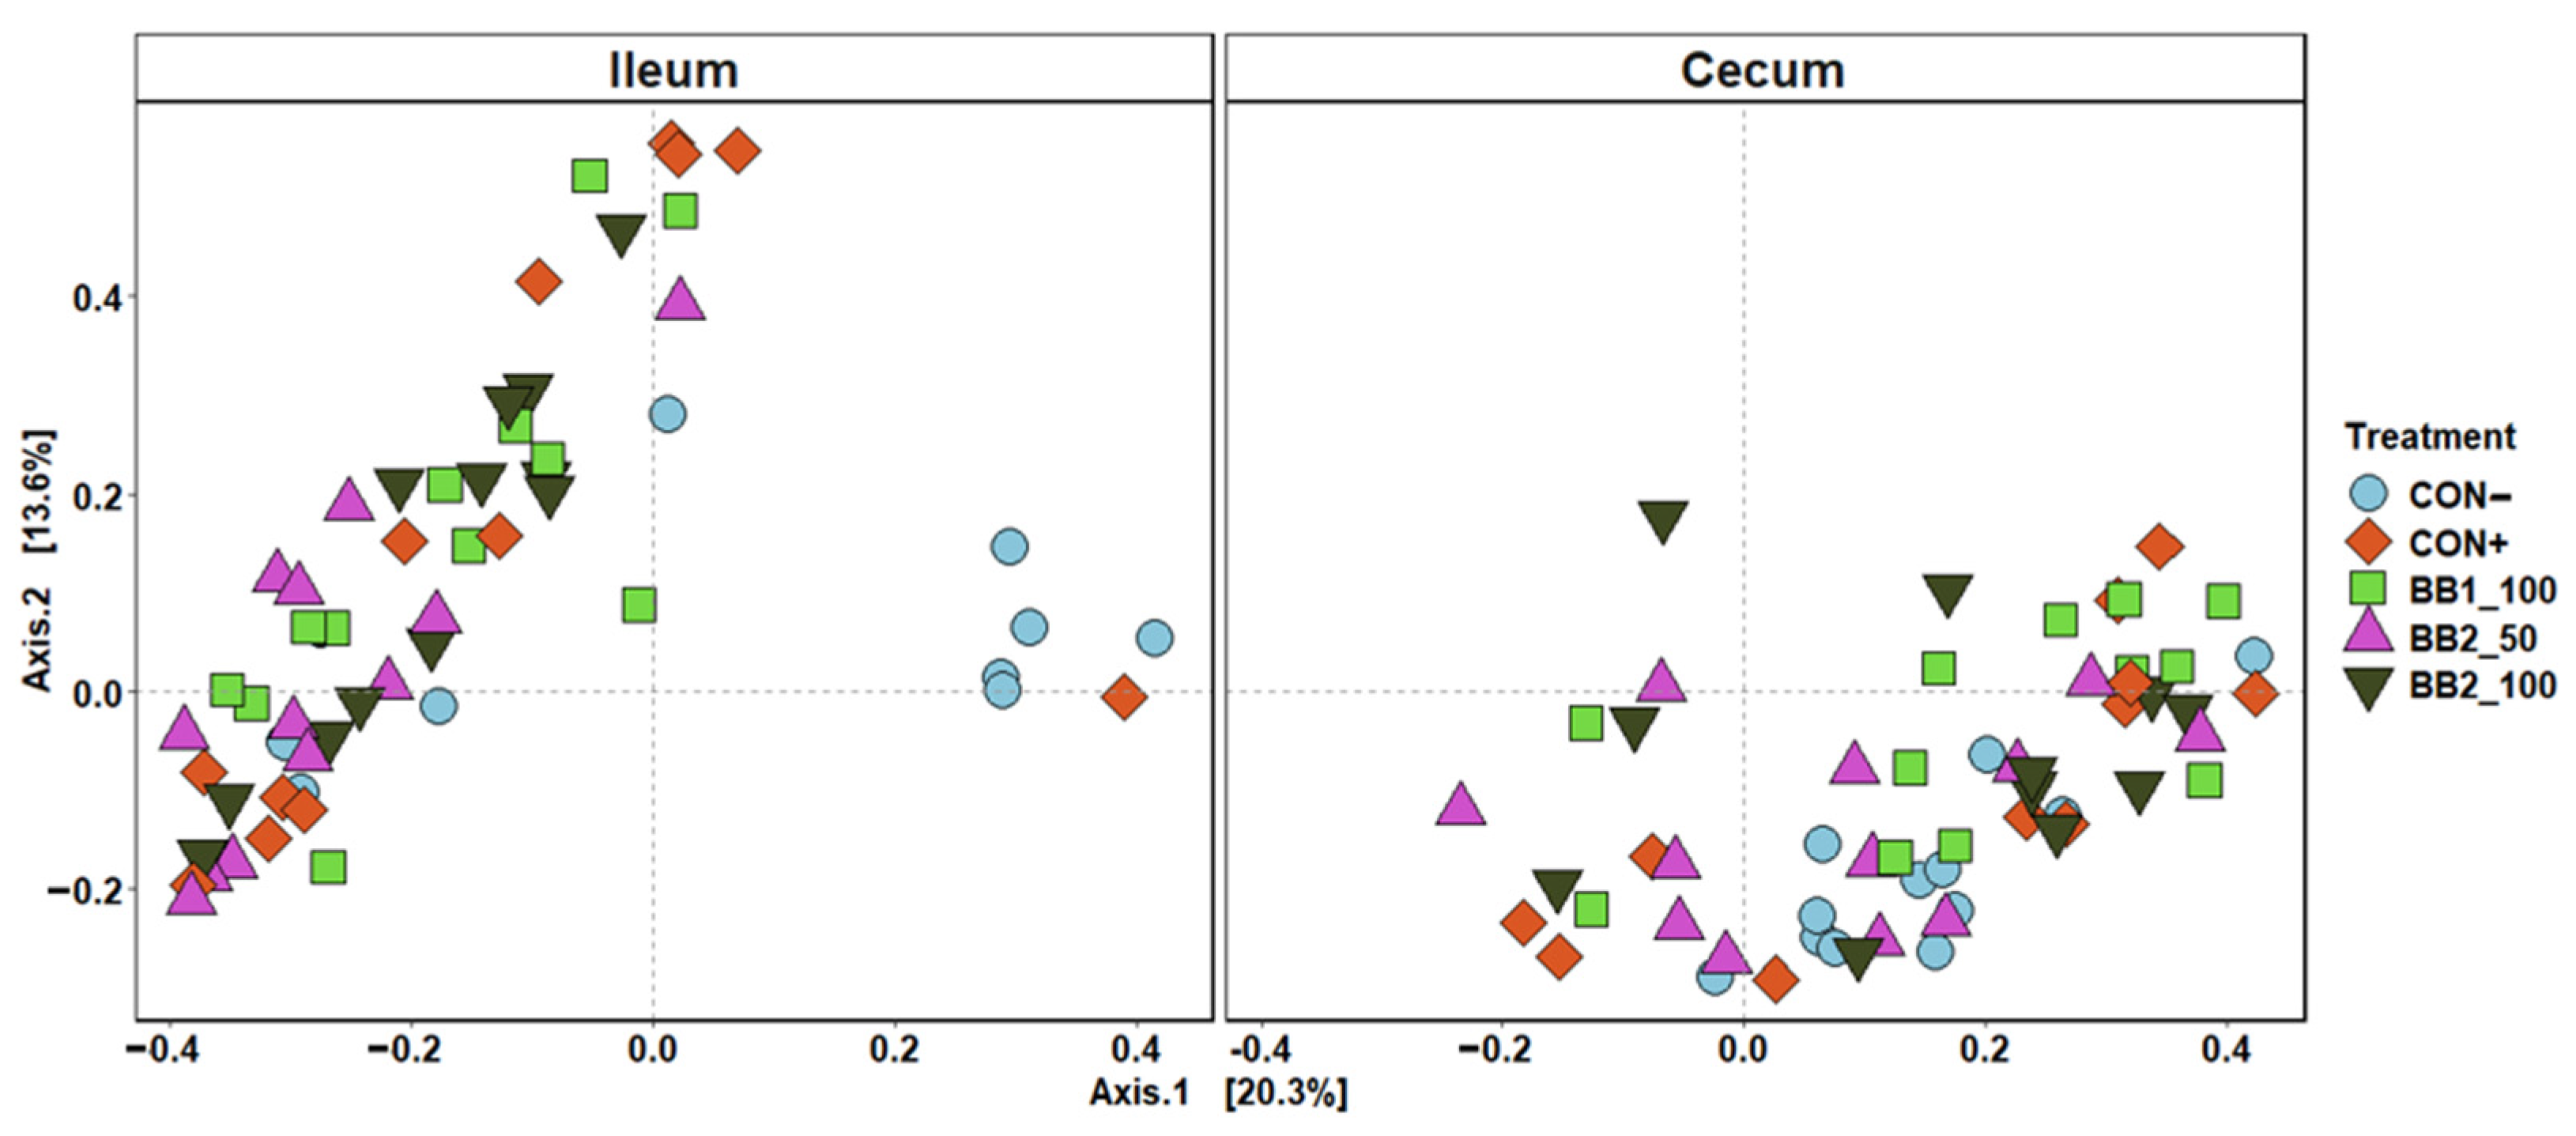
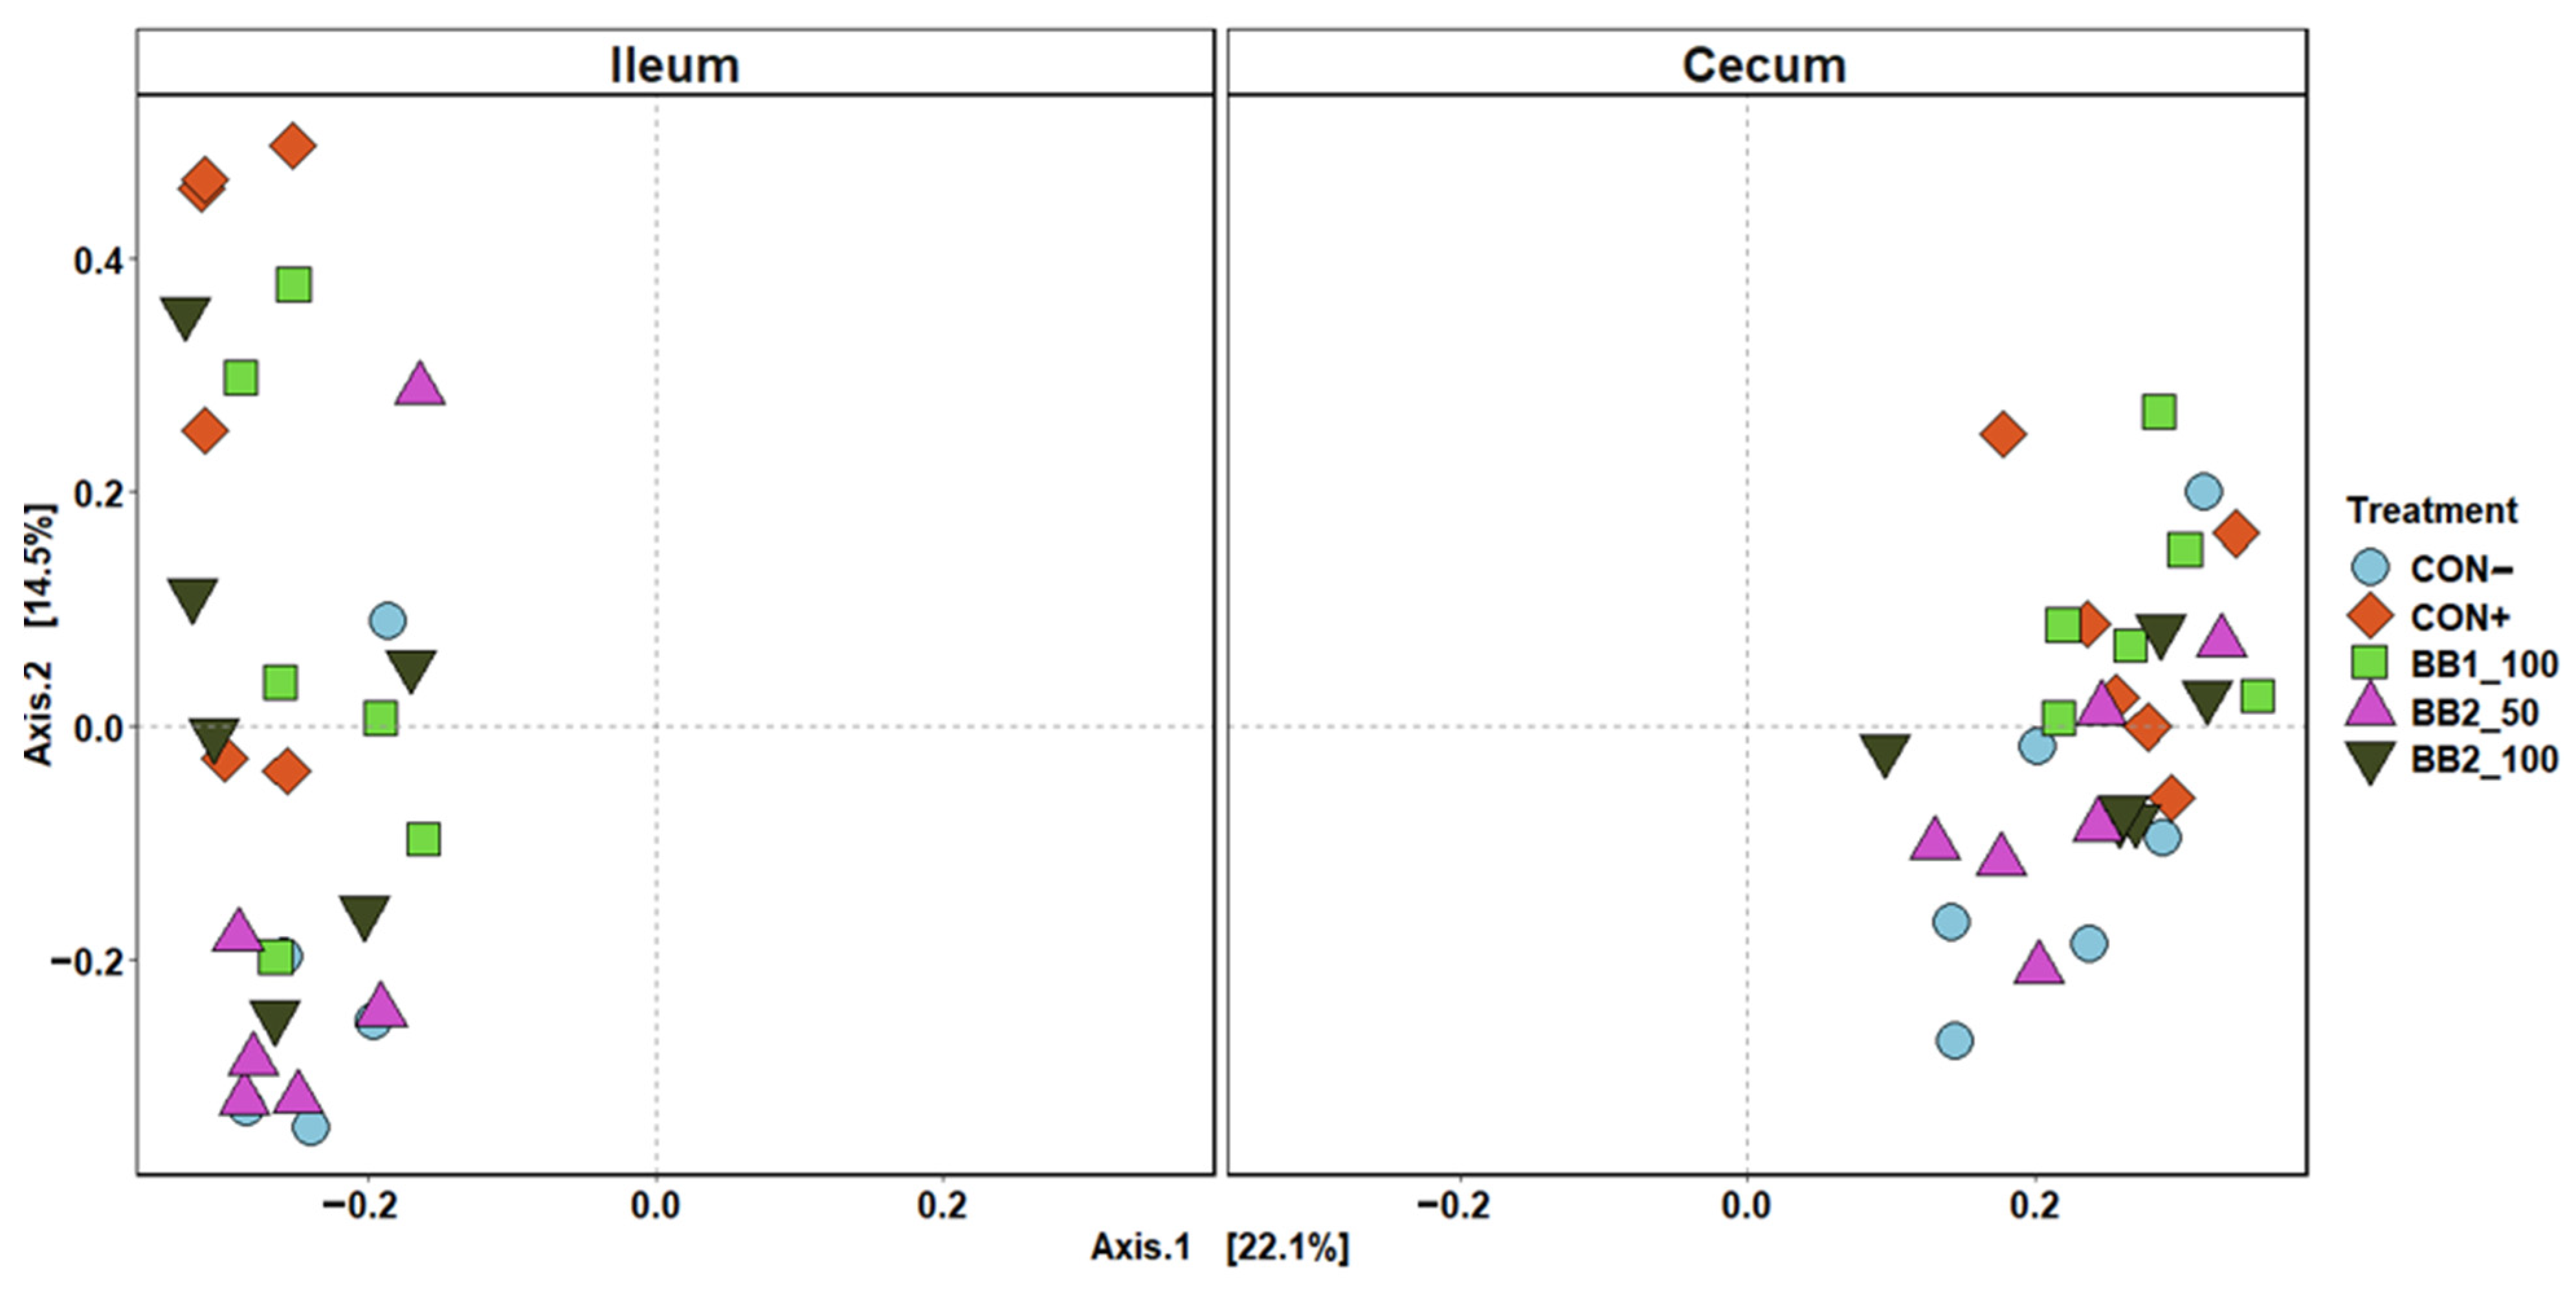
Figure 4.
Principal coordinate analysis (PCoA) based on Bray–Curtis distance for beta diversity of ileal and cecal digesta on d 5 post-inoculation of weaned pigs fed with control (CON) diet, or diets supplemented two botanical blends. Different symbols and shapes represent treatments. CON− = negative control; CON+ = positive control; BB1_100 = 100 ppm BB1; BB2_50 = 50 ppm BB2; BB2_100 = 100 ppm BB2. Each treatment had 11–12 observations.
Figure 5.
Alpha diversity as indicated by Shannon (A) and Chao1 (B) indices in ileal and cecal digesta of weaned pigs fed with control diet (CON), 100 ppm of botanical blend 1 (BB1), or 50 ppm or 100 ppm botanical blend 2 (BB2) on d 21 post-inoculation. No difference was observed in Shannon (A) and Chao1 (B) indices among treatments. Violin plots are colored by site. Data are expressed as mean (diamond) ± SEM. Each treatment had 11–12 observations.
Figure 6.
Principal coordinate analysis (PCoA) based on Bray–Curtis distance for beta diversity of ileal and cecal digesta on d 21 PI of weaned pigs fed with a control (CON) diet, or diets supplemented with two botanical blends (BB). Different symbols and shapes represent treatments. CON− = negative control; CON+ = positive control; BB1_100 = 100 ppm BB1; BB2_50 = 50 ppm BB2; BB2_100 = 100 ppm BB2. Each treatment had 11–12 observations.
Table 1.
Ingredient composition of experimental diets, as-fed 1.
Table 1.
Ingredient composition of experimental diets, as-fed 1.
| Ingredient, % | Control, Phase I | Control, Phase II |
|---|
| Corn | 51.55 | 58.44 |
| Dried whey | 15.00 | 10.00 |
| Soybean meal | 21.00 | 24.00 |
| Fish meal | 4.00 | 3.00 |
| Soy protein concentrate | 3.00 | - |
| Soybean oil | 2.10 | 1.30 |
| Limestone | 0.95 | 0.95 |
| Dicalcium phosphate | 0.55 | 0.52 |
| L-Lysine·HCl | 0.48 | 0.48 |
| DL-Methionine | 0.24 | 0.21 |
| L-Threonine | 0.21 | 0.20 |
| L-Tryptophan | 0.09 | 0.09 |
| L-Valine | 0.13 | 0.11 |
| Salt | 0.40 | 0.40 |
| Vitamin–mineral pre-mix 2 | 0.30 | 0.30 |
| Total | 100.00 | 100.00 |
Table 2.
Relative abundance (%) of the most abundant families from phyla Bacteroidota, Firmicutes, and Proteobacteria in feces of weaned pigs at the beginning of the experiment (d −7), d 0 before first enterotoxigenic Escherichia coli inoculation, and d 5, and 21 post-inoculation 1.
Table 2.
Relative abundance (%) of the most abundant families from phyla Bacteroidota, Firmicutes, and Proteobacteria in feces of weaned pigs at the beginning of the experiment (d −7), d 0 before first enterotoxigenic Escherichia coli inoculation, and d 5, and 21 post-inoculation 1.
| | d −7 | d 0 | d 5 | d 21 |
|---|
| | Sham | Escherichia coli Challenge | Sham | Escherichia coli Challenge | Sham | Escherichia coli Challenge | Sham | Escherichia coli Challenge |
|---|
| | Negative Control | Positive Control | BB1 100 ppm | BB2 50 ppm | BB2 100 ppm | Negative Control | Positive Control | BB1 100 ppm | BB2 50 ppm | BB2 100 ppm | Negative Control | Positive Control | BB1 100 ppm | BB2 50 ppm | BB2 100 ppm | Negative Control | Positive Control | BB1 100 ppm | BB2 50 ppm | BB2 100 ppm |
|---|
| Bacteroidota | 16.51 ab | 15.38 abcd | 11.68 bcde | 19.15 a | 15.23 abcd | 15.96 abc | 10 de | 15.30 abcd | 12.05 bcde | 14.86 abcd | 7.73 ef | 10.76 cde | 14.96 abcd | 14.04 abcd | 12.39 bcde | 9.40 def | 2.18 f | 6.10 ef | 7.48 ef | 6.25 ef |
| Bacteroidaceae | 1.66 a | 2.82 a | 4.31 a | 2.90 a | 3.01 a | 0.06 bcd | 0.58 b | 0.31 b | 0.21 b | 0.17 b | 0.02 cd | 0.06 bcd | 0.11 bc | 0.24 bcd | 1.24 bc | 0 cd | 0 d | 0 d | 0 d | 0 d |
| Muribaculaceae | 2.99 a | 1.90 abc | 0.86 c | 2.30 abc | 1.79 abc | 2.52 ab | 1.34 bc | 2.64 abc | 2.23 abc | 2.58 abc | 1.72 abc | 1.4 abc | 2.42 abc | 1.39 abc | 1.56 abc | 0.60 c | 0.76 c | 0.88 c | 1.84 abc | 1.84 abc |
| Prevotellaceae | 6.96 ab | 7.21 abc | 3.82 bc | 9.39 a | 6.38 abc | 10.93 a | 7.31 ab | 9.64 a | 8.13 ab | 10.30 a | 4.91 abc | 7.99 abc | 10.18 a | 10.62 a | 8.18 ab | 8.51 ab | 1.25 c | 4.91 abc | 4.97 abc | 4.22 abc |
| Rikenellaceae | 2.15 a | 1.97 abc | 1.73 abcd | 1.95 abc | 1.99 ab | 1.76 abcd | 0.53 ghij | 2.25 bcdef | 1.08 cdef | 1.47 abcde | 0.78 efghi | 1.06 defgh | 1.40 abcdef | 1.17 defgh | 0.99 defg | 0.24 hij | 0.10 j | 0.21 ij | 0.63 fghij | 0.15 ij |
| Firmicutes | 66.09 hi | 68.65 fghi | 71.11 efghi | 62.97 i | 67.68 ghi | 73.69 defgh | 75.24 cdef | 70.30 efghi | 71.98 efgh | 71.83 efgh | 84.54 ab | 79.85 bcde | 75.28 cdef | 74.27 cdefg | 74.39 cdef | 83.84 abcd | 91.05 a | 75.67 bcdef | 84.99 abc | 82.59 abcd |
| Lachnospiraceae | 10.29 efg | 9 efg | 8.06 g | 10.44 efg | 8.59 fg | 20.29 abc | 14.83 cdef | 18.13 bcd | 18.16 bcd | 18.98 bcd | 25.87 a | 22.84 ab | 23.07 ab | 18.32 bc | 21.77 abc | 20.12 abc | 14.88 bcde | 9.88 defg | 15.03 bcdef | 21.94 abc |
| Lactobacillaceae | 24.71 a | 31.10 a | 23.32 a | 27.49 a | 23.22 a | 17.75 abc | 31.72 abc | 23.14 abc | 26.67 abc | 16.41 abcd | 22.35 ab | 20.84 ab | 19.20 ab | 26.35 a | 21.29 ab | 5.16 de | 11.51 bcd | 2.46 e | 5.15 de | 9.93 cde |
| Ruminococcaceae | 5.93 | 5.21 | 6.85 | 5.34 | 4.87 | 7.84 | 5.14 | 7.02 | 5.54 | 5.88 | 10.06 | 5.70 | 7.30 | 6.65 | 7.78 | 9.02 | 8.39 | 6.54 | 7.30 | 11.52 |
| Streptococcaceae | 0.95 bcde | 0.87 cdef | 0.60 cdef | 0.62 cdef | 0.49 def | 0.22 f | 5.71 abcde | 2 ef | 0.46 def | 2.12 cdef | 1.17 cdef | 4.16 cdef | 3.37 abcde | 4.93 cdef | 3.72 abcde | 12.90 abcde | 13.19 ab | 19.69 a | 12.79 abc | 7.14 abcd |
| Veillonellaceae | 1.20 d | 0.85 d | 0.55 d | 0.39 d | 0.95 d | 3.73 bc | 5.42 abc | 5.78 abc | 6.49 abc | 5.80 abc | 6.30 abc | 7.12 abc | 4.25 c | 6.52 abc | 4.87 abc | 10.96 a | 10.23 a | 5.74 abc | 7.58 abc | 9.40 ab |
| Proteobacteria | 2.36 abcd | 1.60 abcd | 2.03 abcd | 2.18 abcd | 1.85 abcd | 1.97 abcd | 7.26 a | 6.39 abcd | 7.77 ab | 3.36 abcd | 0.34 e | 1.61 cde | 1.93 bcd | 5.60 abcd | 5.45 abcd | 1.04 cde | 0.74 de | 10.82 abc | 0.94 cde | 4.05 abcd |
| Enterobacteriaceae | 0.75 bcd | 0.87 bcd | 1.16 abc | 0.49 bcd | 0.79 bcd | 0.46 abc | 4.32 a | 3.84 ab | 4.32 a | 2.23 abc | 0.07 d | 0.64 bcd | 1.01 abc | 4.52 abc | 4.75 abc | 0.07 cd | 0.13 bcd | 1.78 abc | 0.37 bcd | 1.42 bcd |
| Succinivibrionaceae | 1.22 ab | 0.44 ab | 0.70 ab | 1.27 ab | 0.68 ab | 1.34 a | 1.32 ab | 0.79 ab | 2.44 a | 0.78 ab | 0.25 b | 0.31 b | 0.34 ab | 0.60 ab | 0.30 b | 0.96 ab | 0.59 ab | 2.48 ab | 0.41 ab | 2.57 ab |
Table 3.
Relative abundance (%) of families in the three most abundant phyla in feces of weaned pigs at the beginning of the experiment (d −7), d 0 before first enterotoxigenic Escherichia coli inoculation, and d 5, and 21 post-inoculation 1.
Table 3.
Relative abundance (%) of families in the three most abundant phyla in feces of weaned pigs at the beginning of the experiment (d −7), d 0 before first enterotoxigenic Escherichia coli inoculation, and d 5, and 21 post-inoculation 1.
| | d −7 | d 0 | d 5 | d 21 |
|---|
| | Sham | Escherichia coli Challenge | Sham | Escherichia coli Challenge | Sham | Escherichia coli Challenge | Sham | Escherichia coli Challenge |
|---|
| | Negative Control | Positive Control | BB1 100 ppm | BB2 50 ppm | BB2 100 ppm | Negative Control | Positive Control | BB1 100 ppm | BB2 50 ppm | BB2 100 ppm | Negative Control | Positive Control | BB1 100 ppm | BB2 50 ppm | BB2 100 ppm | Negative Control | Positive Control | BB1 100 ppm | BB2 50 ppm | BB2 100 ppm |
|---|
| Bacteroidota | | | | | | | | | | | | | | | | | | | | |
| Prevotella | 2.70 ab | 3.20 ab | 1.64 ab | 3.05 ab | 2.60 ab | 6.75 a | 4.79 ab | 5.69 a | 3.88 ab | 5.42 a | 3.07 ab | 4.88 ab | 5.04 ab | 5.20 ab | 4.10 ab | 6.59 a | 0.68 b | 3.54 ab | 3.51 ab | 2.81 ab |
| Firmicutes | | | | | | | | | | | | | | | | | | | | |
| Agathobacter | 0.05 e | 0.27 cde | 0 e | 0.04 e | 0.03 de | 2.13 a | 1.94 ab | 1.79 a | 3.11 a | 3.33 a | 2.21 a | 2.44 a | 2.10 a | 1.79 ab | 3.37 a | 2.37 ab | 1.68 abcd | 0.53 bcde | 1.82 abc | 1.47 ab |
| Blautia | 0.29 e | 0.34 e | 0.21 e | 0.14 e | 0.60 de | 7.38 ab | 4.51 bc | 7.02 ab | 4.56 bc | 7.45 ab | 9.19 a | 6.66 abc | 5.74 bc | 5.49 bc | 6.67 ab | 7.26 ab | 4.31 bc | 3.13 cd | 4.87 bc | 6.37 abc |
| Clostridium sensu stricto 1 | 7.33 a | 6.51 a | 10.45 a | 6.72 a | 6.86 a | 0.06 b | 0.11 b | 0.23 b | 0.05 b | 0.26 b | 0.02 b | 0.02 b | 0.12 b | 0.08 b | 0.16 b | 0.05 b | 1.04 b | 0.15 b | 0.14 b | 0.86 b |
| Faecalibacterium | 0.03 d | 0.20 d | 0.38 d | 0.04 d | 0.18 d | 4.19 ab | 1.70 c | 3.68 abc | 2.75 bc | 3.13 bc | 5.63 a | 3.21 bc | 3.33 abc | 3.37 ab | 4.52 ab | 4.27 ab | 3.72 bc | 3.17 bc | 2.86 bc | 4.24 abc |
| Lachnoclostridium | 5.59 a | 5.31 a | 5.01 a | 6.37 a | 4.17 a | 0.31 bcde | 0.96 bcd | 0.50 cde | 1.05 b | 0.43 bcd | 0.88 cde | 0.58 bc | 0.33 bcde | 0.19 cde | 0.24 bcde | 0.21 bcde | 0.12 de | 0.10 e | 0.11 de | 0.21 bcde |
| Lactobacillus | 5.16 de | 11.51 bcd | 2.46 e | 5.15 de | 9.93 cde | 24.71 a | 31.1 a | 23.32 a | 27.49 a | 23.22 a | 22.35 ab | 20.84 ab | 19.20 ab | 26.35 a | 21.29 ab | 17.75 abc | 31.72 abc | 23.14 abc | 26.67 abc | 16.41 abcd |
| Megasphaera | 1.16 b | 0.75 b | 0.50 b | 0.35 b | 0.92 b | 3.51 a | 4.50 a | 5.18 a | 5.65 a | 5.15 a | 4.79 a | 6.15 a | 3.71 a | 5.71 a | 4.07 a | 7.10 a | 5.54 a | 4.13 a | 5.23 a | 4.01 a |
| Streptococcus | 0.95 bcde | 0.87 cdef | 0.60 cdef | 0.62 cdef | 0.49 def | 0.22 f | 5.71 abcde | 2.00 ef | 0.46 def | 2.12 cdef | 1.17 cdef | 4.16 cdef | 3.37 abcde | 4.93 cdef | 3.72 abcde | 12.9 abcde | 13.19 ab | 19.68 a | 12.79 abc | 7.14 abcd |
| Proteobacteria | | | | | | | | | | | | | | | | | | | | |
| Escherichia–Shigella | 0.75 bcd | 0.87 bcd | 1.16 abc | 0.49 bcd | 0.79 bcd | 0.46 abc | 4.32 a | 3.84 ab | 4.32 a | 2.23 abc | 0.07 d | 0.64 bcd | 1.01 abc | 4.52 abc | 4.75 abc | 0.07 cd | 0.13 bcd | 1.78 abc | 0.37 bcd | 1.42 bcd |
Table 4.
Relative abundance (%) of Bacteroidota, Firmicutes, and Proteobacteria and their top families in digesta on d 5 post-inoculation of F18 enterotoxigenic Escherichia coli infected weaned pigs 1.
Table 4.
Relative abundance (%) of Bacteroidota, Firmicutes, and Proteobacteria and their top families in digesta on d 5 post-inoculation of F18 enterotoxigenic Escherichia coli infected weaned pigs 1.
| | Ileum | Cecum |
|---|
| | Sham | Escherichia coli Challenge | Sham | Escherichia coli Challenge |
|---|
| | Negative Control | Positive Control | BB1 100 ppm | BB2 50 ppm | BB2 100 ppm | Negative Control | Positive Control | BB1 100 ppm | BB2 50 ppm | BB2 100 ppm |
|---|
| Bacteroidota | 7.13 c | 0.78 d | 1.41 d | 0.14 d | 0.36 d | 9.96 ab | 6.46 bc | 15.21 a | 10.81 ab | 12.3 ab |
| Muribaculaceae | 0.51 b | 0.17 c | 0.02 c | 0 c | 0.01 c | 0.31 ab | 0.30 ab | 0.52 a | 0.39 ab | 0.26 ab |
| Prevotellaceae | 6.49 c | 0.57 d | 1.38 d | 0.13 d | 0.33 d | 9.42 ab | 5.98 bc | 13.26 a | 9.64 ab | 10.92 ab |
| Firmicutes | 83.77 a | 86.22 a | 67.26 a | 74.48 a | 74.25 a | 81.98 a | 84.98 a | 71.72 a | 76.77 a | 70.90 a |
| Lachnospiraceae | 7.34 b | 2.97 bc | 0.41 c | 0.50 bc | 0.61 bc | 20.43 a | 16.32 a | 18.54 a | 16.32 a | 17.33 a |
| Lactobacillaceae | 29.35 | 44.09 | 37.91 | 51.18 | 43.01 | 27.69 | 27.22 | 18.94 | 29.39 | 19.91 |
| Ruminococcaceae | 3.87 b | 1.08 c | 0.07 c | 0.12 c | 0.08 c | 10.20 a | 9.33 a | 9.08 a | 9.09 a | 8.89 a |
| Selemonadaceae | 6.23 a | 1.16 b | 1.45 b | 2.34 b | 0.79 b | 4.81 a | 5.78 a | 2.97 a | 3.29 a | 4.82 a |
| Streptococcaceae | 6.94 | 31.07 | 13.07 | 12.94 | 14.24 | 5.18 | 8.50 | 8.13 | 5.03 | 3.96 |
| Veillonellaceae | 8.61 abcd | 2.48 de | 2.78 e | 1.99 e | 3.31 cde | 6.67 abc | 11.36 a | 4.32 bcde | 7.53 ab | 7.34 ab |
| Proteobacteria | 3.95 ab | 6.10 ab | 20.10 a | 17.69 ab | 18.2 ab | 1.83 b | 2.74 ab | 4.99 ab | 6.06 ab | 8.68 ab |
| Enterobacteriaceae | 1.91 bcd | 0.30 bcd | 16.25 a | 16.36 ab | 16.22 abc | 0.43 cd | 0.07 d | 1.93 abc | 3.72 abc | 5.69 abc |
| Pasteurellaceae | 0.34 d | 5.36 ab | 3.77 a | 1.30 abc | 1.75 ab | 0.01 d | 0.20 bcd | 0.20 abcd | 0.18 cd | 0.07 bcd |
| Succinivibrionaceae | 1.64 a | 0.13 b | 0.04 b | 0.01 b | 0.01 b | 1.33 a | 1.74 a | 1.91 a | 1.32 a | 2.84 a |
Table 5.
Relative abundance (%) of the most abundant families in the three most abundant phyla in digesta on d 5 post-inoculation of F18 enterotoxigenic Escherichia coli infected weaned pigs 1.
Table 5.
Relative abundance (%) of the most abundant families in the three most abundant phyla in digesta on d 5 post-inoculation of F18 enterotoxigenic Escherichia coli infected weaned pigs 1.
| | Ileum | Cecum |
|---|
| | Sham | Escherichia coli Challenge | Sham | Escherichia coli Challenge |
|---|
| | Negative Control | Positive Control | BB1 100 ppm | BB2 50 ppm | BB2 100 ppm | Negative Control | Positive Control | BB1 100 ppm | BB2 50 ppm | BB2 100 ppm |
|---|
| Actinobacteria | | | | | | | | | | |
| Bifidobacterium | 1.91 | 4.39 | 6.47 | 5.74 | 4.89 | 0.72 | 1.64 | 1.21 | 1.61 | 2.56 |
| Firmicutes | | | | | | | | | | |
| Agathobacter | 0.76 b | 0.28 b | 0.04 b | 0.02 b | 0.03 b | 3.08 a | 2.94 a | 2.92 a | 2.59 a | 3.16 a |
| Blautia | 1.6 b | 1.18 bc | 0.05 c | 0.09 c | 0.09 bc | 7.58 a | 4.38 a | 5.41 a | 5.25 a | 5.7 a |
| Faecalibacterium | 0.89 b | 0.46 bc | 0.02 c | 0.03 c | 0.03 c | 6.36 a | 5.15 a | 3.92 a | 5.07 a | 4.16 a |
| Lactobacillus | 29.34 | 44.09 | 37.91 | 51.18 | 43 | 27.69 | 27.22 | 18.94 | 29.39 | 19.91 |
| Megasphaera | 5.04 bc | 1.98 c | 2.33 c | 1.69 c | 2.82 bc | 4.1 ab | 8.22 a | 2.81 bc | 5.46 ab | 4.71 ab |
| Streptococcus | 6.94 | 31.06 | 13.07 | 12.94 | 14.24 | 5.18 | 8.5 | 8.13 | 5.03 | 3.96 |
| Turicibacter | 6.02 abc | 0.33 a | 5.11 a | 1.15 a | 3.34 ab | 0.11 abcd | 0.05 bcd | 0.09 cd | 0.07 d | 0.25 bcd |
| Proteobacteria | | | | | | | | | | |
| Escherichia–Shigella | 1.91 bcd | 0.3 bcd | 16.25 a | 16.36 ab | 16.22 abc | 0.43 cd | 0.07 d | 1.93 abc | 3.72 abc | 5.69 abc |
Table 6.
Relative abundance (%) of Bacteroidota, Firmicutes, and Proteobacteria and their top families in digesta on d 21 post-inoculation of F18 enterotoxigenic Escherichia coli infected weaned pigs 1.
Table 6.
Relative abundance (%) of Bacteroidota, Firmicutes, and Proteobacteria and their top families in digesta on d 21 post-inoculation of F18 enterotoxigenic Escherichia coli infected weaned pigs 1.
| | Ileum | Cecum |
|---|
| | Sham | Escherichia coli Challenge | Sham | Escherichia coli Challenge |
|---|
| | Negative Control | Positive Control | BB1 100 ppm | BB2 50 ppm | BB2 100 ppm | Negative Control | Positive Control | BB1 100 ppm | BB2 50 ppm | BB2 100 ppm |
|---|
| Bacteroidota | 0.33 b | 0.05 b | 0.14 b | 0.24 b | 0.07 b | 12.39 a | 8.80 a | 16.59 a | 12.34 a | 15.66 a |
| Muribaculaceae | 0 c | 0 c | 0 c | 0 c | 0 c | 0.24 ab | 0.25 b | 0.27 ab | 0.25 ab | 0.38 a |
| Prevotellaceae | 0.33 b | 0.05 b | 0.14 b | 0.24 b | 0.06 b | 12.05 a | 8.46 a | 16.22 a | 11.99 a | 15.14 a |
| Firmicutes | 91.34 | 82.67 | 72.98 | 74.31 | 75.81 | 78.89 | 82.08 | 72.11 | 77.79 | 69.68 |
| Lachnospiraceae | 0.16 b | 0.52 b | 0.38 b | 0.63 b | 0.85 b | 16.18 a | 17.20 a | 18.87 a | 15.39 a | 16.19 a |
| Lactobacillaceae | 48.62 | 17.11 | 36.16 | 43.76 | 31.31 | 27.88 | 12.68 | 14.10 | 24.25 | 14.22 |
| Streptococcaceae | 1.93 b | 56.81 a | 17.83 ab | 15.63 b | 17.98 ab | 8.66 b | 14.94 ab | 13.9 ab | 7.34 b | 4.75 b |
| Proteobacteria | 4.50 | 9.89 | 20.09 | 16.24 | 15.24 | 2.89 | 3.71 | 5.33 | 3.51 | 7.51 |
| Enterobacteriaceae | 3.71 ab | 0.30 ab | 13.74 a | 15.61 ab | 12.44 ab | 0.43 ab | 0.07 b | 1.20 ab | 1.69 ab | 2.27 ab |
| Pasteurellaceae | 0.68 cde | 8.95 a | 6.30 ab | 0.58 abcd | 2.40 abc | 0 e | 0.36 bcde | 0.29 cde | 0.09 de | 0.03 de |
| Succinivibrionaceae | 0.02 b | 0.02 b | 0.01 b | 0.01 b | 0.02 b | 2.42 a | 3.14 a | 3.38 a | 1.67 a | 5.15 a |
Table 7.
Relative abundance (%) of the most abundant genera from Actinobacteria, Firmicutes and Proteobacteria in digesta on d 21 post-inoculation of F18 enterotoxigenic Escherichia coli infected weaned pigs 1.
Table 7.
Relative abundance (%) of the most abundant genera from Actinobacteria, Firmicutes and Proteobacteria in digesta on d 21 post-inoculation of F18 enterotoxigenic Escherichia coli infected weaned pigs 1.
| | Ileum | Cecum |
|---|
| | Sham | Escherichia coli Challenge | Sham | Escherichia coli Challenge |
|---|
| | Negative Control | Positive Control | BB1 100 ppm | BB2 50 ppm | BB2 100 ppm | Negative Control | Positive Control | BB1 100 ppm | BB2 50 ppm | BB2 100 ppm |
|---|
| Actinobacteria | | | | | | | | | | |
| Bifidobacterium | 3.2 | 3.85 | 4.77 | 6.93 | 5.98 | 0.39 | 0.62 | 0.26 | 1.53 | 1.13 |
| Firmicutes | | | | | | | | | | |
| Blautia | 0.05 b | 0.08 b | 0.05 b | 0.13 b | 0.12 b | 6 a | 4.99 a | 5.3 a | 4.65 a | 5.3 a |
| Clostridium sensu stricto 1 | 1.88 a | 0.68 ab | 1.46 a | 0.48 a | 10.57 a | 0.06 c | 0.02 c | 0.07 c | 0.05 c | 0.63 bc |
| Lactobacillus | 48.59 | 17.11 | 36.16 | 43.75 | 31.31 | 27.88 | 12.68 | 14.1 | 24.25 | 14.22 |
| Megasphaera | 3.82 bc | 2.91 bc | 0.79 c | 2.31 bc | 4.04 abc | 3.36 abc | 6.81 a | 2.63 abc | 5.69 a | 4.25 ab |
| Romboutsia | 10.77 | 0.48 | 1.84 | 0.75 | 0.88 | 0.22 | 0.25 | 0.01 | 0.04 | 0.08 |
| Streptococcus | 1.93 b | 56.79 a | 17.83 ab | 15.63 b | 17.96 ab | 8.66 b | 14.94 ab | 13.9 ab | 7.34 b | 4.75 b |
| Turicibacter | 12.01 a | 0.56 ab | 9.56 a | 2.16 a | 6.59 a | 0.18 bc | 0.03 c | 0.17 c | 0.14 c | 0.41 c |
| Proteobacteria | | | | | | | | | | |
| Escherichia–Shigella | 3.71 ab | 0.3 ab | 13.74 a | 15.61 ab | 12.44 ab | 0.43 ab | 0.07 b | 1.2 ab | 1.69 ab | 2.27 ab |
Table 8.
Serum and ileal mucosa metabolites that differed among the dietary treatment groups.
Table 8.
Serum and ileal mucosa metabolites that differed among the dietary treatment groups.
| Metabolite | Fold Change 1 | VIP 2 | FDR 3 |
|---|
| CON− 4 vs. CON+ 5, serum d 4, post-inoculation (PI) | | | |
| oleic acid | 0.32 | 1.33 | 0.048 |
| arachidonic acid | 0.36 | 1.61 | 0.121 |
| lauric acid | 0.39 | 1.53 | 0.133 |
| methionine | 2.01 | 1.59 | 0.121 |
| malic acid | 2.32 | 1.68 | 0.100 |
| galactonic acid | 2.48 | 1.49 | 0.145 |
| pinitol | 3.15 | 1.89 | 0.048 |
| CON+ vs. 100 ppm BB2 6, serum, d 4 PI | | | |
| pinitol | 0.47 | 2.09 | 0.180 |
| CON− vs. CON+, serum, d 21 PI | | | |
| guanosine | 0.39 | 1.79 | 0.114 |
| methionine | 0.45 | 1.96 | 0.067 |
| mannose | 2.49 | 2.27 | 0.004 |
| CON+ vs. 100 ppm BB2, serum, d 21 PI | | | |
| cholesterol | 0.36 | 2.02 | 0.190 |
| aminomalonic acid | 0.44 | 1.92 | 0.190 |
| heptanoic acid | 2.25 | 2.06 | 0.190 |
| CON+ vs. 50 ppm BB2, ileal mucosa, d 5 PI | | | |
| asparagine | 0.49 | 2.35 | 0.160 |


