Article

Optimization of Submerged Culture Parameters of the Aphid Pathogenic Fungus Fusarium equiseti Based on Sporulation and Mycelial Biomass

1
College of Agriculture, Ningxia University, Yinchuan 750021, China
2
Institute of Plant Protection, Ningxia Academy of Agriculture and Forestry Sciences, Yinchuan 750002, China
*
Authors to whom correspondence should be addressed.
Microorganisms 2023, 11(1), 190; https://doi.org/10.3390/microorganisms11010190
Submission received: 21 December 2022 / Revised: 6 January 2023 / Accepted: 9 January 2023 / Published: 12 January 2023

Abstract

:
Fusarium equiseti (JMF-01), as an entomopathogenic fungus, can effectively control agricultural pests and has the potential to be a biocontrol agent. To promote mycelial growth and sporulation, we investigated the optimal submerged culture conditions for F. equiseti. In this study, we used the single-factor method and Box–Behnken design and determined the virulence of the submerged culture against Myzus persicae after optimization. As a result, the highly significant factors affecting the spore concentration of strain JMF-01 were the primary inoculum density and the initial pH, and the highly significant factor affecting the mycelial biomass was the medium-to-flask ratio. The highest mycelial biomass value was 0.35 g when the incubation time was 5.68 days, the initial pH was 5.11, the medium-to-flask ratio was 0.43, and 1 mL of the primary inoculum with spore density of 0.97 × 10⁷ conidia/mL was added. When the incubation time was 6.32 days, the initial pH was 4.46, the medium-to-flask ratio was 0.35, the primary inoculum density was 1.32 × 10⁷ conidia/mL of 1 mL, and the highest spore concentration of 6.49 × 10⁸ blastospores/mL was obtained. Compared with the unoptimized medium conditions, the optimized submerged culture had the highest mycelial biomass and spore concentration, which were 3.46 and 2.06 times higher, respectively. The optimized submerged culture was highly pathogenic toward M. persicae, reaching a 95% mortality rate. Our results provide optimal submerged culture conditions for F. equiseti and lay the basis for later research to expand production for pest control.

1. Introduction

Entomopathogenic fungi (EPF) are known to be beneficial natural enemies of insect pests [1]. Ascomycota and Entomophtoromycota include most species of entomopathogenic fungi [2]. EPF are mainly used in the environment to control pest populations [3], and the increased need for environmentally friendly pest management technologies has resulted in an increase in the use of organic biocontrollers such as microorganisms, particularly EPF [4].
Due to the fact of their prevalence in the soil and frequent connection with plant roots as saprophytes, Fusarium species are commonly referred to as soil-borne fungi [5]. Fusarium species are commonly reported as plant pathogens that cause serious diseases in a variety of plant species [6]. However, it has been demonstrated that a number of Fusarium species have moderate to severe levels of insect pathogenicity, primarily against homopterous and dipterous insects [7,8]. In terms of EPF, Fusarium species represent an important member and have the potential to be effective agents against insects [9]. The use of entomopathogenic Fusarium species for the biological management of insects is advantageous because some Fusarium isolates cause high mortalities in their insect host, do not infect the crop plant, and can also be easily propagated in the laboratory [10,11]. Several studies report the insect pathogenicity of Fusarium spp., either in the laboratory or on-field natural mycoses, such as Fusarium avenaceum and Fusarium verticillioides are pathogenic to Sitophilus oryzae and Tropidacris collaris, respectively [12]. Fusarium equiseti was isolated from Bemisia tabaci and resulted in a significant rate of mortality in B. tabaci nymphs [13]. Fusarium incarnatum-equiseti species complex (FIESC) and F. equiseti were reported to be insect pathogenic fungi that were isolated from insects and soil, which can be used to control pests [14,15,16,17,18]. FIESC isolates and extracts of Ricinus communis and Poincianella pyramidalis were successfully employed by da Silva Santos et al. [19] against Dactylopius opuntiae. Beauvericin, a cyclodepsipeptide toxin discovered from Fusarium by Gupta et al. [20], is toxic to the Colorado potato beetle. In addition, F. equiseti can also be used for pest control by producing insecticidal toxins [21,22].
Myzus persicae is one of the most diverse and polyphagous agricultural pests, which infests crops directly by draining the phloem sap or spreading viral infections from the seedling stage to harvest stage [23]. On the one hand, M. persicae is exceedingly difficult to manage solely with pesticides due to increased insecticide resistance and rapid increases in population size [24]. On the other hand, concerns regarding the excessive use of chemical pesticides make it necessary to seek safe and effective alternatives. Thus, mycoinsecticides are attracting considerable attention as environmentally friendly pest management agents [25].
Two methods of fungal growth are solid and submerged cultures. Solid culture is more favorable for sporulation because most fungi sporulate on solid media, which is easy to achieve in the laboratory, but this method is subject to many technical and economic limitations [26]. Submerged culture overcomes these restrictions by providing careful control of the initial pH, dissolved oxygen (DO) concentration, and inoculum volume to shorten incubation time, lessen labor, provide an optimal growth environment for strain growth, and reduce the risk of contamination [27,28]. Most EPF take longer to produce conidia on solid substrates and only a few days to produce blastospores on submerged media [29,30], and some studies have concluded that blastospores are more virulent than conidia [30,31,32]. However, subtle variations in host-pathogen interactions can lead to significant differences in pathogenicity [33]. Conidia of EPF often infect their hosts through a unique pathogenicity process that involves the successful adhesion, germination, differentiation, and penetration of fungal hyphae [34,35]. The blastospore, which differs from conidia, can produce copious mucilage, adhere readily to the cuticle surface, and invade through the gut following ingestion [31]. Typically, spore adhesion determines how successfully an infection spreads [7,36]. Fusarium species usually produce two types of conidia, namely macroconidia and microconidia [10,37]. Microconidia may be phialospores or blastospores [38,39]. This is due to the fact that the optimal culture conditions and medium composition vary depending on the species and occasionally even among strains of some species [40]. Therefore, we hypothesized that the production of blastospore and mycelia would reach its optimum value under submerged culture and be pathogenic to M. persicae during our tests.
Response surface methodology (RSM) is used to find the ideal combination of conditions and components that influence the biological process by measuring the response of each variable and assessing the interactions of groups of controlled factors in an experimental set [41]. Compared with the traditional techniques, RSM can not only overcome the limitations of economy and time, but also evaluate many parameters and their interactions through fewer experiments [42]. A mathematical modeling and statistical method called the Box–Behnken design (BBD) of RSM aids in optimizing conditions [43]. Previous studies used a RSM to optimize biological processes [44,45,46,47,48], BBD also has been applied in the optimization of the yield of EPF in several studies [40,49,50]. However, it has not been applied to entomopathogenic Fusarium spp. Our preliminary results showed that a Fusarium strain, JMF-01, isolated from the cadavers of M. persicae and identified as Fusarium equiseti, has promising prosperities as a biological pesticide for M. persicae [51]. Therefore, our study used the two stepwise enhancement strategies [52] to optimize the four independent culture conditions related to spore production and mycelial biomass of strain JMF-01. First, the single-factor method was utilized to evaluate the factors’ optimum values, and then the level of signed factors was optimized by the BBD method. This provides optimal submerged culture conditions for strain JMF-01 and lays the foundation for the subsequent application of F. equiseti as a biocontrol agent in agriculture.

2. Materials and Methods

2.1. Organism, Inoculum Preparation, and Culture Conditions

Strain JMF-01 was previously isolated from dead M. persicae in Helan County (Ningxia, China) in 2020. The isolation procedure was as follows; soaking the dead individuals of M. persicae in a 75% ethanol solution for 10 s, then rinsing them three times with sterile water. Cadavers were then dried on filter paper and put on PDA medium with 0.03% chloramphenicol at (25 ± 1) °C for 3 days [51]. According to Topuz et al. [3], the fresh fungal colony was picked from the edge once spore formation was observed and subcultured on freshly prepared PDA five times to obtain a purified culture. Strain JMF-01 was identified as Fusarium equiseti through morphological and molecular techniques [51]. In addition, the strain JMF-01 was inoculated in M. persicae to verify pathogenicity. At 4 °C, potato dextrose agar (PDA) plates were used to retain the purified fungus.
A spore suspension of 1 × 10⁷ conidia/mL was prepared in sterile distilled water and used as a source of inoculums.

2.2. Experimental Design

2.2.1. Preliminary Experiments: Screening of the Basic Medium

The optimum medium for the growth of strain JMF-01 was screened out of five liquid media: potato dextrose liquid medium, potato sucrose liquid medium, Sabouraud Dextrose Agar with a yeast extract liquid medium, Czapek–Dox liquid medium, and glucose yeast extract liquid medium (Table 1). Each assay was repeated three times.

2.2.2. Single Factor Experimental Design

The single factor test was conducted with the incubation time, the primary inoculum density, the medium-to-flask ratio, and the initial pH value as the factors, and the optimum liquid medium was selected through preliminary experiments as the base medium for each group of experiments. Each treatment was replicated three times. After incubation for 2 days, 2 mL was sampled each day until the 8th day to compare the spore concentration and mycelial biomass of strain JMF-01 under different conditions.

Incubation Time

Standard inoculum (1 × 10⁷ conidia/mL, 1 mL) was inoculated in each 150 mL Erlenmeyer flask containing 50 mL of potato sucrose liquid medium (pH 7). Each inoculated Erlenmeyer flask was placed on a shaker (150 rpm/min) at 28 °C for 8 days. After 4, 5, 6, 7, and 8 days of incubation, 2 mL was sampled to compare the spore concentration and mycelial biomass of strain JMF-01 under five sets of time conditions.

Initial pH

To investigate the effect of the initial pH on the growth of the strain JMF-01, the initial pH values were adjusted before sterilization using HCl (GR) or NaOH (AR) to 4.0, 5.0, 6.0, 7.0, and 8.0. One milliliter of spore suspension (1 × 10⁷ conidia/mL) was inoculated for each treatment and placed on a shaker (150 rpm/min) at 28 °C for 8 days.

Medium-to-Flask Ratio

The effect on the growth of the strain JMF-01 was investigated by setting the medium-to-flask ratio (medium volume-to-flask volume ratio) to one-third, one-quarter, one-fifth, and one-sixth. The inoculated Erlenmeyer flask was placed on a shaker (150 rpm/min) at 28 °C for 6 days.

Primary Inoculum Density

To study the effect of the primary inoculum density on the spore concentration and mycelial biomass of strain JMF-01, five groups of inoculum levels were set at 0.25, 0.5, 1, 1.5, and 2 (107 conidia/mL), and one milliliter of spore suspension was added to each Erlenmeyer flask. At 28 °C (150 rpm/min), the inoculated Erlenmeyer flasks were set on a shaker.

2.2.3. Assessment of Sporulation and Mycelial Production

The liquid medium at the end of incubation was centrifuged (10,000 r/min for 20 min) or filtered by gauze, and then the mycelium was placed in a drying oven and dried at 85 °C to a constant weight, and its mycelium dry weight was recorded.
The spore concentration was measured using a hemocytometer plate [53].

2.2.4. Box–Behnken Design

The next step was to use the findings of the single-factor experiment to guide the design of each factor and level in a BBD. We used the optimal liquid medium selected through preliminary experiments as the base medium. Response surface optimization was performed with the production of JMF-01 spores and mycelia as the response values, and a four-factor, three-level response analysis was conducted to optimize the four factors affecting the strain JMF-01 submerged culture. The experimental design’s ranges and levels are displayed in Table 2.
The method of multiple regression was then used to fit the data to a second-order polynomial equation. This led to the development of an empirical model that connected the measured response to the experiment’s independent factors. The model equation for a four-factor system is as follows:
Y = b 0 + b 1 X 1 + b 2 X 2 + b 3 X 3 + b 11 X 1 2 + b 22 X 2 2 + b 33 X 3 2 + b 12 X 1 X 2 + b 13 X 1 X 3 + b 23 X 2 X 3
where Y stands for the predicted response; b0 is the mean effect; b1, b2, and b3 are the linear coefficients; b11, b22, and b33 are the squared coefficients; b12, b13, and b23 are the interaction coefficients.
The coefficient of determination (R2) determines the polynomial model equation’s goodness of fit. We tested the adequacy of the model using the F-value test and coefficient of determination (R2) test. The possibility of improving mycelia and spore production was analyzed using response surface contour plots.

2.2.5. Verification Test

Three validation tests were performed under the optimal submerged culture conditions obtained using Design-Expert 12 software, and the corresponding response values were averaged from the results of the three tests and compared with the predicted response values of the regression model. Unoptimized submerged culture was obtained by initial submerged culture conditions, which was in each 150 mL flask containing 50 mL of the base medium (pH 7) and primary inoculum density was 1 mL (1 × 10⁷ conidia/mL) for 8 days.

2.3. Pathogenicity Test

The pathogenicity of the submerged culture of strain JMF-01 under submerged culture against M. persicae was evaluated in the laboratory. Brassica oleracea leaves were trimmed, and the adult aphids were removed from a colony that was kept in a green-house. Approximately 30 wingless adults were retained on each Brassica oleracea leaf disc and sprayed with optimized submerged culture [54]. Optimized submerged culture was screened through preliminary experiments and BBD. After being sprayed with submerged culture, the leaf discs were dried at room temperature and placed in Petri dishes (d = 9 cm) lined with filter paper, wrapped with moist cotton to cover the petiole, sealed with cling film, and tied, allowing for holes to maintain the air circulation. Sterile water was treated as a control. The treatments were incubated in a light incubator at 25 ± 1 °C, RH (80 ± 5) %, and a photoperiod L:D = 14:10 h. Each treatment was replicated three times. The number of dead peach aphids was counted every 24 h, and the peach aphids were observed under a microscope for staining; deaths were recorded by lightly touching the insects with a fine brush. The total observation period was 7 days.

2.4. Statistical Analysis

The summary statistics are presented as the mean ± standard error of the mean (SEM) since each experiment was done three times independently. The one-way ANOVA with Tukey HSD test was used to examine the data of the single-factor tests and the verification test. Significant differences between sample mean values were defined as those with p < 0.05. Design-Expert software (version 12.0.0, Stat-Ease Inc., Minneapolis, MN, USA) was utilized to evaluate data from the BBD. The survival of M. persicae was evaluated using a Kaplan-Meier analysis followed by a log-rank test (p < 0.001).

3. Results

3.1. Single-Factor Experiments

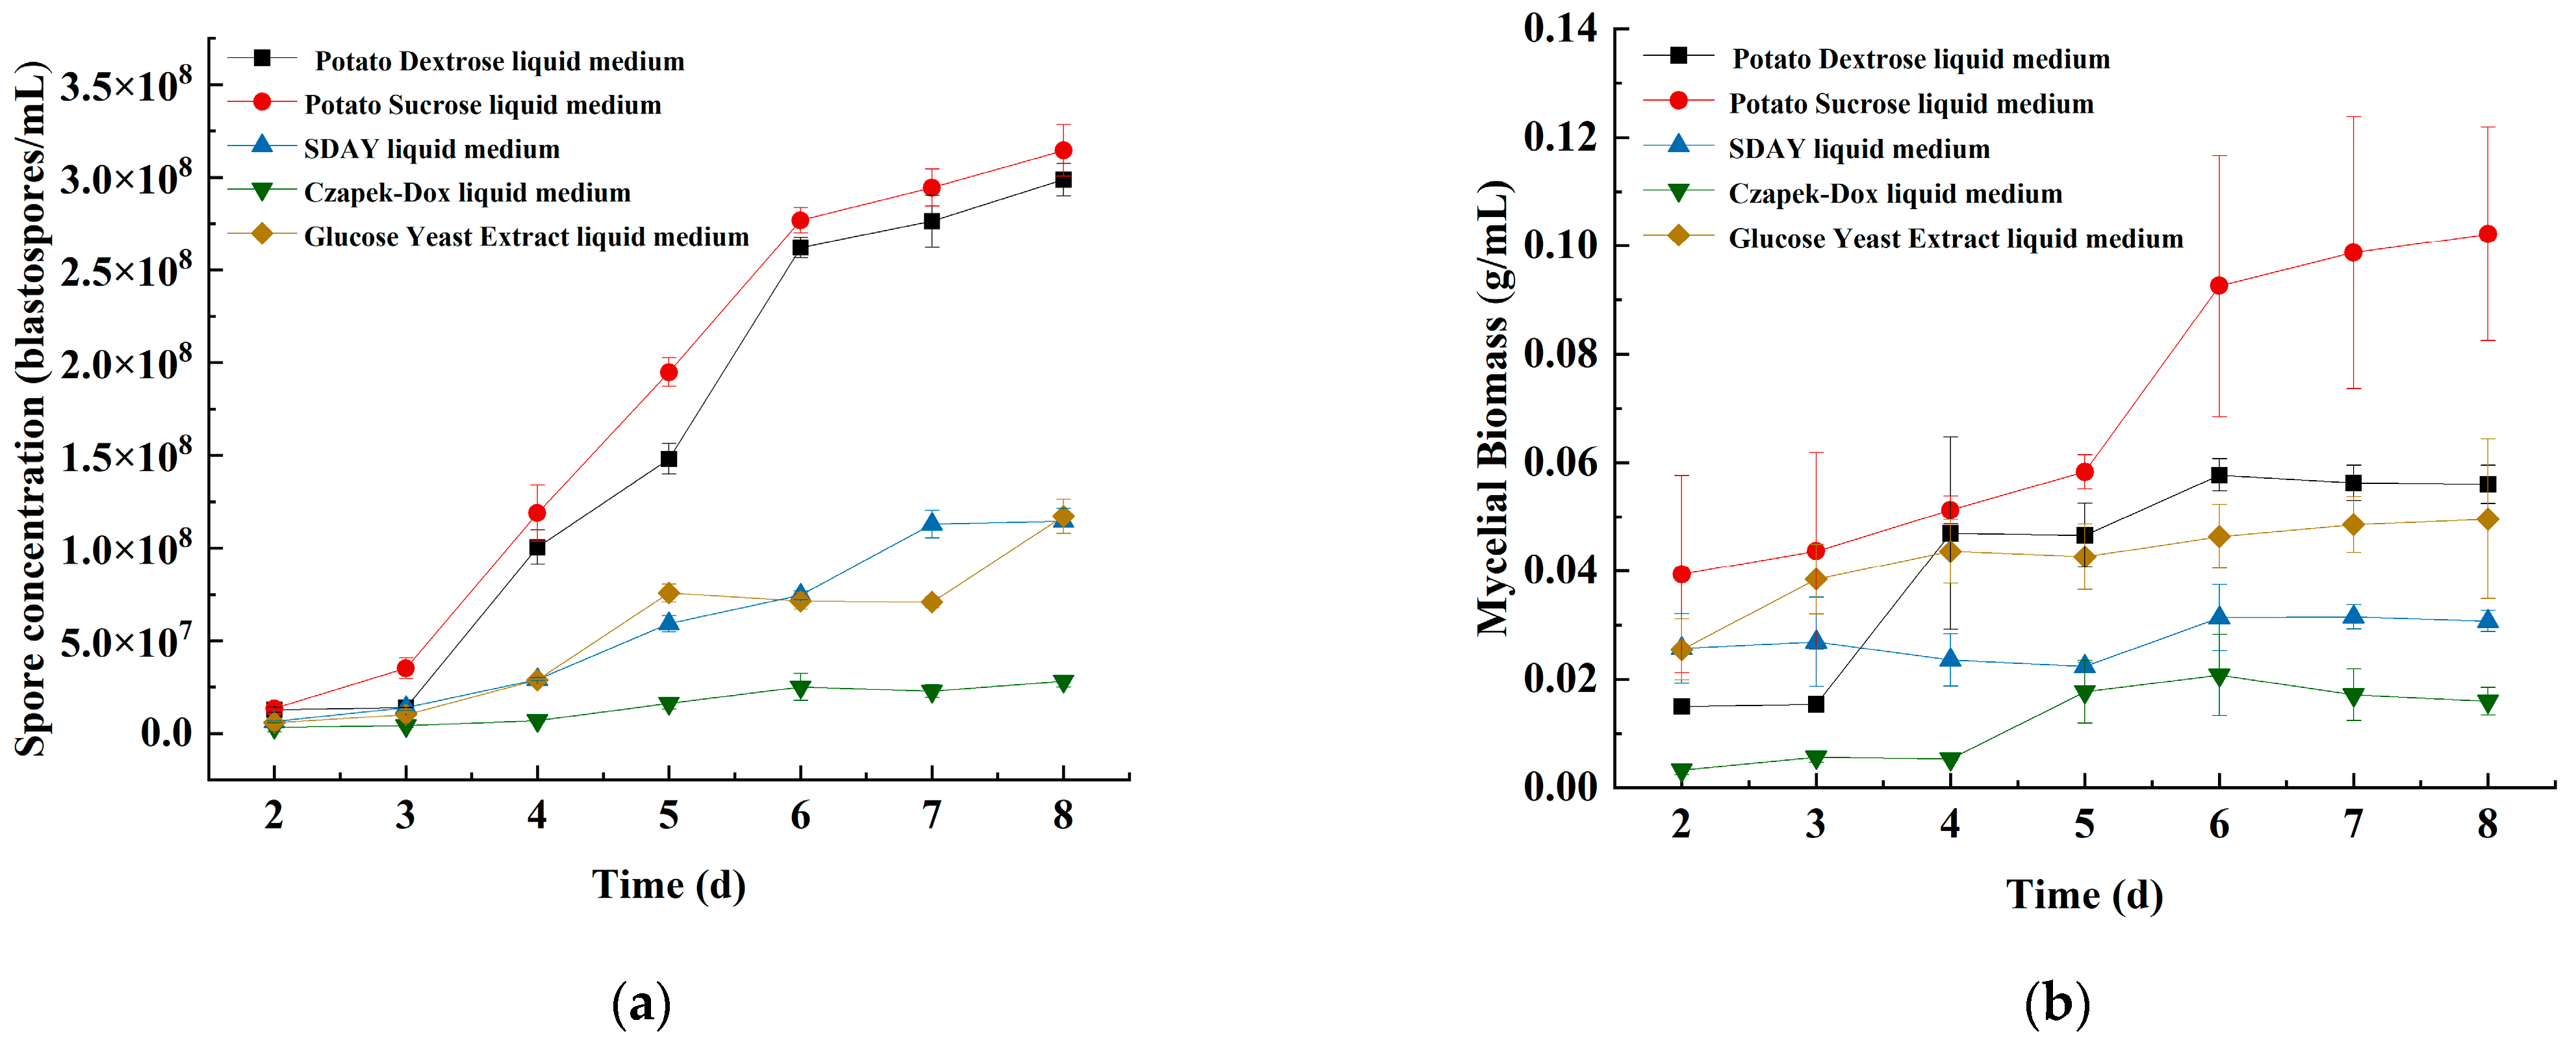
3.1.1. The Effects of the Basic Submerged Medium and Incubation Time on Spore Concentration and Mycelial Biomass

After eight days of incubation treatment in the five liquid media, the spore concentration and mycelial biomass of strain JMF-01 cultured in potato sucrose liquid media were 3.15 × 10⁸ blastospores/mL and 0.10 g/mL, respectively, which were significantly higher than for the other media (Tukey’s test, p < 0.05). Therefore, potato sucrose liquid medium was screened as the base medium for each group of experiments.
After 2 days of incubation, the spore concentration and mycelial biomass showed a rapid growth trend with the incubation time until the 6th day. After 6 days of incubation, the spore concentration grew slowly, while the mycelial biomass decreased slightly. Thus, the optimal incubation time was 6–8 days (Figure 1, Tables S1 and S2).

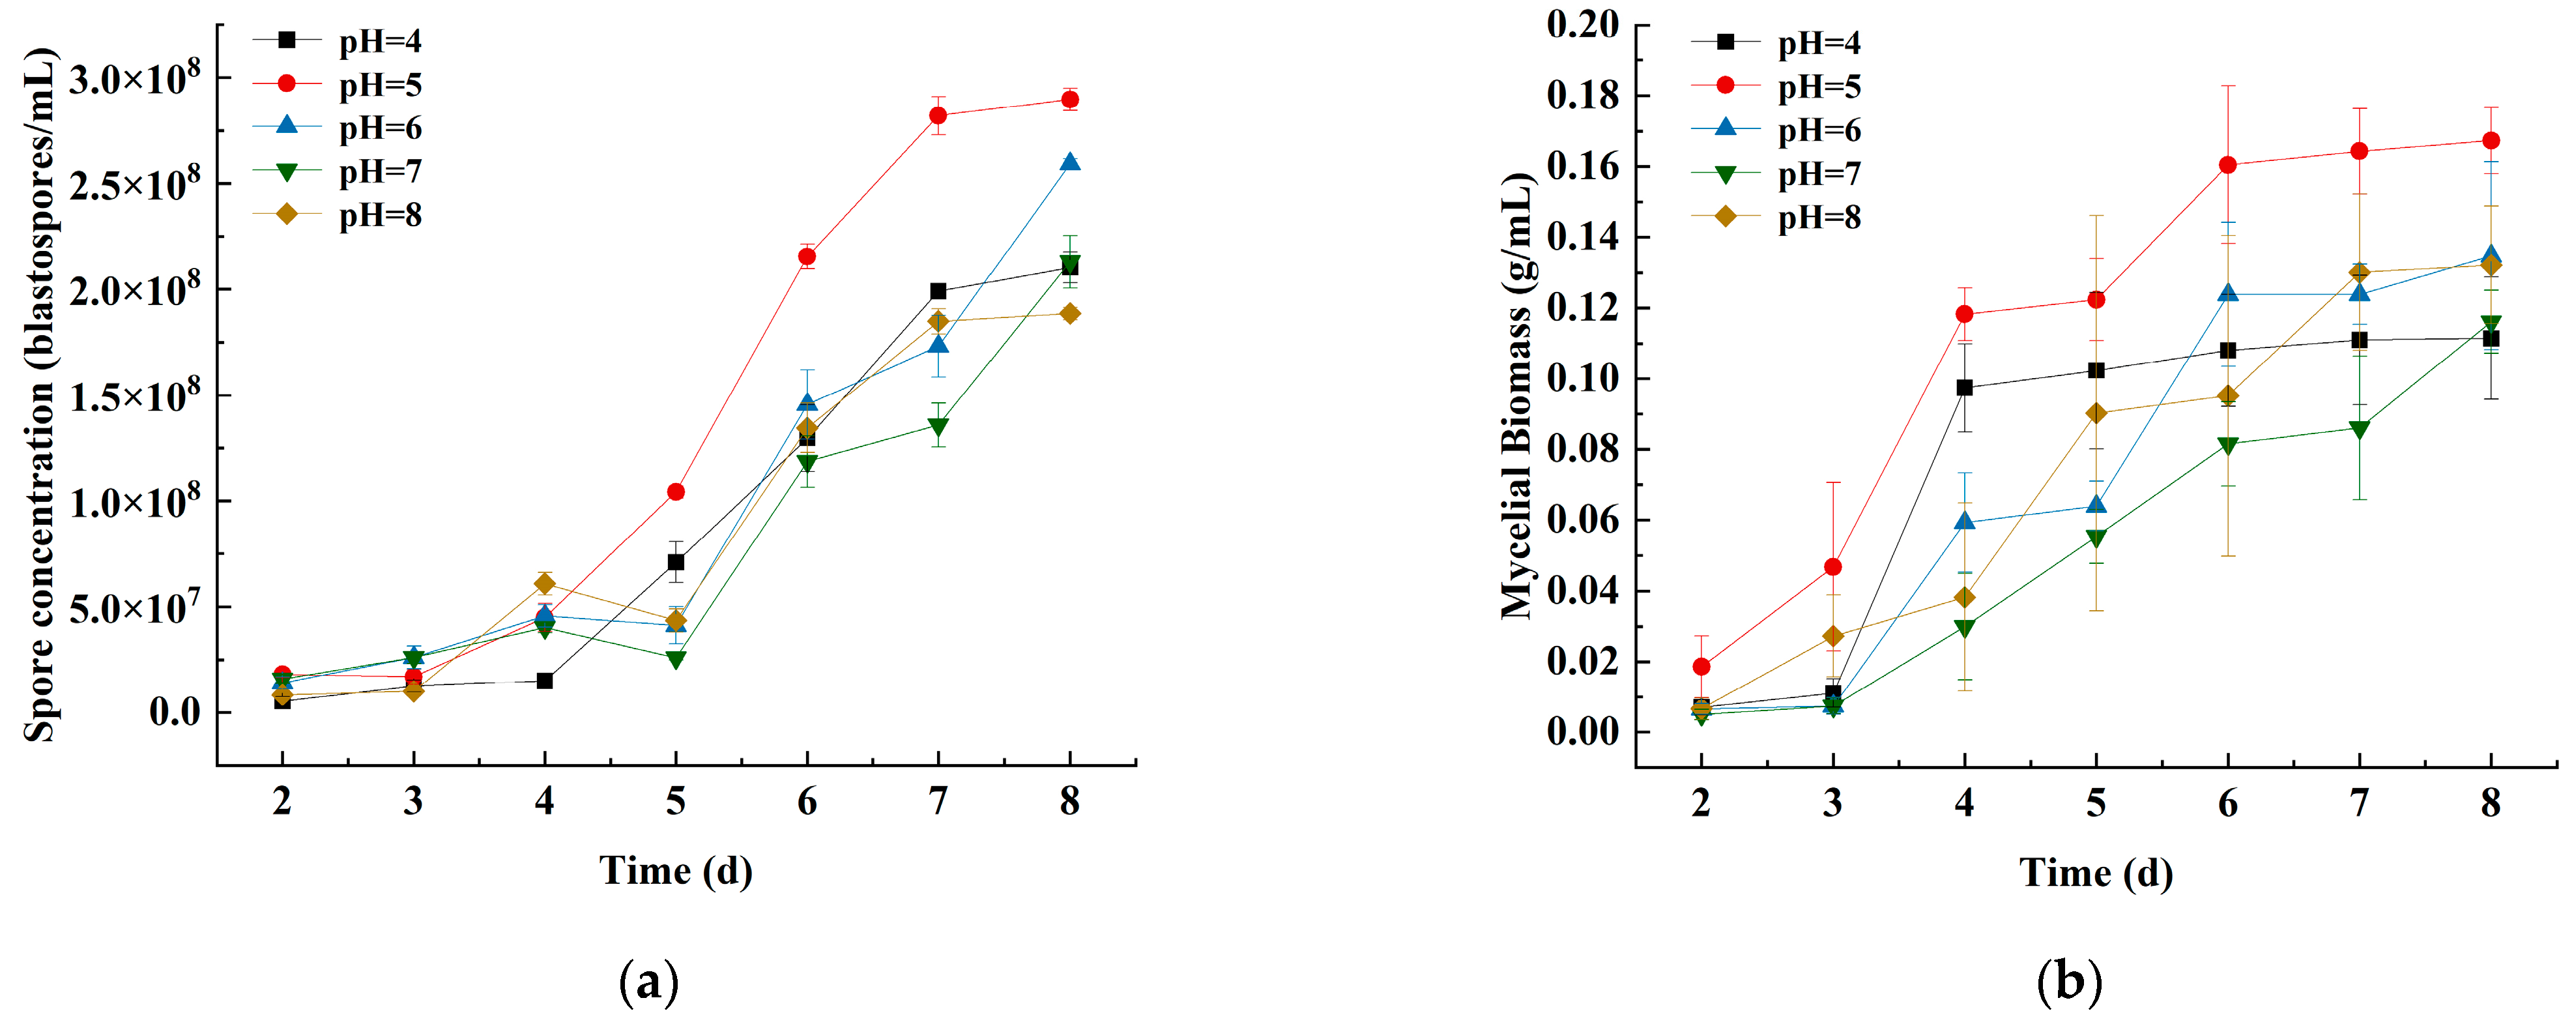
3.1.2. Effects of the Initial pH on Spore Concentration and Mycelial Biomass

The initial pH of the submerged culture had basically the same trend as the spore concentration and mycelial biomass of strain JMF-01. At an initial pH of 4–8, strain JMF-01 could grow, but too strong acidity and alkalinity were not conducive to the growth of strain JMF-01 (Figure 2, Tables S1 and S2). At an initial pH of 5, the spore concentration and mycelial biomass of strain JMF-01 reached the maximum value of 2.90 × 10⁸ blastospores/mL and 0.17 g/mL, respectively (Tukey’s test, p < 0.05, compared to others).

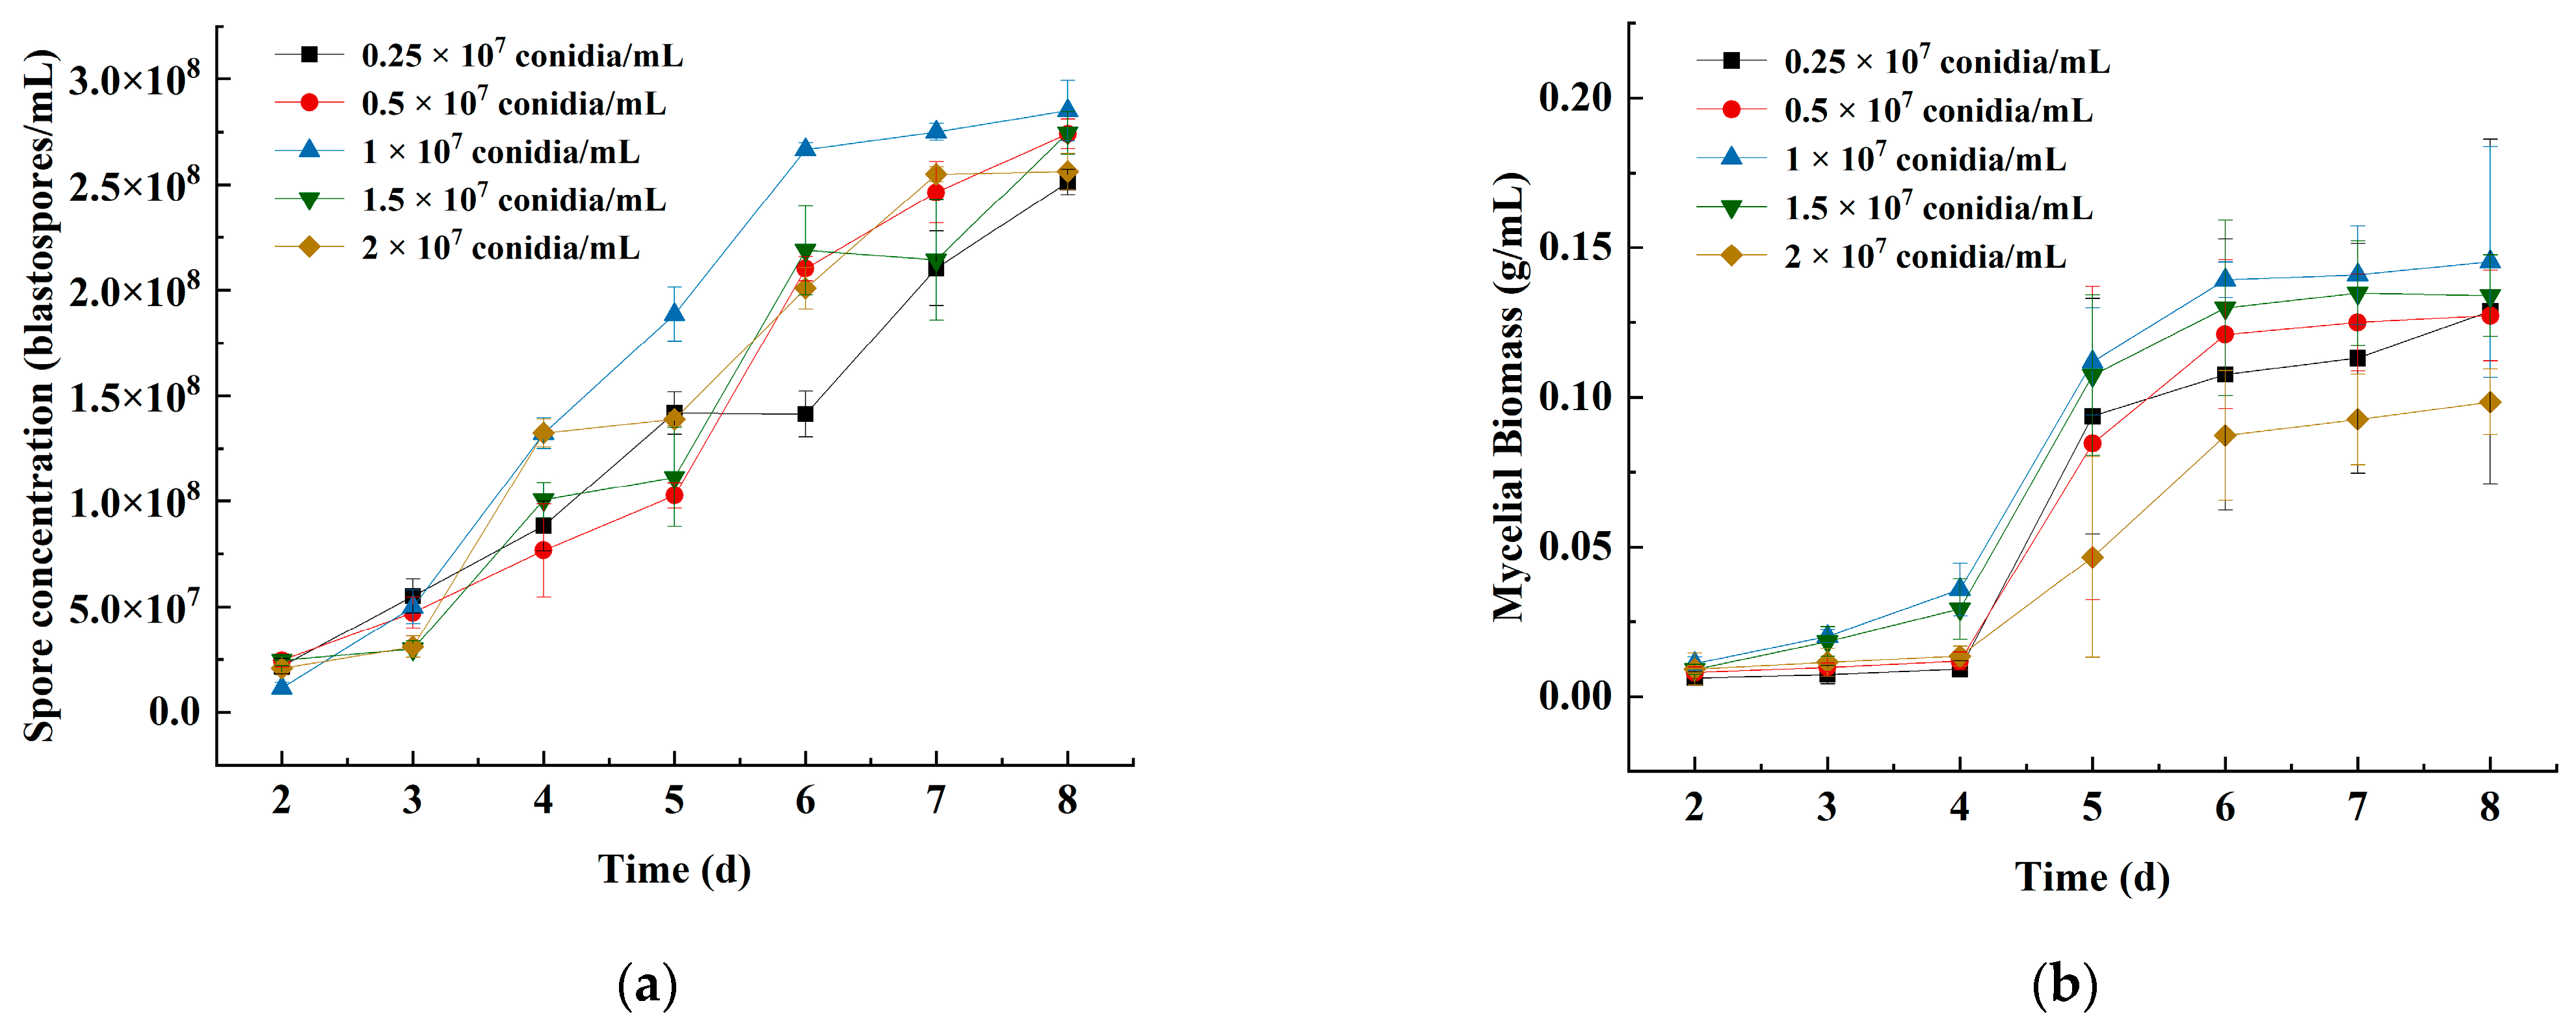
3.1.3. Effects of the Primary Inoculum Density on Spore Concentration and Mycelial Biomass

The spore concentration and mycelial biomass of strain JMF-01 were highest at an inoculum level of 1 × 10⁷ conidia/mL after 6 days with 2.85 × 10⁸ blastospores/mL (Tukey’s test, p < 0.05, compared to other primary inoculum densities) and 0.15 g/mL (Tukey’s test, p = 0.73), respectively. However, the spore concentration and mycelial biomass of strain JMF-01 were lower at inoculum levels of 0.25 × 10⁷ conidia/mL and 2 × 10⁷ conidia/mL, indicating that higher or lower inoculum levels were not favorable to the submerged culture of the strain (Figure 3, Tables S1 and S2).

3.1.4. Effects of the Medium-to-Flask Ratio on Spore Concentration and Mycelial Biomass

The growth curve of strain JMF-01 increased with the increase in the medium-to-flask ratio and reached the highest when the medium-to-flask ratio was one-third (Figure 4, Tables S1 and S2). The spore concentration and mycelial biomass were 2.59 × 10⁸ blastospores/mL and 0.063 g/mL, respectively (Tukey’s test, p < 0.05, compared to other treatments). When the medium-to-flask ratio was one-sixth, the spore concentration and mycelial biomass were the lowest (Tukey’s test, p < 0.05), indicating that a too low medium-to-flask ratio is not conducive to the growth of strain JMF-01.
The findings revealed that the spore concentration and mycelial biomass of the strain both reached their maximums when the incubation time was 6 days, the initial pH value was 5, the medium-to-flask ratio was one-third, and the primary inoculum density was 1 × 10⁷ conidia/mL.

3.2. Box–Behnken Design

The optimal values for the four variables, incubation time, initial pH, medium-to-flask ratio, and primary inoculum density, were chosen as the center level based on the findings of the single factor studies, and the spore concentration and mycelial biomass of strain JMF-01 were used as the response values. The response surface optimization of the four factors and three levels was carried out using Design Expert 12, and the central point experiment was repeated five times for a total of 29 experiments. The coding of each factor is shown in Table 2, and the experimental design and results are shown in Table 3. Multiple regression fitting was performed on the experimental results in Table 3:
YS (Spore concentration) = 6.06 + 0.0799 A 0.6576 B 0.0361 C + 0.7542 D 0.4437 AB + 0.2521 AC + 0.4896 AD 0.5292 BC 0.0833 BD 0.2396 CD 1.05 A 2 0.8847 B 2 0.4544 C 2 0.7190 D 2
YM (Mycelial biomass) = 0.3053 0.0175 A + 0.0013 B + 0.0851 C + 0.0036 D + 0.0176 AB + 0.0009 AC 0.0059 AD + 0.0110 BC + 0.0062 BD 0.0095 CD 0.0224 A 2 0.0287 B 2 0.0405 C 2 0.0251 D 2
The analysis of variance for the spore concentration of strain JMF-01 (Table 4) showed that the fitted model was highly significant (p < 0.0001), and the out-of-fit term (p = 0.4028) was greater than 0.1. The out-of-fit test was not significant, indicating that the model was built to cover all of the data. The difference between the coefficient of determination of the regression model (R2 = 0.9355) and the corrected coefficient of determination (adjusted R2 = 0.8709) was less than 0.2, indicating that the equation fit well with the experimental results [55]. The significance test of the coefficients in the regression equation showed that B, D, A2, B2, C2, and D2 were highly significant (p < 0.01), AB, AD, and BC were significant (p < 0.05), and the rest were insignificant. The analysis of the F-value showed that the main and secondary factors affecting the spore concentration of strain JMF-01 were primary inoculum density (D) > initial pH (B) > incubation time (A) > medium-to-flask ratio (C).
By analyzing the regression equation for the mycelial biomass of strain JMF-01 (Table 5), the model was found to be highly significant (p < 0.0001), and the difference in the out-of-fit term was not significant (0.3428), indicating that the model was reliable. The coefficient of determination of the model, R2 = 0.9450, was similar to the corrected coefficient of determination, adjusted R2 = 0.8900, indicating that the predicted values of mycelial biomass in the model were highly correlated with the experimental values. In the model, C, B2, C2, and D2 were highly significant, A and A2 were significant, and the rest were not significant. The analysis of the F-value showed that the main and secondary factors affecting the mycelial biomass of strain JMF-01 were medium-to-flask ratio (C) > incubation time (A) > primary inoculum density (D) > initial pH (B).

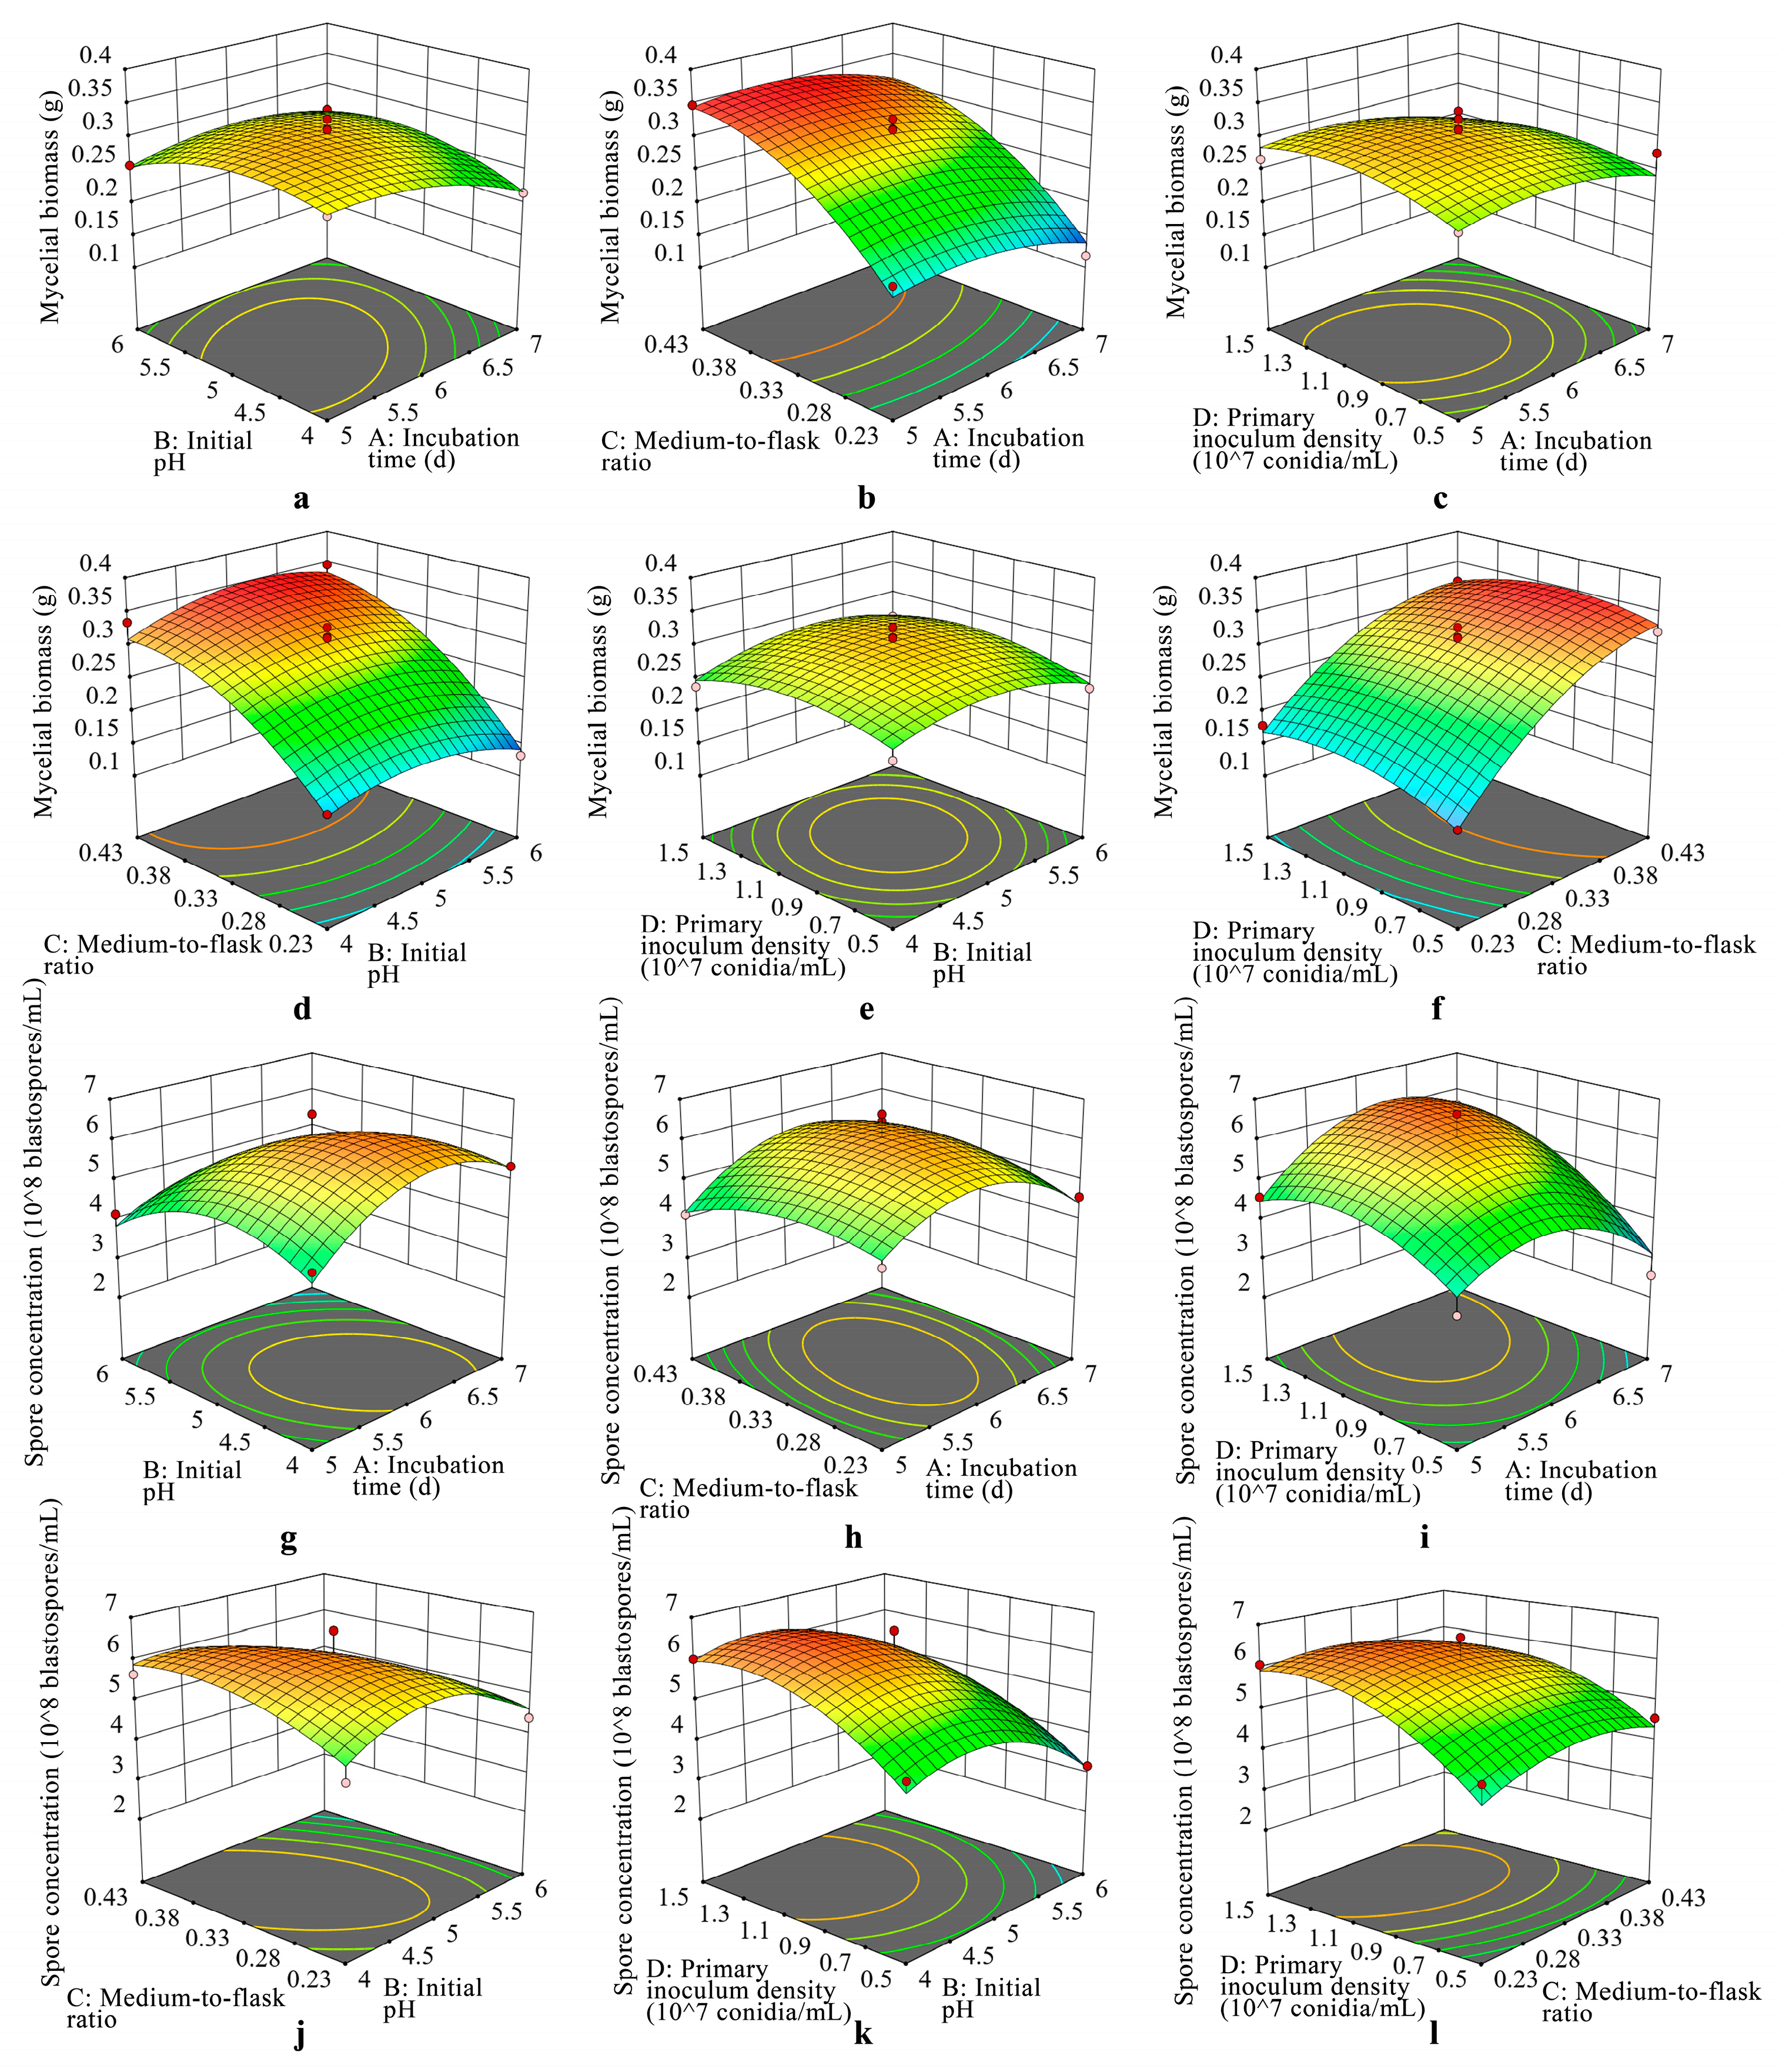
3.3. 3D Response Surfaces and 2D Contour Analysis

The response surface and contour plots were drawn by the software Design Expert 12, which could directly reflect the effects of various submerged culture conditions on the spore concentration and mycelial biomass of strain JMF-01 (Figure 5). The more the research factors influence the response value, the steeper the three-dimensional map is in the response surface graphic. When the contour shape is oval, the interaction between factors is significant, and when the contour shape is round, the interaction is not significant. For the contour line, the farther the distance between the center and the surrounding contour line, the greater the slope of the three-dimensional surface map, and the more significant the impact [56].
The effects of the incubation time (A) and the initial pH (B) on the mycelial biomass (Figure 5a) and spore concentration (Figure 5g) of strain JMF-01 were investigated when the medium-to-flask ratio (C) and the primary inoculum density (D) were constant. The mycelial biomass reached its maximum in the interval of an incubation time of 5–6 days and an initial pH of 4.5–5.5, while the spore concentration of strain JMF-01 reached its maximum in the interval of an incubation time of 5.5–6.5 days and an initial pH of 4–5. The spore concentration and mycelial biomass both showed a tendency of growing and then declining with the increase in initial pH when the incubation period was constant, and the spore concentration and mycelial biomass likewise showed this trend when the initial pH was constant. The contours of the spore concentration and mycelial biomass of strain JMF-01 were elliptical, and the response surfaces were parabolic and opened downward, indicating that the incubation time and initial pH had significant effects on the spore concentration and mycelial biomass of the strain.
The effects of the incubation time (A) and the medium-to-flask ratio (C) on the mycelial biomass (Figure 5b) and spore concentration (Figure 5h) of strain JMF-01 were investigated when the initial pH (B) and the primary inoculum density (D) were constant. The spore concentration of strain JMF-01 had the highest value at an incubation time of 5.5–6.5 days and a medium-to-flask ratio of 0.28–0.38. And the contour line was elliptical, indicating that the interaction between incubation time and medium-to-flask ratio was more significant. When the incubation time was constant, the mycelial biomass showed an increasing trend with the increase in the medium-to-flask ratio. The response surface curve had a large slope, and the central contour was far away from the surrounding contours, indicating that the effect of the medium-to-flask ratio on the mycelial biomass was highly significant.
When the initial pH (B) and the medium-to-flask ratio (C) were constant, the effects of the incubation time (A) and the primary inoculum density (D) on the mycelial biomass (Figure 5c) and spore concentration (Figure 5i) of strain JMF-01 were investigated. The spore concentration of strain JMF-01 reached its maximum at an incubation time of 5.5–6.5 days, and the primary inoculum density was between 0.9 × 10⁷ and 1.5 × 10⁷ conidia/mL. The 3D surface plot showed a parabola with a large slope and an elliptical contour, indicating that the incubation time and primary inoculum density had a significant effect on the spore concentration. The contour of the mycelial biomass was nearly elliptical, indicating that the interaction between the incubation time and the primary inoculum density was significant.
When the incubation time (A) and the primary inoculum density (D) were constant, the effects of the initial pH (B) and the medium-to-flask ratio (C) on the mycelial biomass (Figure 5d) and spore concentration (Figure 5j) of strain JMF-01 were investigated. At a constant initial pH, mycelial biomass increased with increasing the medium-to-flask ratio, while spore concentration increased and then decreased. The slope of the response surface of mycelial biomass was large, while the slope of the surface of spore concentration was small, indicating that the effect of the medium-to-flask ratio on mycelial biomass was larger than that of spore concentration.
When the incubation time (A) and the medium-to-flask ratio (C) were constant, the effects of the initial pH (B) and primary inoculum density (D) on the mycelial biomass (Figure 5e) and spore concentration (Figure 5k) of strain JMF-01 were tested. At a constant primary inoculum density, the mycelial biomass and spore concentration both grew and then dropped with the rise in initial pH. However, the spore concentration increased with the increase in the inoculum level at a constant initial pH, indicating that the effect of the inoculation level on spore concentration was greater than that of the mycelial biomass. The contour plot was elliptical, indicating that the interaction between the initial pH and the primary inoculum density was more significant.
When the incubation time (A) and the initial pH (B) were constant, the effects of the medium-to-flask ratio (C) and the primary inoculum density (D) on the mycelial biomass (Figure 5f) and spore concentration (Figure 5l) of strain JMF-01 were investigated. The slope of the 3D surface plot of the spore concentration and mycelial biomass of strain JMF-01 was large, which indicated that the medium-to-flask ratio and primary inoculum density significantly affected the submerged culture growth of strain JMF-01.

3.4. Verification Test

The model calculated the optimal submerged culture conditions for the mycelial biomass; the incubation time was 5.68 days, the initial pH was 5.11, the medium-to-flask ratio was 0.43, and 1 mL of the primary inoculum with a spore density of 0.97 × 10⁷ conidia/mL was added, and the highest value of 0.35 g was obtained. The actual incubation time was 5.7 days, the initial pH was 5, the medium-to-flask ratio was 0.43, and the primary inoculum density was 1 × 10⁷ conidia/mL. The mycelial biomass was experimentally verified to be (0.29 ± 0.066) g.
The optimal submerged culture conditions for spore concentration were calculated by the model: the highest spore concentration of 6.49 × 10⁸ blastospores/mL was obtained when the incubation time was 6.32 days, the initial pH was 4.46, the medium-to-flask ratio was 0.35, and the primary inoculum density was 1.32 × 10⁷ conidia/mL of 1 mL. The actual incubation time was 6.3 days, the initial pH was 4.5, the medium-to-flask ratio was 0.35, and the primary inoculum density was 1.3 × 10⁷ conidia/mL. It was experimentally verified that the spore concentration was (5.88 ± 0.62) × 108 blastospores/mL.
Compared with the unoptimized medium conditions, the optimized submerged culture had the highest spore concentration (Figure 6A) and mycelial biomass (Figure 6B), which were 2.06 and 3.46 times higher, respectively. The validation tests were performed three times. The model’s ability to accurately represent the growth of strain JMF-01 under various submerged culture conditions can be seen by the small errors between experimental values and predicted values.

3.5. Pathogenicity Test

Optimized submerged culture was obtained by using potato sucrose liquid medium (pH 4.5), the primary inoculum density was 1.3 × 10⁷ conidia/mL and medium-to-flask ratio was 0.35 (52.5 mL in each 150 mL flask) for 6.3 days. The survival of the optimized submerged culture after the treatment of peach aphids is shown in Figure 7.

4. Discussion

In this paper, the submerged medium suitable for the growth of strain JMF-01 was first selected, followed by single-factor tests to screen the optimal values of incubation time, primary inoculum density, medium-to-flask ratio, and initial pH. And then the interaction between the factors was evaluated using RSM to obtain a submerged culture process with a higher yield.
After incubation, the medium with the highest mycelial biomass and spore concentration produced by strain JMF-01 was potato sucrose liquid medium, and the optimal incubation time was 6–8 days. This result is similar to that of Pradeep et al. [57], who found that the mycelial dry weight and pigment yield of Fusarium moniliforme remained essentially constant after 8–10 days of incubation. The spore concentration of strain JMF-01 increased slowly after 6 days, while mycelial biomass showed a slight decrease after 6 days, probably due to the phenomenon of mycelial autolysis. The optimum incubation time in this study was similar to Tang et al. [58], who reported an optimum incubation time of 6 days for Fusarium solani in order to produce vitexin. Anellis et al. [59] found that six strains of Clostridium botulinum produced the maximum number of spores in 5–6 days, and Das et al. [60] incubated Purpureocillium lilacinum at 30 °C for 6 days to obtain the maximum number of spores. The creation of an essential medium that supported proper fungal culture growth and propagule formation was the first step in our optimization method. Depending on the nutritional needs for sporulation in submerged culture, the maximum spore concentration for some fungi can be a fixed value. Because of this, the development of incubation conditions can lead to more rapid sporulation. Therefore, reduced incubation time can often be the most important fungal biopesticide production method factor in reducing production costs.
The growth, development, and metabolism of fungi are all significantly influenced by a medium pH [53]. The results show that strain JMF-01 could grow over a wider medium pH range of 4.0–8.0. However, the maximum spore concentration and mycelial biomass of the strain were reached in the medium at pH 5, and the growth was lower outside of this medium pH range. The response surface optimization of the strain JMF-01 submerged culture spores and mycelia was optimal at an initial pH of 4.5 and 5.1, respectively, which is similar to the optimum pH for enzyme production of Fusarium solani, growth of Fusarium oxysporum, and maximum spore production of Beauveria bassiana [58,61,62,63]. However, the optimum pH for mycelial growth of F. equiseti found by Punja et al. [64] was 7.2–7.8. The capacity of entomopathogens to grow below pH 7 is beneficial during industrial production even if the pH of entomopathogens is ideal over a wide range because it allows for the reduction of substrate pH for the suppression of bacterial growth [65]. Moreover, different strains have different requirements for an initial pH.
Since DO is also likely to affect sporulation, these early flask culture observations may reflect changes in oxygen supply and demand brought on by biomass [66]. The cost of oxygen transfer is a significant part of the total production budget for mycelial cultures. The effect of aeration on the growth of strain JMF-01 was studied by changing the medium-to-flask ratio (volume of the medium to volume of the flask ratios (v/v)). The maximum biomass production and spore concentration were observed at a medium-to-flask ratio of 0.43 and 0.35 (v/v), respectively. According to Kumar et al. [67], Aspergillus niger showed the highest inulinase production at a medium-to-shake flask ratio of 1:20. In a study by Niaz et al. [68], Aspergillus nidulans recorded the highest extracellular lipase activity at a medium volume of 45 mL.
The inoculum size not only has a direct impact on the overall production yield, but it also affects the production cost [69,70,71]. We set the primary inoculum density to five values and screened the most suitable strain, JMF-01, by single-factor experiment to 1 × 10⁷ conidia/mL of spore suspension. The response surface optimization found that the optimum primary inoculum density for mycelium-producing biomass was 0.97 × 10⁷ conidia/mL, and the spore concentration was highest at 1.32 × 10⁷ conidia/mL. Our results were consistent with those of Santa et al. [72]. Alabdalall et al. [73] found that the optimum primary inoculum density for extracellular lipase production by A. niger was 2.5 × 10⁷ spores/mL. However, the mycelial biomass and spore concentration of strain JMF-01 decreased when the primary inoculum density was higher than 1 × 10⁷ conidia/mL or lower than 1 × 10⁷ conidia/mL. To balance the levels of nutritional components present in the submerged environment for ideal fungal development, the proper primary inoculum density is a crucial factor [73]. With a small inoculum size, it’s possible that there aren’t enough cells in the submerged culture to make use of the substrate needed to encourage the growth of fungal mycelium and the production of conidia. However, with a large inoculum size, the submerged medium may become more viscous due to the rapid growth of fungi, which could lead to a nutritional imbalance in the medium or excessive nutrient intake before the cells in the submerged culture are physiologically prepared to begin fungal production [34,74].
The beginning of sporulation is influenced by a wide range of environmental and nutritional conditions, and each species has unique characteristics. RSM is a well-established statistical technique that makes statistical predictions and evaluations while using economical experimental designs [75]. In this paper, BBD in RSM was applied to optimize the submerged culture conditions of strain JMF-01 to screen for optimal submerged culture conditions. The response surface methodology simplifies the experimental design into an optimization process of 29 trials, yet many factors and their interrelationships can be studied in less time with less labor.
The multiple coefficients of correlation, R and F values, were assessed in order to test the goodness of fit of the regression equation for strain JMF-01 submerged culture using the uniform design approach. The stronger the correlation between the obtained and predicted values, the closer R is to 1. Mycelial biomass and spore concentration both had R values of 0.9450 and 0.9355, respectively, indicating good agreement between experimental and predicted values. The F value is calculated as the ratio between the regression’s mean square and the real error’s mean square. In general, if the model accurately predicts the experimental data and the estimated factor effects are valid, the computed F value should be several times higher than the tabulated F value [76]. The estimated F values in this instance, which were 17.18 for the mycelial biomass and 14.49 for the spore concentration, exceeded the tabulated F values.
In this study, three-dimensional surface plots could clearly show that the medium-to-flask ratio significantly affected the mycelial biomass production of strain JMF-01, while the primary inoculum density and the initial pH significantly affected the spore production of the strain. The effect of medium and submerged culture conditions on the production of the entomopathogenic fungus, F. equiseti, has not been studied in depth. However, in other fungi, the positive induction of fungal production of spore and other metabolites by appropriate inoculum and an acidic initial pH has been documented. Santos et al. [77] reported that an acidic pH tends to increase the production of bikaverin by F. oxysporum. Chi et al. [78] found that a higher medium-to-flask ratio was more favorable for liquid culture aimed at obtaining mycelial biomass, and for liquid culture production in which spores have been obtained, the initial inoculum had a greater impact. According to Srivastava et al. [79], fungal growth appeared to be inversely correlated with pH variation since more fungal growth was observed when the pH was lowered.

5. Conclusions

The improvements in mycelial biomass and spore concentration that were attained through further optimization phases were around 3.46 and 2.06 times, respectively, larger than those attained under unoptimized conditions. Therefore, the optimization of submerged culture conditions had a great impact on the growth of strain JMF-01. Moreover, the optimized submerged culture was highly virulent against M. persicae, with a 95% mortality rate after 7 days (LT50 = 3.74 days). The results clearly support the previous conclusions of other researchers that optimized medium and submerged culture conditions are the main control for the entomopathogenic F. equiseti, as the main control factor for the production of biocontrol preparations [34,80].

Supplementary Materials

The following supporting information can be downloaded at: https://www.mdpi.com/article/10.3390/microorganisms11010190/s1, Table S1: Single-factor test for the spore concentration by strain JMF-01 (mean ± SEM); Table S2: Single-factor test for the mycelial biomass by strain JMF-01 (mean ± SEM).

Author Contributions

Conceptualization, methodology, project administration, funding acquisition, writing—review and editing, Y.J.; project administration, F.W.; supervision, writing—review and editing, J.C.; software, validation, formal analysis, investigation, resources, data curation, writing—original draft preparation, visualization, X.Z. All authors have read and agreed to the published version of the manuscript.

Funding

This research was funded by the Ningxia Agricultural High-quality Development and Ecological Protection Technology Innovation Demonstration Project, grant number: NGSB-2021-10-04.

Data Availability Statement

Not applicable.

Acknowledgments

We are grateful to Ruotong Wang, Siyuan Yan and Mingxiu Ju for assistance in software operation.

Conflicts of Interest

The authors declare no conflict of interest.

References

  1. Hajek, A.E.; St Leger, R.J. Interactions Between Fungal Pathogens and Insect Hosts. Annu. Rev. Entomol. 1994, 39, 293–322. [Google Scholar] [CrossRef]
  2. Litwin, A.; Nowak, M.; Różalska, S. Entomopathogenic fungi: Unconventional applications. Rev. Environ. Sci. Bio/Technol. 2020, 19, 23–42. [Google Scholar] [CrossRef] [Green Version]
  3. Topuz, E.; Erler, F.; Gumrukcu, E. Survey of indigenous entomopathogenic fungi and evaluation of their pathogenicity against the carmine spider mite, Tetranychus cinnabarinus (Boisd.), and the whitefly, Bemisia tabaci (Genn.) biotype B. Pest Manag. Sci. 2016, 72, 2273–2279. [Google Scholar] [CrossRef] [PubMed]
  4. Mascarin, G.M.; Lopes, R.B.; Delalibera, Í.; Fernandes, É.K.K.; Luz, C.; Faria, M. Current status and perspectives of fungal entomopathogens used for microbial control of arthropod pests in Brazil. J. Invertebr. Pathol. 2019, 165, 46–53. [Google Scholar] [CrossRef] [PubMed]
  5. Batta, Y. The first report on entomopathogenic effect of Fusarium avenaceum (Fries) Saccardo (Hypocreales, Ascomycota) against rice weevil (Sitophilus oryzae L.: Curculionidae, Coleoptera). J. Entomol. Acarol. Res. 2012, 44, 11. [Google Scholar] [CrossRef] [Green Version]
  6. Hami, A.; Rasool, R.S.; Khan, N.A.; Mansoor, S.; Mir, M.A.; Ahmed, N.; Masoodi, K.Z. Morpho-molecular identification and first report of Fusarium equiseti in causing chilli wilt from Kashmir (Northern Himalayas). Sci. Rep. 2021, 11, 3610. [Google Scholar] [CrossRef]
  7. Ahmad, F.; Anwar, W.; Javed, M.; Basit, R.; Akhter, A.; Ali, S.; Azhar, H.; Khan, A.; Amin, H.; Haider, M. Infection mechanism of Aspergillus and Fusarium species against Bemisia tabaci. Mycopath 2019, 17, 63–72. [Google Scholar]
  8. Soliman, N.A.; Al-amin, S.M.; Mesbah, A.E.; Ibrahim, A.M.A.; Mahmoud, A.M.A. Pathogenicity of three entomopathogenic fungi against the Mediterranean fruit fly, Ceratitis capitata (Wiedemann) (Diptera: Tephritidae). Egypt. J. Biol. Pest Control 2020, 30, 49. [Google Scholar] [CrossRef]
  9. Li, H. Study on Entomogenous Fungi—Fusarium. Hunan Agric. Sci. 1989, 36–37. [Google Scholar] [CrossRef]
  10. Teetor-Barsch, G.H.; Roberts, D.W. Entomogenous Fusarium species. Mycopathologia 1983, 84, 3–16. [Google Scholar] [CrossRef]
  11. da Silva Santos, A.C.; Diniz, A.G.; Tiago, P.V.; de Oliveira, N.T. Entomopathogenic Fusarium species: A review of their potential for the biological control of insects, implications and prospects. Fungal Biol. Rev. 2020, 34, 41–57. [Google Scholar] [CrossRef]
  12. Chehri, K. Molecular identification of entomopathogenic Fusarium species associated with Tribolium species in stored grains. J. Invertebr. Pathol. 2017, 144, 1–6. [Google Scholar] [CrossRef] [PubMed]
  13. Anwar, W.; Haider, M.; Shahid, A.; Mushtaq, H.; Hameed, U.; Zia-ur-rehman, M.; Iqbal, M.j. Genetic diversity of Fusarium Isolated from Members of Sternorrhyncha (Hemiptera): Entomopathogens against Bemisia tabaci. Pak. J. Zool. 2017, 49, 639–645. [Google Scholar] [CrossRef]
  14. Addario, E.; Turchetti, T. Parasitic fungi on Dryocosmus kuriphilus in Castanea sativa necrotic galls. Bull. Insectology 2011, 64, 269–273. [Google Scholar]
  15. Liu, W.; Xie, Y.; Dong, J.; Xue, J.; Zhang, Y.; Lu, Y.; Wu, J. Pathogenicity of three entomopathogenic fungi to Matsucoccus matsumurae. PLoS One 2014, 9, e103350. [Google Scholar] [CrossRef]
  16. Carneiro-Leão, M.P.; Tiago, P.V.; Medeiros, L.V.; da Costa, A.F.; de Oliveira, N.T. Dactylopius opuntiae: Control by the Fusarium incarnatum–equiseti species complex and confirmation of mortality by DNA fingerprinting. J. Pest Sci. 2017, 90, 925–933. [Google Scholar] [CrossRef]
  17. Fan, J.-H.; Xie, Y.-P.; Xue, J.-L.; Xiong, Q.; Jiang, W.-J.; Zhang, Y.-J.; Ren, Z.-M. The strain HEB01 of Fusarium sp., a new pathogen that infects brown soft scale. Ann. Microbiol. 2014, 64, 333–341. [Google Scholar] [CrossRef]
  18. Sharma, A.; Chandla, V.K.; Thakur, D.R. Biodiversity and Pathogenicity Potential of Mycoflora Associated with Brahmina coriacea in Potato Fields of North-Western Indian Hills. J. Entomol. 2012, 9, 319–331. [Google Scholar] [CrossRef] [Green Version]
  19. da Silva Santos, A.C.; Oliveira, R.L.S.; da Costa, A.F.; Tiago, P.V.; de Oliveira, N.T. Controlling Dactylopius opuntiae with Fusarium incarnatum–equiseti species complex and extracts of Ricinus communis and Poincianella pyramidalis. J. Pest Sci. 2016, 89, 539–547. [Google Scholar] [CrossRef]
  20. Gupta, S.; Krasnoff, S.B.; Underwood, N.L.; Renwick, J.A.A.; Roberts, D.W. Isolation of beauvericin as an insect toxin from Fusarium semitectum and Fusarium moniliforme var. subglutinans. Mycopathologia 1991, 115, 185–189. [Google Scholar] [CrossRef]
  21. Logrieco, A.; Moretti, A.; Castella, G.; Kostecki, M.; Golinski, P.; Ritieni, A.; Chelkowski, J. Beauvericin Production by Fusarium Species. Appl. Environ. Microbiol. 1998, 64, 3084–3088. [Google Scholar] [CrossRef] [PubMed] [Green Version]
  22. Nitao, J.K.; Meyer, S.L.F.; Schmidt, W.F.; Fettinger, J.C.; Chitwood, D.J. Nematode-Antagonistic Trichothecenes from Fusarium equiseti. J. Chem. Ecol. 2001, 27, 859–869. [Google Scholar] [CrossRef] [PubMed]
  23. Akbar, M.F.; Rana, H.; Perveen, F.K. Management of cauliflower aphid (Myzus persicae (Sulzer) Aphididae: Hemiptera) through environment friendly bioinsecticides. Pak. Entomol 2014, 36, 25–30. [Google Scholar]
  24. Chen, B.; Li, Z.Y.; Feng, M.G. Occurrence of entomopathogenic fungi in migratory alate aphids in Yunnan Province of China. BioControl 2008, 53, 317–326. [Google Scholar] [CrossRef]
  25. Pham, T.A.; Kim, J.J.; Kim, K. Optimization of Solid-State Fermentation for Improved Conidia Production of Beauveria bassiana as a Mycoinsecticide. Mycobiology 2010, 38, 137–143. [Google Scholar] [CrossRef] [Green Version]
  26. Jackson, M.A. Optimizing nutritional conditions for the liquid culture production of effective fungal biological control agents. J. Ind. Microbiol. Biotechnol. 1997, 19, 180–187. [Google Scholar] [CrossRef]
  27. Mascarin, G.M.; Kobori, N.N.; Jackson, M.A.; Dunlap, C.A.; Delalibera, I. Nitrogen sources affect productivity, desiccation tolerance and storage stability of Beauveria bassiana blastospores. J. Appl. Microbiol. 2018, 124, 810–820. [Google Scholar] [CrossRef]
  28. Puri, S.; Beg, Q.K.; Gupta, R. Optimization of Alkaline Protease Production from Bacillus sp. by Response Surface Methodology. Curr. Microbiol. 2002, 44, 286–290. [Google Scholar] [CrossRef]
  29. Kim, J.S.; Je, Y.H.; Skinner, M.; Parker, B.L. An oil-based formulation of Isaria fumosorosea blastospores for management of greenhouse whitefly Trialeurodes vaporariorum (Homoptera: Aleyrodidae). Pest Manag. Sci. 2013, 69, 576–581. [Google Scholar] [CrossRef]
  30. Shapiro-Ilan, D.I.; Cottrell, T.E.; Jackson, M.A.; Wood, B.W. Virulence of Hypocreales fungi to pecan aphids (Hemiptera: Aphididae) in the laboratory. J. Invertebr. Pathol. 2008, 99, 312–317. [Google Scholar] [CrossRef]
  31. Alkhaibari, A.M.; Carolino, A.T.; Yavaşoğlu, S.İ.; Maffeis, T.; Mattoso, T.C.; Bull, J.C.; Samuels, R.I.; Butt, T.M. Metarhizium brunneum Blastospore Pathogenesis in Aedes aegypti Larvae: Attack on Several Fronts Accelerates Mortality. PLoS Pathog. 2016, 12, e1005715. [Google Scholar] [CrossRef] [PubMed] [Green Version]
  32. Wang, Y.B.; Yang, Z.; Yu, J.; Zhang, Y.; Xue, J.; Li, Z.; Li, J.-j.; Wang, C.-y.; Wang, Z.; Hou, J.; et al. Comparison between conidia and blastospores of Esteya vermicola, an endoparasitic fungus of the pinewood nematode, Bursaphelenchus xylophilus. World J. Microbiol. Biotechnol. 2013, 29, 2429–2436. [Google Scholar] [CrossRef] [PubMed]
  33. Alkhaibari, A.M.; Lord, A.M.; Maffeis, T.; Bull, J.C.; Olivares, F.L.; Samuels, R.I.; Butt, T.M. Highly specific host-pathogen interactions influence Metarhizium brunneum blastospore virulence against Culex quinquefasciatus larvae. Virulence 2018, 9, 1449–1467. [Google Scholar] [CrossRef] [PubMed]
  34. Liu, H.; Wang, P.; Hu, Y.; Zhao, G.; Liu, H.; Li, Z.; Wu, H.; Wang, L.; Zheng, Z. Optimised fermentation conditions and improved collection efficiency using dual cyclone equipment to enhance fungal conidia production. Biocontrol Sci. Technol. 2015, 25, 1011–1023. [Google Scholar] [CrossRef]
  35. Akbar, W.; Lord, J.C.; Nechols, J.R.; Howard, R.W. Diatomaceous Earth Increases the Efficacy of Beauveria bassiana Against Tribolium castaneum Larvae and Increases Conidia Attachment. J. Econ. Entomol. 2004, 97, 273–280. [Google Scholar] [CrossRef]
  36. Awan, U.A.; Meng, L.; Xia, S.; Raza, M.F.; Zhang, Z.; Zhang, H. Isolation, fermentation, and formulation of entomopathogenic fungi virulent against adults of Diaphorina citri. Pest Manag. Sci. 2021, 77, 4040–4053. [Google Scholar] [CrossRef]
  37. Li, S.; Myung, K.; Guse, D.; Donkin, B.; Proctor, R.H.; Grayburn, W.S.; Calvo, A.M. FvVE1 regulates filamentous growth, the ratio of microconidia to macroconidia and cell wall formation in Fusarium verticillioides. Mol. Microbiol. 2006, 62, 1418–1432. [Google Scholar] [CrossRef]
  38. Smith, S.N. An overview of ecological and habitat aspects in the genus Fusarium with special emphasis on the soil-borne pathogenic forms. Plant Pathol. Bull. 2007, 16, 97–120. [Google Scholar]
  39. van Wyk, P.S.; Wingfield, M.J.; Marasas, W.F.O.; Bosman, J.L. Development of microconidia in Fusarium section Sporotrichiella. Mycol. Res. 1991, 95, 284–289. [Google Scholar] [CrossRef]
  40. Qiu, J.; Song, F.; Qiu, Y.; Li, X.; Guan, X. Optimization of the medium composition of a biphasic production system for mycelial growth and spore production of Aschersonia placenta using response surface methodology. J. Invertebr. Pathol. 2013, 112, 108–115. [Google Scholar] [CrossRef]
  41. Patel, S.; Duggirala, S. Improved Cellulase Production through RSM by using Aspergillus tubingenesis MN239975 in Solid State Fermentation. Res. J. Biotechnol. 2020, 15, 1–10. [Google Scholar]
  42. Ahmad, S.; Pathak, V.V.; Kothari, R.; Kumar, A.; Naidu Krishna, S.B. Optimization of nutrient stress using C. pyrenoidosa for lipid and biodiesel production in integration with remediation in dairy industry wastewater using response surface methodology. 3 Biotech 2018, 8, 326. [Google Scholar] [CrossRef] [PubMed]
  43. Sawiphak, S.; Wongjiratthiti, A.; Saengprasan, C. Dioscorea alata as Alternative Culture Media for Fungal Cultivation and Biomass Production. Pertanika J. Trop. Agric. Sci. 2021, 44, 317–336. [Google Scholar] [CrossRef]
  44. Petlamul, W.; Boukaew, S. Optimisation and Stabilisation of Cellulase and Xylanase Production by Beauveria bassiana. EnvironmentAsia 2019, 12, 11–19. [Google Scholar]
  45. Amobonye, A.; Bhagwat, P.; Singh, S.; Pillai, S. Beauveria bassiana xylanase: Characterization and wastepaper deinking potential of a novel glycosyl hydrolase from an endophytic fungal entomopathogen. J. Fungi 2021, 7, 668. [Google Scholar] [CrossRef]
  46. Yin, L.; Chen, M.; Zeng, T.; Liu, X.; Zhu, F.; Huang, R. Improving probiotic spore yield using rice straw hydrolysate. Lett. Appl. Microbiol. 2021, 72, 149–156. [Google Scholar] [CrossRef] [PubMed]
  47. Chen, J.; Lan, X.; Jia, R.; Hu, L.; Wang, Y. Response Surface Methodology (RSM) Mediated Optimization of Medium Components for Mycelial Growth and Metabolites Production of Streptomyces alfalfae XN-04. Microorganisms 2022, 10, 1854. [Google Scholar] [CrossRef]
  48. Vlajkov, V.; Andelic, S.; Pajcin, I.; Grahovac, M.; Budakov, D.; Jokic, A.; Grahovac, J. Medium for the Production of Bacillus-Based Biocontrol Agent Effective against Aflatoxigenic Aspergillus flavus: Dual Approach for Modelling and Optimization. Microorganisms 2022, 10, 1165. [Google Scholar] [CrossRef]
  49. Dong, C.; Xie, X.Q.; Wang, X.; Zhan, Y.; Yao, Y.J. Application of Box-Behnken design in optimisation for polysaccharides extraction from cultured mycelium of Cordyceps sinensis. Food Bioprod. Process. 2009, 87, 139–144. [Google Scholar] [CrossRef]
  50. Shih, L.; Tsai, K.-L.; Hsieh, C. Effects of culture conditions on the mycelial growth and bioactive metabolite production in submerged culture of Cordyceps militaris. Biochem. Eng. J. 2007, 33, 193–201. [Google Scholar] [CrossRef]
  51. Zhao, X.; Chai, J.; Zhang, X.; Hong, B.; Jia, Y. Identification of Fusarium equiseti and Its Pathogenicity to Myzus persicae. Chin. J. Biol. Control 2022, 1–12. [Google Scholar] [CrossRef]
  52. Amobonye, A.; Bhagwat, P.; Singh, S.; Pillai, S. Enhanced xylanase and endoglucanase production from Beauveria bassiana SAN01, an entomopathogenic fungal endophyte. Fungal Biol. 2021, 125, 39–48. [Google Scholar] [CrossRef] [PubMed]
  53. Dhar, S.; Jindal, V.; Gupta, V.K. Optimization of growth conditions and medium composition for improved conidiation of newly isolated Beauveria bassiana strains. Indian J. Exp. Biol. 2016, 54, 634–643. [Google Scholar] [PubMed]
  54. Elhakim, E.; Mohamed, O.; Elazouni, I. Virulence and proteolytic activity of entomopathogenic fungi against the two-spotted spider mite, Tetranychus urticae Koch (Acari: Tetranychidae). Egypt. J. Biol. Pest Control 2020, 30, 1–8. [Google Scholar] [CrossRef] [Green Version]
  55. Hammami, A.; Bayoudh, A.; Hadrich, B.; Abdelhedi, O.; Jridi, M.; Nasri, M. Response-surface methodology for the production and the purification of a new H2O2-tolerant alkaline protease from Bacillus invictae AH1 strain. Biotechnol. Prog. 2020, 36, e2965. [Google Scholar] [CrossRef]
  56. Bezerra, M.A.; Santelli, R.E.; Oliveira, E.P.; Villar, L.S.; Escaleira, L.A. Response surface methodology (RSM) as a tool for optimization in analytical chemistry. Talanta 2008, 76, 965–977. [Google Scholar] [CrossRef]
  57. Pradeep, F.S.; Pradeep, B. Optimization of pigment and biomass production from Fusarium moniliforme under submerged fermentation conditions. culture 2013, 5, 10. [Google Scholar]
  58. Tang, P.; Zhang, Z.; Niu, L.; Gu, C.; Zheng, W.; Cui, H.-C.; Yuan, X.-H. Fusarium solani G6, a novel vitexin-producing endophytic fungus: Characterization, yield improvement and osteoblastic proliferation activity. Biotechnol. Lett. 2021, 43, 1371–1383. [Google Scholar] [CrossRef]
  59. Anellis, A.; Berkowitz, D.; Kemper, D.; Rowley, D. Production of types A and B spores of Clostridium botulinum by the biphasic method: Effect on spore population, radiation resistance, and toxigenicity. Appl. Microbiol. 1972, 23, 734–739. [Google Scholar] [CrossRef]
  60. Das, M.M.; Haridas, M.; Sabu, A. Process development for the enhanced production of bio-nematicide Purpureocillium lilacinum KU8 under solid-state fermentation. Bioresour. Technol. 2020, 308, 123328. [Google Scholar] [CrossRef]
  61. Arabi, M.I.E.; Bakri, Y.; Jawhar, M. Extracellular xylanase production by Fusarium species in solid state fermentation. Pol. J. Microbiol 2011, 60, 209–212. [Google Scholar] [CrossRef] [PubMed]
  62. Khilare, V.; Ahmed, R. Effect of different media, pH and temperature on the growth of Fusarium oxysporum f. sp. ciceri causing chickpea wilt. Int. J. Adv. Biol. Res. 2012, 2, 99–102. [Google Scholar]
  63. Tarocco, F.; Lecuona, R.E.; Couto, A.S.; Arcas, J.A. Optimization of erythritol and glycerol accumulation in conidia of Beauveria bassiana by solid-state fermentation, using response surface methodology. Appl. Microbiol. Biotechnol. 2005, 68, 481–488. [Google Scholar] [CrossRef] [PubMed]
  64. Punja, Z.; Wan, A.; Rahman, M.; Goswami, R.; Barasubiye, T.; Seifert, K.; Lévesque, C. Growth, population dynamics, and diversity of Fusarium equiseti in ginseng fields. Eur. J. Plant Pathol. 2008, 121, 173–184. [Google Scholar] [CrossRef]
  65. Mishra, S.; Malik, A. Comparative evaluation of five Beauveria isolates for housefly (Musca domestica L.) control and growth optimization of selected strain. Parasitol. Res. 2012, 111, 1937–1945. [Google Scholar] [CrossRef]
  66. Slininger, P.J.; Silman, R.W.; Jackson, M.A. Oxygen delivery requirements of Colletotrichum truncatum during germination, vegetative growth, and sporulation. Appl. Microbiol. Biotechnol. 1993, 39, 744–749. [Google Scholar] [CrossRef]
  67. Kumar, G.; Kunamneni, A.; Prabhakar, T.; Ellaiah, P. Optimization of Process Parameters for the Production of Inulinase from a Newly Isolated Aspergillus niger AUP19. World J. Microbiol. Biotechnol. 2005, 21, 1359–1361. [Google Scholar] [CrossRef]
  68. Niaz, M.; Iftikhar, T.; Qureshi, F.F.; Niaz, M. Extracellular lipase production by Aspergillus nidulans (MBL-S-6) under submerged fermentation. Int. J. Agric. Biol. 2014, 16, 536–542. [Google Scholar]
  69. Jiru, T.M.; Groenewald, M.; Pohl, C.; Steyn, L.; Kiggundu, N.; Abate, D. Optimization of cultivation conditions for biotechnological production of lipid by Rhodotorula kratochvilovae (syn, Rhodosporidium kratochvilovae) SY89 for biodiesel preparation. 3 Biotech 2017, 7, 1–11. [Google Scholar] [CrossRef]
  70. Reihani, S.F.S.; Khosravi-Darani, K. Influencing factors on single-cell protein production by submerged fermentation: A review. Electron. J. Biotechnol. 2019, 37, 34–40. [Google Scholar] [CrossRef]
  71. Kamal, M.; Ali, M.; Shishir, M.R.I.; Saifullah, M.; Haque, M.; Mondal, S.C. Optimization of process parameters for improved production of biomass protein from Aspergillus niger using banana peel as a substrate. Food Sci. Biotechnol. 2019, 28, 1693–1702. [Google Scholar] [CrossRef] [PubMed]
  72. Santa, H.S.D.; Santa, O.R.D.; Brand, D.; Vandenberghe, L.P.d.S.; Soccol, C.R. Spore production of Beauveria bassiana from agro-industrial residues. Braz. Arch. Biol. Technol. 2005, 48, 51–60. [Google Scholar] [CrossRef] [Green Version]
  73. Alabdalall, A.H.; Alanazi, N.; AAldakeel, S.; Abdulazeez, S.; Borgio, J.F. Molecular, physiological, and biochemical characterization of extracellular lipase production by Aspergillus niger using submerged fermentation. PeerJ 2020, 8, e9425. [Google Scholar] [CrossRef] [PubMed]
  74. Singh, R.S.; Sooch, B.S.; Puri, M. Optimization of medium and process parameters for the production of inulinase from a newly isolated Kluyveromyces marxianus YS-1. Bioresour. Technol. 2007, 98, 2518–2525. [Google Scholar] [CrossRef] [PubMed]
  75. Singh, D.; Kaur, G. Optimization of different process variables for the production of an indolizidine alkaloid, swainsonine from Metarhizium anisopliae. J. Basic Microbiol. 2012, 52, 590–597. [Google Scholar] [CrossRef]
  76. Xu, C.P.; Sinha, J.; Bae, J.T.; Kim, S.W.; Yun, J.W. Optimization of physical parameters for exo–biopolymer production in submerged mycelial cultures of two entomopathogenic fungi Paecilomyces japonica and Paecilomyces tenuipes. Lett. Appl. Microbiol. 2006, 42, 501–506. [Google Scholar] [CrossRef]
  77. Santos, M.C.d.; Mendonça, M.d.L.; Bicas, J.L. Modeling bikaverin production by Fusarium oxysporum CCT7620 in shake flask cultures. Bioresour. Bioprocess. 2020, 7, 1–8. [Google Scholar] [CrossRef]
  78. Yujie, C.; Hongwei, Y.; Hailong, J. Optimal Conditions for Trichoderma longibrachiatum Strain T05 for Producing Conidia and Chlamydospores. J. Northeast For. Univ. 2016, 44, 110–113. [Google Scholar] [CrossRef]
  79. Srivastava, S.; Pathak, N.; Srivastava, P. Identification of limiting factors for the optimum growth of Fusarium oxysporum in liquid medium. Toxicol. Int. 2011, 18, 111. [Google Scholar] [CrossRef]
  80. Kim, H.; Yun, J. A comparative study on the production of exopolysaccharides between two entomopathogenic fungi Cordyceps militaris and Cordyceps sinensis in submerged mycelial cultures. J. Appl. Microbiol. 2005, 99, 728–738. [Google Scholar] [CrossRef]
Figure 1. Effects of different medium and incubation time on the (a) spore concentration and (b) mycelial biomass of strain JMF-01. The data in the figure are the mean ± SEM. The SEM of three repetitions is shown in bars.
Microorganisms 11 00190 g001
Figure 2. Effects of different initial pH on the (a) spore concentration and (b) mycelial biomass of strain JMF-01. The data in the figure are the mean ± SEM. The SEM of three repetitions is shown in bars.
Microorganisms 11 00190 g002
Figure 3. Effects of different primary inoculum density on the (a) spore concentration and (b) mycelial biomass of strain JMF-01. The data in the figure are the mean ± SEM. The SEM of three repetitions is shown in bars.
Microorganisms 11 00190 g003
Figure 4. Effects of different medium-to-flask ratio on the (a) spore concentration and (b) mycelial biomass of strain JMF-01. The data in the figure are the mean ± SEM. The SEM of three repetitions is shown in bars.
Microorganisms 11 00190 g004
Figure 5. Response surface plots of the mycelial biomass and spore concentration of strain JMF-01. In the figure, (af) are the response surface diagrams of each factor on the mycelial biomass of strain JMF-01; and (gl) are the effects on spore concentration.
Microorganisms 11 00190 g005
Figure 6. Validation of the statistical optimized submerged culture and unoptimized submerged culture. (A) Spore concentration. (B) Mycelial biomass. Data in the figure are the mean ± SEM. The SEM of three repetitions is shown in bars. The different lowercase letters (a, b) on the bars indicate a significant difference between different treatments (p < 0.05, ANOVA with Tukey HSD test).
Microorganisms 11 00190 g006
Figure 7. Survival of M. persicae treated with optimized submerged culture for 7 days. The control was sterile water. Submerged culture significantly decreased survival compared to control (χ2 = 25.816, df = 1, p < 0.001). The data in the figure are the mean ± SEM. The SEM of three repetitions is shown in bars.
Microorganisms 11 00190 g007
Table 1. Culture medium formula.
NumberNameComponents Per 1 L Distilled Water
1Potato dextrose liquid medium200 g peeled potato, 20 g glucose;
2Potato sucrose liquid medium200 g peeled potato, 20 g sucrose;
3Sabouraud Dextrose Agar with yeast extract liquid medium40 g glucose, 10 g peptone, 10 g yeast powder;
4Czapek–Dox liquid medium30 g sucrose, 3 g NaNO3, 0.5 g KCl, 1 g K2HPO3, 0.01 g FeSO4, 0.5 g MgSO4.7H2O;
5Glucose yeast extract liquid medium40 g glucose, 20 g yeast powder.
Table 2. The levels and code of variable chosen for BBD.
FactorsLevels
−101
A: Incubation time (d)567
B: Initial pH456
C: Medium-to-flask ratio0.230.330.43
D: Primary inoculum density (107 conidia/mL)0.511.5
Table 3. BBD and the experimental results.
Experimental Serial No.Incubation Time (d)
A
Initial pH
B
Medium-to-Flask Ratio
C
Primary Inoculum Density (107 Conidia/mL)
D
Spore Concentration 108 (Blastospores/mL)Mycelial Biomass (g/mL)
1640.330.54.550.24
2660.4313.410.35
3650.3316.010.31
4750.2314.580.12
5760.3313.220.26
6740.3315.350.22
7650.3315.840.28
8650.3315.980.29
9650.3315.860.31
10640.331.56.010.24
11650.431.55.270.32
12540.3314.500.29
13650.231.56.060.18
14640.4315.630.34
15560.3314.140.26
16660.2314.410.13
17650.430.54.550.32
18660.330.53.180.24
19650.230.54.380.14
20750.331.55.580.26
21550.331.54.580.27
22660.331.54.310.26
23550.330.53.520.26
24550.4314.130.35
25750.4315.130.28
26650.3316.630.33
27550.2314.600.19
28640.2314.520.16
29750.330.52.570.28
Table 4. Analysis of variance of the spore production response surface model of the strain JMF-01.
SourceSum of SquaresdfMean SquareF-Valuep-ValueSignificance
Model27.04141.9314.49<0.0001significant
A0.07710.0770.570.4611
B5.1915.1938.94<0.0001
C0.01610.0160.120.7370
D6.8316.8351.21<0.0001
AB0.7910.795.910.0291
AC0.2510.251.910.1889
AD0.9610.967.190.0179
BC1.1211.128.400.0117
BD0.02810.0280.210.6550
CD0.2310.231.720.2105
A27.1717.1753.79<0.0001
B25.0815.0838.09<0.0001
C21.3411.3410.050.0068
D23.3513.3525.160.0002
Residual1.87140.13
Lack of Fit1.45100.151.390.4028Not significant
Pure Error0.4240.10
Cor Total28.9128
Note: A, incubation time; B, initial pH; C, medium-to-flask ratio; D, primary inoculum density.
Table 5. Analysis of variance of the mycelial biomass response surface model of the strain JMF-01.
SourceSum of SquaresdfMean SquareF-Valuep-ValueSignificance
Model0.11140.007817.18<0.0001significant
A0.003710.00378.150.0127
B0100.0440.8374
C0.08710.087192.17<0.0001
D0.000210.0020.350.5635
AB0.001210.00122.720.1211
AC0.000003410.00000340.00760.9319
AD0.000110.00010.310.5862
BC0.000510.00051.070.3175
BD0.000210.00020.340.5707
CD0.000410.00040.800.3868
A20.003210.00327.180.0179
B20.005310.005311.800.0040
C20.01110.01123.550.0003
D20.004110.00419.020.0095
Residual0.0063140.0005
Lack of Fit0.0051100.00051.610.3428Not significant
Pure Error0.001340.0003
Cor Total0.1228
Note: A, incubation time; B, initial pH; C, medium-to-flask ratio; D, primary inoculum density.
Disclaimer/Publisher’s Note: The statements, opinions and data contained in all publications are solely those of the individual author(s) and contributor(s) and not of MDPI and/or the editor(s). MDPI and/or the editor(s) disclaim responsibility for any injury to people or property resulting from any ideas, methods, instructions or products referred to in the content.

