
Examining Different Analysis Protocols Targeting Hospital Sanitary Facility Microbiomes
 , , , ,
Abstract
:1. Introduction
2. Materials and Methods
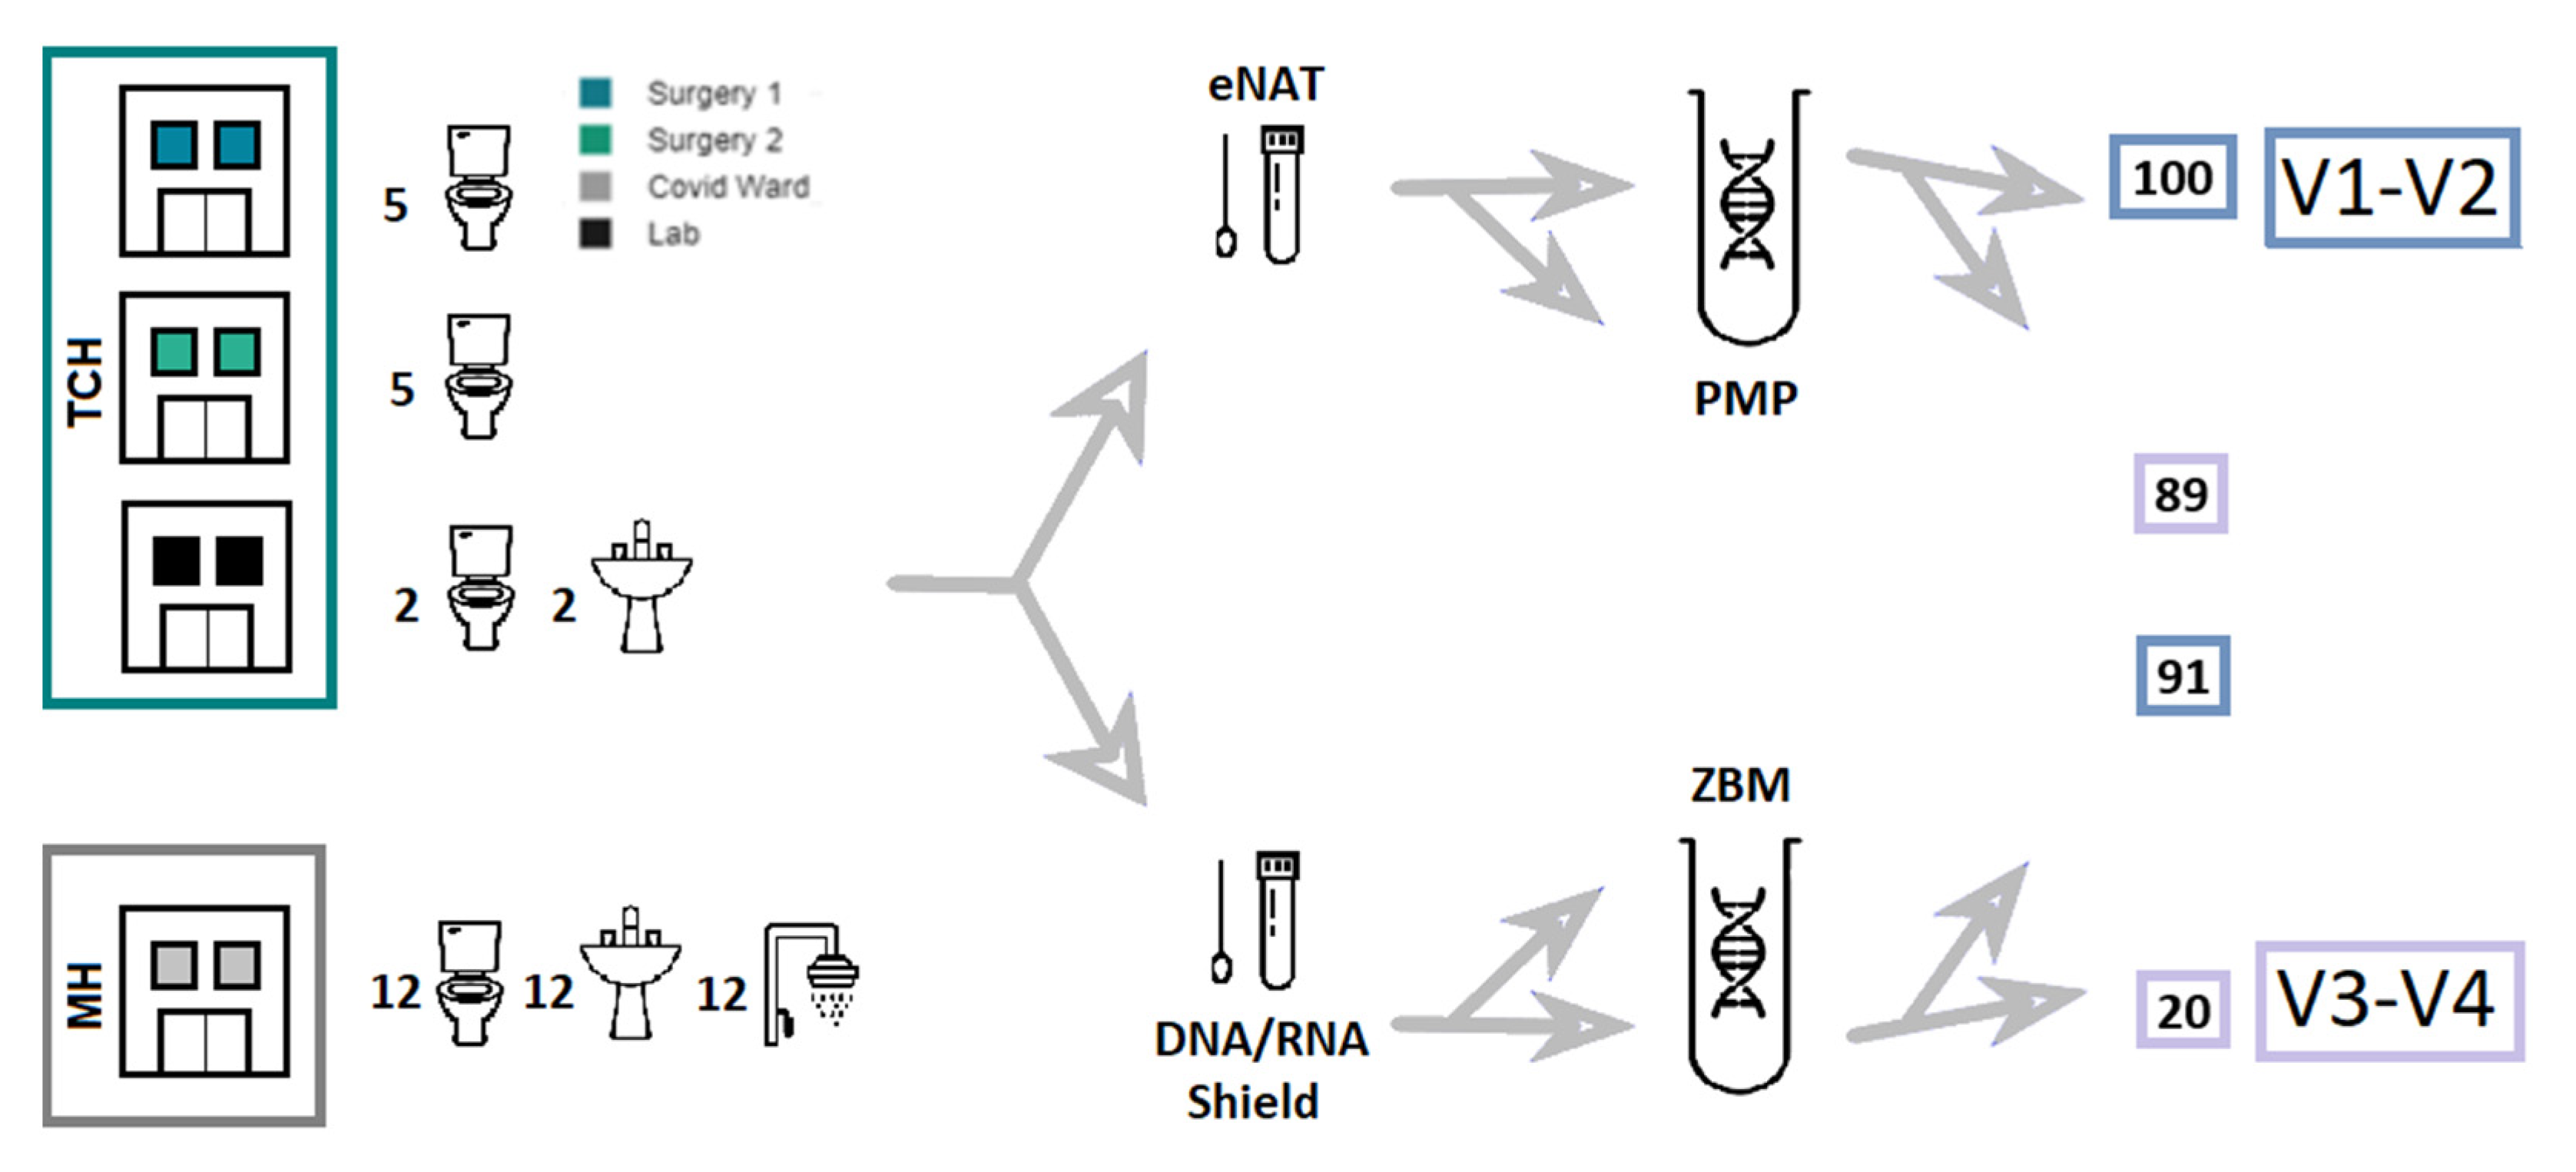
2.1. Sample Collection
2.2. DNA Extraction
2.3. Library Preparation
2.4. Sequencing
2.5. Bioinformatic Analysis
3. Results
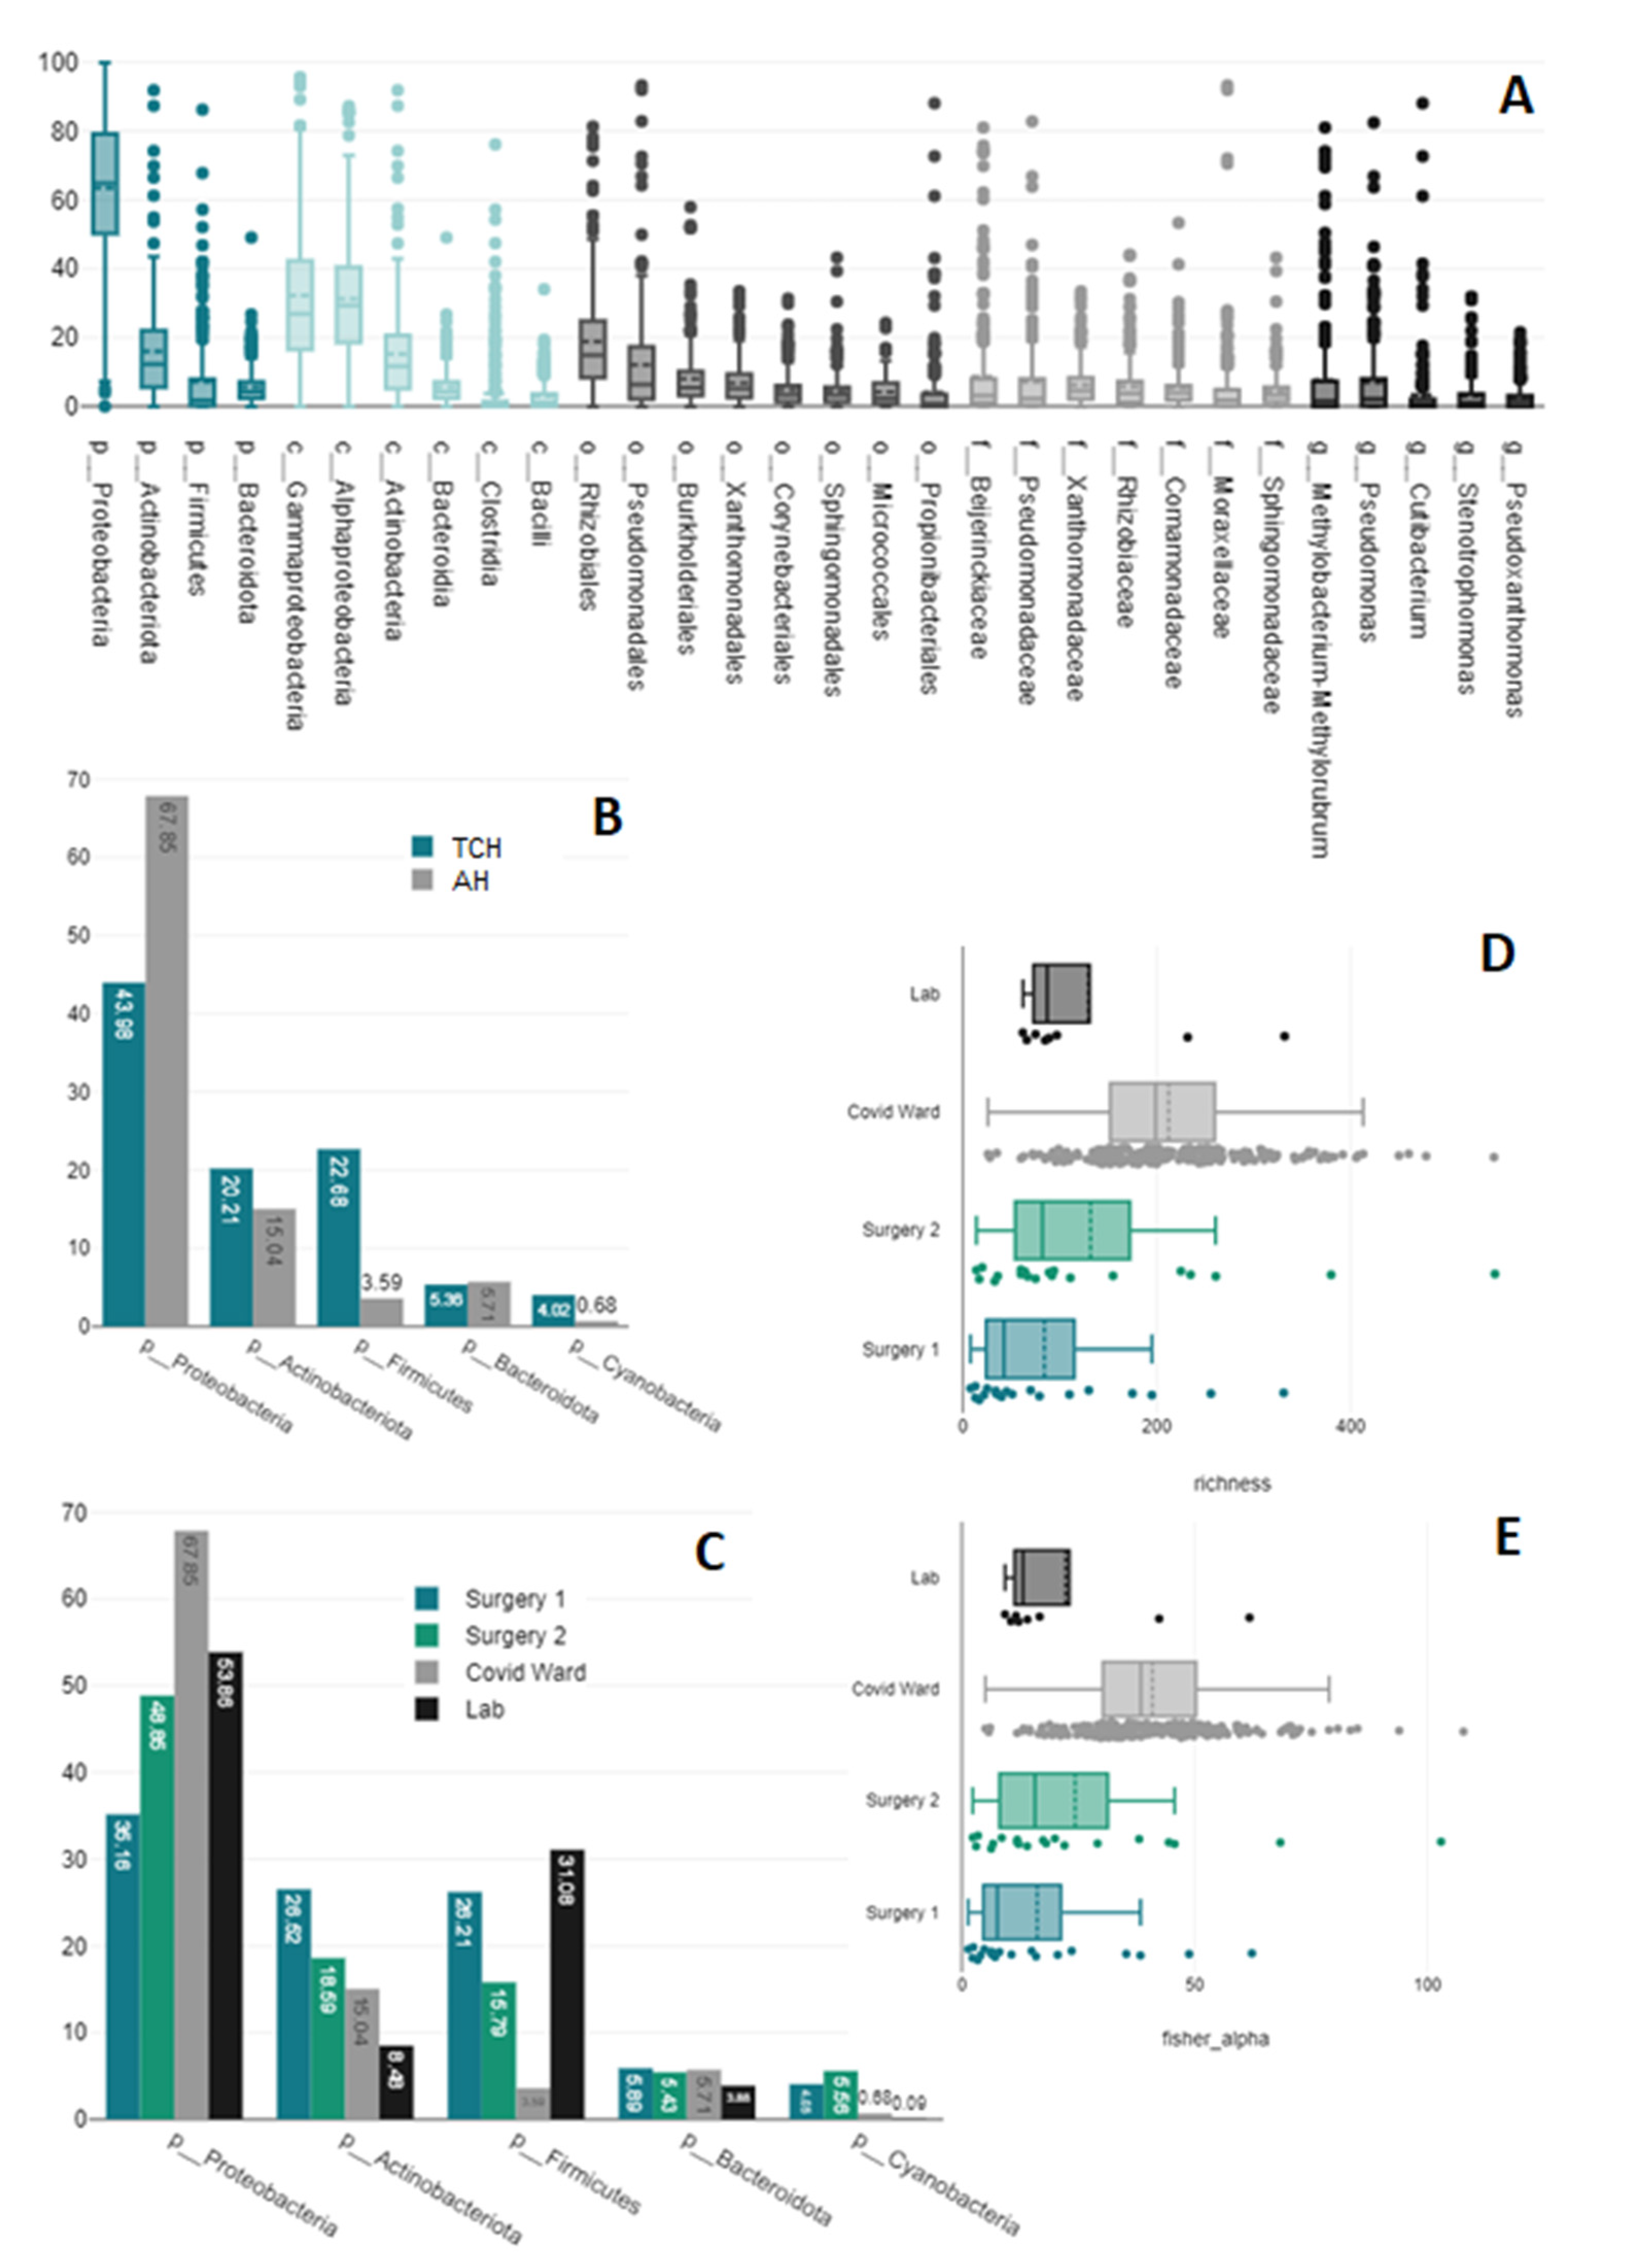
3.1. Present Taxa
3.2. Collection and Preservation Systems
3.3. DNA Extraction
3.4. Primer Pairs
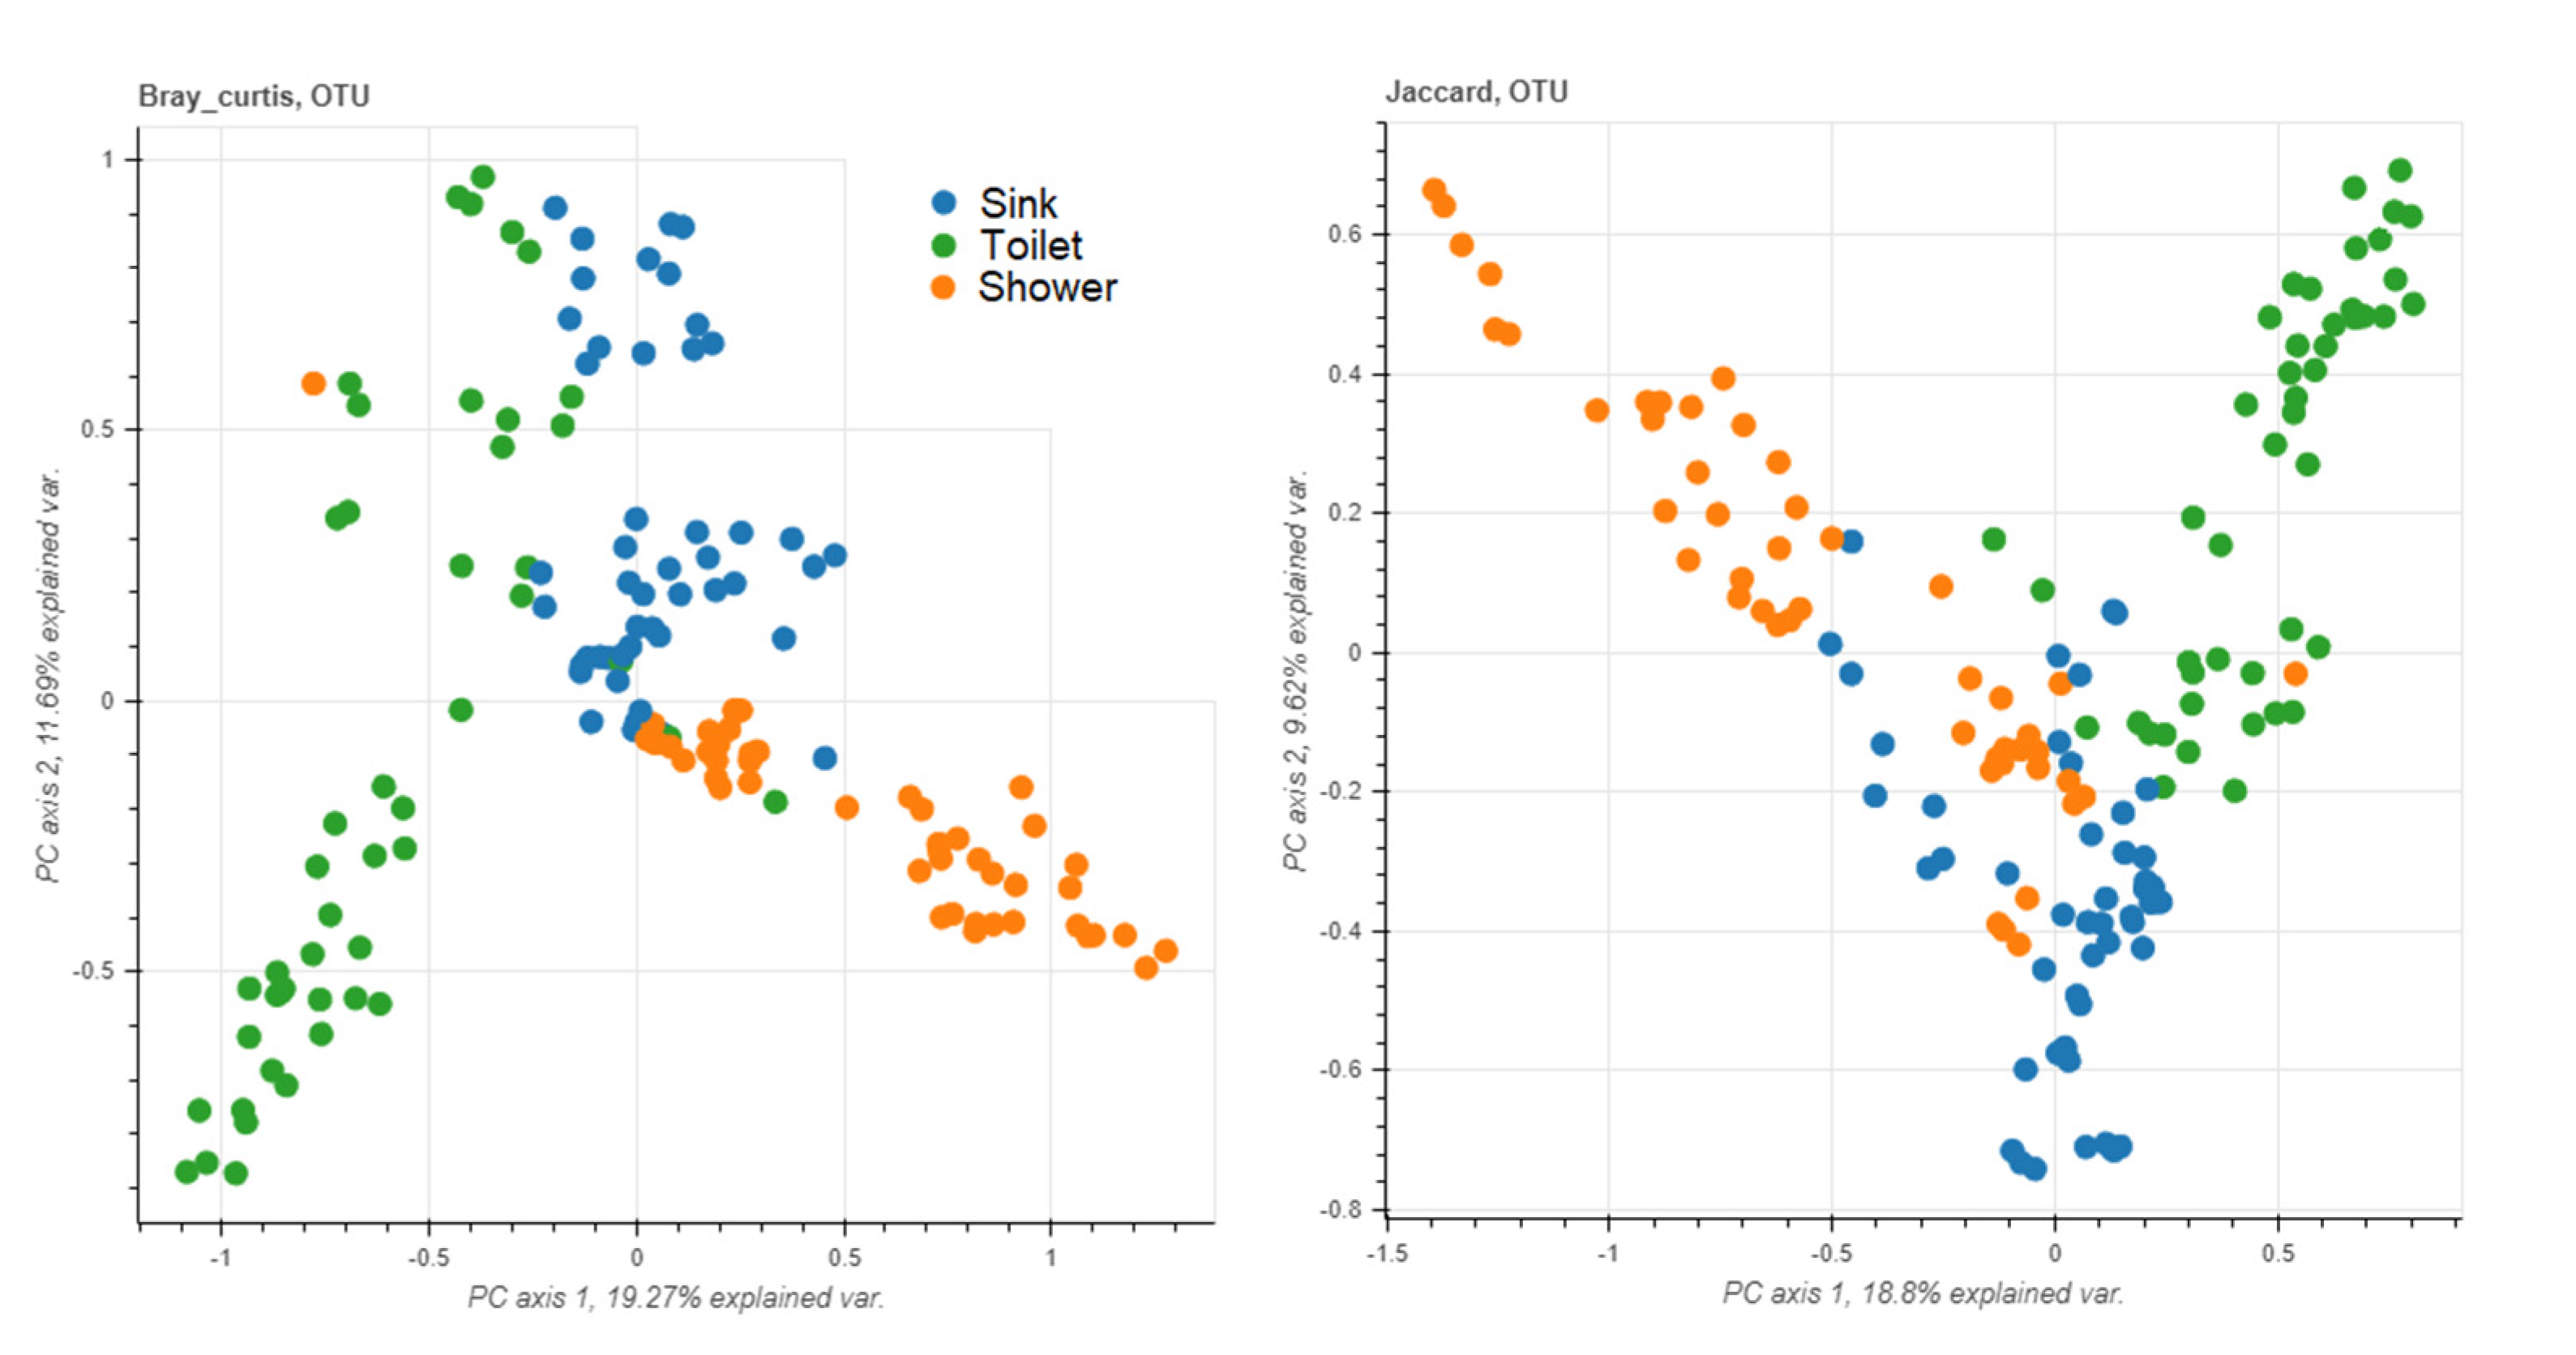
3.5. Sampling Sites
3.6. Staff vs. Patient Toilets
4. Discussion
5. Conclusions
Author Contributions
Funding
Data Availability Statement
Acknowledgments
Conflicts of Interest
References
- Laxminarayan, R.; Duse, A.; Wattal, C.; Zaidi, A.K.; Wertheim, H.F.; Sumpradit, N.; Vlieghe, E.; Hara, G.L.; Gould, I.M.; Goossens, H.; et al. Antibiotic resistance—The need for global solutions. Lancet Infect. Dis. 2013, 13, 1057–1098. [Google Scholar] [CrossRef] [PubMed] [Green Version]
- World Health Organization. Global Antimicrobial Resistance and Use Surveillance System (GLASS) Report: 2021. 2021. Available online: https://www.who.int/initiatives/glass (accessed on 22 November 2022).
- Motro, Y.; Moran-Gilad, J. Next-generation sequencing applications in clinical bacteriology. Biomol. Detect. Quantif. 2017, 14, 1–6. [Google Scholar] [CrossRef] [PubMed]
- AAngers-Loustau, A.; Petrillo, M.; Bengtsson-Palme, J.; Berendonk, T.; Blais, B.; Chan, K.G.; Coque, T.M.; Hammer, P.; Heß, S.; Kagkli, D.M.; et al. The challenges of designing a benchmark strategy for bioinformatics pipelines in the identification of antimicrobial resistance determinants using next generation sequencing technologies. F1000Research 2018, 7. [Google Scholar] [CrossRef] [PubMed]
- Deurenberg, R.H.; Bathoorn, E.; Chlebowicz, M.A.; Couto, N.; Ferdous, M.; García-Cobos, S.; Kooistra-Smid, A.M.; Raangs, E.C.; Rosema, S.; Veloo, A.C.; et al. Application of next generation sequencing in clinical microbiology and infection prevention. J. Biotechnol. 2017, 243, 16–24. [Google Scholar] [CrossRef] [PubMed]
- Ciuffreda, L.; Rodríguez-Pérez, H.; Flores, C. Nanopore sequencing and its application to the study of microbial communities. Comput. Struct. Biotechnol. J. 2021, 19, 1497–1511. [Google Scholar] [CrossRef]
- Ghannam, R.B.; Techtmann, S.M. Machine learning applications in microbial ecology, human microbiome studies, and environmental monitoring. Comput. Struct. Biotechnol. J. 2021, 19, 1092–1107. [Google Scholar] [CrossRef]
- Wilkinson, J.E.; Franzosa, E.A.; Everett, C.; Li, C.; Hu, F.B.; Wirth, D.F.; Song, M.; Chan, A.T.; Rimm, E.; Garrett, W.S.; et al. A framework for microbiome science in public health. Nat. Med. 2021, 27, 766–774. [Google Scholar] [CrossRef]
- Callewaert, C.; Ravard Helffer, K.; Lebaron, P. Skin Microbiome and its Interplay with the Environment. Am. J. Clin. Dermatol. 2020, 21, 4–11. [Google Scholar] [CrossRef]
- Salvucci, E. Microbiome, holobiont and the net of life. Crit. Rev. Microbiol. 2016, 42, 485–494. [Google Scholar] [CrossRef]
- Morar, N.; Bohannan, B.J. The conceptual ecology of the human microbiome. Q. Rev. Biol. 2019, 94, 149–175. [Google Scholar] [CrossRef]
- Maier, K.J.; Al’Absi, M. Toward a biopsychosocial ecology of the human microbiome, brain-gut axis, and health. Psychosom. Med. 2017, 79, 947–957. [Google Scholar] [CrossRef]
- Lax, S.; Gilbert, J.A. Hospital-associated microbiota and implications for nosocomial infections. Trends Mol. Med. 2015, 21, 427–432. [Google Scholar] [CrossRef] [Green Version]
- Gilbert, J.A.; Stephens, B. Microbiology of the built environment. Nat. Rev. Microbiol. 2018, 16, 661–670. [Google Scholar] [CrossRef]
- Blake, K.S.; Choi, J.; Dantas, G. Approaches for characterizing and tracking hospital-associated multidrug-resistant bacteria. Cell. Mol. Life Sci. 2021, 78, 2585–2606. [Google Scholar] [CrossRef]
- Christoff, A.P.; Sereia, A.F.; Hernandes, C.; de Oliveira, L.F. Uncovering the hidden microbiota in hospital and built environments: New approaches and solutions. Exp. Biol. Med. 2019, 244, 534–542. [Google Scholar] [CrossRef]
- Cason, C.; D’Accolti, M.; Soffritti, I.; Mazzacane, S.; Comar, M.; Caselli, E. Next-generation sequencing and PCR technologies in monitoring the hospital microbiome and its drug resistance. Front. Microbiol. 2022, 13, 969863. [Google Scholar] [CrossRef]
- Bolyen, E.; Rideout, J.R.; Dillon, M.R.; Bokulich, N.A.; Abnet, C.C.; Al-Ghalith, G.A.; Alexander, H.; Alm, E.J.; Arumugam, M.; Asnicar, F.; et al. Reproducible, interactive, scalable and extensible microbiome data science using QIIME 2. Nat. Biotechnol. 2019, 37, 852–857. [Google Scholar] [CrossRef]
- Callahan, B.J.; McMurdie, P.J.; Rosen, M.J.; Han, A.W.; Johnson, A.J.A.; Holmes, S.P. DADA2: High-resolution sample inference from Illumina amplicon data. Nat. Methods 2016, 13, 581–583. [Google Scholar] [CrossRef] [Green Version]
- Quast, C.; Pruesse, E.; Yilmaz, P.; Gerken, J.; Schweer, T.; Yarza, P.; Peplies, J.; Glöckner, F.O. The SILVA ribosomal RNA gene database project: Improved data processing and web-based tools. Nucleic Acids Res 2013, 41, D590–D596. [Google Scholar] [CrossRef]
- Robeson, M.S., 2nd; O’Rourke, D.R.; Kaehler, B.D.; Ziemski, M.; Dillon, M.R.; Foster, J.T.; Bokulich, N.A. RESCRIPt: Reproducible sequence taxonomy reference database management. PLoS Comput. Biol. 2021, 17, e1009581. [Google Scholar] [CrossRef]
- Bokulich, N.A.; Kaehler, B.D.; Rideout, J.R.; Dillon, M.; Bolyen, E.; Knight, R.; Huttley, G.A.; Gregory Caporaso, J. Optimizing taxonomic classification of marker-gene amplicon sequences with QIIME 2’s q2-feature-classifier plugin. Microbiome 2018, 6, 90. [Google Scholar] [CrossRef] [PubMed]
- Menke, S.; Gillingham, M.A.; Wilhelm, K.; Sommer, S. Home-made cost effective preservation buffer is a better alternative to commercial preservation methods for microbiome research. Front. Microbiol. 2017, 8, 102. [Google Scholar] [CrossRef] [PubMed] [Green Version]
- Prakash, O.; Nimonkar, Y.; Desai, D. A recent overview of microbes and microbiome preservation. Indian J. Microbiol. 2020, 60, 297–309. [Google Scholar] [CrossRef] [PubMed]
- Wesolowska-Andersen, A.; Bahl, M.I.; Carvalho, V.; Kristiansen, K.; Sicheritz-Pontén, T.; Gupta, R.; Licht, T.R. Choice of bacterial DNA extraction method from fecal material influences community structure as evaluated by metagenomic analysis. Microbiome 2014, 2, 19. [Google Scholar] [CrossRef] [PubMed] [Green Version]
- Tedersoo, L.; Albertsen, M.; Anslan, S.; Callahan, B. Perspectives and benefits of high-throughput long-read sequencing in microbial ecology. Appl. Environ. Microbiol. 2021, 87, e00626-21. [Google Scholar] [CrossRef]
- Wensel, C.R.; Pluznick, J.L.; Salzberg, S.L.; Sears, C.L. Next-generation sequencing: Insights to advance clinical investigations of the microbiome. J. Clin. Investig. 2022, 132, e154944. [Google Scholar] [CrossRef]
- Matsuo, Y.; Komiya, S.; Yasumizu, Y.; Yasuoka, Y.; Mizushima, K.; Takagi, T.; Kryukov, K.; Fukuda, A.; Morimoto, Y.; Naito, Y.; et al. Full-length 16S rRNA gene amplicon analysis of human gut microbiota using MinION™ nanopore sequencing confers species-level resolution. BMC Microbiol. 2021, 21, 35. [Google Scholar] [CrossRef]
- Pausan, M.-R.; Blohs, M.; Mahnert, A.; Moissl-Eichinger, C. The sanitary indoor environment—A potential source for intact human-associated anaerobes. npj Biofilms Microbiomes 2022, 8, 44. [Google Scholar] [CrossRef]
- Schuster, D.; Axtmann, K.; Holstein, N.; Felder, C.; Voigt, A.; Färber, H.; Ciorba, P.; Szekat, C.; Schallenberg, A.; Böckmann, M.; et al. Antibiotic concentrations in raw hospital wastewater surpass minimal selective and minimal inhibitory concentrations of resistant Acinetobacter baylyi strains. Environ. Microbiol. 2022, 24, 5721–5733. [Google Scholar] [CrossRef]
- Mahnert, A.; Moissl-Eichinger, C.; Zojer, M.; Bogumil, D.; Mizrahi, I.; Rattei, T.; Martinez, J.L.; Berg, G. Man-made microbial resistances in built environments. Nat. Commun. 2019, 10, 968. [Google Scholar] [CrossRef]
- Neidhöfer, C.; Buechler, C.; Neidhöfer, G.; Bierbaum, G.; Hannet, I.; Hoerauf, A.; Parčina, M. Global distribution patterns of carbapenemase-encoding bacteria in a new light: Clues on a role for ethnicity. Front. Cell. Infect. Microbiol. 2021, 532. [Google Scholar] [CrossRef]
- Neidhöfer, C.; Berens, C.; Parčina, M. An 18-Year Dataset on the Clinical Incidence and MICs to Antibiotics of Achromobacter spp. (Labeled Biochemically or by MAL-DI-TOF MS as A. xylosoxidans), Largely in Patient Groups Other than Those with CF. Antibiotic 2022, 11, 311. [Google Scholar] [CrossRef]


| Higher Prevalence | Lower Prevalence | |
|---|---|---|
| Phylum | Actinobacteriota (t(126.06) = 6.44, p = < 0.001) | Bacteroidota (t(124.82) = −4.75, p = < 0.001) |
| Bdellovibrionota (t(128.87) = −3.95, p = < 0.001) | ||
| Verrucomicrobiota (t(103.03) = −5.55, p = < 0.001) | ||
| Acidobacteriota (t(116.99) = −2.33, p = 0.021) | ||
| Chloroflexi (t(106.62) = −3.78, p = < 0.001) | ||
| Class | Actinobacteria (t(119.62) = 6.73, p = < 0.001) | Bacteroidia (t(124.82) = −4.72, p = < 0.001) |
| Bdellovibrionia (t(132.42) = −3.78, p = < 0.001) | ||
| Verrucomicrobiae (t(104.34) = −4.5, p = < 0.001) | ||
| Plactomycetes (t(137.82) = −2.28, p = 0.024) | ||
| Order | Pseudomonadales (t(141.41) = 2.21, p = 0.029) | Enterobacterales (t(108.68) = −4.71, p = < 0.001) |
| Corynebacteriales (t(135.31) = 4.2, p = < 0.001) | Flavobacteriales (t(161.51) = −2.59, p = 0.011) | |
| Propionibacteriales (t(95.63) = 4.62, p = < 0.001) | Cytophagales (t(163.96) = −2.22) | |
| Micrococcales (t(156.14) = 2.23, p = 0.027) | Chitinophagales (t(118.58) = −3.31, p = 0.001) | |
| Pseudonocardiales (t(91.89) = 2.48, p = 0.015) | Sphingobacteriales (t(121.64) = −4.09, p = < 0.001) | |
| Bdellovibrionales (t(139.31) = −2.89, p = 0.005) | ||
| Acetobacterales (t(120.77) = −3.45, p = 0.001) | ||
| Legionellales (t(132.55) = −2.28, p = 0.024) | ||
| Family | Pseudomonaceae (t(129.75) = 2.38, p = 0.019) | Enterobacteriaceae (t(108.26) = −4.64, p = < 0.001) |
| Propionibacteriaceae (t(94.67) = 4.74, p = < 0.001) | Chitinophagaceae (t(116.69) = −3.13, p = 0.002) | |
| Hyphomicrobiaceae (t(109.04) = 2.65, p = 0.009) | Bdellovibrionaceae (t(139.31) = −2.89, p = 0.005) | |
| Microbacteriaceae (t(114.06) = 2.93, p = 0.004) | Flavobacteriaceae (t(131.52) = −2.59, p = 0.011) | |
| Mycobacteriaceae (t(105.44) = 3.65, p = < 0.001) | Sphingobacteriaceae (t(120.42) = −3.41, p = 0.001) | |
| Pseudonocardiaceae (t(91.89) = 2.48, p = 0.015) | Acetobacteraceae (t(120.77) = −3.45, p = 0.001) | |
| Legionellaceae (t(132.55) = −2.28, p = 0.024) | ||
| Genus | Pseudomonas (t(130.47) = 2.31, p = 0.022) | Escherichia-Shigella (t(95.52) = −5.29, p = < 0.001) |
| Cutibacterium (t(92.62) = 4.66, p = < 0.001) | Sphingomonas (t(179) = −2.25, p = 0.026) | |
| Hyphomicrobium (t(126.76) = 2.35, p = 0.02) | Bdellovibrio (t(139.19) = −2.87, p = 0.005) | |
| Mycobacterium (t(105.44) = 3.65, p = < 0.001) | Flavobacterium (t(131.16) = −2.71, p = 0.008) | |
| Microbacterium (t(105.42) = 3.5, p = 0.001) | Legionella (t(132.46) = −2.25, p = 0.026) | |
| Pseudonocardia (t(91.79) = 2.43, p = 0.017) | Mesorhizobium (t(88.44) = −3.09, p = 0.003) | |
| Ochrobactrum (t(95.55) = 2.55, p = 0.013) | ||
| Acidovorax (t(95.7) = 3.67, p = < 0.001) | ||
| Shinella (t(145.01) = 2.46, p = 0.015) | ||
| Delftia (t(152.05) = 2.18, p = 0.031) | ||
| Amaricoccus (t(112.84) = 2.28, p = 0.024) | ||
| Ottowia (t(99.21) = 2.43, p = 0.017) | ||
| Species | Lactobacillus iners (t(92.48) = 2.61, p = 0.011) | |
| Microbacterium lacticum (t(91) = 2.48, p = 0.015) |
| V1–V2 | V3–V4 | |||
|---|---|---|---|---|
| ZBM n = 10 | PMP n = 10 | ZBM n = 10 | PMP n = 10 | |
| Richness | t(3.17) = −0.95, p = 0.408 | t(8) = −2.39, p = 0.044 | t(3.02) = −1.5, p = 0.229 | t(3.14) = −1.74, p = 0.177 |
| Shannon diversity | t(3.11) = −0.97, p = 0.402 | t(8)=−2.65, p = 0.029 | t(8) = −1.63, p = 0.142 | t(8) = −1.85, p = 0.101 |
| Simpson diversity | t(8) = −0.37, p = 0.719 | t(8) = −1.96, p = 0.086 | t(8) = −1.12, p = 0.297 | t(8) = −1.09, p = 0.308 |
| Fisher-alpha diversity | t(3.1) = −1.04, p = 0.373 | t(8) = −2.23, p = 0.056 | t(3.02) = −1.46, p = 0.24 | t(3.16) = −1.7, p = 0.183 |
Disclaimer/Publisher’s Note: The statements, opinions and data contained in all publications are solely those of the individual author(s) and contributor(s) and not of MDPI and/or the editor(s). MDPI and/or the editor(s) disclaim responsibility for any injury to people or property resulting from any ideas, methods, instructions or products referred to in the content. |
© 2023 by the authors. Licensee MDPI, Basel, Switzerland. This article is an open access article distributed under the terms and conditions of the Creative Commons Attribution (CC BY) license (https://creativecommons.org/licenses/by/4.0/).
Share and Cite
Neidhöfer, C.; Sib, E.; Benhsain, A.-H.; Mutschnik-Raab, C.; Schwabe, A.; Wollkopf, A.; Wetzig, N.; Sieber, M.A.; Thiele, R.; Döhla, M.; et al. Examining Different Analysis Protocols Targeting Hospital Sanitary Facility Microbiomes. Microorganisms 2023, 11, 185. https://doi.org/10.3390/microorganisms11010185
Neidhöfer C, Sib E, Benhsain A-H, Mutschnik-Raab C, Schwabe A, Wollkopf A, Wetzig N, Sieber MA, Thiele R, Döhla M, et al. Examining Different Analysis Protocols Targeting Hospital Sanitary Facility Microbiomes. Microorganisms. 2023; 11(1):185. https://doi.org/10.3390/microorganisms11010185
Chicago/Turabian StyleNeidhöfer, Claudio, Esther Sib, Al-Harith Benhsain, Christina Mutschnik-Raab, Anna Schwabe, Alexander Wollkopf, Nina Wetzig, Martin A. Sieber, Ralf Thiele, Manuel Döhla, and et al. 2023. "Examining Different Analysis Protocols Targeting Hospital Sanitary Facility Microbiomes" Microorganisms 11, no. 1: 185. https://doi.org/10.3390/microorganisms11010185